Submitted:
28 December 2024
Posted:
30 December 2024
You are already at the latest version
Abstract
Fullerenes, a unique allotrope of carbon, have captured significant attention in multiple scientific fields. As a non-destructive characterization technique, Raman spectroscopy has proven indispensable for investigating fullerenes and their derivatives, offering detailed insights into their vibrational properties. This review discusses the broad utility of Raman spectroscopy in revealing the structural and physicochemical characteristics of fullerenes—from the iconic C₆₀ molecule to an array of its derivatives—highlighting its capacity to detect functionalization-induced changes in molecular structure and electronic properties, while also assessing environmental influences such as solvent effects and temperature variations. Particular emphasis is placed on advanced Raman-based techniques, including enhanced Raman spectroscopy, surface-enhanced Raman spectroscopy (SERS), and tip-enhanced Raman spectroscopy (TERS), for the characterization of fullerenes and their derivatives. These cutting-edge methods offer high sensitivity and ultra-high spatial resolution, greatly expanding the scope of fullerene research and delivering deeper insights into their structural and functional properties.
Keywords:
fullerene
; fullerene derivatives
; Raman
; SERS
; TERS
Introduction
Since the discovery in 1985[1], fullerene, a carbon allotrope, has attracted considerable interest in the scientific community due to its stable chemical properties, distinctive physical characteristics (such as high electrical and thermal conductivity, along with excellent nonlinear optical properties), and environmental friendliness[2,3,4,5,6,7,8,9,10,11]. It has been widely applied in diverse fields including energy, superconductors, catalysis, mechanical engineering, life sciences, and material science[12,13,14,15,16,17,18,19]. The most notable fullerene is the C60 molecule, recognized for its hollow, cage-like structure made up of 12 pentagonal and 20 hexagonal carbon rings[20]. As research has progressed, fullerenes with varying carbon atom counts, from C20 to those with up to 300 carbon atoms, have been synthesized, greatly expanding the fullerene family[21,22,23,24]. These fullerene molecules exhibit diverse structural configurations and distinct physical and chemical properties, offering greater scope and flexibility for extensive applications. Recently, research has extended to fullerene derivatives, such as endohedral fullerenes, which contain metal atom clusters or molecules embedded within the fullerene structure. These derivatives exhibit unique electronic and magnetic properties, promising broad applications in fields like biomedicine, photo-induced electron transfer, and quantum computing[25,26,27,28,29,30]. Additionally, by modifying their surfaces with different functional groups, functionalized fullerenes can improve solubility, biocompatibility, and interactions with biological macromolecules, showing potential in biomedical applications such as drug delivery and photodynamic therapy[31,32,33,34,35,36]. Through chemical linking or "cage-opening" methods, fullerene molecules can form one-dimensional chains or two-dimensional layers with specific structures and functions, possessing unique topological and optoelectronic properties crucial for molecular electronics, machines, and low-dimensional devices [37,38,39,40,41,42].
As research progresses, fullerenes and their derivatives are playing increasingly important roles in various fields of study. However, the vast diversity and complexity of fullerenes and their derivatives necessitate advanced characterization techniques to understand their structures and properties. Raman spectroscopy is a non-destructive optical characterization technique which sensitively reflects the vibrational characteristics of molecular groups and subtle environmental influences by analyzing changes in vibrational modes, making it an ideal tool for studying fullerenes and their derivatives. The unique spherical structure of fullerene molecules is reflected in their characteristic Raman peaks, providing crucial information about their molecular structure. When organic functional groups are added, or molecules or atoms are embedded to create derivatives, significant changes occur in the molecular structure and properties, leading to the emergence of new characteristic peaks and shifts in the original Raman spectrum[43]. Raman spectroscopy can also analyze the charge transfer process between the fullerene cage and organic functional groups or embedded molecules[44].
With ongoing advancements in Raman spectroscopy, methods such as resonance Raman spectroscopy, surface-enhanced Raman spectroscopy (SERS), and tip-enhanced Raman spectroscopy (TERS) have increasingly improved the detection sensitivity of fullerene derivatives, even enabling single-molecule spectral resolution [45,46]. This enhanced sensitivity is crucial for the study of molecular adsorption characteristics, vibrational modes, interfacial behaviors, and fine structural details. Furthermore, TERS allows for the probing of optical and vibrational heating effects at the nanoscale. These advanced Raman-based approaches thus greatly expand the scope of fullerene research, providing deeper insights into their structures and dynamics.
In this review, we have summarized key studies on conventional and enhanced Raman spectroscopy in probing fullerenes and their derivatives, highlighting its advantages in characterizing molecular structures, evolution processes, and electron transfer properties.
Basic Raman Principles and Fullerene Resonant Modes
Raman spectroscopy, as an inelastic scattering technique, offers several notable advantages, including minimal sample consumption, high spatial resolution, rich informational output, non-destructive and contactless measurement, and straightforward, user-friendly instrumentation. These features make it a powerful tool for analyzing lattice vibrations and chemical bond dynamics. When materials are exposed to laser light, both elastic scattering—such as Rayleigh scattering, where the incident photon energy (ħωi) equals the scattered photon energy (ħωs)—and inelastic scattering—such as Raman scattering, where ħωi differs from ħωs—occur simultaneously. Raman scattering only occurs when the polarizability of the vibrating molecules or lattices changes during scattering. On the other hand, changes in the dipole moment of molecules during scattering correspond to infrared absorption or scattering process, making Raman spectroscopy a complementation of infrared spectroscopy. During Raman scattering, the energy difference between the incident and scattered photons corresponds to the energy of vibrational or rotational energy levels (or the phonon energy of lattice vibrations), denote it as ħω. Stokes scattering corresponds to the situation when ħωi - ħω = ħωs, while anti-Stokes scattering corresponds to the one when ħωi + ħω = ħωs. Raman peak positions act as a unique fingerprint spectrum for tach material, for the material has characteristic vibrational energy levels, thus own the unique group of ħω. Shifts in Raman peak positions indicate the changes in vibrational characteristics, which can further inform the alterations in molecular structure or electronic distribution. According to thermodynamic statistical laws, the distribution of electrons on energy levels follows the Boltzmann distribution, resulting in a relationship between Stokes and anti-Stokes scattering intensities as IS/IaS ~ exp(ħω/kT), making Raman scattering also utilized to measure sample temperature.
Fullerene materials, characterized by their three-dimensional structures composed of numerous carbon atoms, offer a wealth of Raman spectral information. C60 and C70 are two typical representatives of fullerenes. C60 is a molecular cage consisting of 60 carbon atoms, exhibiting Ih point group symmetry and featuring 10 Raman-active vibrational modes (2Ag + 8Hg)[47]. In contrast, C70 has an ellipsoidal molecular cage with D5h point group symmetry and possesses 53 Raman-active vibrational modes (12 + 22 + 19)[48]. Due to its lower molecular symmetry, C70 presents more intricate Raman information, posing challenges in capturing all Raman signals accurately during experiments. Table 1 lists all experimentally determined Raman peaks for C60 and some captured peaks for C70. In the presence of endohedral molecules or attached functional groups, the Raman peak positions of fullerene molecules would shift and broaden. These features are central to the Raman study of fullerene derivatives, which will be explored in more detail in the following sections.
Conventional Raman Spectroscopy Characterization
Since Raman spectroscopy fundamentally identifies the vibrational-rotational energy levels of molecules, its primary and most common application is in distinguishing and analyzing chemical bonds within materials. In the study of fullerene derivatives, Raman spectroscopy is particularly useful in the following ways: (1) Characterizing Intramolecular Properties: The spherical structure of fullerene molecules results in distinct Raman peaks, and shifts in these peak positions can indicate subtle structural changes. Various functional groups introduce specific vibrational modes in Raman spectra, serving as "fingerprints" for chemical modifications, thus aiding in the precise identification and analysis of the chemical structures of fullerene derivatives. This provides direct evidence for understanding the impact of derivatives. By examining the vibrational modes and their variations in Raman spectra, insights into the electronic structure and charge distribution of molecules can be gained, as well as the presence of charge transfer between functional groups. This is vital for comprehending the optoelectronic properties of fullerene derivatives, providing essential information on the intermolecular interactions of these derivatives. (2) Assessing Environmental Impact: Raman spectroscopy can evaluate how environmental factors affect fullerene derivatives.
By recording Raman spectra of molecules under varying solvent or temperature conditions, alterations in molecular vibrational modes can be observed, thus assessing the influence of environmental factors on molecular structure and properties. Interactions between derivatives and between derivatives and solid substrates can also be characterized. In this section, we will explore examples of conventional Raman spectroscopy applications in researching fullerene derivatives, focusing on the points mentioned above.
In 2011, D. -J. Chung et al. synthesized hydroxyl-functionalized fullerene (-OH) using γ-irradiation in a methanol/1,2-dichlorobenzene mixture solution[53]. The Raman features of this functionalized fullerene (F-fullerene) (Figure 1a) closely resembled those of the base fullerene, indicating that the fundamental structure was preserved. However, they noted shifts in peak positions from 1458 and 1590 cm⁻¹ in the original fullerene to 1462 and 1570 cm⁻¹, respectively, suggesting a slight distortion in the fullerene’s cage structure. Additionally, the disappearance of the fullerene D band and reduced intensity of the G band were attributed to the formation of a disordered sp² carbon structure. G. Rambabu and colleagues used a similar analytical approach for fullerene functionalized with sulfonic acid (-SO3H) groups[43]. They observed a 6 cm⁻¹ downshift in the pentagonal pinch mode Ag(2) (1464 cm⁻¹) upon functionalization(Figure 1b). Furthermore, broadening of Raman peaks in F-fullerene was noted and attributed to asymmetry introduced by surface functional groups. Recently, ethylenediamine functionalized fullerene (EDA@C60) was fabricated and characterized by S. S. Narwade, et al.[54]. They identified a distinct G band at 1588.02 cm⁻¹(Figure 1c), which attributed to the first-order scattering of the Eg(2) mode for sp² hybridization between carbon and nitrogen atoms, and a D band at 1344.71 cm⁻¹ due to sp³-hybridized carbon and its structural defects (reflecting the O-C60 band in this study). As functionalization progressed, they reported a D to G band intensity ratio (ID/IG) of 0.84, indicating the sensitive distribution of functional groups.
In the last century, Raman spectroscopy was already being used to characterize endohedral fullerenes with their structural and electric properties. M. Krause et al. embedded Thulium and Gadolinium into C82 molecular cages (Tm@C82 and Gd@C82, with Tm@C82 having three isomers A, B and C) using a modified Krätschmer arc burning method, and characterized them with Raman spectroscopy(Figure 2a)[55]. They observed a band bellowing 200 cm−1(117 cm−1 for the isomers A and B, and 116 cm−1 for C) attributed to vibration between metal and cage, and the significant difference in Raman spectra between three isomers at 1550 to 1650 cm-1. In the plot of the wave number of the metal cage Raman mode below 200 cm−1 versus the square root of the reciprocal metal mass, Gd@C82, La@C82 and Y@C82 were found on one straight line, while three Tm@C82 isomers lowered significantly (Figure 2b). This was explained by differences in attraction forces between the metal ion and the charged fullerene cage. They concluded that Gd@C82 correlates with trivalent ions as Gd3+@, similar to La3+ and Y3+ and rather than Gd2+@ to Tm2+. In the same year, they also identified the molecule Eu@C74 to be Eu2+@ from analyzing Raman data[56]. Similar methodology was also applied to endohedral fullerenes containing molecules such as La2@C80, Ti2@C80[44], Gd2@C79N[57], Sc3N@C80[58], Sc4N2@C60[29] and U2@Ih(7)-C80[59] et al.
Interactions with other molecules or substrates significantly impact the structural or electrical properties of fullerene derivatives. For instance, fullerene nanowhiskers showed an ~8 cm⁻¹ downshift(Figure 3a) in the pentagonal pinch mode compared to powders, attributed to C60 polymerization[60]. In fullerene-water solutions, shifts of up to 15 cm⁻¹(Figure 3b) were observed for C60 Raman active Ag and Hg bands, with additional vibrational bands at 1304 and 1637 cm⁻¹ connected to the colloidal state of C60[61]. The electron exchange behavior, typically seen in intermolecular interactions, can also be detected through Raman spectroscopy. S. Paul and colleagues mixed C60 into insulating poly-vinyl-phenol (PVP) polymer and built a simple metal–organic–metal (MOM) sandwich structure device(Figure 3c) to test its memory effect[62]. Raman spectroscopy confirmed C60 involvement in charge storage, showing a downward shift in the Ag(1) mode peak after a +2.5 V write step, indicating charge injection into C60 molecules, which returned to 1469 cm⁻¹ after a -2.5 V erase operation, signifying charge release(Figure 3d). Similar Raman techniques were used to analyze interactions between C60 and g-C3N4[63,64]. Slight shifts in Hg(7) and Hg(8) modes indicated a charge transfer, with the Ag(2) mode disappearing when physically mixed with g-C3N4(Figure 3e)[63], and significantly downshifting when covalently bonded(Figure 3f)[64]. Interactions with Layered double hydroxides (LDH)[65] resulted in electron transfer to C60 evidenced by upshifted Raman peaks(Figure 4a), which is benefit for improving material’s catalytic ability. After covalent bonding with graphene, the Ag(2) mode of C60 upshifted(Figure 4e) compared to pure molecules, indicating a strong interaction with graphene sheet[66]. However, when covalently attached to graphene nanoplatelet edges, the Ag(2) mode exhibited an 11 cm⁻¹ downshift(Figure 4f)[67]. Similarly, C60-embedded cobalt/nitrogen-codoped porous carbon materials (C60@Co-N-PCM) also showed a downshifted Ag(2) mode(Figure 4d), indicating the electron charge transfer to fullerene[68]. These experiments consistently highlight the charge transfer characterization capabilities of Raman spectroscopy in fullerene derivatives.
Resonance Raman Spectroscopy Characterization
Resonance Raman spectroscopy is a powerful analytical technique that capitalizes on the resonance phenomenon, which occurs when the frequency of the excitation light closely matches the energy levels of electronic transitions in a molecule. This resonance condition leads to a substantial enhancement of the Raman scattering signals for specific vibrational modes, thereby providing a more pronounced and selective insight into the molecular structure. Such selective enhancement is particularly beneficial for investigating the vibrational properties of fullerene derivatives, as it allows researchers to obtain detailed structural information about specific components of these complex molecules. In addition, resonance Raman spectroscopy allows for detection at lower concentrations of samples, which is especially valuable in biological and environmental contexts, where the presence of fullerene derivatives may be present in trace amounts. Despite the increased equipment requirements and operational complexity associated with resonance Raman spectroscopy compared to conventional ones, its superior selectivity and sensitivity render it an essential tool in studying intricate molecular systems like fullerene derivatives.
In 1991, M. Matus and colleagues conducted one of the first resonance Raman characterizations of a mixture containing 85% C60 and 15% C70 on a silicon substrate(Figure 5a)[69]. They obtained Raman spectra using various excitation lasers with energies ranging from 3.04 to 1.90 eV at temperatures between 10 K and 320 K. A notable resonance enhancement in the C60 pinch mode at 1468 cm⁻¹ was observed, with an enhancement factor of 100 between 2 eV and 2.6 eV. Comparing the resonance Raman peaks with theoretical predictions revealed two electronic transitions at 2.6 and 3.4 eV. They also noted a distinct inflection point(Figure 5b) in the temperature dependence of the Raman line position and width of the pinch mode, and attributed it to the phase transition. In the same year, L.D. Lamb et al. characterized C60 film on silicon surface and Solution of C60 in CS2 respectively using resonance Raman spectroscopy(Figure 5c)[70]. They analyzed excitation profiles (Raman intensity as a function of the laser photon energy) for Ag(2) mode, and observed a peak around 2.4 eV in C60 thin film, suggesting optical transitions occurring well below the minimum absorption level anticipated for isolated icosahedral molecules. Moreover, this transition was not observed for C60 in solution. They proposed that solid-state effects might lower C60 symmetry and thus permits HOMO to LUMO transitions(Figure 5d). W. Plank et al. used resonance Raman spectroscopy to analyze single bonds between two C60 or C59N molecules and their influence on the molecules(Figure 5e,f)[71]. They observed strong resonances with red lasers, indicating the decreased electron transition energy positions in (C59N)2 and (C60)2 compared to individual C60 molecules, which was further confirmed by a lowered absorption edge in absorption spectroscopy. This decrease was attributed to intermolecular electron interactions in the dimer which leads to an electronic energy level redistribution. Recently, F. Khorobrykh and coworkers observed similar phenomena, finding that varying the wavelength of exciting lasers could distinguish C60 clusters owning covalent bonds with different force constants [72]. In their works, higher force constant values corresponded to shorter-wavelength excitation needed for resonant Raman scattering observation.
M. L. McGlashen and colleagues used resonance Raman spectroscopy to characterize C60 monoanions in solution in 1993[73]. They prepared C60 solutions in a 70%/30% toluene/acetonitrile mix and generated C60 monoanions by electrolysis at -1.0 V. The pentagonal pinch mode was strongly enhanced and showed a 6 cm⁻¹ downshift compared to neutral molecules(Figure 6a). This is highly consistent with the shift in K doped film data, thus highly support the hypothesis of complete electron transfer from K to C60. S. H. Gallagher et al. achieved resonance with the C60 A1(0-1) transition using 406.67 nm laser, and attaining a higher hg band intensity in comparison to intensity excited with 413.10 nm laser, which resonant with A0(0-0) transition(Figure 6b)[74]. The intensity ratio of IA1/IA0, where IA1 and IA0 are the intensities of Hg band at 1421 cm-1 excited from resonances with the A1 and A0 electronic transitions, matched the calculated value for D-term scattering within experimental error. Given that D-term scattering is a type of non-adiabatic scattering, this suggests the significant non-adiabatic dynamic coupling between certain excited electronic states of the C60 molecule. In another research conducted by S. H. Gallagher et al., a resonance Raman peak at 281 cm⁻¹ also followed the 0-1 absorption envelope[75]. Surprisingly, the anti-Stokes side of this peak had greater intensity than the Stokes region under 413nm laser irradiation in benzene or toluene solvent(Figure 6c), despite thermal populations of the first vibrational excited state not exceeding 20%. Solvent-fullerene interactions were also observed by other teams with resonant Raman spectroscopy in the form of newly emerged and split Raman peaks due to the decreased molecular symmetry[76,77].
The structures of fullerene peapods, such as C60@single-walled carbon nanotubes (SWCNT), have become newly focused point in carbon nanomaterials research. L. Kavan et al. utilized the sensitivity of resonance Raman spectroscopy to structures to characterize changes of fullerene caused by the outside SWCNT and anode/cathode charging[78], found that the Ag(2) mode of C60 in fullerene peapods showed considerable intensity increase upon anodic doping(Figure 7a), which was not seen with cathodic charging. This differed from previously observed charging-induced peak shifts and was unique to fullerene peapods. They conducted follow-up experiments two years later, preparing another kind of fullerene peapods —C70@SWCNT, and characterizing it with resonance Raman spectroscopy[79]. Different from C60, C70@SWCNT shows symmetric quenching of the C70 Raman modes at both cathodic and anodic potentials(Figure 7b), indicating that the electronic structure of C70 owns differently respond to charging compared with C60. M. Kalbac et al. used laser with seven different excitation energies for resonance Raman spectroscopy measurements to study Ag(2) mode of C60 in SWCNT[80]. The Ag(2) mode intensity weakened only under 1.16 eV laser illumination, while increasing with other energies (2.70, 2.60, 2.54, 2.41, 2.33, 2.18 eV) (Figure 7c). An Ag(2) frequency upshift during anode charging was observed, similar to other charging experiments.
Fullerene modified with functional groups could also characterized with resonance Raman technique. M. Polomska and colleagues achieved resonance enhancement of low-frequency Hg modes of (Ph4P)2·C60·Y(Y = Cl, Br, I) using a 1064 nm laser, with modes broadened and down shifted due to electron–phonon interactions[81]. Resonance spectroscopy's high-resolution capability allowed deconvolution of the Hg band into five components which were attributed to decreased fullerene symmetry(Figure 8a,b). M. H. Herbst et al. employed resonance Raman spectroscopy to trace the formation of dimer and oligomer of platinum-fullerene compounds(PtnC60, where n=1 and 2)[82]. The simultaneous observation of symmetric and asymmetric fullerene vibration modes in the spectrum indicates the formation of dimers and oligomers, respectively. The doublet splitting of the F1u(2) and F1u(4) mode also signaled the formation of oligomer chain structure in these compounds.
Surface Enhanced Raman Spectroscopy Characterization
Surface-enhanced Raman spectroscopy (SERS) significantly amplifies the signal intensity by exciting Raman scattering of samples near metal surfaces like gold, silver, or copper, achieving detection limits at the single-molecule level and greatly expanding the application scope of Raman spectroscopy. Two main theories are widely accepted to explain this enhancement: localized surface plasmon resonance (LSPR) and charge transfer (CT).[83]. LSPR occurs when incident light hits particles much smaller than its wavelength. If the light frequency matches the electron oscillation frequency, LSPR is generated, creating an enhanced electric field near the particle surface, which amplifies Raman scattering of adsorbates within this field. Additionally, the CT process is believed to contribute to SERS through chemical enhancement theory. These mechanisms contribute together to the overall SERS signal, significantly increasing its intensity.
Early in 1991, R. L. Garrell and partners had used SERS to characterize the structure and surface interactions of C60 on gold surface[84]. Twenty-two distinct SRES bands were observed in the spectrum, far exceed the number of modes in conventional Raman(Figure 9a). The newly observed bands were attributed to metal-molecule vibrations and reduced symmetry due to metal surface interactions, supported by the lower shifts of major C60 bands in SERS compared to conventional Raman. S. J. Chase et al. characterized next year the Ag(2) band shift of C60 on different noble metal surfaces[85]. The largest shift of 28 cm-1 compared to pure C60 was observed for C60/Ag, followed by 23 cm-1 for C60/Cu, and the smallest of 15 cm-1 for C60/Au(Figure 9b). The increased value of shift follows the decrease in noble-metal work function, indicating a lowered degree of charge transfer from Ag to Au, which was further confirmed with the assistance of ultraviolet photoemission spectroscopy (UPS). L. Zhixun et al. observed single-molecule SERS(SM-SERS) behavior in sample of which ultralow concentration solutions (10-15 M) of pyridine/C60 was dropped on Au coated cover glass(Figure 9c)[45]. At this density, the statistical probability for an area of hot spot to hold a single C60 is less than one in a thousand. However, only around one tenth in the intensity was observed for SM-SERS comparing to the signal taken from the other sample with a 13 orders higher concentration (10-2 M). Several additional Raman bands were also observed and were attributed to the symmetry reduction and perturbation of electronic structure in the adsorbed single molecule. Upon serious observation of SM-SERS at different hot spot, some shown distinct band shifts, while the others have no change. Time-dependent spectral fluctuation of the SM-SERS taken at same hot spot also reflects changes in intensity and band positions(Figure 9e-g). These observations collectively reflect that the SM-SERS got a much larger enhancement factor at some specific position. The exact SM-SERS was confirmed by C. G. Artur et al. in 2012[46]. They differentiated SERS signals by using C60 molecules with different carbon isotopes(Figure 9d,h). By carefully screening the data and analyzing SERS spectra containing different numbers of molecules, the signal corresponding to single molecule was successfully extracted, and the intensity and frequency distribution were consistent with theoretical expectations, indicating that single molecule events were indeed observed. This provides clear evidence for SM-SERS detection of C60 molecules, demonstrating the universality and ability of SERS technology for single-molecule detection.
The enhancement of signal intensity in SERS makes it useful in characterizing interaction of fullerene with other molecules or functional groups. Y. Zhao and Y. Fang studied interactions between C60 and pyridine molecules, confirming weak physical interactions due to unchanged C60 structures from SERS spectroscopy comparing to the pure solid[86]. M. Baibarac et al. studied particular chemical interaction of the polyaniline/fullerene (PANI/C60) composite with N-methyl-2-pyrrolidinone (NMP) using SERS[87]. During the interaction, de-doping of PANI was observed, leading to the transformation of leucoemeraldine salt (LS) repeating units into leucoemeraldine base (LB). Additionally, a gradual increase in the intensity of the C60 Ag(2) pentagonal pinch mode was also observed, which indicates the formation of PANI-LB and charge transfer complex of the type [(H)+(NMP)+(C60)²⁻].N. Mojarad et al. used SERS to study the amorphization process of C60 molecules[88], as SERS is non-destructive and does not introduce external amorphization. All C60 resonances were suppressed under the electron irradiation with the appearence of G peak, which represents bond stretching of all pairs of sp2 hybridized atoms. The observation represents the C60 bonds cleavage and the formation of new structure. K. Yasuraoka and colleagues constructed a single-molecule junction by placing C60 molecule between Au electrodes(Figure 10)[89]. The SERS spectrum showed an enhanced observation opportunity under the highly conductive state, where molecular orbital and Au electronic state are intensely coupled, suggesting that high electron coupling states would benefit SERS observation.
Due to the diverse structures and types of fullerenes and derivatives, plenty of researches have conducted to detect new method of achieving SERS enhancement. L. Zhixun and F. Yan inserted the C60/C70 molecule into the gap between gold nano-particles and iron substrate using the pyridine as intermediate[50], and reached an enhancement factor is 106. The next year they achieved SERS enhancement by depositing gold/C60 (/C70) nano-clusters on the Anodic alumina oxide nano-sieves[90], as well as constructing a newly nonaqueous colloidal systems[91]. Three years later, L. Zhixun, Z. Yongsheng and coworkers fabricated high-density ordered arrays of core-shell nanopillars of Au@C60/C70 systems, in which an intense SERS signal with fluorescence-free background was achieved[92]. This was maintained even under 514 nm excitation, at which the normal Raman of C60/C70 present poor signal-to-noise. N. Zhiqiang et al. connected C60 molecules between silver nano-particles and silver film by using the pyridine as intermediate[93]. Several vibrational modes were greatly increased as well as showing significant band splitting and frequency shifting, meaning the existence of symmetry lowering and selection rule relaxing of C60 from asymmetrical environment. I. I. S. Lim et al. found out that when assembled with 1-(4-methyl)-piperazinyl fullerene(MPF), larger-scale Au nanoparticles (30 nm) produce much stronger SERS intensity than smaller ones (11 nm), indicating the significant influence of metal particle size on SERS enhancement [94]. Recently, N. Khinevich et al. achieved SERS enhancement of C60 using silvered porous silicon (Ag/PS) for the first time[95].
Tip Enhanced Raman Spectroscopy Characterization
Tip-enhanced Raman spectroscopy (TERS), a near-field spectroscopy that surpasses the optical diffraction limit, has shown unique advantages in characterizing single molecules in recent years. As an enhancement of SERS method, TERS focuses incident light onto a nanoscale metal tip (typically gold or silver) and utilizes the local surface plasmon resonance effect, resulting in a strong electromagnetic field enhancement that significantly boosts the detection sensitivity of Raman signals[96]. Charge transfer between the metal tip and sample also contributes to TERS signal enhancement. The enhancement effect enables TERS to detect the vibrational modes of individual molecules, providing extremely high resolution for studying molecular structure and chemical states. TERS technology holds great potential in researching fullerenes and their derivatives, offering extremely high spatial resolution beyond the optical diffraction limit and enhanced Raman vibrational mode detection ability, which allows for in-situ, dynamic, and quantitative analysis of fullerenes and their derivatives without damaging the sample. With utilizing TERS technology, researchers can analyze the molecular structure, chemical state, and interactions with the surrounding environment of fullerene derivatives in detail at the nanoscale. In this section, we will explore the application of TERS technology in fullerene derivative research in detail.
Early in 2000, R. M. Stöckle and coworkers had utilized TERS technology to characterize fullerene[97]. They drop-coated C60 molecules onto a glass substrate and scanned with homemade tips fabricated by electrochemical etching with thin Au wire. 488 nm wavelength laser was focused on the tip from below to excite the TERS. The C60 Raman signal was observed when gold tip close to the sample, with almost no signal detected without the tip. Considering the scale of the tip apex and laser beam diameter, the enhancement was estimated to be greater than 40000. Both shifted and unshifted Raman peaks were observed, and were attributed to be enhanced by electromagnetic and chemical effects, respectively. P. Verma et al. also achieved TERS enhancement of C60 using a silver-coated silicon tip and placed molecules on a silver film-covered glass cover slip[98]. All the Raman modes were enhanced in TERS signals comparing to the far-field spectrum. In their subsequent investigation of tip-force effect, the frequency shift observed when tip applied a certain extent of force (2.7nN to 4.7nN) to C60 was contrary to DFT calculations. This phenomenon was attributed to photopolymerization under high tip pressure and under light irradiation at the same time.
In recent years, numerous studies on TERS characterization of fullerene have been published, driven by advancements in TERS technology for analyzing single molecule. In 2022, B. Cirera and colleagues studied TERS intensities of a single C60 molecule in Scanning Tunneling Microscope (STM) system under tunneling regime and molecular point contact (MPC) situations, respectively(Figure 11a)[99]. They adsorbed C60 onto the Ag tip and observed TERS signals as the distance between the molecule and Ag(111) surface varied. When the molecule contacted the metal surface, characteristic TERS intensity enhancement was observed, enabling the observation of modes undetectable in the tunneling regime(Figure 11b). A red shift in most C60 modes compared to solid-state values was also noted. These effects were observed on other metal surfaces like Au(111), Cu(111), and Pt(111), confirming their universality. The additional enhancement in MPC situation was attributed to the chemical effects rather than electromagnetic enhancement, which was caused by charge transfer in the single molecule junction. B. Cirera et al. conducted a similar MPC experiment to study vibrational heating effect by observing the anti-Stokes lines of C60 Raman modes[100]. They identified optical heating as the main mechanism in the tunneling regime(Figure 11c), while Joule heating dominated in MPC through inelastic electron-vibration scattering (IEVS) (Figure 11d). The influence of the electronic structure of the electrode to vibrational heating was also examined on different metal surfaces. The heating efficiency showed asymmetry in opposite bias polarity for Au(111) and Cu(111) surfaces, and became lower when C60 was in point contact with Pt(111) surface than other noble metals, although Pt exhibited the largest conductance. Q. Meng et al. invested local thermal effect of C60 single molecule via anti-Stokes TERS technology[101]. They studied the heating phenomenon with the defined effective temperature (Teff ~ IS/IaS) as the tunneling current increased and observed the molecule decomposition at around 1150K(Figure 11e,f). The research demonstrated the ability of TERS to noninvasively detect local heating effects in a single molecule under nonequilibrium conditions and to identify the possible reaction pathway and product through spectrum sensitivity to molecule structures, which was also applicable to other fullerene derivatives. B. Cirera et al. achieved TERS enhancement with a factor of ~10¹² for a C60 single molecule even on a Si(111)-(7×7) semiconductor surface, and observed additional Raman signal enhancement in MPC condition[102]. This indicates TERS's applicability for characterizing organic molecules on semiconductor surfaces, with potential applications for single-molecule Raman studies of vibrational heating and dissipation in metal-molecule-semiconductor nano-heterojunctions.
Conclusions and Perspectives
To date, Raman spectroscopy have provided distinct vibrational signatures that offer valuable insights into the molecular structure and electronic characteristics of fullerenes and their derivatives. Beyond structural elucidation, Raman spectroscopy also enables the investigation of fullerene–molecule interactions and environmental influences. By monitoring shifts in Raman peaks under various conditions, scientists can quantify the impact of solvents, temperature, and other external factors on the structural integrity and properties of fullerenes. Furthermore, advanced techniques such as Resonance Raman Spectroscopy and SERS have significantly broadened the scope of fullerene research. Resonance Raman Spectroscopy enhances specific vibrational modes via resonance effects, while SERS facilitates single-molecule detection, thus providing deeper insights into fullerene structures and dynamics. TERS further pushes the frontier by enabling in situ analyses of fullerene derivatives under single-molecule conditions, delivering nanoscale spatial resolution and ultra-high detection sensitivity. Notably, TERS is also capable of detecting the optical and vibrational heating effects in individual molecule, as well as observing the thermal decomposition of molecule during the heating process.
Raman spectroscopy and its enhanced versions have already made significant progress in the study of fullerenes and their derivatives. In the following, we attempt to provide some possible future directions to further expand the application of Raman spectroscopy in this field:
1. Combining Raman Spectroscopy with Artificial Intelligence (AI)
The Raman spectra of fullerenes and their derivatives are relatively complex, and the orientation effects between the molecules and the SERS substrate further increase this complexity[103]. Machine learning is particularly well-suited for analyzing these intricate spectra, allowing for the extraction of key signals, identification of weak features, and elimination of unnecessary noise. Additionally, AI can be utilized to optimize substrates and optical pathways, potentially enhancing the SERS detection efficiency of fullerene materials[104,105]. Developing machine learning algorithms and big data analytics to establish a comprehensive theoretical and experimental fullerene database will accelerate our understanding of fullerene systems and facilitate the discovery of new fullerene materials.
2. Further Improving the Resolution of TERS
TERS offers ultra-precise molecular characterization. Currently, angstrom-scale spatial resolution has been achieved with TERS on planar molecules such as tetraphenyl porphyrin (TPP)[106,107]. However, TERS studies on fullerene materials are primarily limited to C₆₀, and the characterization of other fullerene derivatives remains relatively scarce. Achieving similar resolution for spherical fullerene structures presents additional challenges. Nevertheless, with ongoing advancements in TERS technology, attaining angstrom-scale spatial resolution for fullerene materials is likely within reach. Further improvements in the spatial resolution of TERS will enable the acquisition of more detailed structural and property information about fullerenes and their derivatives.
3. Combining Raman Spectroscopy with Time-Resolved Techniques
As femtosecond laser technology and ultrafast spectroscopic methods continue to mature, time-resolved Raman spectroscopy has been successfully applied to study ultrafast processes in various materials[108]. Examples include the ultrafast structural dynamics of photoreceptor proteins[109], the formation of polaron pairs and electron polarons in polymer photocatalysts[110], and the time dynamics of optical phonon anharmonic coupling and electron-phonon interactions in graphite[111,112]. Applying this technology to fullerene materials will enable real-time characterization of structural and property changes in fullerene molecules and their derivatives during dynamic processes such as electrochemistry, catalysis, thermal decomposition, and light-induced transformations. This will provide essential data for advancing the preparation and application of fullerene-related materials.
Author Contributions
Conceptualization, Jilian Xu, Hai Xu; writing—original draft preparation, Yifan Qin,; writing—review and editing, Jilian Xu; Modified and revised the review, Da zhan, Zhewen Liang, Haijun Teng; funding acquisition, Da zhan, Hai Xu. All authors have read and agreed to the published version of the manuscript.
Funding
This research was funded by the National Natural Science Foundation of China (Grant numbers: 11727902, 12174385, 12334014, 12074372) and the 100 Talents Program of the Chinese Academy of Sciences.
Conflicts of Interest
The authors declare no conflicts of interest.
References
- Kroto, H.W.; Heath, J.R.; O’Brien, S.C.; Curl, R.F.; Smalley, R.E. C60: Buckminsterfullerene. Nature 1985, 318, 162–163. [Google Scholar] [CrossRef]
- Olson, J.R.; Topp, K.A.; Pohl, R.O. Specific Heat and Thermal Conductivity of Solid Fullerenes. Science 1993, 259, 1145–1148. [Google Scholar] [CrossRef] [PubMed]
- Cheng, X.; Yokozeki, T.; Yamamoto, M.; Wang, H.; Wu, L.; Koyanagi, J.; Sun, Q. The decoupling electrical and thermal conductivity of fullerene/polyaniline hybrids reinforced polymer composites. Composites Science and Technology 2017, 144, 160–168. [Google Scholar] [CrossRef]
- Rustagi, K.C.; Nair, S.V.; Ramaniah, L.M. Nonlinear optical response of fullerenes. Progress in Crystal Growth and Characterization of Materials 1997, 34, 81–93. [Google Scholar] [CrossRef]
- Talapatra, G.B.; Manickam, N.; Samoc, M.; Orczyk, M.E.; Karna, S.P.; Prasad, P.N. Nonlinear optical properties of the fullerene (C60) molecule: theoretical and experimental studies. The Journal of Physical Chemistry 1992, 96, 5206–5208. [Google Scholar] [CrossRef]
- Billups, W.E.; Ciufolini, M.A. Buckminsterfullerenes; Wiley: New York, 1993. [Google Scholar]
- Koruga, D.; Hameroff, S.; J. W.; R., L.; Sundareshan, M. Fullerene C60: History, Physics, Nanobiology, Nanotechnology; Elsevier Science Ltd: North-Holland, 1993. [Google Scholar]
- Ehrenreich, H.; Spaepen, F. Solid State Physics; Academic: San Diego, 1994; Vol. 48. [Google Scholar]
- Braun, T.; Schubert, A.; Maczelka, H.; Vasvári, L. Fullerene Research 1985-1993; World Scientific: Singapore, 1995; Vol. 3. [Google Scholar]
- Dresselhaus, M.S.; Dresselhaus, G.; Eklund, P.C. Science of Fullerenes and Carbon Nanotubes; Academic: San Diego, 1996. [Google Scholar]
- Kroto, H.W.; Walton, D.R.M. The Fullerenes: New Horizons for the Chemistry, Physics and Astrophysics of Carbon; Cambridge University Press: Cambridge, 1993. [Google Scholar]
- Jiang, Z.; Zhao, Y.; Lu, X.; Xie, J. Fullerenes for rechargeable battery applications: Recent developments and future perspectives. Journal of Energy Chemistry 2021, 55, 70–79. [Google Scholar] [CrossRef]
- Varma, C.M.; Zaanen, J.; Raghavachari, K. Superconductivity in the Fullerenes. Science 1991, 254, 989–992. [Google Scholar] [CrossRef] [PubMed]
- Guo, K.; Li, N.; Bao, L.; Lu, X. Fullerenes and derivatives as electrocatalysts: Promises and challenges. Green Energy & Environment 2024, 9, 7–27. [Google Scholar] [CrossRef]
- Pan, Y.; Liu, X.; Zhang, W.; Liu, Z.; Zeng, G.; Shao, B.; Liang, Q.; He, Q.; Yuan, X.; Huang, D.; Chen, M. Advances in photocatalysis based on fullerene C60 and its derivatives: Properties, mechanism, synthesis, and applications. Applied Catalysis B: Environmental 2020, 265, 118579. [Google Scholar] [CrossRef]
- Ghavanloo, E.; Rafii-Tabar, H.; Kausar, A.; Giannopoulos, G.I.; Fazelzadeh, S.A. Experimental and computational physics of fullerenes and their nanocomposites: Synthesis, thermo-mechanical characteristics and nanomedicine applications. Physics Reports 2023, 996, 1–116. [Google Scholar] [CrossRef]
- Castro, E.; Garcia, A.H.; Zavala, G.; Echegoyen, L. Fullerenes in biology and medicine. Journal of Materials Chemistry B 2017, 5, 6523–6535. [Google Scholar] [CrossRef] [PubMed]
- Pesado-Gómez, C.; Serrano-García, J.S.; Amaya-Flórez, A.; Pesado-Gómez, G.; Soto-Contreras, A.; Morales-Morales, D.; Colorado-Peralta, R. Fullerenes: Historical background, novel biological activities versus possible health risks. Coordination Chemistry Reviews 2024, 501, 215550. [Google Scholar] [CrossRef]
- Prato, M. [60]Fullerene chemistry for materials science applications. Journal of Materials Chemistry 1997, 7, 1097–1109. [Google Scholar] [CrossRef]
- Haddon, R.C.; Brus, L.E.; Raghavachari, K. Electronic structure and bonding in icosahedral C60. Chemical Physics Letters 1986, 125, 459–464. [Google Scholar] [CrossRef]
- Xie, S.-Y.; Gao, F.; Lu, X.; Huang, R.-B.; Wang, C.-R.; Zhang, X.; Liu, M.-L.; Deng, S.-L.; Zheng, L.-S. Capturing the Labile Fullerene[50] as C50Cl10. Science 2004, 304, 699–699. [Google Scholar] [CrossRef]
- Shinohara, H.; Sato, H.; Saito, Y.; Takayama, M.; Izuoka, A.; Sugawara, T. Formation and extraction of very large all-carbon fullerenes. The Journal of Physical Chemistry 1991, 95, 8449–8451. [Google Scholar] [CrossRef]
- Prinzbach, H.; Weiler, A.; Landenberger, P.; Wahl, F.; Wörth, J.; Scott, L.T.; Gelmont, M.; Olevano, D.; v. Issendorff, B. Gas-phase production and photoelectron spectroscopy of the smallest fullerene, C20. Nature 2000, 407, 60–63. [Google Scholar] [CrossRef]
- Parker, D.H.; Wurz, P.; Chatterjee, K.; Lykke, K.R.; Hunt, J.E.; Pellin, M.J.; Hemminger, J.C.; Gruen, D.M.; Stock, L.M. High-yield synthesis, separation, and mass-spectrometric characterization of fullerenes C60 to C266. Journal of the American Chemical Society 1991, 113, 7499–7503. [Google Scholar] [CrossRef]
- Johnson, R.D.; de Vries, M.S.; Salem, J.; Bethune, D.S.; Yannoni, C.S. Electron paramagnetic resonance studies of lanthanum-containing C82. Nature 1992, 355, 239–240. [Google Scholar] [CrossRef]
- Stevenson, S.; Burbank, P.; Harich, K.; Sun, Z.; Dorn, H.C.; van Loosdrecht, P.H.M.; deVries, M.S.; Salem, J.R.; Kiang, C.H.; Johnson, R.D.; Bethune, D.S. La2@C72: Metal-Mediated Stabilization of a Carbon Cage. J Phys Chem A 1998, 102, 2833–2837. [Google Scholar] [CrossRef]
- Stevenson, S.; Rice, G.; Glass, T.; Harich, K.; Cromer, F.; Jordan, M.R.; Craft, J.; Hadju, E.; Bible, R.; Olmstead, M.M.; Maitra, K.; Fisher, A.J.; Balch, A.L.; Dorn, H.C. Small-bandgap endohedral metallofullerenes in high yield and purity. Nature 1999, 401, 55–57. [Google Scholar] [CrossRef]
- Korona, T.; Hesselmann, A.; Dodziuk, H. Symmetry-Adapted Perturbation Theory Applied to Endohedral Fullerene Complexes: A Stability Study of H2@C60 and 2H2@C60. Journal of Chemical Theory and Computation 2009, 5, 1585–1596. [Google Scholar] [CrossRef] [PubMed]
- Wang, T.-S.; Chen, N.; Xiang, J.-F.; Li, B.; Wu, J.-Y.; Xu, W.; Jiang, L.; Tan, K.; Shu, C.-Y.; Lu, X.; Wang, C.-R. Russian-Doll-Type Metal Carbide Endofullerene: Synthesis, Isolation, and Characterization of Sc4C2@C80. Journal of the American Chemical Society 2009, 131, 16646–16647. [Google Scholar] [CrossRef]
- Kurotobi, K.; Murata, Y. A Single Molecule of Water Encapsulated in Fullerene C60. Science 2011, 333, 613–616. [Google Scholar] [CrossRef]
- Brettreich, M.; Hirsch, A. A highly water-soluble dendro[60]fullerene. Tetrahedron Letters 1998, 39, 2731–2734. [Google Scholar] [CrossRef]
- Da Ros, T.; Prato, M. Medicinal chemistry with fullerenes and fullerene derivatives. Chemical Communications 1999, (8), 663–669. [Google Scholar] [CrossRef]
- Zakharian, T.Y.; Seryshev, A.; Sitharaman, B.; Gilbert, B.E.; Knight, V.; Wilson, L.J. A Fullerene−Paclitaxel Chemotherapeutic: Synthesis, Characterization, and Study of Biological Activity in Tissue Culture. Journal of the American Chemical Society 2005, 127, 12508–12509. [Google Scholar] [CrossRef]
- Sitharaman, B.; Zakharian, T.Y.; Saraf, A.; Misra, P.; Ashcroft, J.; Pan, S.; Pham, Q.P.; Mikos, A.G.; Wilson, L.J.; Engler, D.A. Water-Soluble Fullerene (C60) Derivatives as Nonviral Gene-Delivery Vectors. Molecular Pharmaceutics 2008, 5, 567–578. [Google Scholar] [CrossRef] [PubMed]
- Yin, J.-J.; Lao, F.; Fu, P.P.; Wamer, W.G.; Zhao, Y.; Wang, P.C.; Qiu, Y.; Sun, B.; Xing, G.; Dong, J.; Liang, X.-J.; Chen, C. The scavenging of reactive oxygen species and the potential for cell protection by functionalized fullerene materials. Biomaterials 2009, 30, 611–621. [Google Scholar] [CrossRef]
- del Carmen Gimenez-Lopez, M.; Räisänen, M.T.; Chamberlain, T.W.; Weber, U.; Lebedeva, M.; Rance, G.A.; Briggs, G.A.D.; Pettifor, D.; Burlakov, V.; Buck, M.; Khlobystov, A.N. Functionalized Fullerenes in Self-Assembled Monolayers. Langmuir 2011, 27, 10977–10985. [Google Scholar] [CrossRef] [PubMed]
- Núñez-Regueiro, M.; Marques, L.; Hodeau, J.L.; Béthoux, O.; Perroux, M. Polymerized Fullerite Structures. Physical Review Letters 1995, 74, 278–281. [Google Scholar] [CrossRef] [PubMed]
- Rao, A.M.; Eklund, P.C.; Hodeau, J.L.; Marques, L.; Nunez-Regueiro, M. Infrared and Raman studies of pressure-polymerized C60. Phys Rev B 1997, 55, 4766–4773. [Google Scholar] [CrossRef]
- Konarev, D.V.; Khasanov, S.S.; Saito, G.; Otsuka, A.; Yoshida, Y.; Lyubovskaya, R.N. Formation of Single-Bonded (C60-)2 and (C70-)2 Dimers in Crystalline Ionic Complexes of Fullerenes. Journal of the American Chemical Society 2003, 125, 10074–10083. [Google Scholar] [CrossRef] [PubMed]
- Takashima, A.; Onoe, J.; Nishii, T. In situ infrared spectroscopic and density-functional studies of the cross-linked structure of one-dimensional C60 polymer. Journal of Applied Physics 2010, 108, 033514. [Google Scholar] [CrossRef]
- Hou, L.; Cui, X.; Guan, B.; Wang, S.; Li, R.; Liu, Y.; Zhu, D.; Zheng, J. Synthesis of a monolayer fullerene network. Nature 2022, 606, 507–510. [Google Scholar] [CrossRef]
- Hashikawa, Y.; Okamoto, S.; Murata, Y. Synthesis of inter-[60]fullerene conjugates with inherent chirality. Nature Communications 2024, 15, 514. [Google Scholar] [CrossRef]
- Rambabu, G.; Nagaraju, N.; Bhat, S.D. Functionalized fullerene embedded in Nafion matrix: A modified composite membrane electrolyte for direct methanol fuel cells. Chemical Engineering Journal 2016, 306, 43–52. [Google Scholar] [CrossRef]
- Jaffiol, R.; Débarre, A.; Julien, C.; Nutarelli, D.; Tchénio, P.; Taninaka, A.; Cao, B.; Okazaki, T.; Shinohara, H. Raman spectroscopy of La2@C80 and Ti2@C80 dimetallofullerenes. Phys Rev B 2003, 68, 014105. [Google Scholar] [CrossRef]
- Luo, Z.; Loo, B.H.; Peng, A.; Ma, Y.; Fu, H.; Yao, J. Single-molecule surface-enhanced Raman scattering of fullerene C60. Journal of Raman Spectroscopy 2011, 42, 319–323. [Google Scholar] [CrossRef]
- Artur, C.G.; Miller, R.; Meyer, M.; Ru, E.C.L.; Etchegoin, P.G. Single-molecule SERS detection of C60. Physical Chemistry Chemical Physics 2012, 14, 3219–3225. [Google Scholar] [CrossRef]
- Meilunas, R.; Chang, R.P.H.; Liu, S.; Jensen, M.; Kappes, M.M. Infrared and Raman spectra of C60 and C70 solid films at room temperature. Journal of Applied Physics 1991, 70, 5128–5130. [Google Scholar] [CrossRef]
- Sun, G.; Kertesz, M. Vibrational Raman Spectra of C70 and C706- Studied by Density Functional Theory. J Phys Chem A 2002, 106, 6381–6386. [Google Scholar] [CrossRef]
- Schettino, V.; Pagliai, M.; Ciabini, L.; Cardini, G. The Vibrational Spectrum of Fullerene C60. J Phys Chem A 2001, 105, 11192–11196. [Google Scholar] [CrossRef]
- Zhixun, L.; Yan, F. SERS of gold/C60 (/C70) nano-clusters deposited on iron surface. Vibrational Spectroscopy 2005, 39, 151–156. [Google Scholar] [CrossRef]
- Bethune, D.S.; Meijer, G.; Tang, W.C.; Rosen, H.J.; Golden, W.G.; Seki, H.; Brown, C.A.; de Vries, M.S. Vibrational Raman and infrared spectra of chromatographically separated C60 and C70 fullerene clusters. Chemical Physics Letters 1991, 179, 181–186. [Google Scholar] [CrossRef]
- Jishi, R.A.; Dresselhaus, M.S.; Dresselhaus, G.; Wang, K.-A.; Zhou, P.; Rao, A.M.; Eklund, P.C. Vibrational mode frequencies in C70. Chemical Physics Letters 1993, 206, 187–192. [Google Scholar] [CrossRef]
- Chung, D.-J.; Seong, M.-K.; Choi, S.-H. Radiolytic synthesis of —OH group functionalized fullerene structures and their biosensor application. Journal of Applied Polymer Science 2011, 122, 1785–1791. [Google Scholar] [CrossRef]
- Narwade, S.S.; Mali, S.M.; Tanwade, P.D.; Chavan, P.P.; Munde, A.V.; Sathe, B.R. Highly efficient metal-free ethylenediamine-functionalized fullerene (EDA@C60) electrocatalytic system for enhanced hydrogen generation from hydrazine hydrate. New Journal of Chemistry 2022, 46, 14004–14009. [Google Scholar] [CrossRef]
- Krause, M.; Kuran, P.; Kirbach, U.; Dunsch, L. Raman and infrared spectra of Tm@C82 and Gd@C82. Carbon 1999, 37, 113–115. [Google Scholar] [CrossRef]
- Kuran, P.; Krause, M.; Bartl, A.; Dunsch, L. Preparation, isolation and characterisation of Eu@C74: the first isolated europium endohedral fullerene. Chemical Physics Letters 1998, 292, 580–586. [Google Scholar] [CrossRef]
- Fu, W.; Zhang, J.; Fuhrer, T.; Champion, H.; Furukawa, K.; Kato, T.; Mahaney, J.E.; Burke, B.G.; Williams, K.A.; Walker, K.; Dixon, C.; Ge, J.; Shu, C.; Harich, K.; Dorn, H.C. Gd2@C79N: Isolation, Characterization, and Monoadduct Formation of a Very Stable Heterofullerene with a Magnetic Spin State of S = 15/2. Journal of the American Chemical Society 2011, 133, 9741–9750. [Google Scholar] [CrossRef]
- Krause, M.; Kuzmany, H.; Georgi, P.; Dunsch, L.; Vietze, K.; Seifert, G. Structure and stability of endohedral fullerene Sc3N@C80: A Raman, infrared, and theoretical analysis. J Chem Phys 2001, 115, 6596–6605. [Google Scholar] [CrossRef]
- Zhang, X.; Wang, Y.; Morales-Martínez, R.; Zhong, J.; de Graaf, C.; Rodríguez-Fortea, A.; Poblet, J.M.; Echegoyen, L.; Feng, L.; Chen, N. U2@Ih(7)-C80: Crystallographic Characterization of a Long-Sought Dimetallic Actinide Endohedral Fullerene. Journal of the American Chemical Society 2018, 140, 3907–3915. [Google Scholar] [CrossRef] [PubMed]
- Sathish, M.; Miyazawa, K.I. Synthesis and Characterization of Fullerene Nanowhiskers by Liquid-Liquid Interfacial Precipitation: Influence of C60 Solubility. Molecules 2012, 17, 3858–3865. [Google Scholar] [CrossRef]
- Scharff, P.; Risch, K.; Carta-Abelmann, L.; Dmytruk, I.M.; Bilyi, M.M.; Golub, O.A.; Khavryuchenko, A.V.; Buzaneva, E.V.; Aksenov, V.L.; Avdeev, M.V.; Prylutskyy, Y.I.; Durov, S.S. Structure of C60 fullerene in water: spectroscopic data. Carbon 2004, 42, 1203–1206. [Google Scholar] [CrossRef]
- Paul, S.; Kanwal, A.; Chhowalla, M. Memory effect in thin films of insulating polymer and C60 nanocomposites. Nanotechnology 2006, 17, 145. [Google Scholar] [CrossRef]
- Bai, X.; Wang, L.; Wang, Y.; Yao, W.; Zhu, Y. Enhanced oxidation ability of g-C3N4 photocatalyst via C60 modification. Applied Catalysis B: Environmental 2014, 152-153, 262–270. [Google Scholar] [CrossRef]
- Chen, X.; Chen, H.; Guan, J.; Zhen, J.; Sun, Z.; Du, P.; Lu, Y.; Yang, S. A facile mechanochemical route to a covalently bonded graphitic carbon nitride (g-C3N4) and fullerene hybrid toward enhanced visible light photocatalytic hydrogen production. Nanoscale 2017, 9, 5615–5623. [Google Scholar] [CrossRef]
- Zhu, Y.; Laipan, M.; Zhu, R.; Xu, T.; Liu, J.; Zhu, J.; Xi, Y.; Zhu, G.; He, H. Enhanced photocatalytic activity of Zn/Ti-LDH via hybridizing with C60. Molecular Catalysis 2017, 427, 54–61. [Google Scholar] [CrossRef]
- Yu, D.; Park, K.; Durstock, M.; Dai, L. Fullerene-Grafted Graphene for Efficient Bulk Heterojunction Polymer Photovoltaic Devices. J Phys Chem Lett 2011, 2, 1113–1118. [Google Scholar] [CrossRef]
- Guan, J.; Chen, X.; Wei, T.; Liu, F.; Wang, S.; Yang, Q.; Lu, Y.; Yang, S. Directly bonded hybrid of graphene nanoplatelets and fullerene: facile solid-state mechanochemical synthesis and application as carbon-based electrocatalyst for oxygen reduction reaction. J Mater Chem A 2015, 3, 4139–4146. [Google Scholar] [CrossRef]
- Wu, J.; Wang, S.; Lei, Z.; Guan, R.; Chen, M.; Du, P.; Lu, Y.; Cao, R.; Yang, S. Pomegranate-like C60@cobalt/nitrogen-codoped porous carbon for high-performance oxygen reduction reaction and lithium-sulfur battery. Nano Research 2021, 14, 2596–2605. [Google Scholar] [CrossRef]
- Matus, M.; Kuzmany, H.; Krätschmer, W. Resonance Raman scattering and electronic transitions in C60. Solid State Commun 1991, 80, 839–842. [Google Scholar] [CrossRef]
- Sinha, K.; Menéndez, J.; Hanson, R.C.; Adams, G.B.; Page, J.B.; Sankey, O.F.; Lamb, L.D.; Huffman, D.R. Evidence for solid-state effects in the electronic structure of C60 films: a resonance-Raman study. Chemical Physics Letters 1991, 186, 287–290. [Google Scholar] [CrossRef]
- Plank, W.; Pichler, T.; Kuzmany, H.; Dubay, O.; Tagmatarchis, N.; Prassides, K. Resonance Raman excitation and electronic structure of the single bonded dimers (C ¯60)2 and (C 59N)2. The European Physical Journal B - Condensed Matter and Complex Systems 2000, 17, 33–42. [Google Scholar] [CrossRef]
- Khorobrykh, F.; Kulnitskiy, B.; Churkin, V.; Skryleva, E.; Parkhomenko, Y.; Zholudev, S.; Blank, V.; Popov, M. The effect of C60 fullerene polymerization processes on the mechanical properties of clusters forming ultrahard structures of 3D C60 polymers. Diamond and Related Materials 2022, 124, 108911. [Google Scholar] [CrossRef]
- McGlashen, M.L.; Blackwood, M.E., Jr.; Spiro, T.G. Resonance Raman spectroelectrochemistry of the fullerene C60 radical anion. Journal of the American Chemical Society 1993, 115, 2074–2075. [Google Scholar] [CrossRef]
- Gallagher, S.H.; Armstrong, R.S.; Lay, P.A.; Reed, C.A. D-term scattering in the resonance Raman spectrum of C60. Journal of the American Chemical Society 1994, 116, 12091–12092. [Google Scholar] [CrossRef]
- Gallagher, S.H.; Thompson, K.C.; Armstrong, R.S.; Lay, P.A. The Unusual Intensity Behavior of the 281-cm-1 Resonance Raman Band of C60: A Complex Tale of Vibronic Coupling, Symmetry Reduction, Solvatochromism, and Jahn−Teller Activity. J Phys Chem A 2004, 108, 5564–5572. [Google Scholar] [CrossRef]
- Gallagher, S.H.; Armstrong, R.S.; Lay, P.A.; Reed, C.A. Solvent/C60 interactions evidenced in the resonance Raman spectrum of C60. Chemical Physics Letters 1996, 248, 353–360. [Google Scholar] [CrossRef]
- Gallagher, S.H.; Armstrong, R.S.; Clucas, W.A.; Lay, P.A.; Reed, C.A. Resonance Raman Scattering from Solutions of C60. J Phys Chem A 1997, 101, 2960–2968. [Google Scholar] [CrossRef]
- Kavan, L.; Dunsch, L.; Kataura, H. In situ Vis–NIR and Raman spectroelectrochemistry at fullerene peapods. Chemical Physics Letters 2002, 361, 79–85. [Google Scholar] [CrossRef]
- Kavan, L.; Dunsch, L.; Kataura, H. Electrochemical tuning of electronic structure of carbon nanotubes and fullerene peapods. Carbon 2004, 42, 1011–1019. [Google Scholar] [CrossRef]
- Kalbac, M.; Zólyomi, V.; Rusznyák, Á.; Koltai, J.; Kürti, J.; Kavan, L. An Anomalous Enhancement of the Ag(2) Mode in the Resonance Raman Spectra of C60 Embedded in Single-Walled Carbon Nanotubes during Anodic Charging. The Journal of Physical Chemistry C 2010, 114, 2505–2511. [Google Scholar] [CrossRef]
- Polomska, M.; Sauvajol, J.L.; Graja, A.; Girard, A. Resonant Raman scattering from single crystals (Ph4P)2·C60·Y, where Y=Cl, Br, I. Solid State Commun 1999, 111, 107–112. [Google Scholar] [CrossRef]
- Herbst, M.H.; Pinhal, N.M.; Demétrio, F.A.T.; Dias, G.H.M.; Vugman, N.V. Solid-state structural studies on amorphous platinum–fullerene[60] compounds [PtnC60] (n=1,2). Journal of Non-Crystalline Solids 2000, 272, 127–130. [Google Scholar] [CrossRef]
- Han, X.X.; Rodriguez, R.S.; Haynes, C.L.; Ozaki, Y.; Zhao, B. Surface-enhanced Raman spectroscopy. Nature Reviews Methods Primers 2022, 1, 87. [Google Scholar] [CrossRef]
- Garrell, R.L.; Herne, T.M.; Szafranski, C.A.; Diederich, F.; Ettl, F.; Whetten, R.L. Surface-enhanced Raman spectroscopy of C60 on gold: evidence for symmetry reduction and perturbation of electronic structure in the adsorbed molecule. Journal of the American Chemical Society 1991, 113, 6302–6303. [Google Scholar] [CrossRef]
- Chase, S.J.; Bacsa, W.S.; Mitch, M.G.; Pilione, L.J.; Lannin, J.S. Surface-enhanced Raman scattering and photoemission of C60 on noble-metal surfaces. Phys Rev B 1992, 46, 7873–7877. [Google Scholar] [CrossRef] [PubMed]
- Zhao, Y.; Fang, Y. Fluorescence of C60 and Its Interaction with Pyridine. The Journal of Physical Chemistry B 2004, 108, 13586–13588. [Google Scholar] [CrossRef]
- Baibarac, M.; Baltog, I.; Daescu, M.; Lefrant, S.; Chirita, P. Optical evidence for chemical interaction of the polyaniline/fullerene composites with N-methyl-2-pyrrolidinone. Journal of Molecular Structure 2016, 1125, 340–349. [Google Scholar] [CrossRef]
- Mojarad, N.; Tisserant, J.-N.; Beyer, H.; Dong, H.; Reissner, P.A.; Fedoryshyn, Y.; Stemmer, A. Monitoring the transformation of aliphatic and fullerene molecules by high-energy electrons using surface-enhanced Raman spectroscopy. Nanotechnology 2017, 28, 165701. [Google Scholar] [CrossRef]
- Yasuraoka, K.; Kaneko, S.; Kobayashi, S.; Tsukagoshi, K.; Nishino, T. Surface-Enhanced Raman Scattering Stimulated by Strong Metal–Molecule Interactions in a C60 Single-Molecule Junction. ACS Applied Materials & Interfaces 2021, 13, 51602–51607. [Google Scholar] [CrossRef]
- Zhixun, L.; Yan, F.; Pengxiang, Z. Surface enhanced Raman scattering of gold/C60 (/C70) nano-clusters deposited on AAO nano-sieve. Vibrational Spectroscopy 2006, 41, 37–41. [Google Scholar] [CrossRef]
- Luo, Z.; Fang, Y. Investigation of the mechanism of influence of colloidal gold/silver substrates in nonaqueous liquids on the surface enhanced Raman spectroscopy (SERS) of fullerenes C60 (C70). Journal of Colloid and Interface Science 2006, 301, 184–192. [Google Scholar] [CrossRef] [PubMed]
- Luo, Z.; Zhao, Y.S.; Yang, W.; Peng, A.; Ma, Y.; Fu, H.; Yao, J. Core−Shell Nanopillars of Fullerene C60/C70 Loading with Colloidal Au Nanoparticles: A Raman Scattering Investigation. J Phys Chem A 2009, 113, 9612–9616. [Google Scholar] [CrossRef] [PubMed]
- Niu, Z.; Fang, Y. A new surface-enhanced Raman scattering system for C60 fullerene: Silver nano-particles/C60/silver film. Vibrational Spectroscopy 2007, 43, 415–419. [Google Scholar] [CrossRef]
- Lim, I.I.S.; Pan, Y.; Mott, D.; Ouyang, J.; Njoki, P.N.; Luo, J.; Zhou, S.; Zhong, C.-J. Assembly of Gold Nanoparticles Mediated by Multifunctional Fullerenes. Langmuir 2007, 23, 10715–10724. [Google Scholar] [CrossRef]
- Khinevich, N.; Girel, K.; Bandarenka, H.; Salo, V.; Mosunov, A. Surface enhanced Raman spectroscopy of fullerene C60 drop-deposited on the silvered porous silicon. Journal of Physics: Conference Series 2017, 917, 062052. [Google Scholar] [CrossRef]
- Pettinger, B.; Schambach, P.; Villagómez, C.J.; Scott, N. Tip-Enhanced Raman Spectroscopy: Near-Fields Acting on a Few Molecules. Annu Rev Phys Chem 2012, 63, 379–399. [Google Scholar] [CrossRef]
- Stöckle, R.M.; Suh, Y.D.; Deckert, V.; Zenobi, R. Nanoscale chemical analysis by tip-enhanced Raman spectroscopy. Chemical Physics Letters 2000, 318, 131–136. [Google Scholar] [CrossRef]
- Verma, P.; Yamada, K.; Watanabe, H.; Inouye, Y.; Kawata, S. Near-field Raman scattering investigation of tip effects on C60 molecules. Phys Rev B 2006, 73, 045416. [Google Scholar] [CrossRef]
- Cirera, B.; Litman, Y.; Lin, C.; Akkoush, A.; Hammud, A.; Wolf, M.; Rossi, M.; Kumagai, T. Charge Transfer-Mediated Dramatic Enhancement of Raman Scattering upon Molecular Point Contact Formation. Nano Letters 2022, 22, 2170–2176. [Google Scholar] [CrossRef]
- Cirera, B.; Wolf, M.; Kumagai, T. Joule Heating in Single-Molecule Point Contacts Studied by Tip-Enhanced Raman Spectroscopy. Acs Nano 2022, 16, 16443–16451. [Google Scholar] [CrossRef] [PubMed]
- Meng, Q.; Zhang, J.; Zhang, Y.; Chu, W.; Mao, W.; Zhang, Y.; Yang, J.; Luo, Y.; Dong, Z.; Hou, J.G. Local heating and Raman thermometry in a single molecule. Science Advances 2024, 10, eadl1015. [Google Scholar] [CrossRef]
- Cirera, B.; Liu, S.; Park, Y.; Hamada, I.; Wolf, M.; Shiotari, A.; Kumagai, T. Single-molecule tip-enhanced Raman spectroscopy of C60 on the Si(111)-(7 × 7) surface. Physical Chemistry Chemical Physics 2024, 26, 21325–21331. [Google Scholar] [CrossRef] [PubMed]
- Lussier, F.; Thibault, V.; Charron, B.; Wallace, G.Q.; Masson, J.-F. Deep learning and artificial intelligence methods for Raman and surface-enhanced Raman scattering. TrAC Trends in Analytical Chemistry 2020, 124, 115796. [Google Scholar] [CrossRef]
- Bi, X.; Lin, L.; Chen, Z.; Ye, J. Artificial Intelligence for Surface-Enhanced Raman Spectroscopy. Small Methods 2024, 8, 2301243. [Google Scholar] [CrossRef]
- Yi, J.; You, E.-M.; Liu, G.-K.; Tian, Z.-Q. AI–nano-driven surface-enhanced Raman spectroscopy for marketable technologies. Nature Nanotechnology 2024, 19, 1758–1762. [Google Scholar] [CrossRef] [PubMed]
- Lee, J.; Crampton, K.T.; Tallarida, N.; Apkarian, V.A. Visualizing vibrational normal modes of a single molecule with atomically confined light. Nature 2019, 568, 78–82. [Google Scholar] [CrossRef] [PubMed]
- Zhang, Y.; Yang, B.; Ghafoor, A.; Zhang, Y.; Zhang, Y.-F.; Wang, R.-P.; Yang, J.-L.; Luo, Y.; Dong, Z.-C.; Hou, J.G. Visually constructing the chemical structure of a single molecule by scanning Raman picoscopy. National Science Review 2019, 6, 1169–1175. [Google Scholar] [CrossRef] [PubMed]
- Kuramochi, H.; Tahara, T. Tracking Ultrafast Structural Dynamics by Time-Domain Raman Spectroscopy. Journal of the American Chemical Society 2021, 143, 9699–9717. [Google Scholar] [CrossRef] [PubMed]
- Kuramochi, H.; Takeuchi, S.; Yonezawa, K.; Kamikubo, H.; Kataoka, M.; Tahara, T. Probing the early stages of photoreception in photoactive yellow protein with ultrafast time-domain Raman spectroscopy. Nature Chemistry 2017, 9, 660–666. [Google Scholar] [CrossRef] [PubMed]
- Piercy, V.L.; Saeed, K.H.; Prentice, A.W.; Neri, G.; Li, C.; Gardner, A.M.; Bai, Y.; Sprick, R.S.; Sazanovich, I.V.; Cooper, A.I.; Rosseinsky, M.J.; Zwijnenburg, M.A.; Cowan, A.J. Time-Resolved Raman Spectroscopy of Polaron Formation in a Polymer Photocatalyst. J Phys Chem Lett 2021, 12, 10899–10905. [Google Scholar] [CrossRef] [PubMed]
- Yang, J.-A.; Parham, S.; Dessau, D.; Reznik, D. Novel Electron-Phonon Relaxation Pathway in Graphite Revealed by Time-Resolved Raman Scattering and Angle-Resolved Photoemission Spectroscopy. Scientific Reports 2017, 7, 40876. [Google Scholar] [CrossRef] [PubMed]
- Yan, H.; Song, D.; Mak, K.F.; Chatzakis, I.; Maultzsch, J.; Heinz, T.F. Time-resolved Raman spectroscopy of optical phonons in graphite: Phonon anharmonic coupling and anomalous stiffening. Phys Rev B 2009, 80, 121403. [Google Scholar] [CrossRef]
Figure 1.
(a) Raman spectra of fullerene (solid line) and F-fullerene (dashed line). Reproduced with permission from[53]. Copyright 2011 John Wiley and Sons. (b) Raman spectra for fullerene before and after -SO3H group functionalization. Reproduced with permission from[43]. Copyright 2016 Elsevier. (c) Raman spectrum of the EDA@C60. Reproduced with permission from[54]. Copyright 2022 ROYAL SOCIETY OF CHEMISTRY.
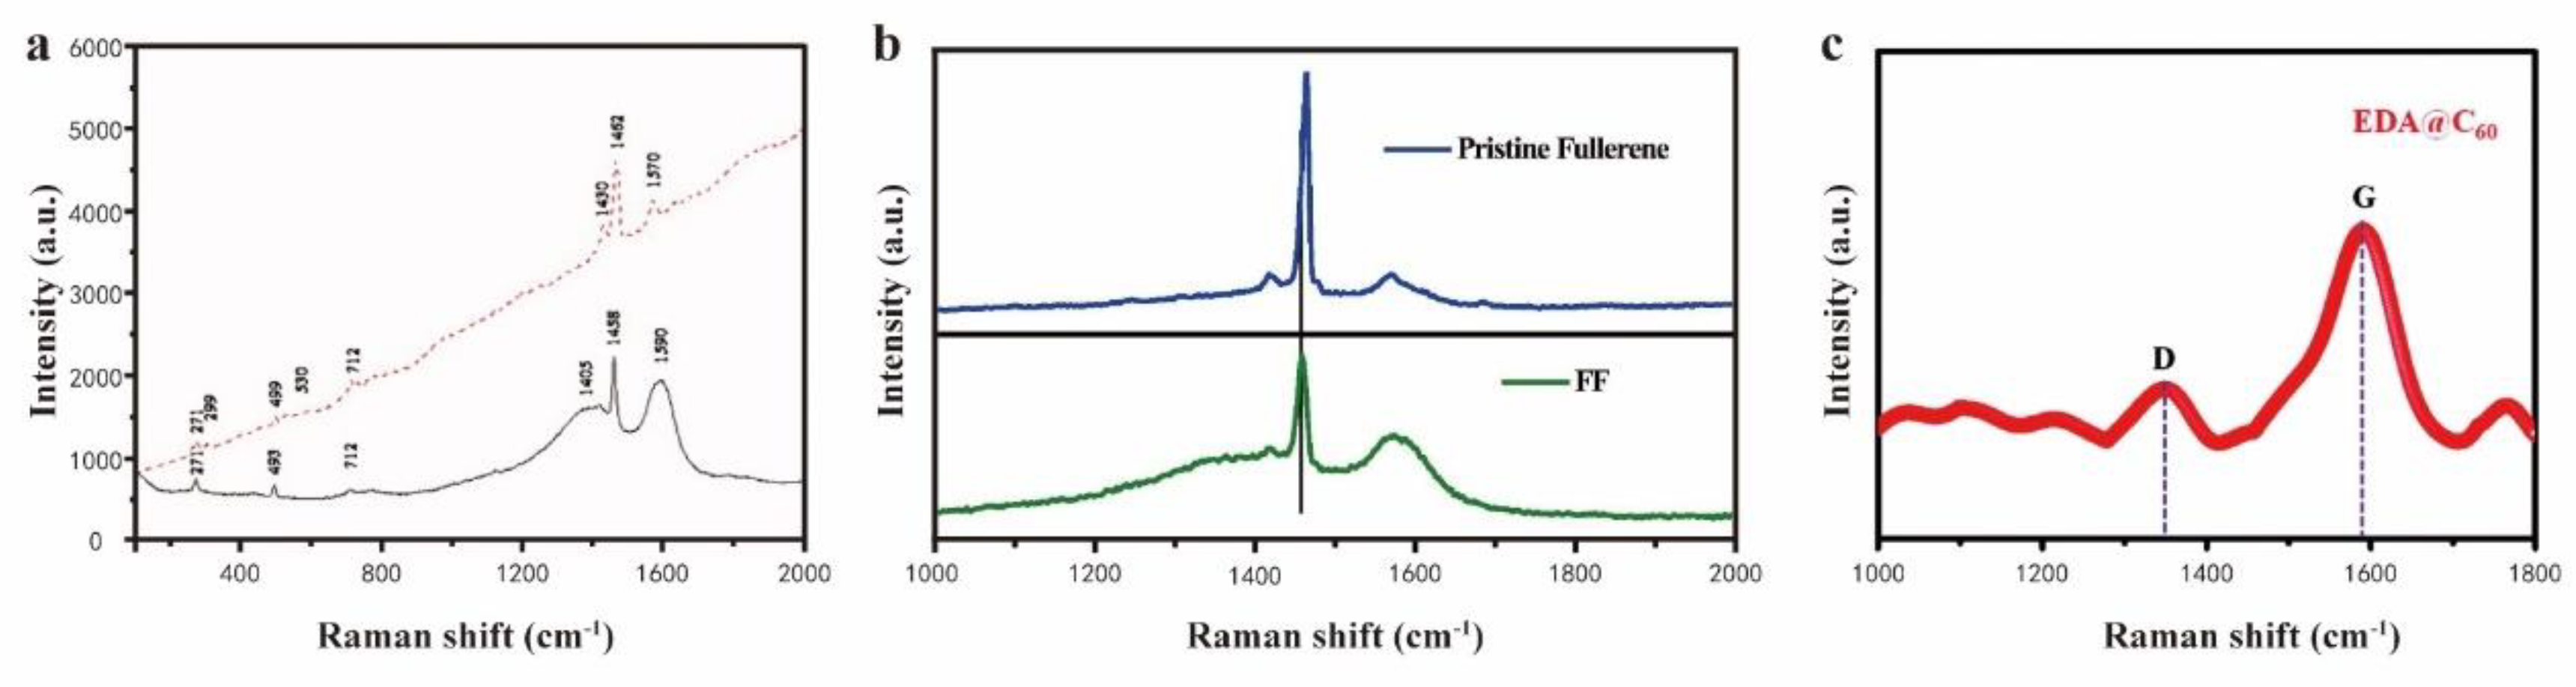
Figure 2.
(a) Raman spectra of (A) Tm@C82, (B) Tm@C82, (C) TM@C82, and (D) La@C82 listed from top to bottom respectively. (b) Plot of the wave number of the endohedral fullerenes Raman mode versus the square root of the reciprocal metal mass for Gd@C82, La@C82, Y@C82 and the three Tm@C82 isomers. (a–b) Reproduced with permission from [55]. Copyright 1999 Elsevier.
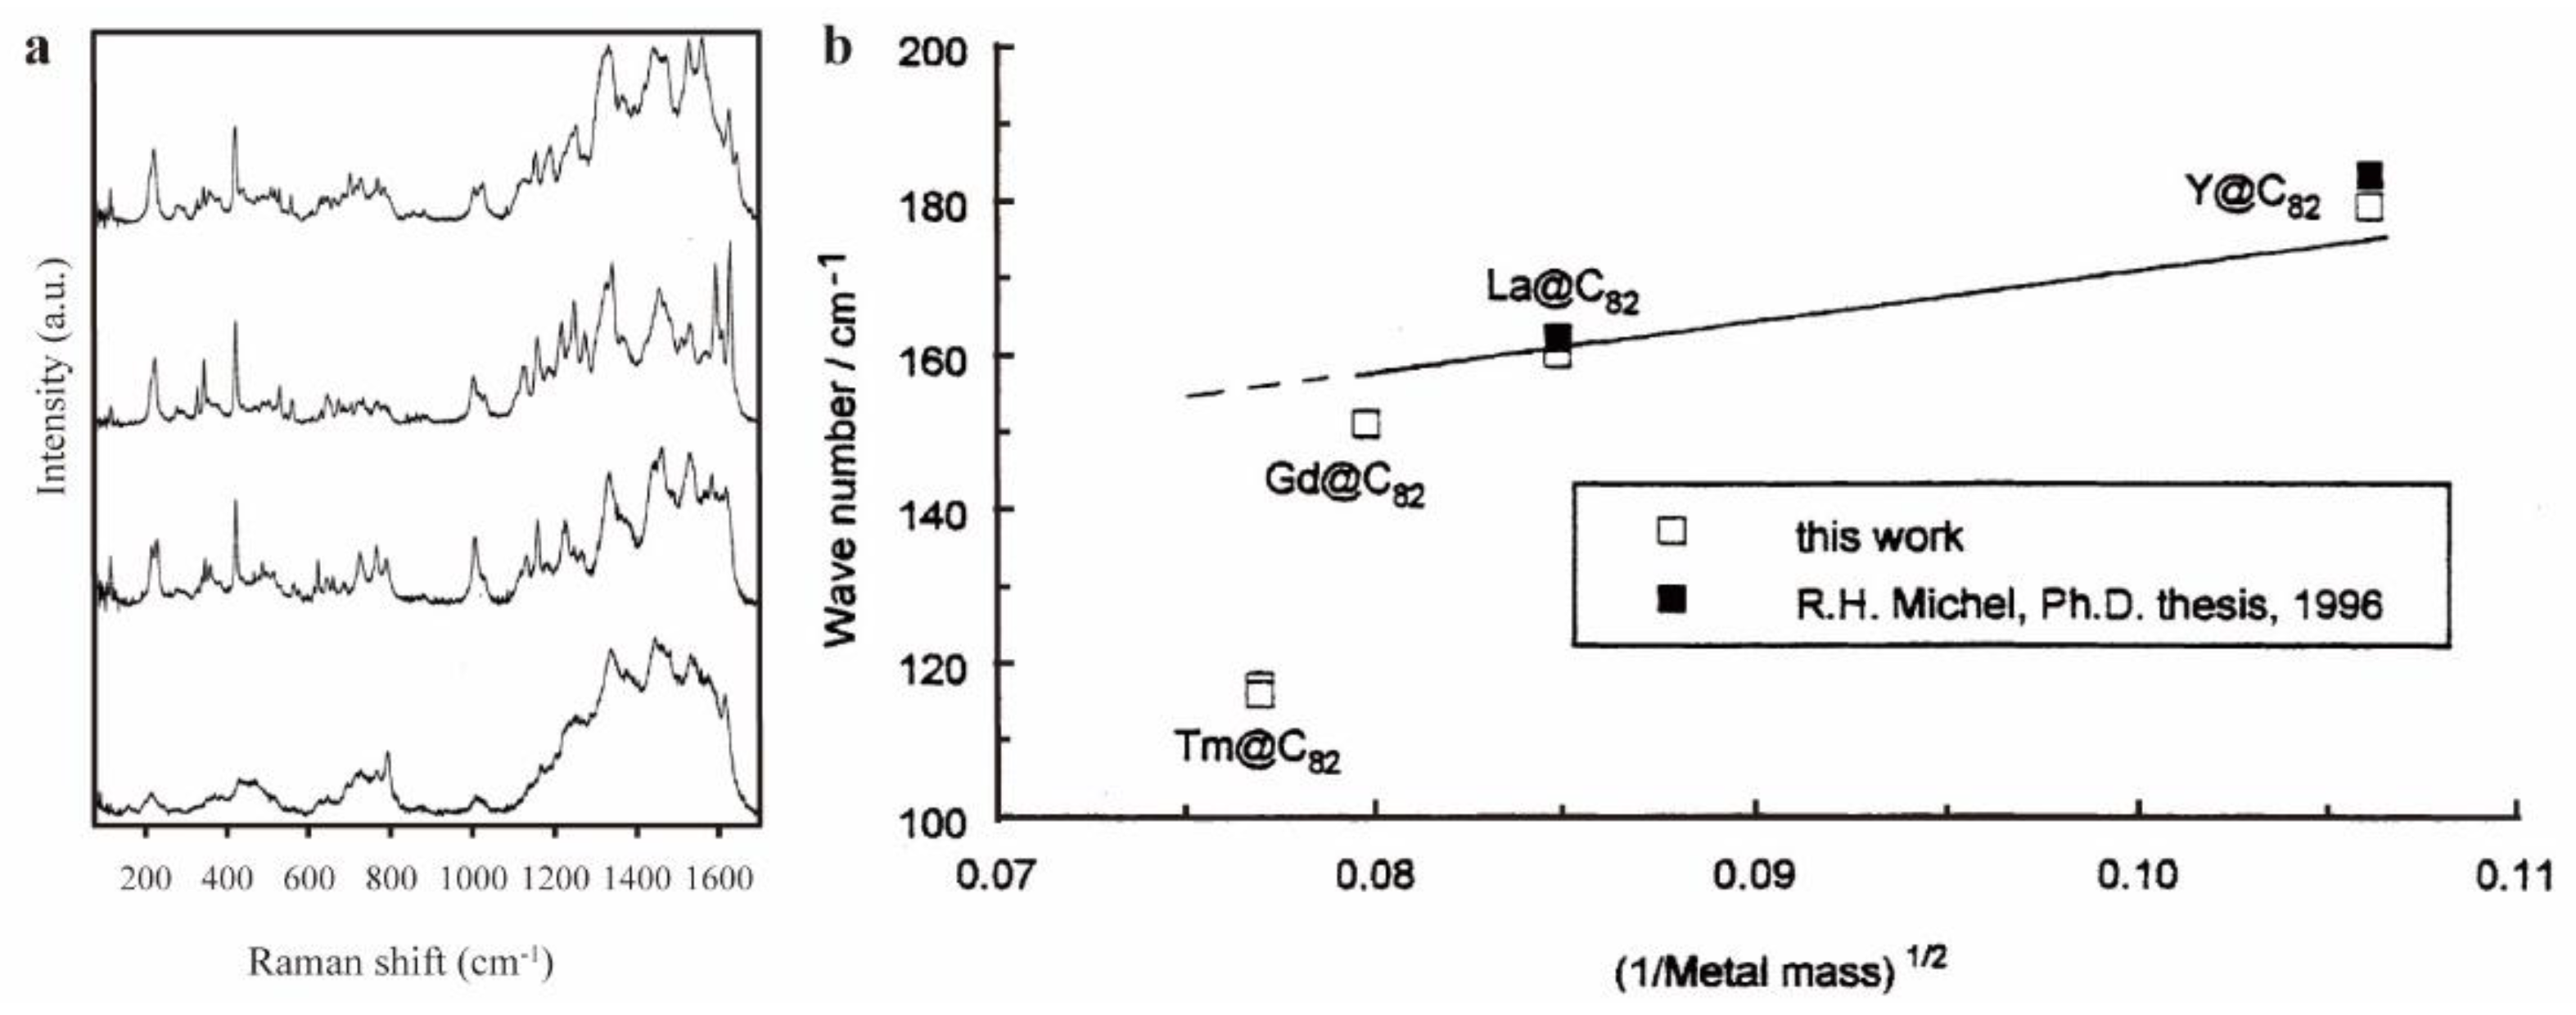
Figure 3.
(a) Raman spectroscopy of FNWs and pristine C60 powder. Reproduced with permission from [60]. Copyright 2012 MDPI AG. (b) Raman spectrum of fullerene aqueous solution with 0.15 mg/ml concentration of C60 fullerene in water. Reproduced with permission from [61]. Copyright 2004 Elsevier. (c) The structure of (i) PVP, (ii) C60, and Schematic diagram of (iii) pure PVP MOM device with macroscopic cross point architecture and PVP + C60 device. (d) Raman spectra near the Ag(1) C60 peak of a device after three memory operations. (c-d) Reproduced with permission from [62]. Copyright 2005 IOP Publishing. (e) Raman spectra of C60, g-C3N4 and C60/g-C3N4 photocatalysts. Reproduced with permission from [63]. Copyright 2014 Elsevier. (f) Raman spectroscopy of C60, pristine g-C3N4, g-C3N4/C60-4wt%, g-C3N4/C60-12wt% and g-C3N4/C60-20wt% listed from top to bottom respectively. Reproduced with permission from [64]. Copyright 2017 RSC Pub.
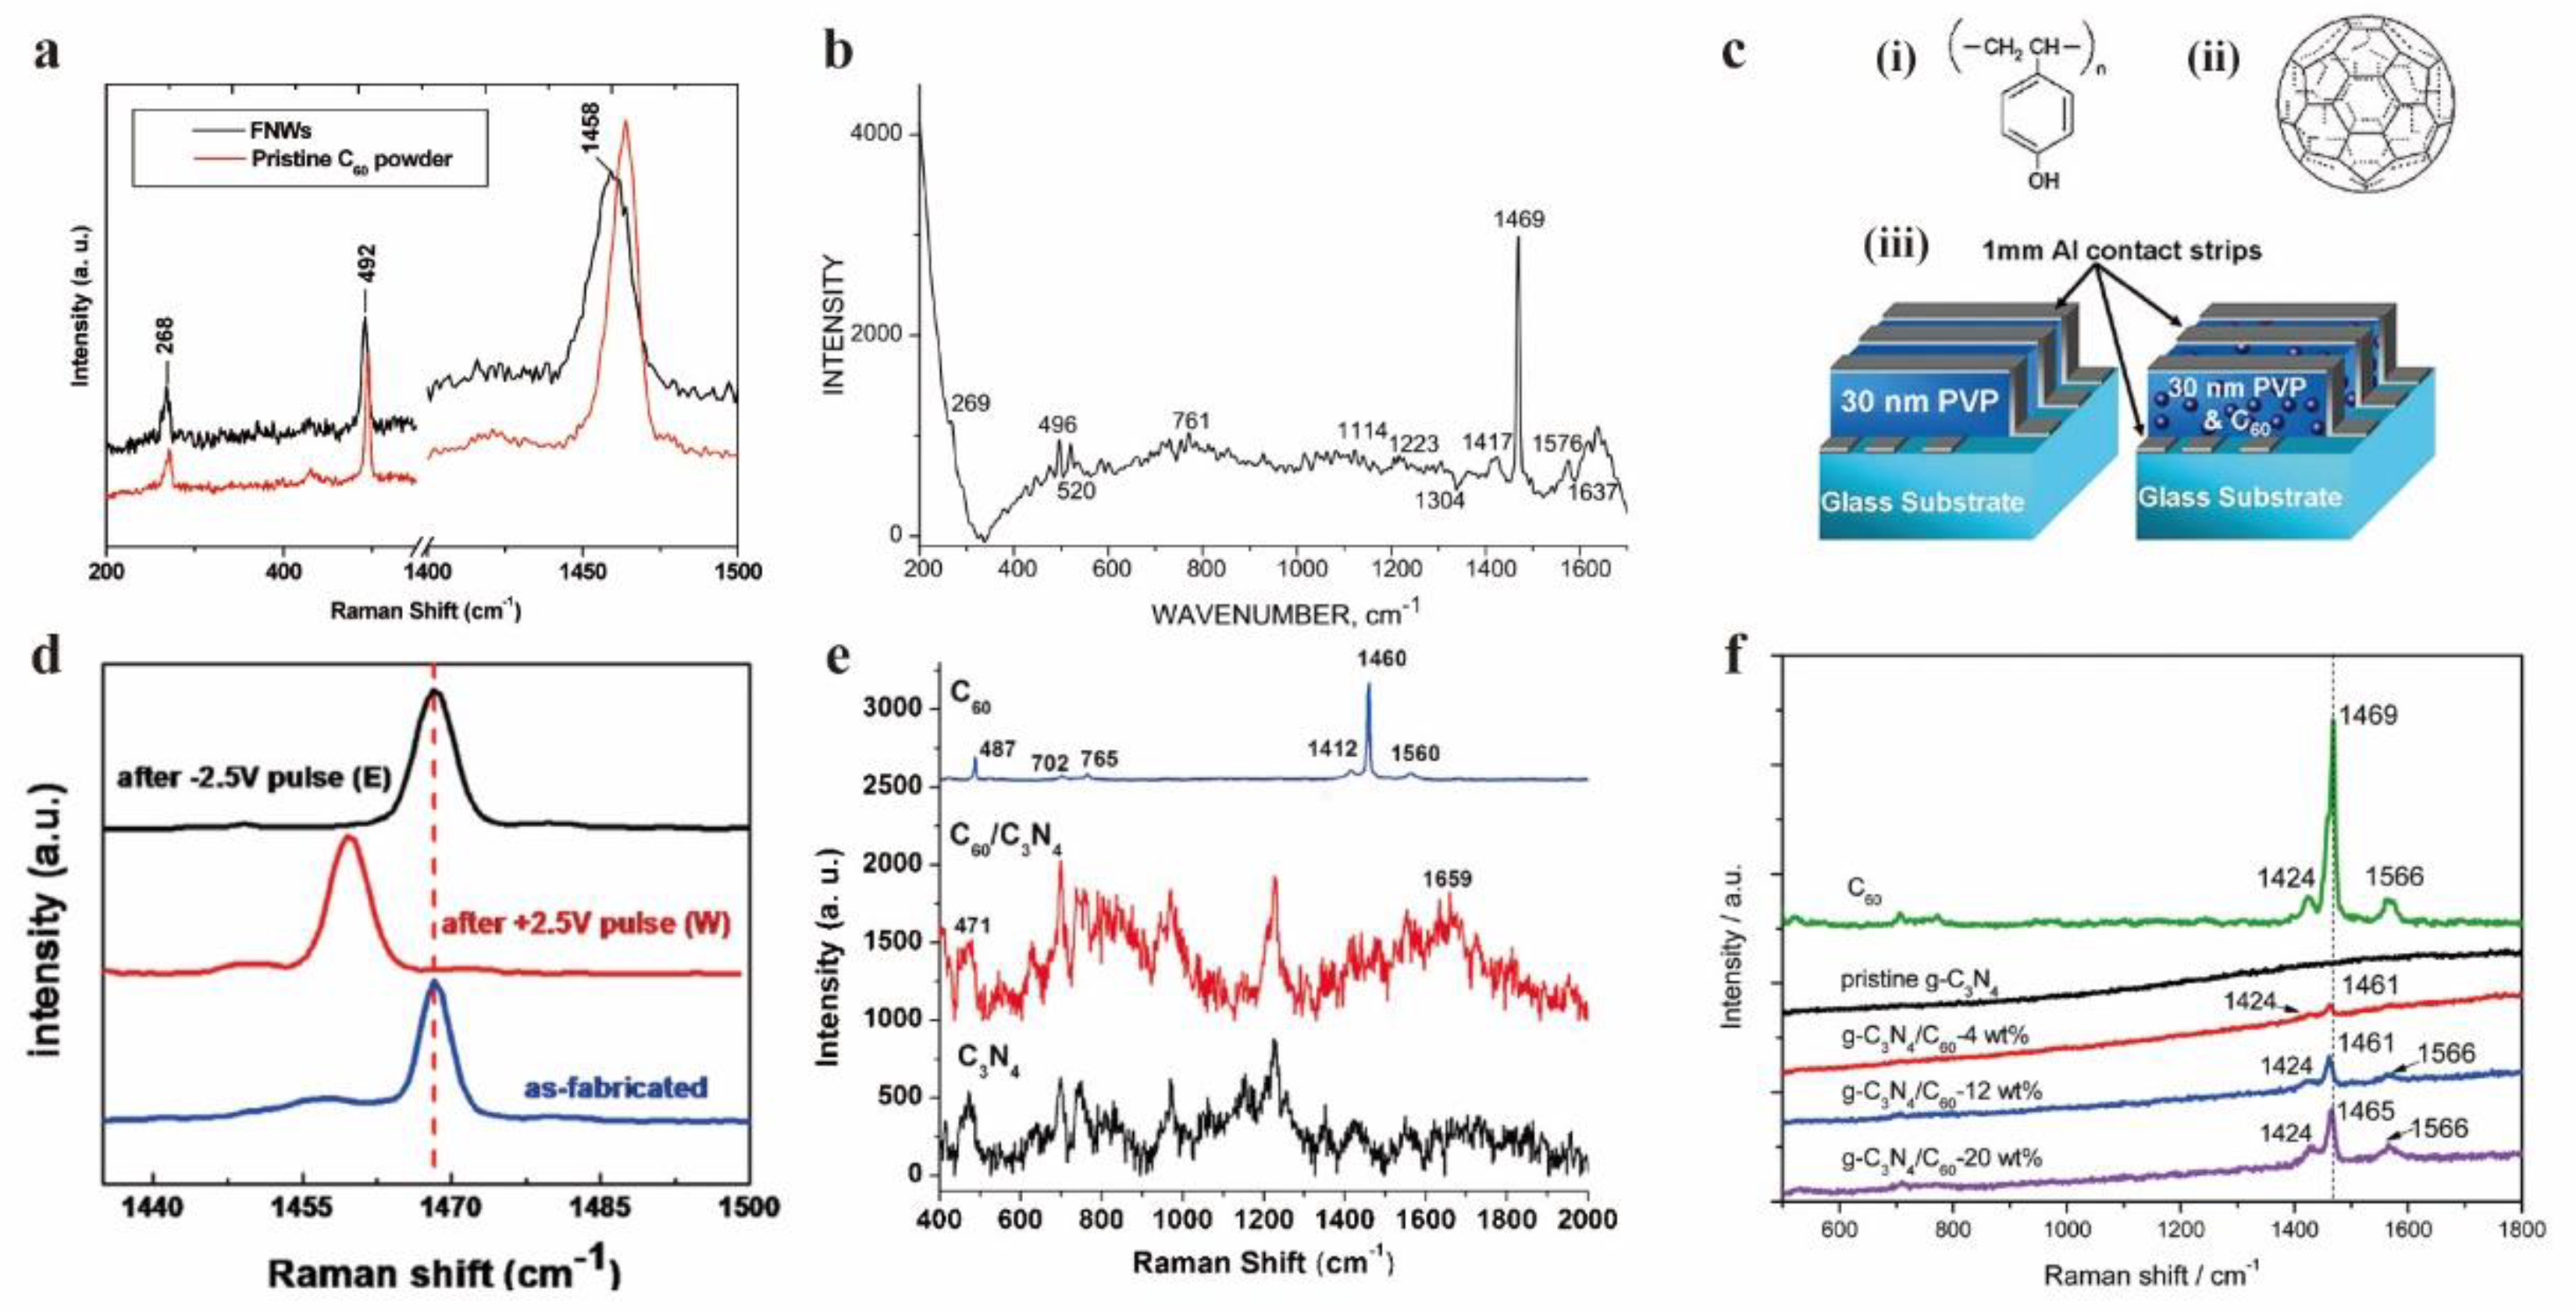
Figure 4.
(a) Raman patterns of C60/LDH samples with various C60 contents. Reproduced with permission from [65]. Copyright 2017 Elsevier. (b) TEM images of the C60-grafted graphene. (e) Raman spectra of C60, the chemically reduced graphene(G), the lithiated graphene(Li-G), and the C60-grafted graphene (C60-G). (b, e) Reproduced with permission from [66]. Copyright 2011 American Chemical Society. (c) HR-TEM image of the graphene with C60 attached to edges. (f) Raman spectra of pristine graphite, graphene–C60 hybrid and C60. (c, f) Reproduced with permission from [67]. Copyright 2015 ROYAL SOCIETY OF CHEMISTRY. (d) Raman spectra of C60, C60@Co-N-PCM and Co-N-PCM. Reproduced with permission from [68]. Copyright 2020 Springer Nature.
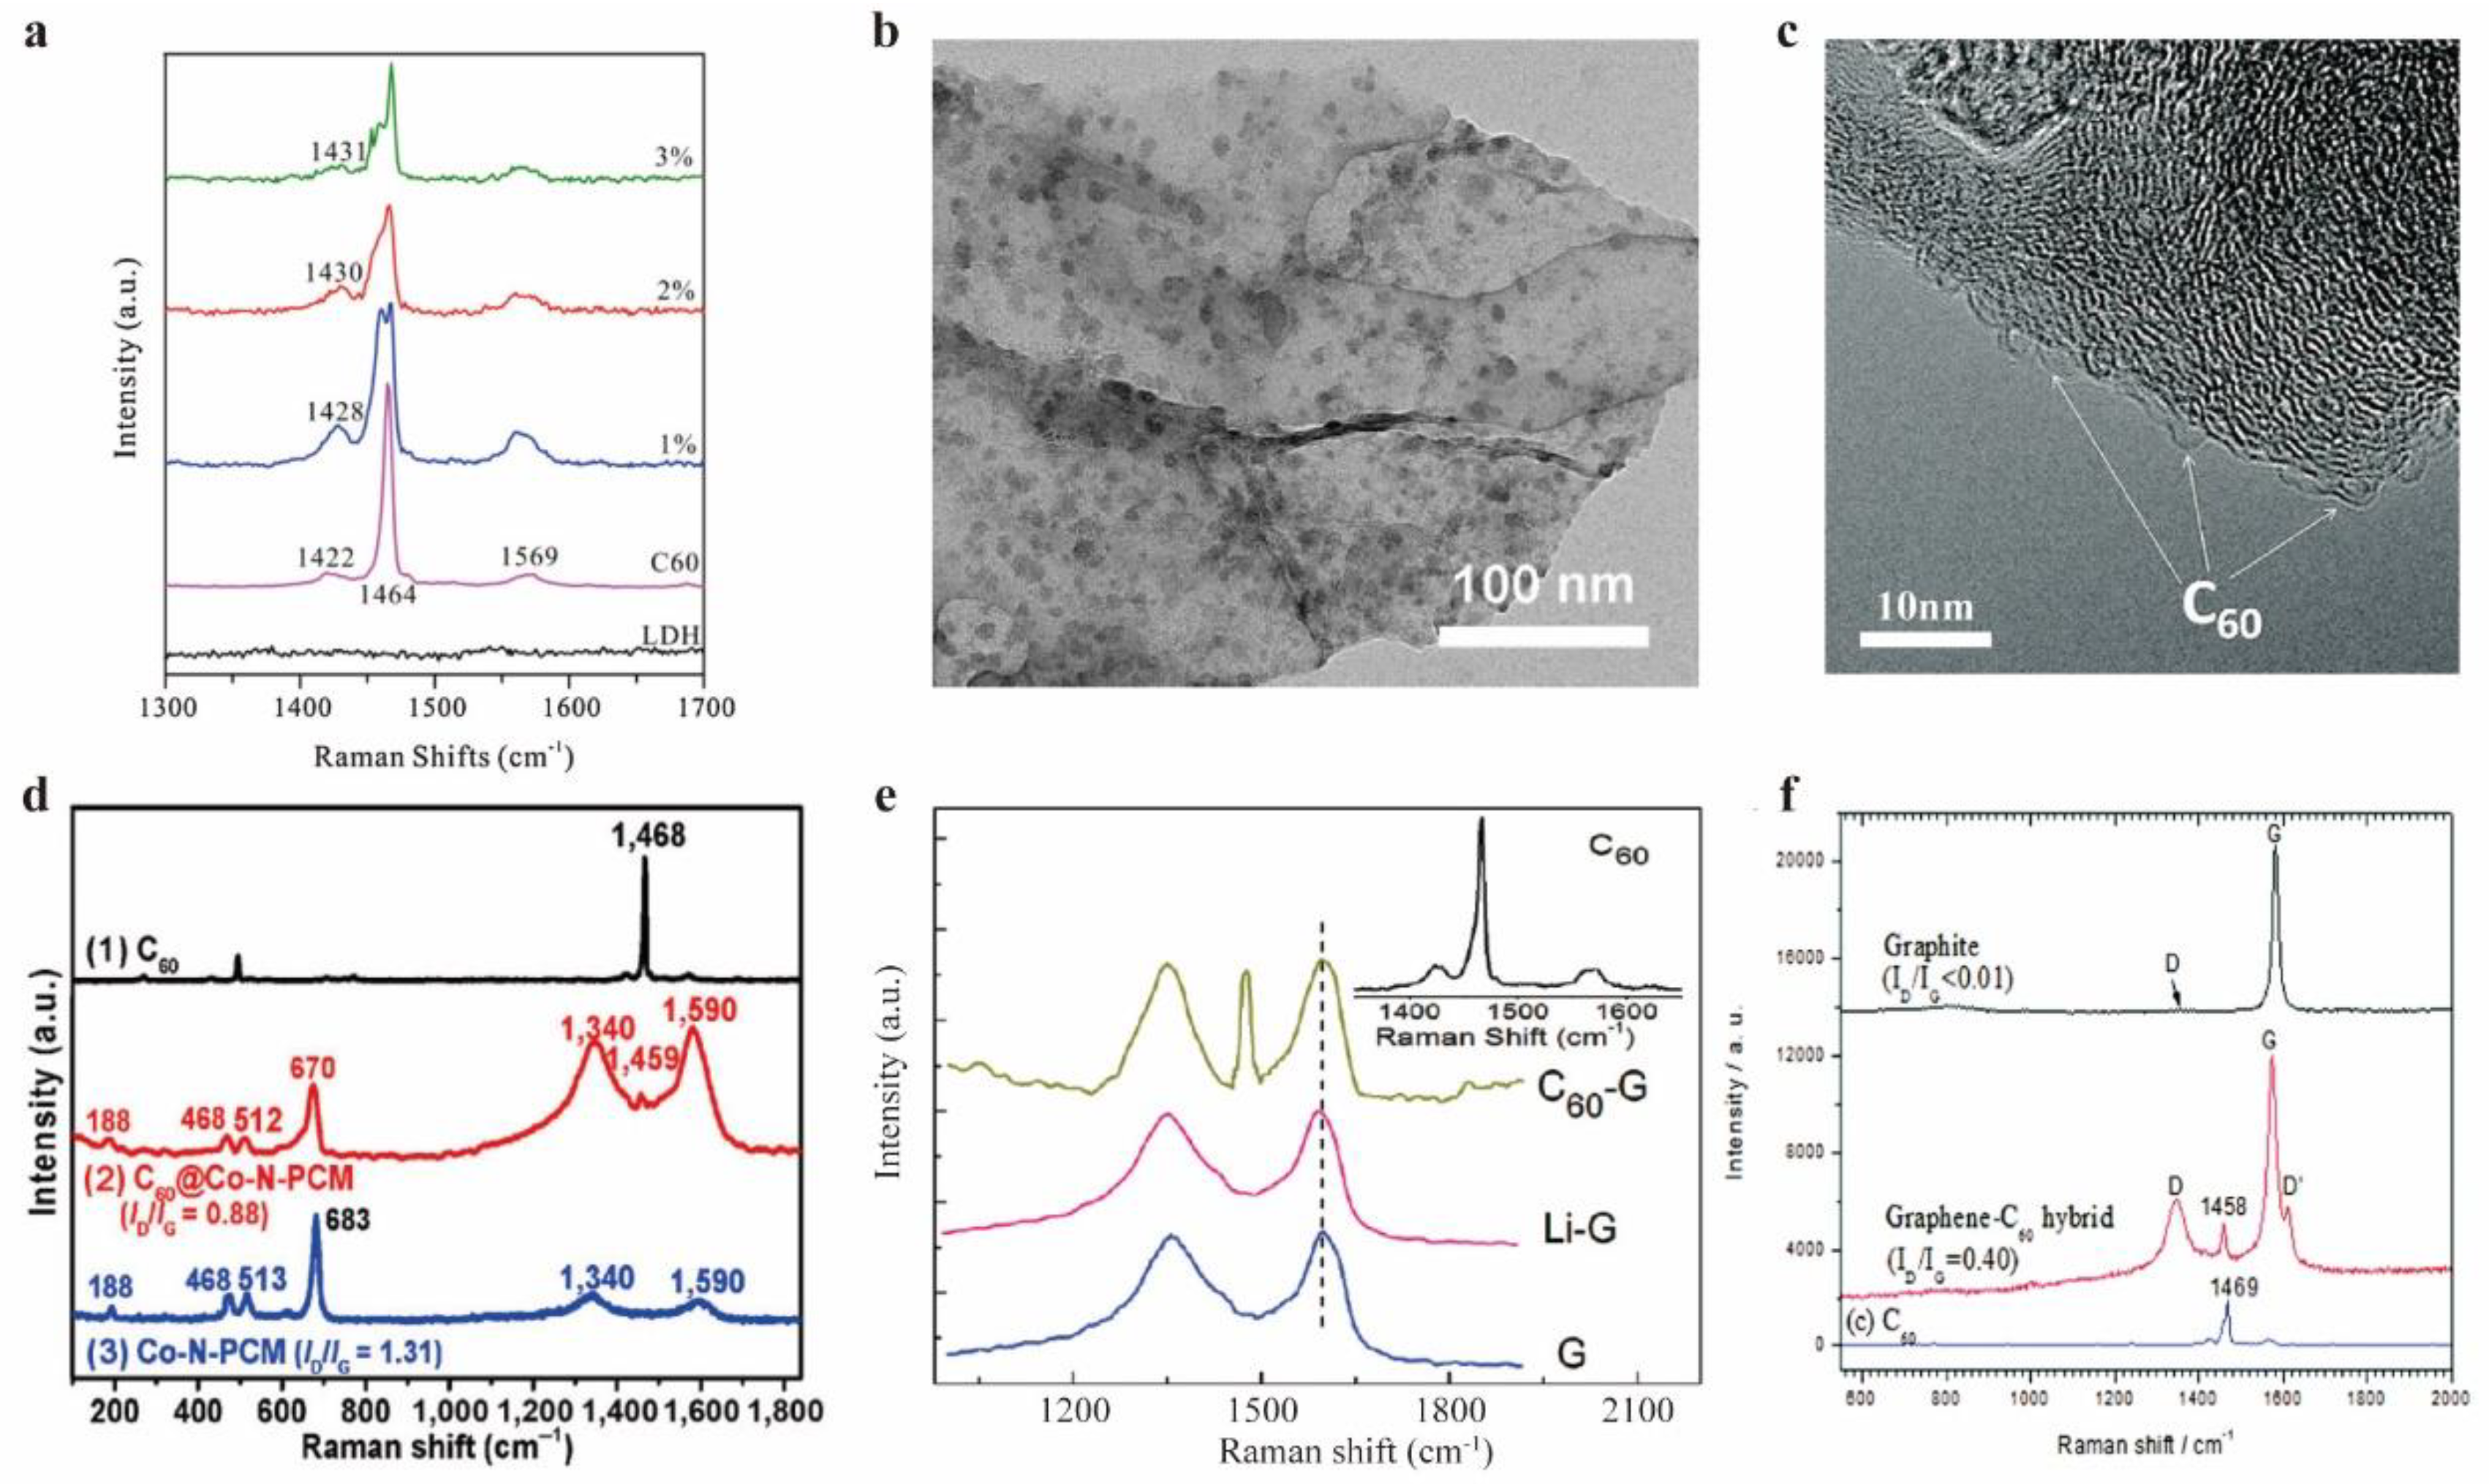
Figure 5.
(a) Resonance Raman spectrum of C60/C70 on a Si wafer. (b) Resonance Raman line position of (i) C60 and (ii) Silicon, and (iii) Raman line width of C60 as a function of Temperature. Full drawn line in (iii) is a calculation of two phonon decay process. (a-b) Reproduced with permission from [69]. Copyright 1991 Elsevier. (c) Resonance Raman spectrum for the 1469 cm-1 peak of C60 on silicon and dissolved in CS2, respectively. (d) Photoluminescence intensity of C60 excited with 5145 Å Ar+ laser line showing the minimum absorption level. C60 dissolved in CS2 at 293K (Solid line), deposited on Si at 293K (Dashed line) and at 10K (Dash-dotted line) are listed. (c-d) Reproduced with permission from [70]. Copyright 1991 Elsevier. (e) Resonance Raman spectra of (C59N)2 and (C60)2 excited with different lasers in comparison with C60. (f) Resonance Raman spectra of the (C60)2 dimer excited with 647.2nm laser at 180 K in comparison with the spectra from C60 at room temperature. (e-f) Reproduced with permission from [71]. Copyright 2000 Springer Nature.
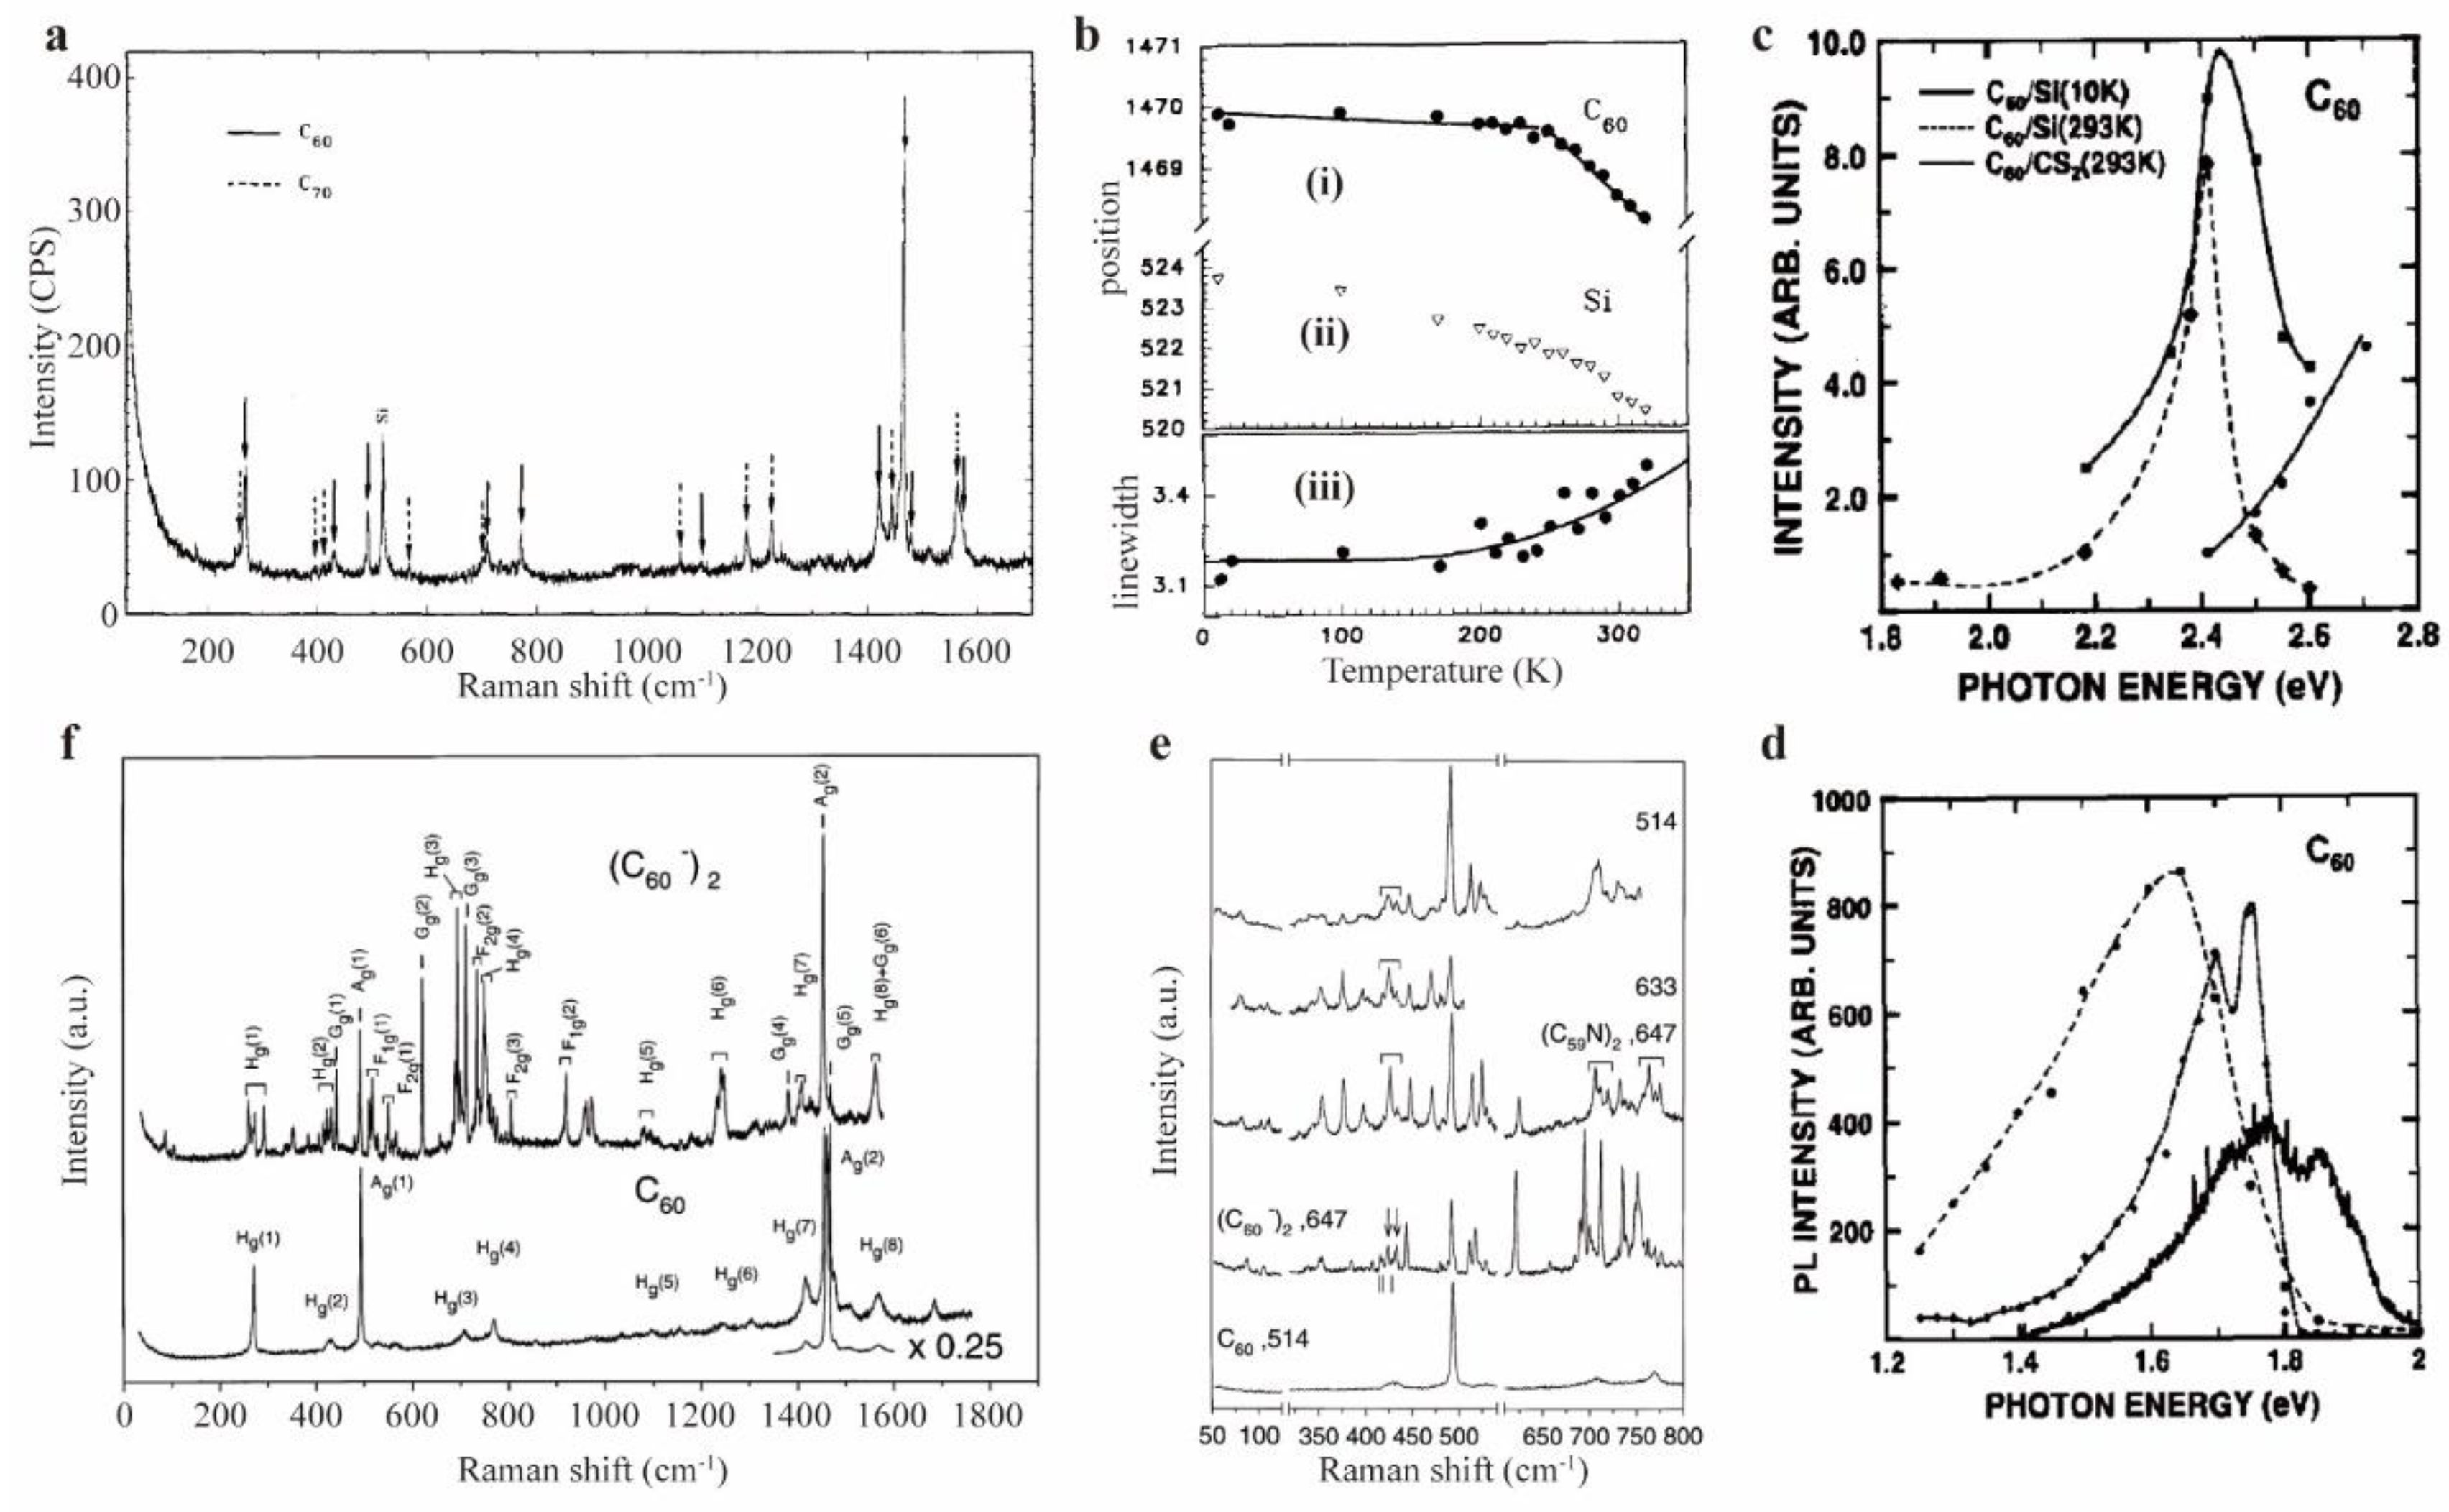
Figure 6.
(a) Resonance Raman spectra of and in (70%/30%) toluene/acetonitrile solvent. Reproduced with permission from [73]. Copyright 1993 American Chemical Society. (b) Resonance Raman spectra of C60 under the excitation wavelength of (i) 457.94, (ii) 413.10, and (iii) 406.67 nm, respectively. Reproduced with permission from [74]. Copyright 1994 American Chemical Society. (c) Stoks and anti-Stokes Resonance Raman spectrum of C60 under 413nm excitation in benzene and Toluene solvent, respectively. Reproduced with permission from [75]. Copyright 2004 American Chemical Society.
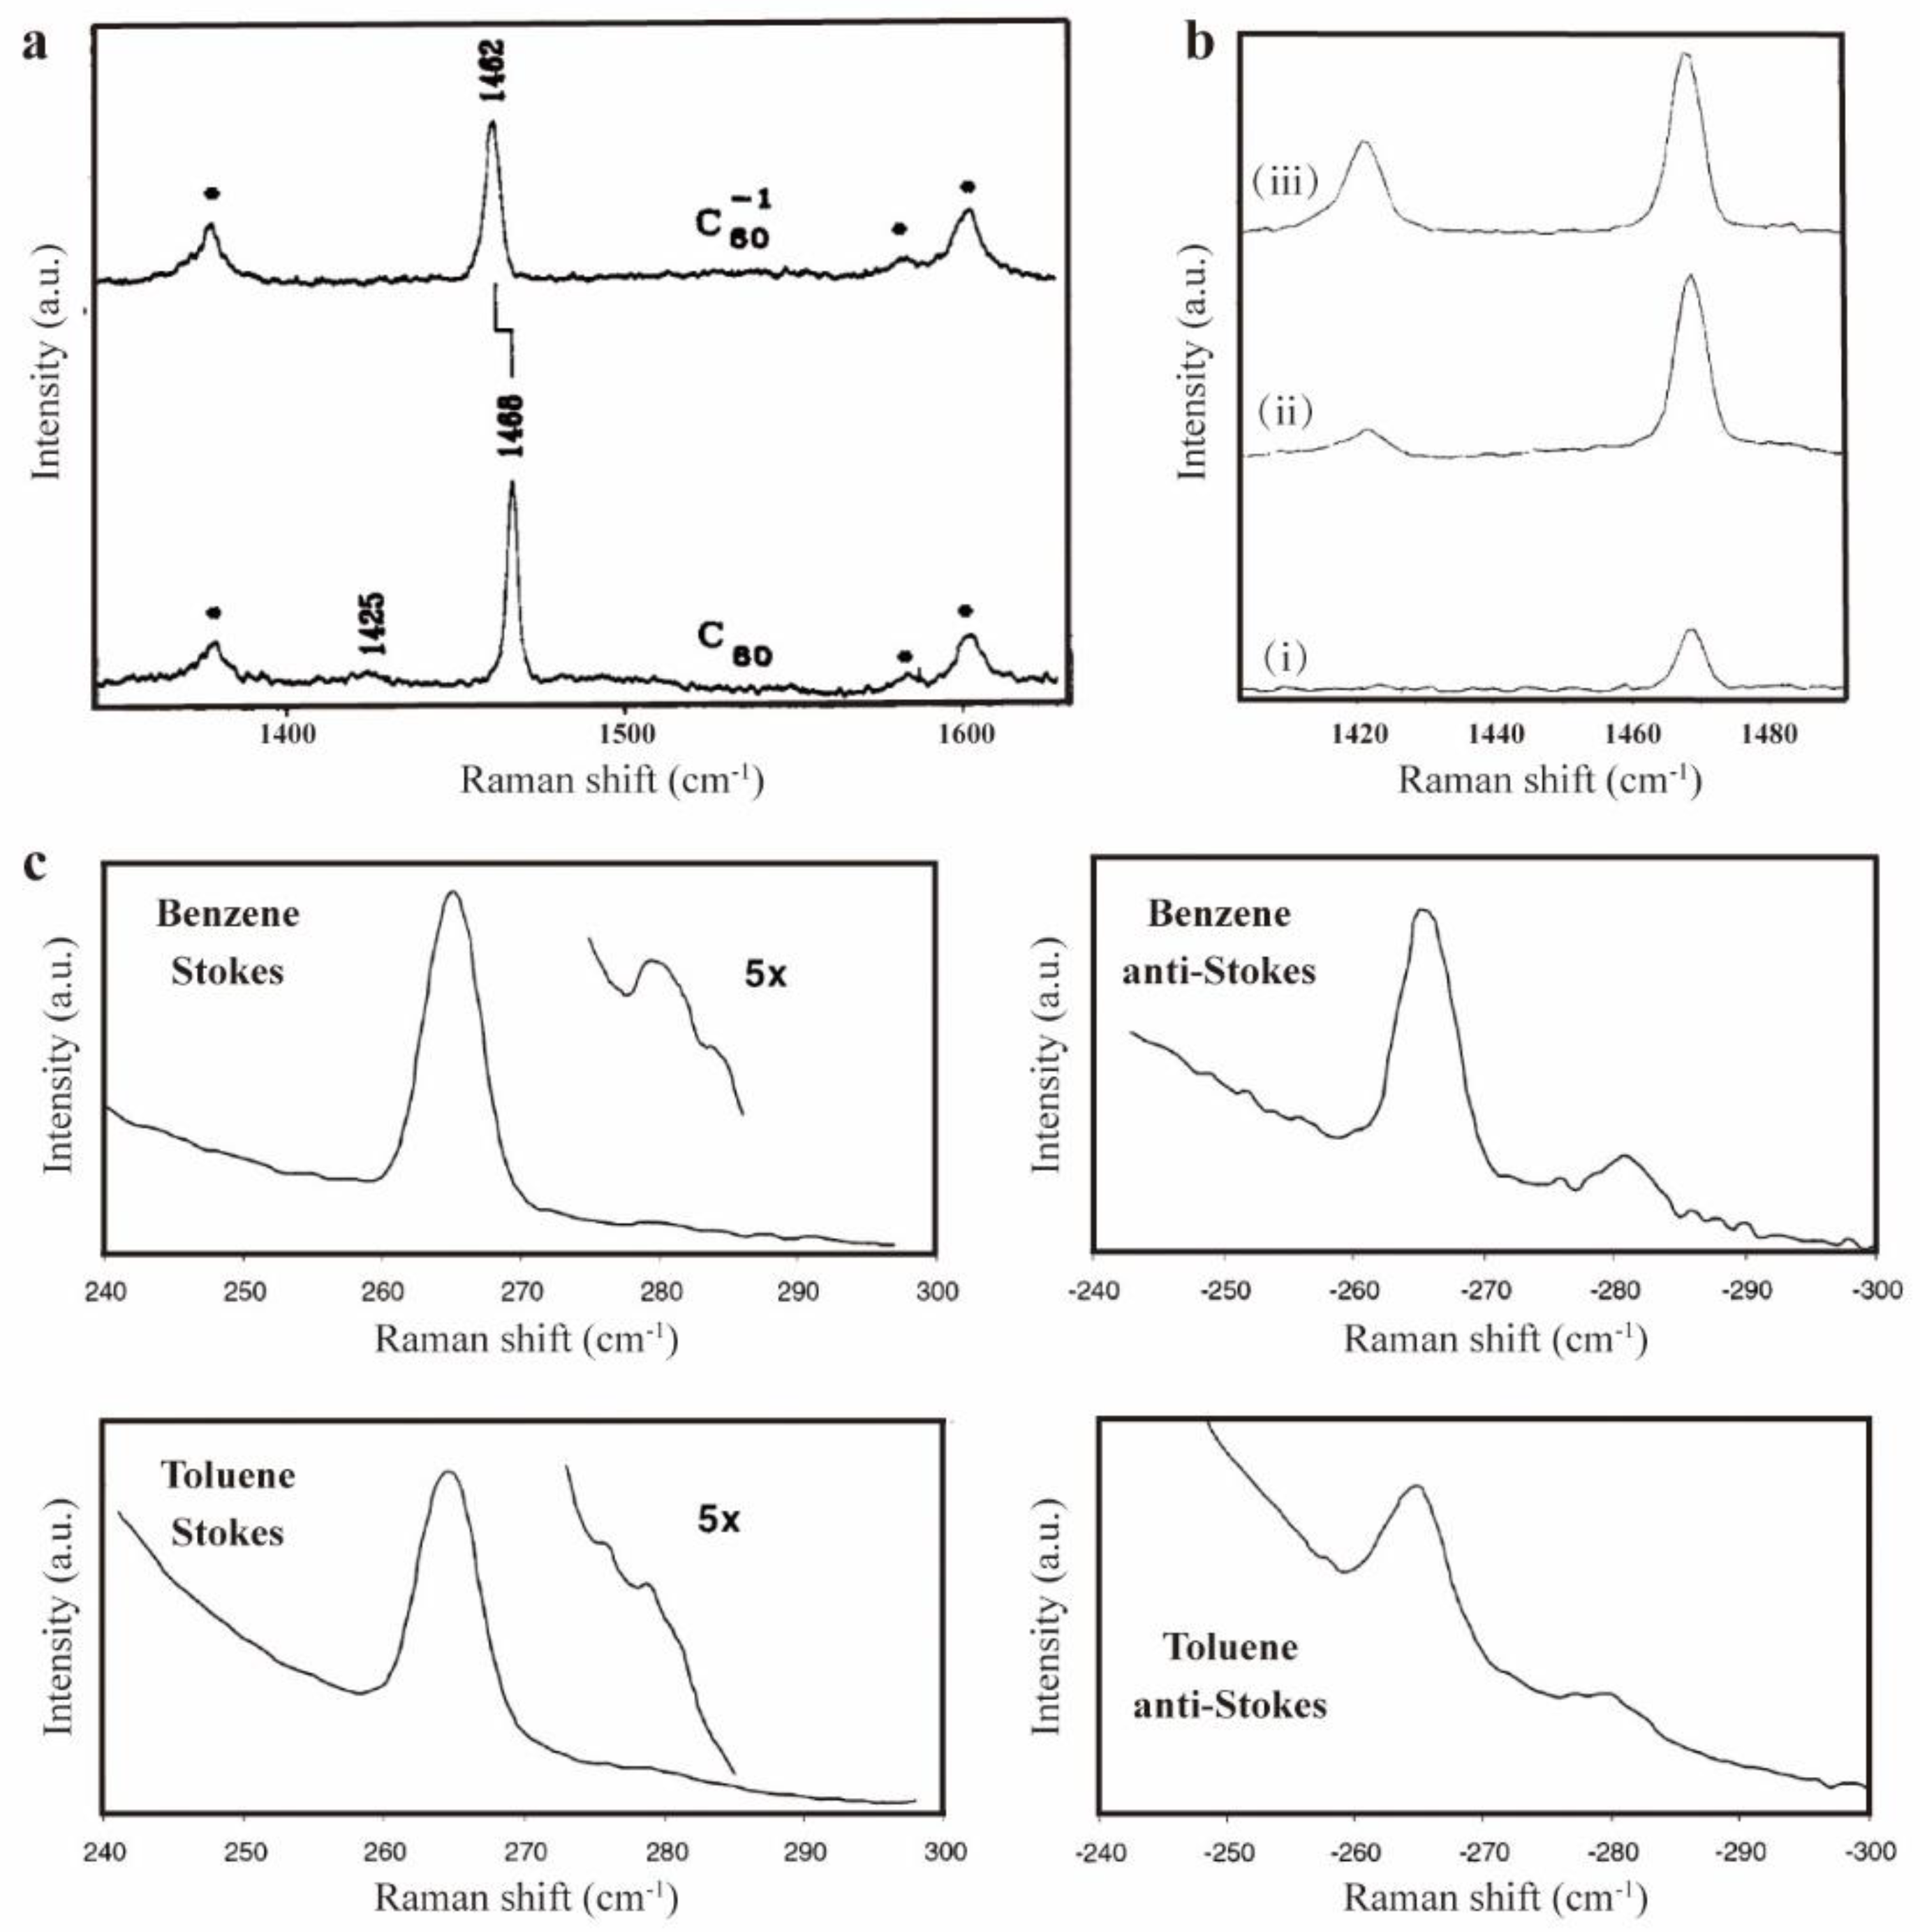
Figure 7.
(a) and (b) Raman spectra of C60@SWCNT and C70@SWCNT on Pt electrode, with the electrode potential varied by 0.3 V from -1.73 to 1.27 V vs. Fc/Fc+ for C60 ones and from -1.76 to 1.24 V vs. Fc/Fc+ for C70 ones from top to bottom. (a-b) Reproduced with permission from [79]. Copyright 2005 Elsevier. (c) Normalized integrated Raman intensity of the Ag(2) mode of C60 in SWCNT at different electrode potentials. Reproduced with permission from [80]. Copyright 2010 American Chemical Society.
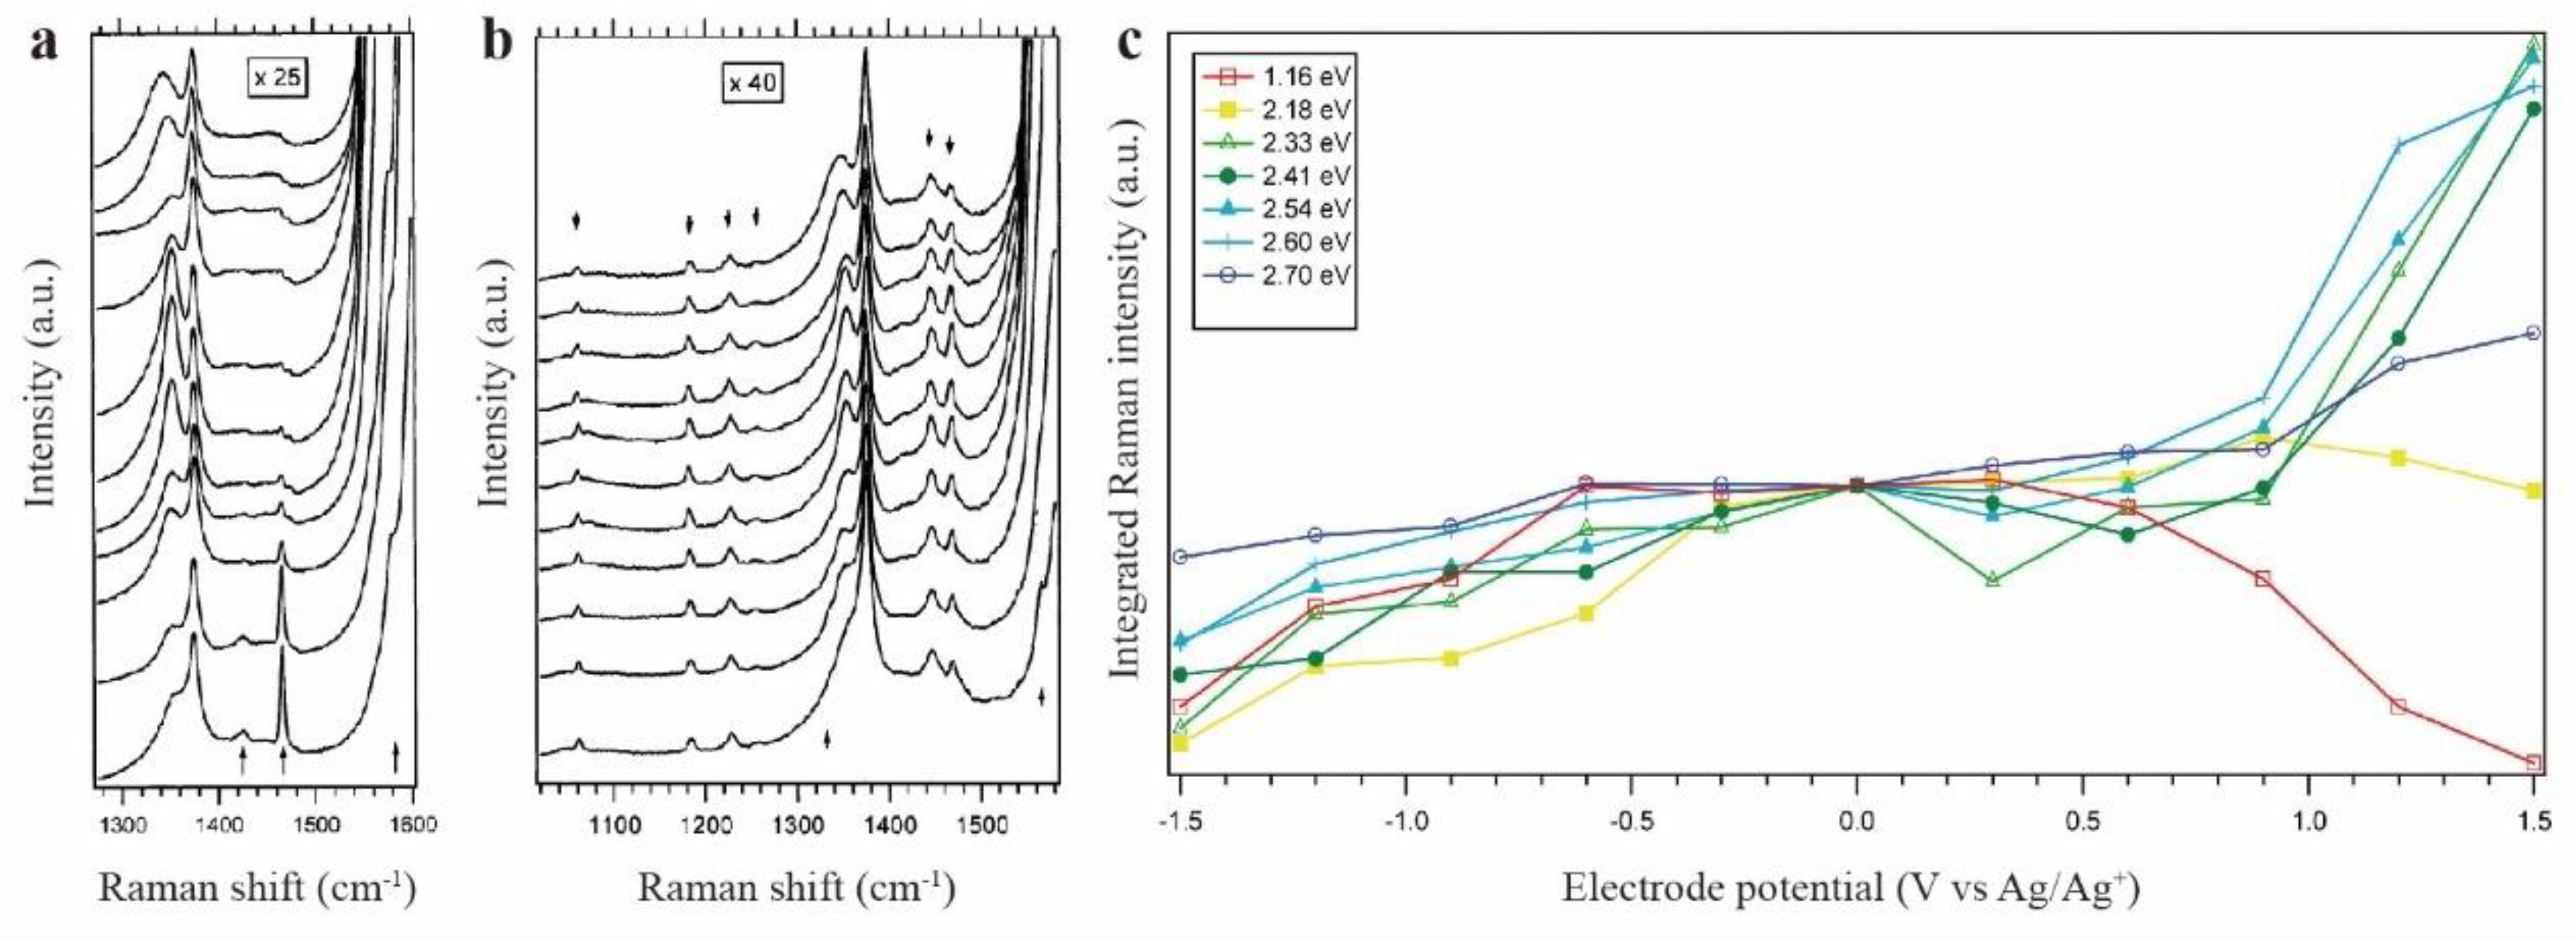
Figure 8.
Raman spectra of (Ph4P)2·C60·Br Hg(2) mode (a) and (Ph4P)2·C60·I Hg(3) mode (b) excited with 1064 nm laser. Solid lines are experimental Raman data and dashed lines are fitted peaks with Lorentzian line shapes. (a-b) Reproduced with permission from [81]. Copyright 1999 Elsevier.
Figure 8.
Raman spectra of (Ph4P)2·C60·Br Hg(2) mode (a) and (Ph4P)2·C60·I Hg(3) mode (b) excited with 1064 nm laser. Solid lines are experimental Raman data and dashed lines are fitted peaks with Lorentzian line shapes. (a-b) Reproduced with permission from [81]. Copyright 1999 Elsevier.
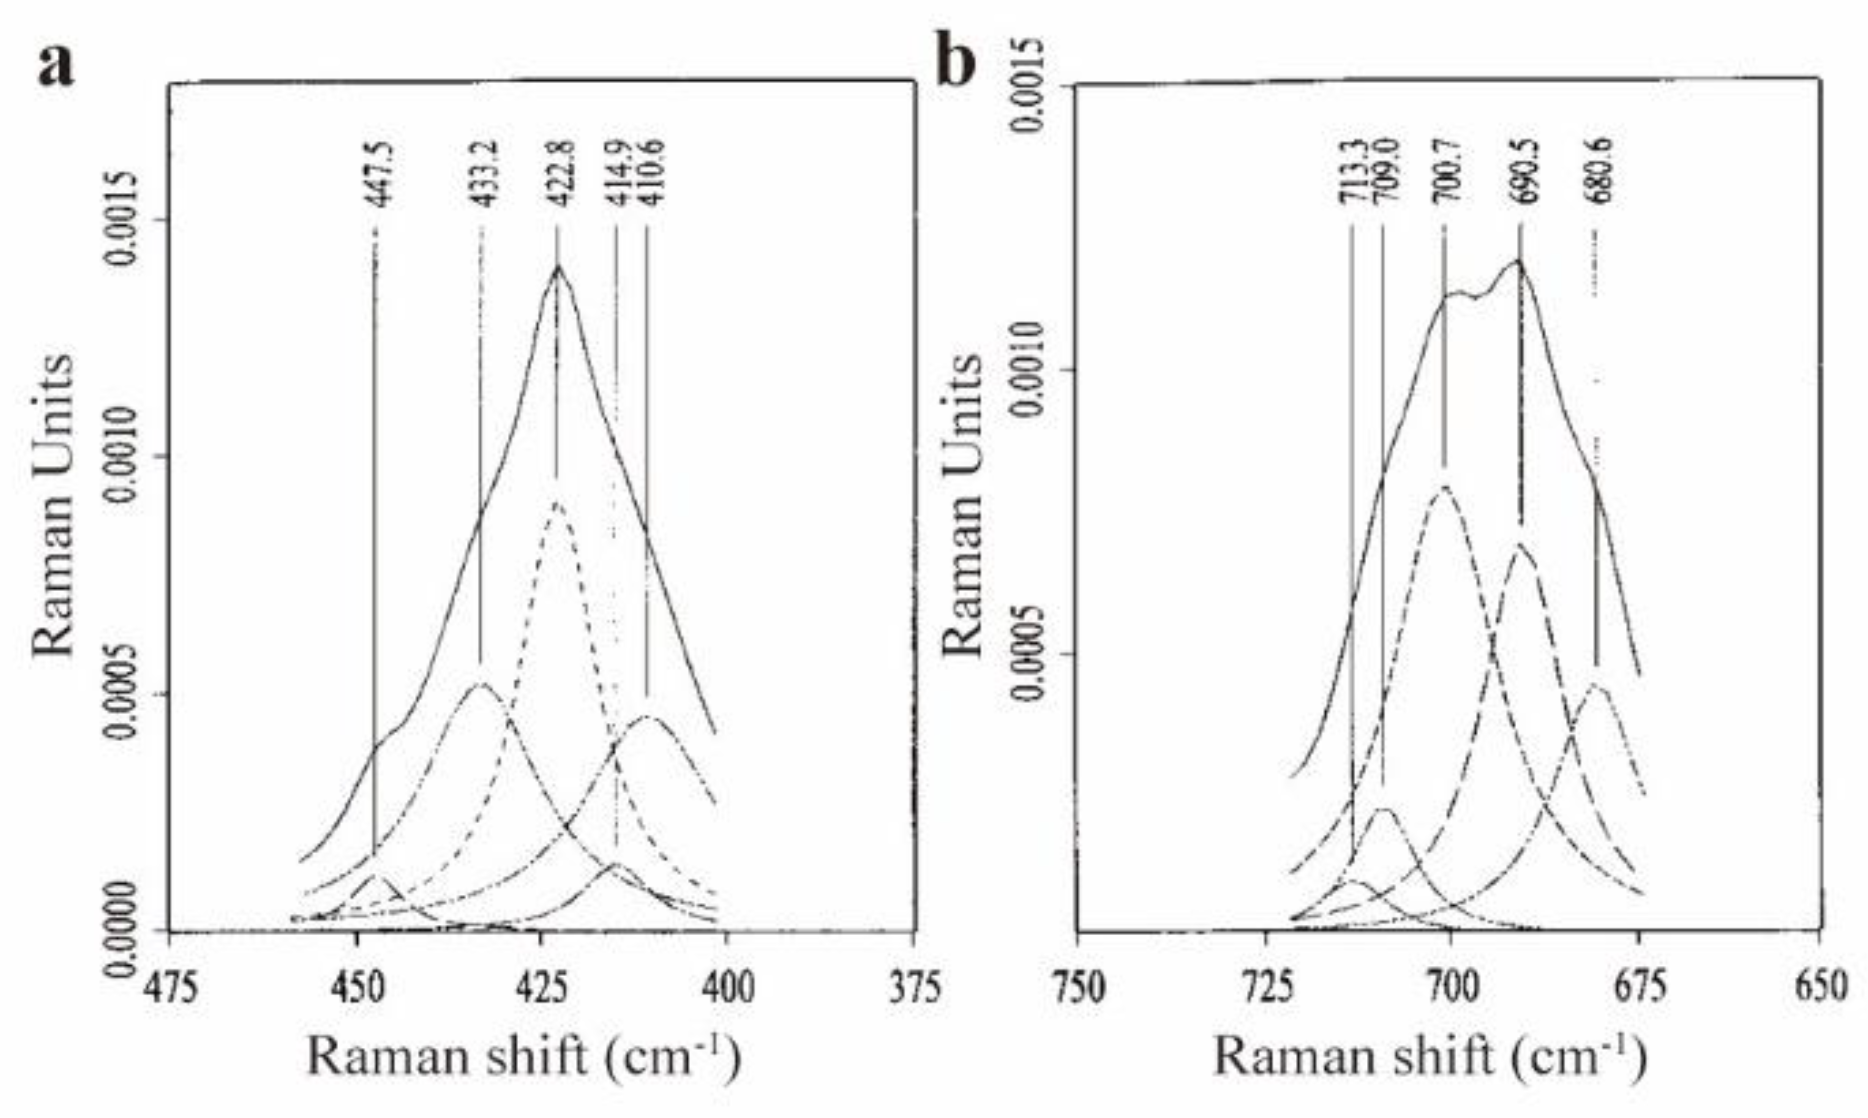
Figure 9.
(a) SERS spectra of C60 molecules on Au electrode in (i) pure water with no applied potential, (ii) 0.1 M aqueous KCl with +0.2 V vs SCE, and (iii) 0.1 M KCl with -0.6 V vs SCE. Reproduced with permission from [84]. Copyright 1991 American Chemical Society. (b) SERS spectra of C60 on Au, Cu, Ag and Al2O3 substrates. Reproduced with permission from [85]. Copyright 2024 American Physical Society. (c) SM-SERS of C60 from three different hot spots. (e-g) Time-dependent SM-SERS spectral fluctuations of C60 on Au-coated cover glass at three different hot spots (i), (ii) and (iii). (c, e-g) Reproduced with permission from [45]. Copyright 2011 John Wiley and Sons. (d) The top three lines show Raman spectra of natural and isotopic C60 molecules at room temperature, and an average SERS spectrum under 77K. Bottom lines show different examples of SM-SERS signals. (h) SERS spectra of different number of C60 molecules. (d, h) Reproduced with permission from [46]. Copyright 2012 ROYAL SOCIETY OF CHEMISTRY.
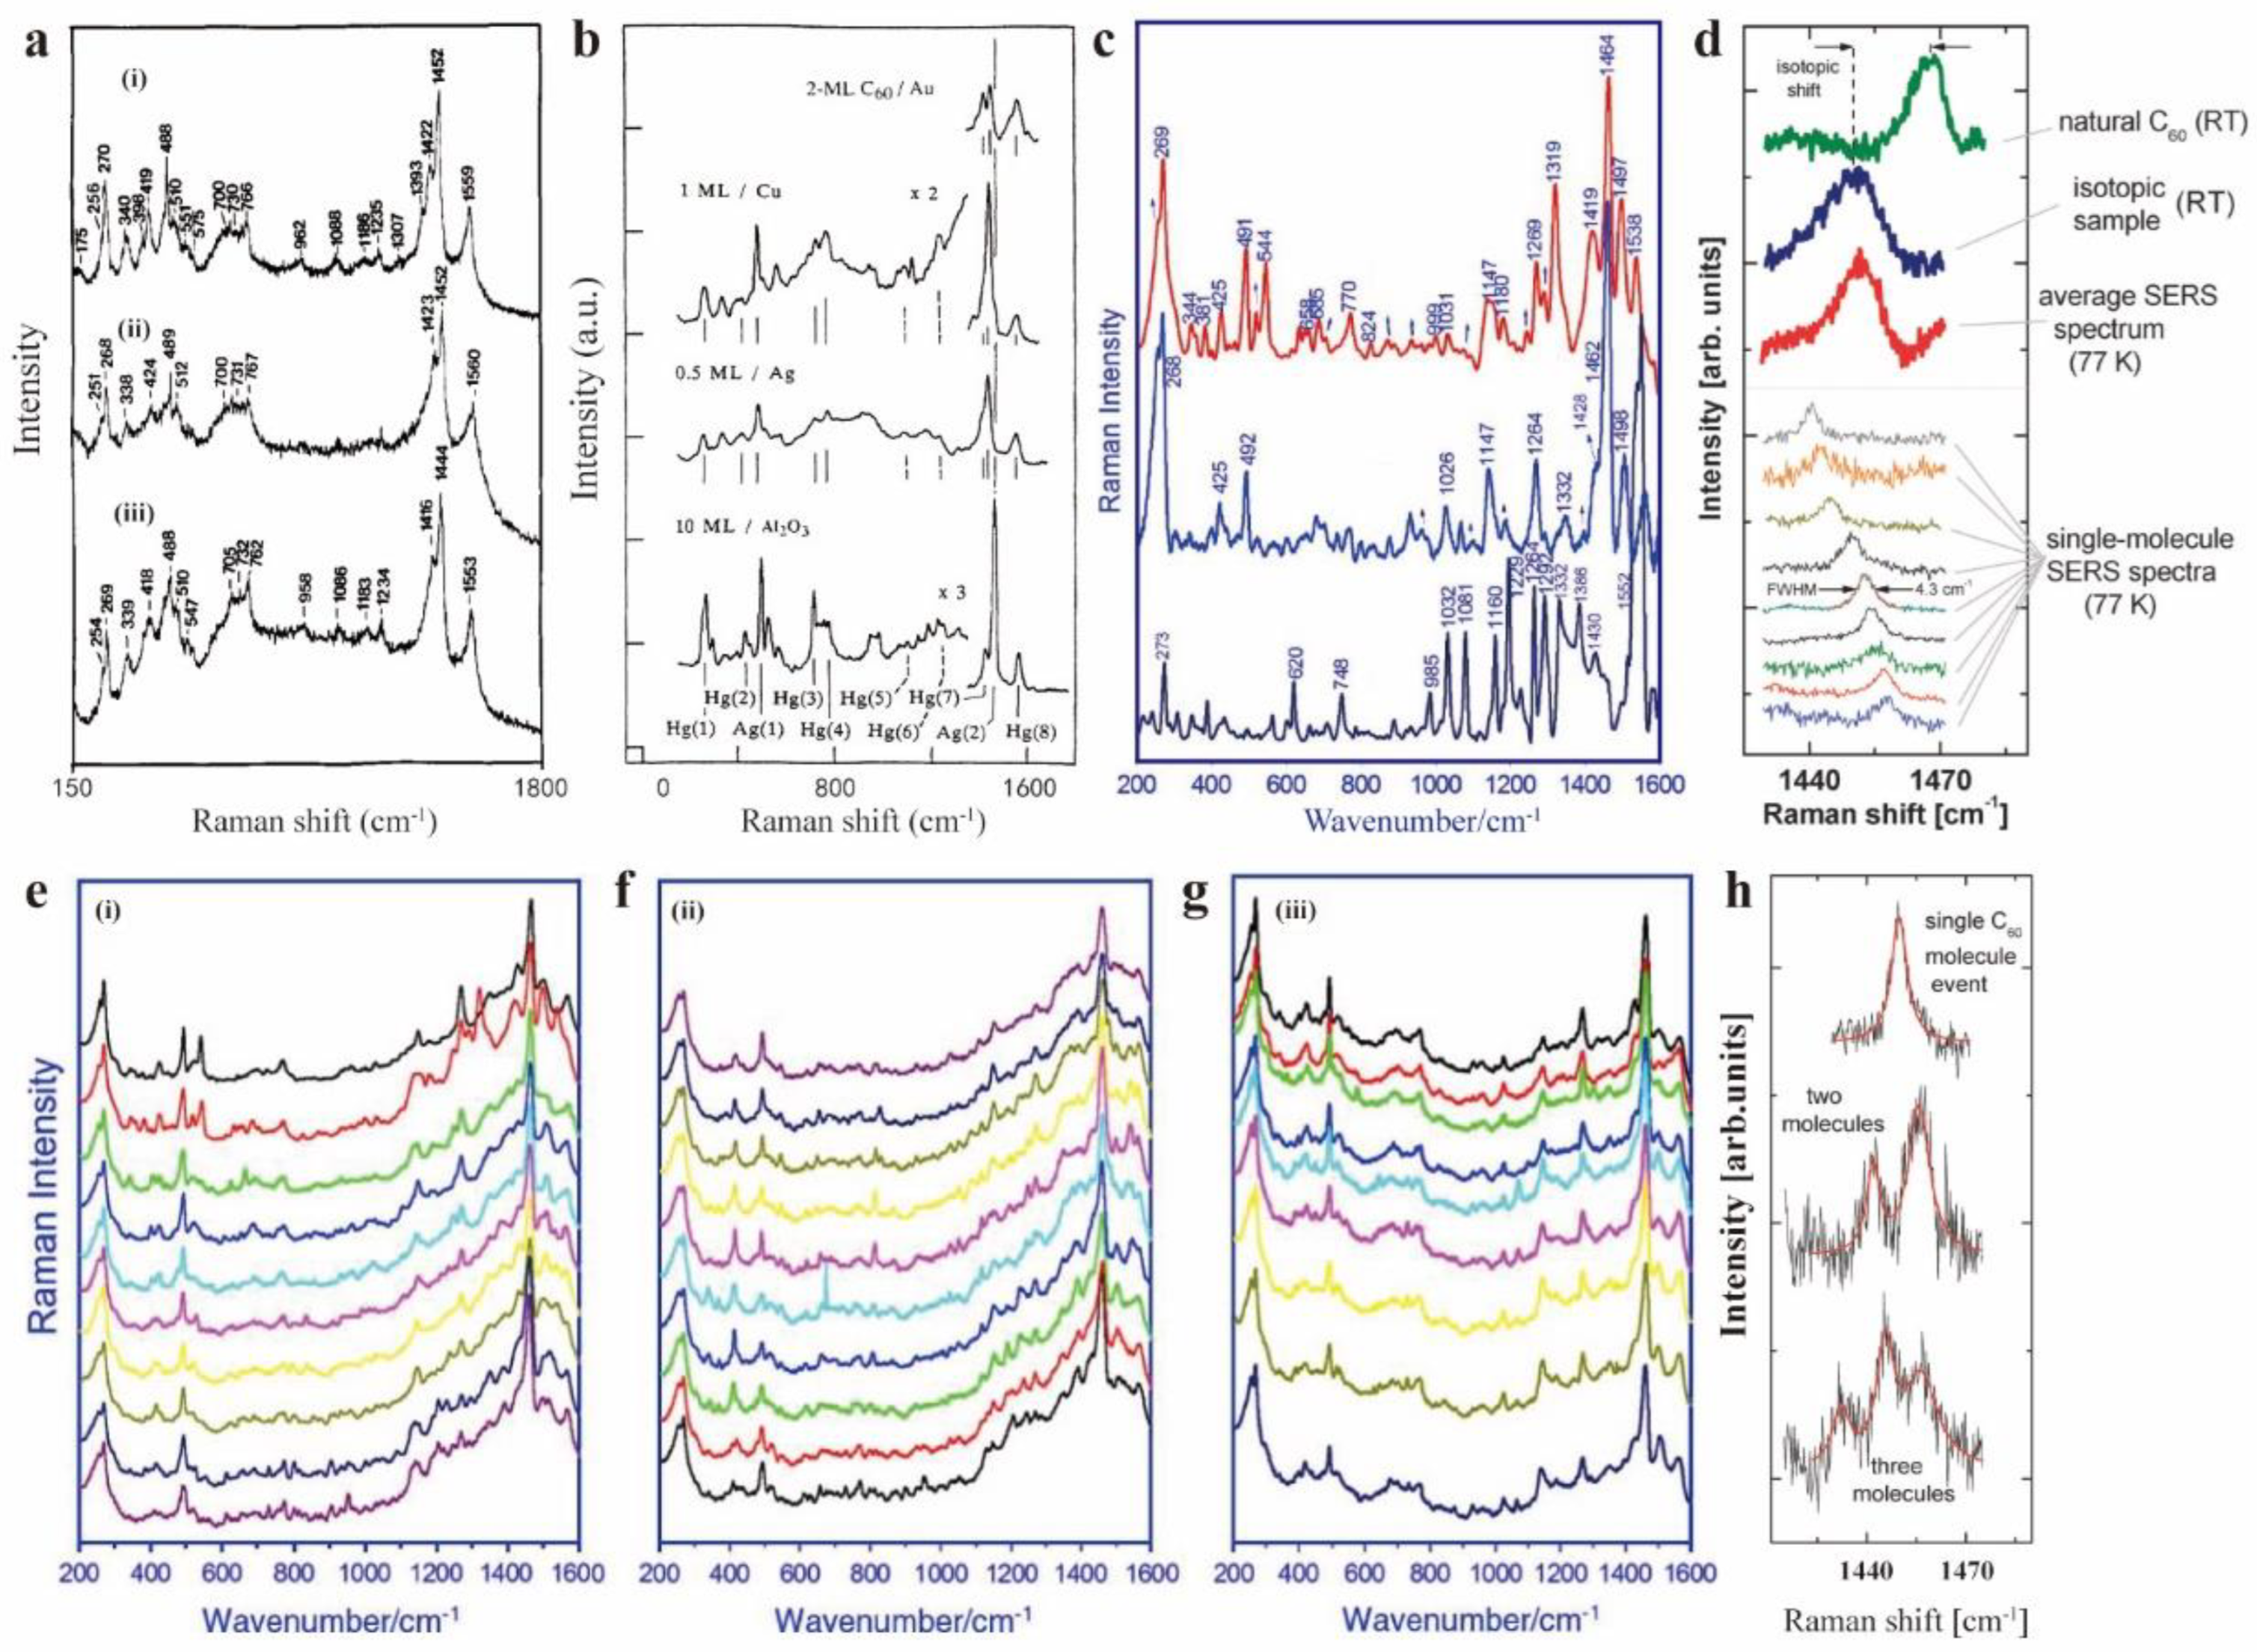
Figure 10.
Single-molecule junction and SERS spectra in [89]. (a) Conceptual scheme of the C60 single-molecule junction. (b) SERS spectrum of the C60 SMJ at a conductance value of 5 × 10⁻³ G0 (G0 = 2e2/h). (c) Observation ratio of different vibrational modes under the LC and HC states, respectively. (a-c) Reproduced with permission from [89]. Copyright 2021 American Chemical Society.
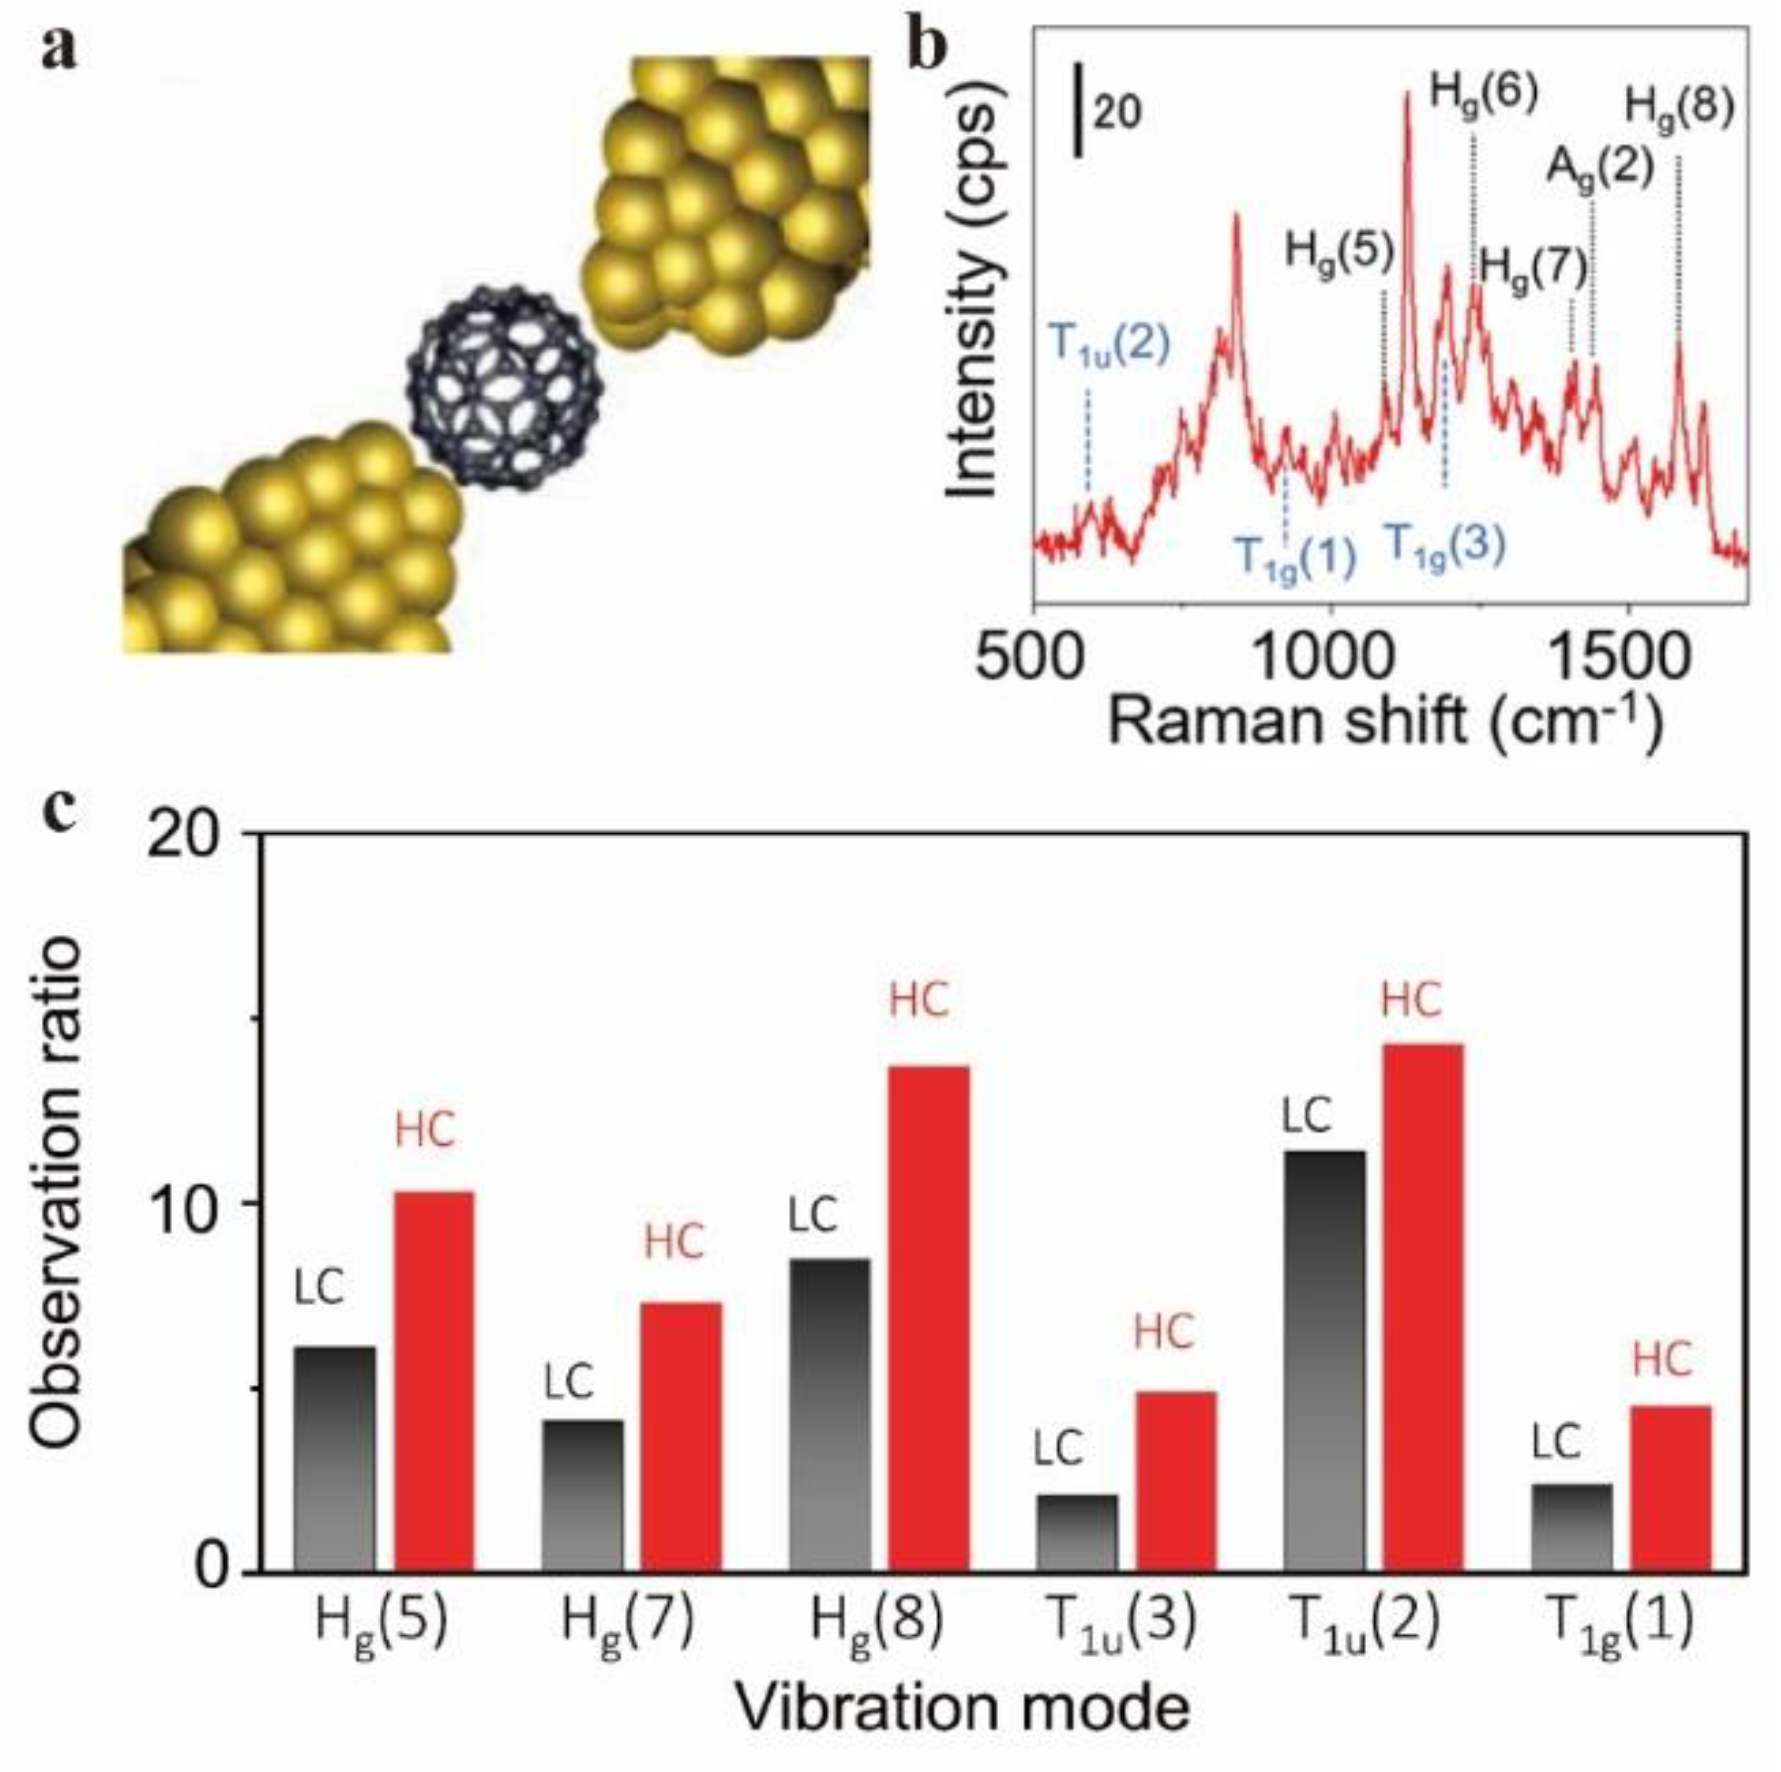
Figure 11.
(a) Conceptual scheme of TERS under tunneling and MPC situations, respectively. (b) Δz-dependent single C60 TERS spectra measured on Ag(111) surface. Left panel shows the simultaneously obtained jSTM−Δz curve. Right panel shows the intensity of Ag modes as a function of the Δz. Top and bottom panels show the TERS spectra in the tunneling and MPC regime, respectively. (a, b) Reproduced with permission from [99]. Copyright 2022 American Chemical Society. (c) and (d) IS, IaS, ρν (ρν ~exp(-ℏων/kT)) of the Ag(1) and Ag(2) modes as a function of Vbias under tunneling and MPC situation, respectively. (c, d) Reproduced with permission from [100]. Copyright 2022 American Chemical Society. (e) Waterfall plot for the evolution of anti-Stokes and Stokes TERS spectra with increasing bias voltages under MPC situation. Right chart shows the simultaneously recorded tunneling currents. (f) Effective temperature as a function of bias voltage processed from (e). Inset graph shows dI/dV curves before and after decomposition. Right figures show STM topography(top) and corresponding effective-temperature map (bottom, reconstructed from TERS spectrum) of the decomposed molecule surrounded by six intact C60. (e, f) Reproduced with permission from [101]. Copyright 2024 American Association for the Advancement of Science.
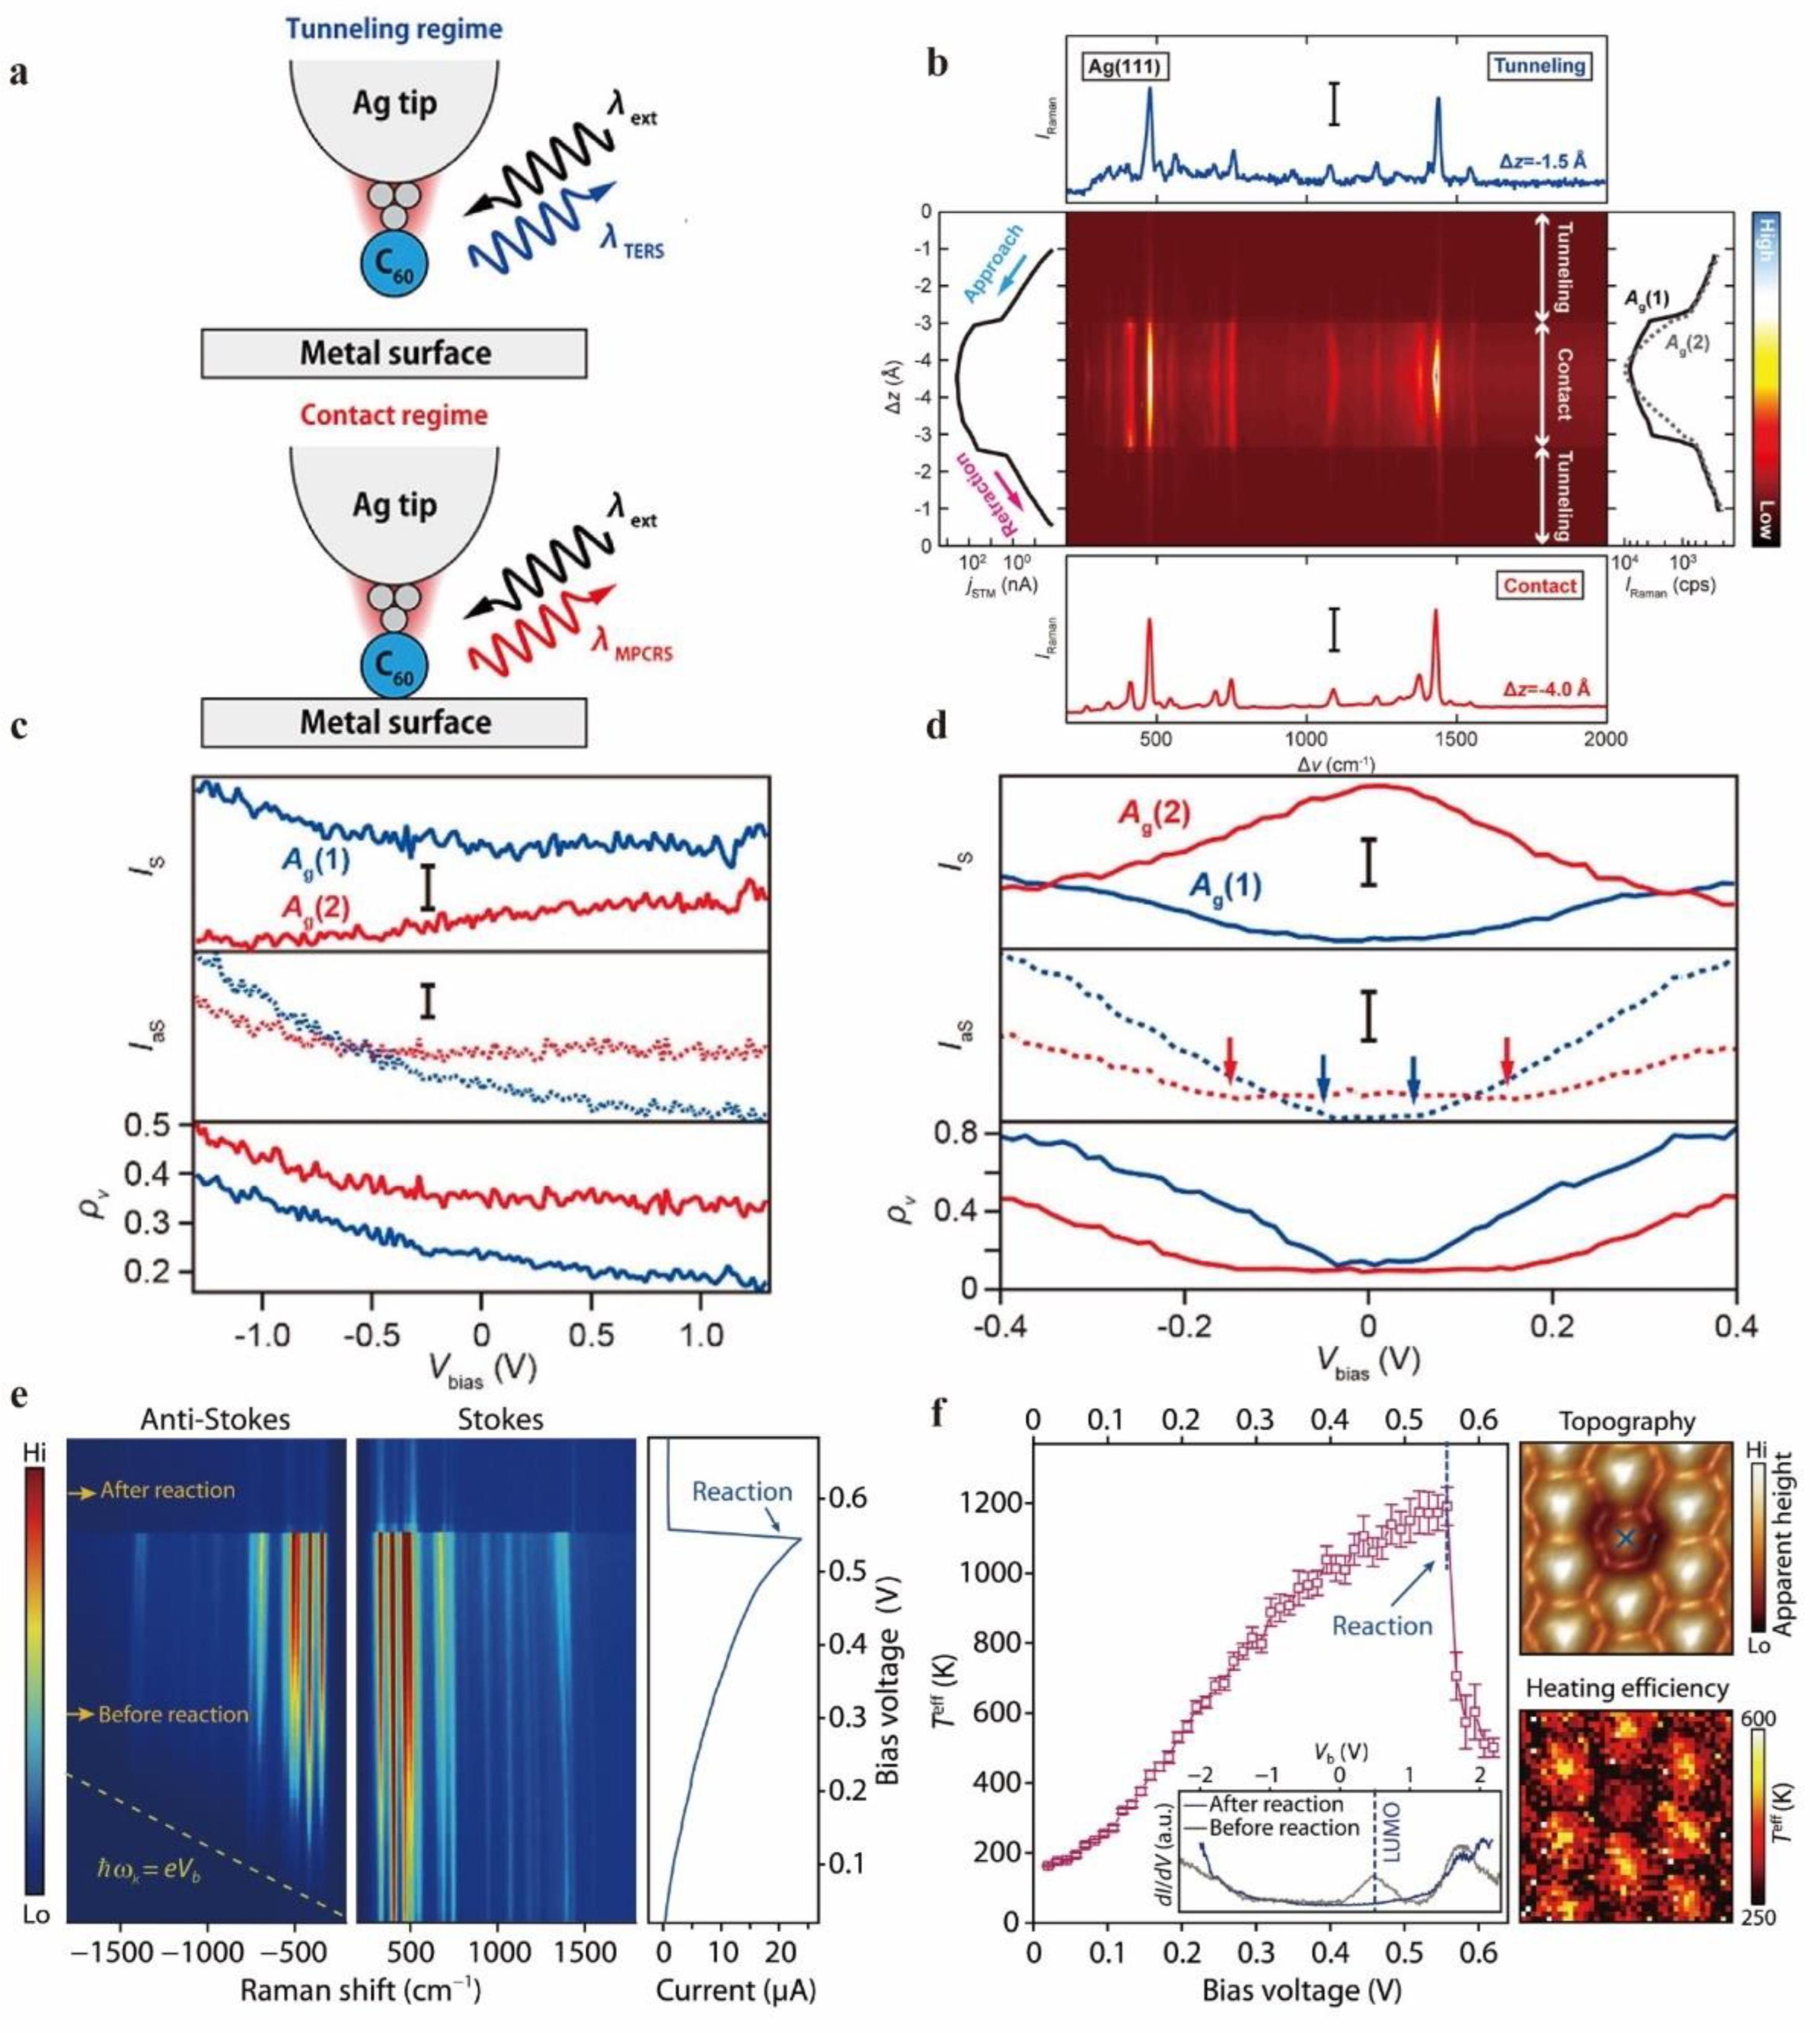

Table 1.
Different Raman peaks of fullerene (cm-1).
| Raman spectra(C60) | Raman spectra(C70) | |||||
| Symmetry | Symmetry | |||||
| Meilunas et al.(1991)[47] | Vincenzo et al.(2001)[49] | Luo and Yan(2005)[50] | Bethune et al.(1991)[51] | Jishi et al.(1993)[52] | ||
| Ag(1) | 496 | 496 | 497 | 228 | ||
| 459* | 455* | |||||
| Ag(2) | 1470 | 1468 | 1467 | 573* | 569* | |
| 739 | 737 | |||||
| Hg(1) | 273 | 264 | 273 | 1165 | ||
| 1260 | 1257 | |||||
| Hg(2) | 434 | 430 | 433 | 1471 | 1469 | |
| 261 | 258 | |||||
| Hg(3) | 710 | 709 | 709 | 400 | 399 | |
| 411 | 409 | |||||
| Hg(4) | 774 | 773 | 772 | 501 | 508 | |
| 704 | 701 | |||||
| Hg(5) | 1100 | 1101 | 1100 | 1062 | 1062 | |
| 1186* | 1182* | |||||
| Hg(6) | 1250 | 1251 | 1249 | 1231* | 1227* | |
| 1298 | 1296 | |||||
| Hg(7) | 1426 | 1426 | 1422 | 1317 | 1313 | |
| 1336 | 1335 | |||||
| Hg(8) | 1576 | 1585 | 1574 | 1370 | 1367 | |
| 1448 | 1447 | |||||
| 1569 | 1565 | |||||
| 714 | ||||||
| 770* | 766* | |||||
| 1459 | ||||||
| 1493 | ||||||
| 1517* | 1515* | |||||
* Raman peaks with uncertain vibration mode attribution.
Disclaimer/Publisher’s Note: The statements, opinions and data contained in all publications are solely those of the individual author(s) and contributor(s) and not of MDPI and/or the editor(s). MDPI and/or the editor(s) disclaim responsibility for any injury to people or property resulting from any ideas, methods, instructions or products referred to in the content. |
© 2024 by the authors. Licensee MDPI, Basel, Switzerland. This article is an open access article distributed under the terms and conditions of the Creative Commons Attribution (CC BY) license (http://creativecommons.org/licenses/by/4.0/).
Copyright: This open access article is published under a Creative Commons CC BY 4.0 license, which permit the free download, distribution, and reuse, provided that the author and preprint are cited in any reuse.


