
Submitted:
24 December 2024
Posted:
25 December 2024
You are already at the latest version
Abstract
Parkinson’s disease is a neurological disorder characterized by rigidity, bradykinesia and tremor. Several genetic and environmental causes of Parkinson’s disease are known, and there is emerging evidence of the possible contribution of the gut microbiome to the disease onset, severity, and response to therapy. While previous research has shown several differences in the microbiome of Parkinson’s disease patients under therapy, few prospective studies have included drug naïve patients. In order to evaluate the gut microbiome composition prior to therapy initiation, we collected and performed 16S rRNA gene sequencing of the stool samples from 49 drug naïve Parkinson’s disease patients and compared them to 34 diet and lifestyle-matched controls from the Croatian population (GiOPARK Project). While no significant alpha diversity difference was observed between the patients and controls, the differential relative abundance analysis showed an increase in Bacteroides fluxus, B. interstinalis, B. eggerthii, and Dielma fastidiosa in the drug naïve Parkinson’s disease patients compared to controls, while Alistipes, Barnesiella nd Dialister spp. were decreased in patients compared to controls. Insight into the gut microbiome of Parkinson’s disease patients prior to therapy implementation represents a valuable baseline dataset for further studies.
Keywords:
Parkinson’s disease
; microbiota
; drug naïve
; gut microbiome
; mediterranean diet
1. Introduction
Parkinson’s disease (PD) is a neurodegenerative disease presenting with the classical triad of symptoms, which include rigor, bradykinesia, and tremor [1], while also including a wide range of other motor and non-motor symptoms [2]. The primary pathophysiological mechanism is thought to lie in the accumulation of α-synuclein in the central nervous system, first in the substantia nigra, and then throughout the brain. This leads to the progressive loss of dopaminergic neurons, which in turn slowly leads to severe motor and cognitive impairment [3]. It is a multifactorial condition with genetic and environmental causes, with microbiota recently identified as a possible environmental contributor [4].
It is thought that the microbiota's role is most impactful in the prodromal, early stages of the disease [5], with the gut-brain axis acting as an essential mechanism through which microbiota could influence disease onset and progression [6]. Various potential pathways have been postulated by which this complex bidirectional system could operate, including the trans-neuronal propagation of α–synuclein through the vagal nerve [7,8], as well as loss of protective metabolic products such as short-chain fatty acids (SCFA), which are secreted by microbiota [5]. So far, microbiota composition has been shown to differ in PD patients compared to the healthy population. The observed differences have been proposed to be involved in the pathological retro-axonal transport potentially responsible for α–synuclein propagation into the central nervous system, even leading to prodromal symptoms such as hyposmia and gastrointestinal dysfunction [9]. Changes in the microbiome have also been implicated in motor symptom severity in later stages of the disease [10] and response to PD therapy, most notably levodopa [11].
Additionally, it has been shown that various therapeutic approaches targeting the microbiome could modulate disease course and severity, such as applying prebiotics [12] and probiotics [13], changes in diet [14], and even gut microbiota transplant (FMT) [15]. Antibiotics are known to alter the gut microbiome in a way that leaves the host susceptible to C. difficile infection [16]; however, certain antibiotics, such as rifampicin, have shown a beneficial effect in PD [17], while potentially inducing dysbiosis, even long after cessation [18].
Despite these recent advances in our understanding of the interplay of the microbiome and PD, as recently reviewed [19], only a limited number of studies have so far prospectively examined the differences in microbiome composition and metabolic function and their effect on motor and non-motor severity in PD and the microbiome composition changes over time under specific PD therapy. Therefore, determining the gut microbiome of drug naïve PD patients before therapy implementation represents a valuable baseline dataset for further studies. With this aim in mind, as part of our prospective epidemiological study of PD in Croatia (GiOPARK Project), we have enrolled 54 drug-naïve PD patients and 34 healthy controls to compare their gut microbiome composition using 16s rRNA sequencing.
2. Results
2.1. Characteristics of Participants
The demographic and clinical analysis of the study population, which included 83 individuals (49 patients with PD and 34 controls), revealed significant differences across several parameters that were assessed using epidemiological and clinical questionnaires (Table 1).
The significant differences between the PD and healthy controls were a higher number of females among the healthy cohorts, and the higher average age of PD (63.73 ± 11.94 vs. 46.47 ± 13.26, p<0.05). Expectedly, the PD group had more PD-positive family history compared to controls (10 vs. 2, p<0.05). While adherence to the Mediterranean diet was similar between groups (p=1.0), regular coffee consumption was significantly higher in controls than the PD group. Healthy controls also reported significantly more smoking and regular alcohol consumption, with significant association with wine but not beer (Table 1).
Expectedly, PD patients had higher average scores for UPDRS I, II, and III, with significant p-values (p<0.05), indicating greater motor and non-motor symptom severity. Non-motor symptom questionnaire (NMSQ) scores were also significantly elevated in the PD group (7.39 ± 5.21 vs. 3.29 ± 3.05, p<0.05). Cognitive function, assessed using the MOCA, was significantly lower in PD patients (25.94 ± 3.67) than in controls (29.35 ± 1.02, p<0.05). Surprisingly, gastrointestinal issues showed mixed results: constipation (p=0.879) and stool incontinence (p=0.055) did not show significant differences, while incomplete defecation was increased in PD patients (p<0.05) (Table 1).
2.2. 16S Sequencing Results
V3-V4 region 16S rRNA sequencing (MiSeq, Illumina) was performed on a total of 83 samples (49 PD and 34 controls), as previously described [20,21]. MiSeq sequencing generated a total of 16,167,580 paired raw reads that, after quality control and chimera removal, resulted in a total of 12,722,738 processed paired-end V3-V4 reads, with an average read count of 76,643 reads per sample (min = 34,785; max = 133,199). After the removal of singletons, doubletons, rare Amplicon sequence variants (ASV; occurring in less than 5% of samples), and unassigned taxa, sequences could be assigned to 1,5751 OTU (operational taxonomic units) in 83 samples. Of the identified 1,5751 OTUs, 521 could be resolved at least to the genus level.
2.3. Diversity and Composition of the Gut Microbiome
Our results showed a typically high gut microbial diversity in PD patients and controls alike. Microbial richness using alpha and beta diversity showed no statistically significant difference despite median alpha diversity appearing slightly lower in the PD group than in controls (Figure 1).
A similar relative abundance of bacterial phyla was observed in the gut microbiome of PD patients and healthy controls, with the dominant phyla being Bacteroidota (57.0%), Bacillota (formerly Firmicutes, 32.0%), and Pseudomonadota (5.0 %), followed by Actinomycetota, Fusobacteriota, Lentisphaerota, Synergistota, Verrucomicrobiota, Thermodesulfobacteriota, at less than 1.0 % of all bacteria present.
The family Bacteroidaceae represented 35.0% of total gut bacteria, followed by Lachnospiraceae (12.2%), Ruminococcaceae (10.0 %), Prevotellaceae (7.4%), Rikenellaceae (6.6%), Oscillospiraceae (6.0%), Tannerellaceae (3.5%), Sutterellaceae (2,9%), Christensenellaceae (2.7%), Barnesiellaceae (2.2%), Marinifilaceae (1.6%), Erysipelatoclostridiaceae (1.4%), Acidaminococcaceae (1.3%), Succinivibrionaceae (1.2%), Veillonellaceae (0.9%), and remaining 60 families adding to the total of 5.1 % of bacteria present. The relative abundance comparison of the top 20 microbial families in PD vs. healthy controls is shown in Figure 2.
2.4. Differential Relative Abundance Between PD Patients and Healthy Controls
The differential relative abundance analysis identified statistically significant differences in 9 genera from the phyla Bacteroidota and Bacillota (formerly Firmicutes) (Figure 3), which was expected as these are the most prevalent and diverse phyla (Figure 3). In PD patients, Bacteroides fluxus, B. intestinalis and B. eggerhii were increased more than fivefold compared to cohorts, as was Dielma fastidiosa, which was only present in three of the controls and in 18 of the PD patients (in low numbers in all of these samples). On the other hand, genera Alistipes, Barnesiella, Dialister and Prevotella_9, of unknown species, had more than 10-fold lower relative abundance in PD patients than controls (Figure 3).
3. Discussion
We investigated the characteristics of the gut microbiome in drug-naïve PD patients and healthy controls by sequencing the V3-V4 region of the 16S rRNA.
3.1. Microbiome Diversity
While a recent meta-analysis has shown that alpha diversity may be increased in PD patients as opposed to healthy controls, which has been attributed to a decrease in the abundance of dominant bacterial species and an increase in the abundance of rare bacterial taxa [20], we found that microbial richness measured using alpha and beta diversity showed no statistically significant difference. The possible explanation for this is that contrary to previous studies, our study population is comprised of early phase drug-naïve patients and that the differences between patients and controls become more pronounced as the disease progresses and dopaminergic therapy is implemented.
3.2. Relative Abundance of Individual Taxa
In our study, the dominant taxa that showed a difference in relative abundance belonged to the phyla Bacteroidota and Bacillota (formerly Firmicutes), which was expected given that changed Bacteroidota/Firmicutes ratios have previously been observed in other studies [21]. The Bacteroides fluxus, B. intestinalis and B. eggerthii showed more than a fivefold increase in relative abundance in PD patients, while several unidentified additional Bacteroides spp. showed a decrease in abundance (Figure 3). Similarly, two studies previously identified Bacteroides of unknown species as having a decreased relative abundance in PD patients [29,30].
Previous studies have shown that relative abundance of B. eggerthii is increased in PD patients and was linked with hyposmia [22,23]. To our knowledge, neither B. intestinalis nor B. fluxus have individually been shown to be increased in PD. However, B. intestinalis has previously been correlated with neuroinflammation, most notably in Alzheimer’s disease [24]. On the other hand, the abundance of B. fluxus was observed as increased in patients with sarcopenia [25], which is one of the accompanying clinical features of PD. Other members of the Bacteroides, such as B. fragilis, have been similarly shown to have a higher relative abundance in PD patients [28].
Interestingly, while both the family Rikenellaceae [31] and the genus Alistipes were shown as increased in abundance in PD patients in previous studies [32,33], in our study Alistipes spp. showed a decrease in relative abundance. Whether this observed difference is due to the differences in study design, diet or therapy of the patients remains to be determined. Another member of the Bacteroidota phylum, which has continuously been shown to have a reduced relative abundance in PD as opposed to healthy controls is the family Prevotellaceae, in particular its genus Prevotella [34,35], with Aho et al. hypothesizing a link between this decrease with a faster-progressing disease phenotype [36]. In our study, a single member of this family, the ASV of genus Prevotella_9 of unknown species, was shown to be decreased in drug-naïve PD patients, with no changes shown on the family level.
The second phylum in our study that showed a difference between PD patients and healthy controls was the Bacillota phylum (previously called Firmicutes), with its relative abundance being increased in PD compared to controls, which is in line with previous research. A member of the Erysipelotrichaceae family, the species Dielma fastidiosa, was found in several patients and only a few controls in our cohort. To our knowledge, the Dielma genus, named after a village in Dielmo, Senegal, has so far been described in a limited number of cases, both in a healthy individual and in a bacteraemia patient [37]. A study into IgA-biome profiles and their correlation with PD phenotype (akinetic or tremor dominant), has also identified D. fastidiosa in PD patients, but the species was not associated with a pro-inflammatory profile that could drive dysbiosis [21,38].
An unknown species of the genus Dialister (phylum Bacillota, family Veillonellaceae) was also identified as having a lower relative abundance. In line with our study, Dialister invisus has been shown to be lower in PD patients in the US population [38]. However, the genus Dialister has previously been shown to have a higher relative abundance in PD patients in a Southern China population [33], which may reflect dietary or other geographical differences.
A study conducted by Kwon et. al, showed that specific dietary habits influence levels of SCFA bacteria, with a better diet increasing the levels of SCFA- producing bacteria, such as Butyricicoccus, Coprococcus 1, and Romboutsia, while on the other hand, it has been shown that higher sugar intake lowered the levels of said taxa. The primary SCFA these bacteria produce is butyrate, which is beneficial for enteric function and its immunological integrity [39]. Interestingly, we did not observe a difference between these groups in our cohort, so it appears not to be the case at least in drug-naïve PD patients, such as ours. Another possible explanation for the lack of difference in the SCFA-producing bacteria could be our strict exclusion criteria, with which we attempted to minimize, or at least account for, the factors that are known to affect the microbiome. Indeed, our cohorts did not show significant differences in their diet, which was mostly the Mediterranean diet, previously shown to be beneficial in PD [40]. Additionally, we made sure both our patient group and control groups didn’t have pre-existing conditions that could affect intestinal motility and there was no antibiotic or probiotic usage involved.
Therefore, apart from the sample size, which was similar to that in other studies currently conducted in this field, our chief limitation regarding the cohort was the observed age differences. So far, advanced age (60+) has been identified as a factor that could contribute to changes in microbiota composition with a higher number of Enterobacteriaceae and Bacteroidetes and a decrease in Bacillota (formerly Firmicutes), Bifidobacteria, Clostridium cluster XIV and Faecalibacterium detected in older populations [41]. Other bacterial taxa have also been shown to change in composition such as Clostridium bolteae, Escherichia coli, Escherichia unclassified, Parabacteroides distasonis, Parabacteroides unclassified, and Ruminococcus gnavus [42]. However, in a study conducted by Bartosh et al. it has been found that in healthy older populations with no pronounced comorbidities, there were no significant changes in the gut microbiome when compared to younger populations, while in the elderly group that was hospitalized or was taking antibiotics, these changes were more apparent [43]. In the previously mentioned studies conducted by Petrov et al. and Vellascari the patients were either age-matched [29] or there was a difference in mean age of almost twenty years [30], yet they showed similar results. Age-related changes in the gut microbiome could thus be interpreted as a result of individual factors, such as general physiological deterioration that leads to decreased mobility and thus also a decreased intestinal motility, while factors like diet and medication for various comorbidities, which could follow older age, could in turn further alter microbiome composition [44,45]. In conclusion, it is unlikely that the differences we have observed are due to the difference in age between the cohorts.
3.3. Correlation of Microbial Abundance and Clinical Features of PD
We previously conducted a systematic review, revealing a limited number of studies that correlated microbiome abundance with PD symptom severity [19]. Positive correlation of relative abundance with motor symptom severity as expressed by UPDRS III scores was found with families Lactobacillaceae [32] and Enterobacteriaceae [46], genera such as Flavonifractor, Peptococcus [47], Phascolarctobacterium, Coprococcus, Akkermansia [32], Clostridium cluster XIVa [48] and species such as Ruminoccoccus sp AM07-15 [49] and E. coli [50]. On the other hand, negative correlation between relative abundance and motor symptom severity was shown for families Lachnospiraceae, [51], Prevotellaceae [35,36], and genera Blautia [52], Prevotella [36], and Paraprevotella [47].
Relative abundance was also positively correlated with non-motor symptom severity, such as in the case of cognitive decline as expressed by MMSE and MOCA scores. This was shown in the cases of the family Lactobacillaceae [32] and genera Ruminococcus, Acidaminococcus, Barnesiella, Sutterella and Alistipes [53]. A negative correlation between relative abundance and non-motor symptom severity has been found in the cases such as the family Christensenellaceae [51] and genera such as Clostridium XIV b and Butyriococcus [54].
How microbiota modulates PD symptoms and progression is still a matter of debate with various mechanisms such as the gut-brain axis retro-vagal transport [8], where it has been hypothesized that misfolded α-synuclein was transported from the intestines to the brain [55], or through short-chain fatty acids [49]. Previously, a pro-inflammatory Ruminococcuss spp. was linked with higher plasma propionic levels, which showed a positive correlation with UPDRS III scores [49]. For example, the genus Prevotella on the other hand is associated with a higher butyric acid production, which has been hypothesized to postpone the age of onset in PD [36].
In our study, we found an increase in the relative abundance of the Bacillota phylum (formerly Firmicutes) members of the classes Clostridia and Bacilli and a decrease in Negativicutes (Dialister spp.). Previously, an increase in the relative abundance of various members of this phylum has been shown to have a positive correlation with symptom severity and may, therefore, be an indicator of disease progression [47,49,56,53,57].
Similarly, members of the Bacteroides genus, of which several species were increased in our study, have also previously shown a positive correlation between their relative abundance and UPDRS III [58]. A follow-up focusing on the abundance of said taxa and UPDRS III scores could see whether there is a correlation between the two in our study group. In a previously mentioned study conducted by Ren et al., the relative abundance of genera Barnesiella and Alistipes, is higher in PD patients compared to controls, with signs of mild cognitive impairment, presenting with lower MMSE and MoCA scores [53]. In our study, both of these taxa had a lower relative abundance compared to controls and further examination of both the relative abundance and cognitive symptoms is warranted to highlight whether there is a correlation between the two.
Dopaminergic medication has previously been linked with changes in microbiome, with certain taxa, such as E. faecalis, being more pronounced in moderate responders to levodopa than in good responders [59]. In other cases, it has been shown that H. pylori not only has an effect on symptom severity but also on levodopa availability [60]. A major strength of our study is the inclusion of only drug-naïve patients, which removes therapy as a possible major confounder considering the oral administration of medication in all first-line therapies for PD. By clearly identifying therapy-associated taxa in PD patients, it may be possible to anticipate the therapeutic response depending on the gut microbiome “type” in the future, as well as influence the microbiome through the use of probiotics, prebiotics or microbial transplantation [15,61].
4. Conclusions
To conclude, our study shows that drug-naïve PD patients do not yet show significant differences in alpha diversity compared to healthy controls, something which has been previously observed in patients with therapy, while the relative abundance comparisons showed several differences observed in previous research. We observed differences in relative abundance of members of the phyla Bacteroidetes and Bacillota (formerly Firmicutes) between PD patients and healthy controls. Species Bacteroides fluxus, B. intestinalis, B. eggerhii and Dielma fastidiosa demonstrated an increase in relative abundance in PD patients as opposed to healthy controls, whereas we observed a decrease in relative abundance of Alistipes, Barnesiella and Dialister, and Prevotella_9 of unknown species.
Our research is one of only a few microbiome studies on drug-naïve PD patients, and the first of its kind in the Croatian population and represents an important baseline for further research of the role of microbiota in Parkinson’s’ disease.
5. Materials and Methods
5.1. Ethics Statement
The study was approved by the Ethical Committee of the Medical Faculty in Rijeka, Croatia (2170-24-04-3-19-2) as well as the Ethical Committee of the Clinical Hospital Centre in Rijeka, Croatia (2170-29-02/1-19-2) and was conducted according to the principles in the Declaration of Helsinki. All individuals included in the research provided written informed consent before recruitment.
5.2. Sample Collection and Clinical Assessment
Patient and control selection, as well as sample collection was conducted at the Clinic for Neurology, Clinical Hospital Centre in Rijeka, Croatia. Analysis was conducted at the Clinical Institute of Genomic Medicine, UMC Ljubljana, Slovenia.
The inclusion criteria for the study included a diagnosis of PD, made according to the Movement Disorder Society Clinical Diagnostic criteria, for which the patients have not yet started treatment (drug-naïve). The healthy control group was chosen from volunteers from the same geographical region to match the patients’ characteristics. Exclusion criteria for both groups included: adherence to special diets, chronic intestinal inflammation, any type of autoimmune disease, acute infectious diseases, acute active inflammation, major gastrointestinal surgeries in medical history, active use of antibiotics, probiotics, nutritional supplements, corticosteroids, or other immunosuppressive drugs.
Initially, 54 Parkinson disease patients were screened for the GIOPARK study. 2 cases were excluded due to chronic inflammatory bowel conditions and 3 withdrew from participation. Finally, 16S rRNA Sequencing was performed for a total of 49 PD patients, and 34 healthy controls.
Upon initial examination, both groups filled out the following epidemiological and clinical questionnaires/scales. The epidemiological questionnaire dealt mainly with daily and weekly intake of various produce, type of diet as well as other habits such as smoking, drinking and coffee consumption (Supplementary data 1). In our analysis we focused mainly on whether or not our patients followed a Mediterranean diet plan. Besides those, we used the Holmes-Rahe Lifestyle Stress Inventory [62] as well as the NSAD (National Stress Assessment Day) Questionnaire [63]. We used the Unified Parkinson’s disease Rating Scale (UPDRS)[64] in both groups to test for motor and non-motor symptom severity. Non-motor symptoms were further evaluated through the Non-Motor Symptom Questionnaire [65] and cognitive status was evaluated through the Montreal Canada Cognitive Assessment (MoCA).
5.3. Bacterial DNA Isolation, 16S rRNA Gene Amplification and Sequencing, and Bioinformatics Analysis
The gut swabs for genomic bacterial DNA isolation were transferred to the laboratory in the Amies transport medium and stored at -80°C until isolation.
Isolation was performed as previously described [66]. Briefly, mechanical and enzymatic lysis using lysozyme was performed as described by Ravel et al. [67]. Bacterial DNA was obtained from the lysate swab medium using QIAamp DNA Mini Kit (QIAGEN, Hilden, Germany) according to the manufacturer’s instructions for gut/stool sample extraction. DNA concentrations were measured using a Qubit dsDNA high-sensitivity assay kit (Thermo Fisher Scientific).
Bacterial 16S rRNA was amplified using PCR with an Illumina adapter containing primers 341F and 805R for the informative V3-V4 region, and the PCR products were visualized on an agarose gel before proceeding to clean-up and indexing.
The amplicons of each sample were labeled with Nextera XT Indexes, and sequencing libraries were prepared according to the standardized 16S Metagenomic Sequencing Library Preparation Protocol (Illumina®). Libraries of pooled samples were sequenced on the Illumina MiSeq sequencer according to the manufacturer's specifications in the 2×300 bp pair-end runs (MiSeq Reagent kit v3).
5.4. Bioinformatics Analysis
Bioinformatics analyses were performed in R environment version 4.3.3. using the Bioconductor workflow adapted from Callahan et al. [68].
Briefly, sequence data consisting of demultiplexed FASTQ files with at least 30 Phred scores were trimmed and filtered using DADA2 [69]. Trimming was performed on joint reads so that the first 17 forward reads and the first 21 reverse reads were trimmed to remove primers, and forward reads were truncated to 250 and reverse reads to 230 in length. No ambiguous base calls were allowed, and filtering parameters were set to a maximum of 2 expected errors per read pair. Quality scores and error rates were assessed separately for all runs to minimize batch effects resulting from run variability. All runs contained a balanced representation of PD and control samples.
Amplicon sequence variants (ASV) were inferred, and chimeric sequences were removed using DADA2 [69,70], as previously described [66,71]. Taxonomical classification of amplicon sequence variants was determined using the RDP version 18 [72] and Silva v138.1 [73]. Sequence, taxonomic and clinical data were combined into a single object using the phyloseq package for R (version 1.46.0) [74].
5.5. Statistical Analysis
To compare the clinical characteristics and health-related measures between patients and healthy controls, we employed several statistical tests depending on the nature of the data and its distribution. Prior to selecting the appropriate statistical test, we assessed the normality of the distribution for each variable using the Shapiro-Wilk test. A p-value greater than 0.05 was considered indicative of a normally distributed variable. In cases where both groups (patients and healthy controls) showed a normal distribution for a given variable, we used the independent samples t-test. For variables that did not meet the assumption of normality, the Mann-Whitney U test was utilized to compare the distributions between patients and healthy controls. To evaluate the association between categorical variables (e.g., dietary habits, smoking, genetics) and group membership (patients vs. healthy controls), we used the Chi-square test of independence. A p-value less than 0.05 was considered statistically significant. All statistical analysis was performed using the JASP software (University of Amsterdam, Netherlands).
Statistical analyses of the microbiome were performed in R version 4.3.3 using the vegan package version 2.6-2 [75] and DESeq2 version 1.42.1 [76]. The prevalence threshold was set at 5% of the total samples. Rarefaction without replacement was performed to even depth [77]. The microbial richness and alpha diversity of the sample groups were visualized using Chao1 and the Simpson diversity index, as implemented in the phyloseq package (version 1.46.0) [74]. Beta diversity was visualized by generating Principal Coordinate Analysis (PCoA) using unweighted UniFrac as distance in the phyloseq and ggplot2 package for R [74,78].
The differential relative abundance of ASV and corresponding taxonomic groups was calculated using DESeq2 version 1.42.1 [76]. Samples were normalized using the Wald test, and the default Benjamini-Hochberg correction implemented in the DESeq function was used for multiple-inference correction.
Supplementary Materials
The following supporting information can be downloaded at the website of this paper posted on Preprints.org, Table S1: Questionnaire on lifestyle habits (in Croatian).
Author Contributions
BP, VV, VR, GH, MK and AK conceived and designed the study. VV, EP, MH, GR, VV and VR collected the samples and data and analyzed data from the patients. NSČ and SO extracted and prepared DNA from the collected samples for sequencing. AK, ANZ, and AM performed sequencing experiments and analyzed the data. EP, VR and ANZ performed the statistical analyses. AK, ANZ, EP, and VR wrote the manuscript. All authors contributed to the manuscript revision and approved the final manuscript.
Funding
This research was funded by the University of Rijeka grant (uniri-biomed-18-1981353) and the Croatian Science Foundation grant (IP-2019-04-7276).
Institutional Review Board Statement
The study was conducted in accordance with the Declaration of Helsinki and was approved by the Ethical Committee of the Medical Faculty in Rijeka, Croatia (2170-24-04-3-19-2) as well as the Ethical Committee of the Clinical Hospital Centre in Rijeka, croatia (2170-29-02/1-19-2).
Informed Consent Statement
The participants provided their written informed consent to participate in this study.
Data Availability Statement
The datasets generated for this study can be found in the Sequence Read Archive (NCBI) repository, BioProject PRJNA1196315, http://www.ncbi.nlm.nih.gov/bioproject/1196315.
Conflicts of Interest
The authors declare that the research was conducted without any commercial or financial relationships that could be construed as a potential conflict of interest.
References
- Kouli, A.; Torsney, K.M.; Kuan, W.-L. Parkinson’s Disease: Etiology, Neuropathology, and Pathogenesis. In Parkinson’s Disease: Pathogenesis and Clinical Aspects; Codon Publications, 2018; pp. 3–26 ISBN 978-0-9944381-6-4.
- Poewe, W.; Seppi, K.; Tanner, C.M.; Halliday, G.M.; Brundin, P.; Volkmann, J.; Schrag, A.-E.; Lang, A.E. Parkinson Disease. Nature Reviews Disease Primers 2017, 3, 17013. [Google Scholar] [CrossRef] [PubMed]
- Shulman, J.M.; De Jager, P.L.; Feany, M.B. Parkinson’s Disease: Genetics and Pathogenesis. Annual Review of Pathology: Mechanisms of Disease 2011, 6, 193–222. [Google Scholar] [CrossRef] [PubMed]
- Fitzgerald, E.; Murphy, S.; Martinson, H.A. Alpha-Synuclein Pathology and the Role of the Microbiota in Parkinson’s Disease. Frontiers in Neuroscience 2019, 13. [Google Scholar] [CrossRef] [PubMed]
- Shen, T.; Yue, Y.; He, T.; Huang, C.; Qu, B.; Lv, W.; Lai, H.Y. The Association Between the Gut Microbiota and Parkinson’s Disease, a Meta-Analysis. Frontiers in Aging Neuroscience 2021, 13. [Google Scholar] [CrossRef] [PubMed]
- Carabotti, M.; Scirocco, A.; Maselli, M.A.; Severi, C. The Gut-Brain Axis: Interactions between Enteric Microbiota, Central and Enteric Nervous Systems. Annals of Gastroenterology 2015, 28, 203–209. [Google Scholar]
- Breit, S.; Kupferberg, A.; Rogler, G.; Hasler, G. Vagus Nerve as Modulator of the Brain-Gut Axis in Psychiatric and Inflammatory Disorders. Frontiers in Psychiatry 2018, 9, 44. [Google Scholar] [CrossRef] [PubMed]
- Kim, S.; Kwon, S.H.; Kam, T.I.; Panicker, N.; Karuppagounder, S.S.; Lee, S.; Lee, J.H.; Kim, W.R.; Kook, M.; Foss, C.A.; et al. Transneuronal Propagation of Pathologic α-Synuclein from the Gut to the Brain Models Parkinson’s Disease. Neuron 2019, 103, 627–641.e7. [Google Scholar] [CrossRef] [PubMed]
- Pereira, P.A.B.; Aho, V.T.E.; Paulin, L.; Pekkonen, E.; Auvinen, P.; Scheperjans, F. Oral and Nasal Microbiota in Parkinson’s Disease. Parkinsonism and Related Disorders 2017, 38, 61–67. [Google Scholar] [CrossRef]
- Sampson, T.R.; Debelius, J.W.; Thron, T.; Janssen, S.; Shastri, G.G.; Ilhan, Z.E.; Challis, C.; Schretter, C.E.; Rocha, S.; Gradinaru, V.; et al. Gut Microbiota Regulate Motor Deficits and Neuroinflammation in a Model of Parkinson’s Disease. Cell 2016, 167, 1469–1480.e12. [Google Scholar] [CrossRef] [PubMed]
- Keshavarzian, A.; Engen, P.; Bonvegna, S.; Cilia, R. The Gut Microbiome in Parkinson’s Disease: A Culprit or a Bystander? In Progress in Brain Research; Elsevier B.V., 2020; Vol. 252, pp. 357–450 ISBN 978-0-444-64260-8.
- Cantu-Jungles, T.M.; Rasmussen, H.E.; Hamaker, B.R. Potential of Prebiotic Butyrogenic Fibers in Parkinson’s Disease. Front Neurol 2019, 10, 663. [Google Scholar] [CrossRef]
- Liu, J.; Xu, F.; Nie, Z.; Shao, L. Gut Microbiota Approach—A New Strategy to Treat Parkinson’s Disease. Front Cell Infect Microbiol 2020, 10, 570658. [Google Scholar] [CrossRef]
- Hegelmaier, T.; Lebbing, M.; Duscha, A.; Tomaske, L.; Tönges, L.; Holm, J.B.; Bjørn Nielsen, H.; Gatermann, S.G.; Przuntek, H.; Haghikia, A. Interventional Influence of the Intestinal Microbiome Through Dietary Intervention and Bowel Cleansing Might Improve Motor Symptoms in Parkinson’s Disease. Cells 2020, 9, 376. [Google Scholar] [CrossRef] [PubMed]
- Xue, L.-J.; Yang, X.-Z.; Tong, Q.; Shen, P.; Ma, S.-J.; Wu, S.-N.; Zheng, J.-L.; Wang, H.-G. Fecal Microbiota Transplantation Therapy for Parkinson’s Disease. Medicine (Baltimore) 2020, 99, e22035. [Google Scholar] [CrossRef] [PubMed]
- Patangia, D.V.; Anthony Ryan, C.; Dempsey, E.; Paul Ross, R.; Stanton, C. Impact of Antibiotics on the Human Microbiome and Consequences for Host Health. Microbiologyopen 2022, 11, e1260. [Google Scholar] [CrossRef]
- Li, J.; Zhu, M.; Rajamani, S.; Uversky, V.N.; Fink, A.L. Rifampicin Inhibits Alpha-Synuclein Fibrillation and Disaggregates Fibrils. Chem Biol 2004, 11, 1513–1521. [Google Scholar] [CrossRef]
- Diallo, D.; Somboro, A.M.; Diabate, S.; Baya, B.; Kone, A.; Sarro, Y.S.; Kone, B.; Diarra, B.; Diallo, S.; Diakite, M.; et al. Antituberculosis Therapy and Gut Microbiota: Review of Potential Host Microbiota Directed-Therapies. Front Cell Infect Microbiol 2021, 11, 673100. [Google Scholar] [CrossRef]
- Papić, E.; Rački, V.; Hero, M.; Tomić, Z.; Starčević-Čižmarević, N.; Kovanda, A.; Kapović, M.; Hauser, G.; Peterlin, B.; Vuletić, V. The Effects of Microbiota Abundance on Symptom Severity in Parkinson’s Disease: A Systematic Review. Front Aging Neurosci 2022, 14, 1020172. [Google Scholar] [CrossRef]
- Romano, S.; Savva, G.M.; Bedarf, J.R.; Charles, I.G.; Hildebrand, F.; Narbad, A. Meta-Analysis of the Parkinson’s Disease Gut Microbiome Suggests Alterations Linked to Intestinal Inflammation. npj Parkinsons Dis. 2021, 7, 1–13. [Google Scholar] [CrossRef]
- Brown, E.L.; Essigmann, H.T.; Hoffman, K.L.; Alexander, A.S.; Newmark, M.; Jiang, Z.-D.; Suescun, J.; Schiess, M.C.; Hanis, C.L.; DuPont, H.L. IgA-Biome Profiles Correlate with Clinical Parkinson’s Disease Subtypes. JPD 2023, 13, 501–513. [Google Scholar] [CrossRef]
- Izhboldina, O.; Zhukova, I.; Zhukova, N.; Alifirova, V.; Latypova, A.; Mironova, J.; Nikitina, M. Feature Olfactory Dysfunction and Gut Microbiota in Parkinson’s Disease. Journal of the Neurological Sciences 2017, 381, 1055. [Google Scholar] [CrossRef]
- Jo, S.; Kang, W.; Hwang, Y.S.; Lee, S.H.; Park, K.W.; Kim, M.S.; Lee, H.; Yoon, H.J.; Park, Y.K.; Chalita, M.; et al. Oral and Gut Dysbiosis Leads to Functional Alterations in Parkinson’s Disease. npj Parkinsons Dis. 2022, 8, 87. [Google Scholar] [CrossRef] [PubMed]
- Luo, Y.-X.; Yang, L.-L.; Yao, X.-Q. Gut Microbiota-Host Lipid Crosstalk in Alzheimer’s Disease: Implications for Disease Progression and Therapeutics. Molecular Neurodegeneration 2024, 19, 35. [Google Scholar] [CrossRef] [PubMed]
- Wang, Y.; Zhang, Y.; Lane, N.E.; Wu, J.; Yang, T.; Li, J.; He, H.; Wei, J.; Zeng, C.; Lei, G. Population-based Metagenomics Analysis Reveals Altered Gut Microbiome in Sarcopenia: Data from the Xiangya Sarcopenia Study. Journal of cachexia, sarcopenia and muscle 2022, 13, 2340–2351. [Google Scholar] [CrossRef] [PubMed]
- Cai, Y.; Feng, F.; Wei, Q.; Jiang, Z.; Ou, R.; Shang, H. Sarcopenia in Patients With Parkinson’s Disease: A Systematic Review and Meta-Analysis. Front Neurol 2021, 12, 598035. [Google Scholar] [CrossRef] [PubMed]
- Wang, Q.; Liu, Y.; Zhou, J. Neuroinflammation in Parkinson’s Disease and Its Potential as Therapeutic Target. Transl Neurodegener 2015, 4, 19. [Google Scholar] [CrossRef]
- Tan, A.H.; Chong, C.W.; Lim, S.Y.; Yap, I.K.S.; Teh, C.S.J.; Loke, M.F.; Song, S.L.; Tan, J.Y.; Ang, B.H.; Tan, Y.Q.; et al. Gut Microbial Ecosystem in Parkinson Disease: New Clinicobiological Insights from Multi-Omics. Annals of Neurology 2021, 89, 546–559. [Google Scholar] [CrossRef]
- Petrov, V.A.; Saltykova, I.V.; Zhukova, I.A.; Alifirova, V.M.; Zhukova, N.G.; Dorofeeva, Y.B.; Tyakht, A.V.; Kovarsky, B.A.; Alekseev, D.G.; Kostryukova, E.S.; et al. Analysis of Gut Microbiota in Patients with Parkinson’s Disease. Bulletin of Experimental Biology and Medicine 2017, 162, 734–737. [Google Scholar] [CrossRef] [PubMed]
- Vascellari, S.; Palmas, V.; Melis, M.; Pisanu, S.; Cusano, R.; Uva, P.; Perra, D.; Madau, V.; Sarchioto, M.; Oppo, V.; et al. Gut Microbiota and Metabolome Alterations Associated with Parkinson’s Disease. mSystems 2020, 5. [Google Scholar] [CrossRef]
- Bai, F.; You, L.; Lei, H.; Li, X. Association between Increased and Decreased Gut Microbiota Abundance and Parkinson’s Disease: A Systematic Review and Subgroup Meta-Analysis. Experimental Gerontology 2024, 191, 112444. [Google Scholar] [CrossRef]
- Li, C.; Cui, L.; Yang, Y.; Miao, J.; Zhao, X.; Zhang, J.; Cui, G.; Zhang, Y. Gut Microbiota Differs between Parkinson’s Disease Patients and Healthy Controls in Northeast China. Frontiers in Molecular Neuroscience 2019, 12. [Google Scholar] [CrossRef]
- Lin, A.; Zheng, W.; He, Y.; Tang, W.; Wei, X.; He, R.; Huang, W.; Su, Y.; Huang, Y.; Zhou, H.; et al. Gut Microbiota in Patients with Parkinson’s Disease in Southern China. Parkinsonism and Related Disorders 2018, 53, 82–88. [Google Scholar] [CrossRef]
- Bedarf, J.R.; Hildebrand, F.; Coelho, L.P.; Sunagawa, S.; Bahram, M.; Goeser, F.; Bork, P.; Wüllner, U. Functional Implications of Microbial and Viral Gut Metagenome Changes in Early Stage L-DOPA-Naïve Parkinson’s Disease Patients. Genome Medicine 2017, 9. [Google Scholar] [CrossRef]
- Scheperjans, F.; Aho, V.; Pereira, P.A.B.; Koskinen, K.; Paulin, L.; Pekkonen, E.; Haapaniemi, E.; Kaakkola, S.; Eerola-Rautio, J.; Pohja, M.; et al. Gut Microbiota Are Related to Parkinson’s Disease and Clinical Phenotype. Movement Disorders 2015, 30, 350–358. [Google Scholar] [CrossRef] [PubMed]
- Aho, V.T.E.; Pereira, P.A.B.; Voutilainen, S.; Paulin, L.; Pekkonen, E.; Auvinen, P.; Scheperjans, F. Gut Microbiota in Parkinson’s Disease: Temporal Stability and Relations to Disease Progression. EBioMedicine 2019, 44, 691–707. [Google Scholar] [CrossRef] [PubMed]
- Ramasamy, D.; Lagier, J.-C.; Nguyen, T.T.; Raoult, D.; Fournier, P.-E. Non Contiguous-Finished Genome Sequence and Description of Dielma Fastidiosa Gen. Nov., Sp. Nov., a New Member of the Family Erysipelotrichaceae. Stand Genomic Sci 2013, 8, 336–351. [Google Scholar] [CrossRef] [PubMed]
- Wallen, Z.D.; Demirkan, A.; Twa, G.; Cohen, G.; Dean, M.N.; Standaert, D.G.; Sampson, T.R.; Payami, H. Metagenomics of Parkinson’s Disease Implicates the Gut Microbiome in Multiple Disease Mechanisms. Nat Commun 2022, 13, 6958. [Google Scholar] [CrossRef]
- Kwon, D.; Zhang, K.; Paul, K.C.; Folle, A.D.; Del Rosario, I.; Jacobs, J.P.; Keener, A.M.; Bronstein, J.M.; Ritz, B. Diet and the Gut Microbiome in Patients with Parkinson’s Disease. NPJ Parkinsons Dis 2024, 10, 89. [Google Scholar] [CrossRef] [PubMed]
- Alcalay, R.; Gu, Y.; Mejia-Santana, H.; Cote, L.; Marder, K.; Scarmeas, N. The Association between Mediterranean Diet Adherence and Parkinson’s Disease. Mov Disord 2012, 27, 771–774. [Google Scholar] [CrossRef] [PubMed]
- Salazar, N.; Arboleya, S.; Fernández-Navarro, T.; Reyes-Gavilán, C.G. de los; Gonzalez, S.; Gueimonde, M. Age-Associated Changes in Gut Microbiota and Dietary Components Related with the Immune System in Adulthood and Old Age: A Cross-Sectional Study. Nutrients 2019, 11, 1765. [Google Scholar] [CrossRef] [PubMed]
- Yan, H.; Qin, Q.; Yan, S.; Chen, J.; Yang, Y.; Li, T.; Gao, X.; Ding, S. Comparison Of The Gut Microbiota In Different Age Groups In China. Front Cell Infect Microbiol 2022, 12, 877914. [Google Scholar] [CrossRef] [PubMed]
- Bartosch, S.; Fite, A.; Macfarlane, G.T.; McMurdo, M.E.T. Characterization of Bacterial Communities in Feces from Healthy Elderly Volunteers and Hospitalized Elderly Patients by Using Real-Time PCR and Effects of Antibiotic Treatment on the Fecal Microbiota. Appl Environ Microbiol 2004, 70, 3575–3581. [Google Scholar] [CrossRef] [PubMed]
- Ghosh, T.S.; Shanahan, F.; O’Toole, P.W. The Gut Microbiome as a Modulator of Healthy Ageing. Nat Rev Gastroenterol Hepatol 2022, 19, 565–584. [Google Scholar] [CrossRef]
- Rinninella, E.; Tohumcu, E.; Raoul, P.; Fiorani, M.; Cintoni, M.; Mele, M.C.; Cammarota, G.; Gasbarrini, A.; Ianiro, G. The Role of Diet in Shaping Human Gut Microbiota. Best Practice & Research Clinical Gastroenterology 2023, 62–63, 101828. [Google Scholar] [CrossRef]
- Pietrucci, D.; Cerroni, R.; Unida, V.; Farcomeni, A.; Pierantozzi, M.; Mercuri, N.B.; Biocca, S.; Stefani, A.; Desideri, A. Dysbiosis of Gut Microbiota in a Selected Population of Parkinson’s Patients. Parkinsonism and Related Disorders 2019, 65, 124–130. [Google Scholar] [CrossRef] [PubMed]
- Baldini, F.; Hertel, J.; Sandt, E.; Thinnes, C.C.; Neuberger-Castillo, L.; Pavelka, L.; Betsou, F.; Krüger, R.; Thiele, I.; Allen, D.; et al. Parkinson’s Disease-Associated Alterations of the Gut Microbiome Predict Disease-Relevant Changes in Metabolic Functions. BMC Biology 2020, 18. [Google Scholar] [CrossRef]
- Heintz-Buschart, A.; Pandey, U.; Wicke, T.; Sixel-Döring, F.; Janzen, A.; Sittig-Wiegand, E.; Trenkwalder, C.; Oertel, W.H.; Mollenhauer, B.; Wilmes, P. The Nasal and Gut Microbiome in Parkinson’s Disease and Idiopathic Rapid Eye Movement Sleep Behavior Disorder. Movement Disorders 2018, 33, 88–98. [Google Scholar] [CrossRef]
- Chen, S.-J.; Chen, C.-C.; Liao, H.-Y.; Lin, Y.-T.; Wu, Y.-W.; Liou, J.-M.; Wu, M.-S.; Kuo, C.-H.; Lin, C.-H. Association of Fecal and Plasma Levels of Short-Chain Fatty Acids With Gut Microbiota and Clinical Severity in Patients With Parkinson Disease. Neurology 2022, 98, e848–e858. [Google Scholar] [CrossRef] [PubMed]
- Rosario, D.; Bidkhori, G.; Lee, S.; Bedarf, J.; Hildebrand, F.; Le Chatelier, E.; Uhlen, M.; Ehrlich, S.D.; Proctor, G.; Wüllner, U.; et al. Systematic Analysis of Gut Microbiome Reveals the Role of Bacterial Folate and Homocysteine Metabolism in Parkinson’s Disease. Cell Reports 2021, 34. [Google Scholar] [CrossRef]
- Barichella, M.; Severgnini, M.; Cilia, R.; Cassani, E.; Bolliri, C.; Caronni, S.; Ferri, V.; Cancello, R.; Ceccarani, C.; Faierman, S.; et al. Unraveling Gut Microbiota in Parkinson’s Disease and Atypical Parkinsonism. Movement Disorders 2019, 34, 396–405. [Google Scholar] [CrossRef] [PubMed]
- Takahashi, K.; Nishiwaki, H.; Ito, M.; Iwaoka, K.; Takahashi, K.; Suzuki, Y.; Taguchi, K.; Yamahara, K.; Tsuboi, Y.; Kashihara, K.; et al. Altered Gut Microbiota in Parkinson’s Disease Patients with Motor Complications. Parkinsonism and Related Disorders 2022, 95, 11–17. [Google Scholar] [CrossRef] [PubMed]
- Ren, T.; Gao, Y.; Qiu, Y.; Jiang, S.; Zhang, Q.; Zhang, J.; Wang, L.; Zhang, Y.; Wang, L.; Nie, K. Gut Microbiota Altered in Mild Cognitive Impairment Compared With Normal Cognition in Sporadic Parkinson’s Disease. Frontiers in Neurology 2020, 11. [Google Scholar] [CrossRef] [PubMed]
- Qian, Y.; Yang, X.; Xu, S.; Wu, C.; Song, Y.; Qin, N.; Chen, S.-D.; Xiao, Q. Alteration of the Fecal Microbiota in Chinese Patients with Parkinson’s Disease. Brain Behav Immun 2018, 70, 194–202. [Google Scholar] [CrossRef]
- Claudino Dos Santos, J.C.; Lima, M.P.P.; Brito, G.A. de C.; Viana, G.S. de B. Role of Enteric Glia and Microbiota-Gut-Brain Axis in Parkinson Disease Pathogenesis. Ageing Res Rev 2023, 84, 101812. [Google Scholar] [CrossRef] [PubMed]
- Cilia, R.; Piatti, M.; Cereda, E.; Bolliri, C.; Caronni, S.; Ferri, V.; Cassani, E.; Bonvegna, S.; Ferrarese, C.; Zecchinelli, A.L.; et al. Does Gut Microbiota Influence the Course of Parkinson’s Disease? A 3-Year Prospective Exploratory Study in de Novo Patients. Journal of Parkinson’s Disease 2021, 11, 159–170. [Google Scholar] [CrossRef] [PubMed]
- Weis, S.; Schwiertz, A.; Unger, M.M.; Becker, A.; Faßbender, K.; Ratering, S.; Kohl, M.; Schnell, S.; Schäfer, K.H.; Egert, M. Effect of Parkinson’s Disease and Related Medications on the Composition of the Fecal Bacterial Microbiota. npj Parkinson’s Disease 2019, 5. [Google Scholar] [CrossRef] [PubMed]
- Lin, C.-H.; Chen, C.-C.; Chiang, H.-L.; Liou, J.-M.; Chang, C.-M.; Lu, T.-P.; Chuang, E.Y.; Tai, Y.-C.; Cheng, C.; Lin, H.-Y.; et al. Altered Gut Microbiota and Inflammatory Cytokine Responses in Patients with Parkinson’s Disease. J Neuroinflammation 2019, 16, 129. [Google Scholar] [CrossRef] [PubMed]
- Zhang, Y.; He, X.; Mo, C.; Liu, X.; Li, J.; Yan, Z.; Qian, Y.; Lai, Y.; Xu, S.; Yang, X.; et al. Association Between Microbial Tyrosine Decarboxylase Gene and Levodopa Responsiveness in Patients With Parkinson Disease. Neurology 2022, 99, e2443–e2453. [Google Scholar] [CrossRef] [PubMed]
- Menozzi, E.; Schapira, A.H.V. The Gut Microbiota in Parkinson Disease: Interactions with Drugs and Potential for Therapeutic Applications. CNS Drugs 2024, 38, 315. [Google Scholar] [CrossRef]
- Ojha, S.; Patil, N.; Jain, M.; Kole, C.; Kaushik, P. Probiotics for Neurodegenerative Diseases: A Systemic Review. Microorganisms 2023, 11, 1083. [Google Scholar] [CrossRef] [PubMed]
- Marksberry, K. Holmes- Rahe Stress Inventory. The American Institute of Stress.
- Nsad Stress Questionnaire | PDF | Cognition | Behavioural Sciences. Available online: https://www.scribd.com/document/243322934/Nsad-Stress-Questionnaire (accessed on 14 June 2023).
- MDS-Unified Parkinson’s Disease Rating Scale (MDS-UPDRS). Available online: https://www.movementdisorders.org/MDS/MDS-Rating-Scales/MDS-Unified-Parkinsons-Disease-Rating-Scale-MDS-UPDRS.htm (accessed on 23 September 2024).
- Chaudhuri, K.R.; Martinez-Martin, P.; Schapira, A.H.V.; Stocchi, F.; Sethi, K.; Odin, P.; Brown, R.G.; Koller, W.; Barone, P.; MacPhee, G.; et al. International Multicenter Pilot Study of the First Comprehensive Self-completed Nonmotor Symptoms Questionnaire for Parkinson’s Disease: The NMSQuest Study. Movement Disorders 2006, 21, 916–923. [Google Scholar] [CrossRef] [PubMed]
- Vidmar Šimic, M.; Maver, A.; Zimani, A.N.; Hočevar, K.; Peterlin, B.; Kovanda, A.; Premru-Sršen, T. Oral Microbiome and Preterm Birth. Front. Med. 2023, 10, 1177990. [Google Scholar] [CrossRef] [PubMed]
- Ravel, J.; Gajer, P.; Abdo, Z.; Schneider, G.M.; Koenig, S.S.K.; McCulle, S.L.; Karlebach, S.; Gorle, R.; Russell, J.; Tacket, C.O.; et al. Vaginal Microbiome of Reproductive-Age Women. Proc Natl Acad Sci U S A 2011, 108 Suppl 1, 4680–4687. [Google Scholar] [CrossRef]
- Callahan, B.J.; Sankaran, K.; Fukuyama, J.A.; McMurdie, P.J.; Holmes, S.P. Bioconductor Workflow for Microbiome Data Analysis: From Raw Reads to Community Analyses. F1000Res 2016, 5, 1492. [Google Scholar] [CrossRef]
- Callahan, B.J.; McMurdie, P.J.; Rosen, M.J.; Han, A.W.; Johnson, A.J.A.; Holmes, S.P. DADA2: High-Resolution Sample Inference from Illumina Amplicon Data. Nat Methods 2016, 13, 581–583. [Google Scholar] [CrossRef] [PubMed]
- Callahan, B.J.; McMurdie, P.J.; Holmes, S.P. Exact Sequence Variants Should Replace Operational Taxonomic Units in Marker-Gene Data Analysis. ISME J 2017, 11, 2639–2643. [Google Scholar] [CrossRef]
- Hočevar, K.; Maver, A.; Vidmar Šimic, M.; Hodžić, A.; Haslberger, A.; Premru Seršen, T.; Peterlin, B. Vaginal Microbiome Signature Is Associated With Spontaneous Preterm Delivery. Front Med (Lausanne) 2019, 6, 201. [Google Scholar] [CrossRef]
- Callahan, Benjamin RDP Taxonomic Training Data Formatted for DADA2 (RDP Trainset 18/Release 11.5) 2020.
- McLaren, Michael, R.; Callahan, Benjamin, J. Silva 138.1 Prokaryotic SSU Taxonomic Training Data Formatted for DADA2 2021.
- McMurdie, P.J.; Holmes, S. Phyloseq: An R Package for Reproducible Interactive Analysis and Graphics of Microbiome Census Data. PLoS ONE 2013, 8, e61217. [Google Scholar] [CrossRef]
- Oksanen, J.; Simpson, G.L.; Blanchet, F.G.; Kindt, R.; Legendre, P.; Minchin, P.R.; O’Hara, R.B.; Solymos, P.; Stevens, M.H.H.; Szoecs, E.; et al. Vegan: Community Ecology Package; 2022.
- Love, M.I.; Huber, W.; Anders, S. Moderated Estimation of Fold Change and Dispersion for RNA-Seq Data with DESeq2. Genome Biol 2014, 15, 550. [Google Scholar] [CrossRef]
- Cameron, E.S.; Schmidt, P.J.; Tremblay, B.J.-M.; Emelko, M.B.; Müller, K.M. To Rarefy or Not to Rarefy: Enhancing Diversity Analysis of Microbial Communities through next-Generation Sequencing and Rarefying Repeatedly; Bioinformatics, 2020.
- Wickham, H. Ggplot2: Elegant Graphics for Data Analysis; Springer: New York, NY, USA, 2016; ISBN 978-3-319-24277-4. [Google Scholar]
Figure 1.
Alpha and beta diversity comparison of PD patients vs. healthy controls (A) Alpha diversity of PD patients and controls. (B) Principal coordinate analysis (PCoA) plot generated by the Weighted Unifrac distance between PD patient (P) and healthy control (C) groups.
Figure 1.
Alpha and beta diversity comparison of PD patients vs. healthy controls (A) Alpha diversity of PD patients and controls. (B) Principal coordinate analysis (PCoA) plot generated by the Weighted Unifrac distance between PD patient (P) and healthy control (C) groups.
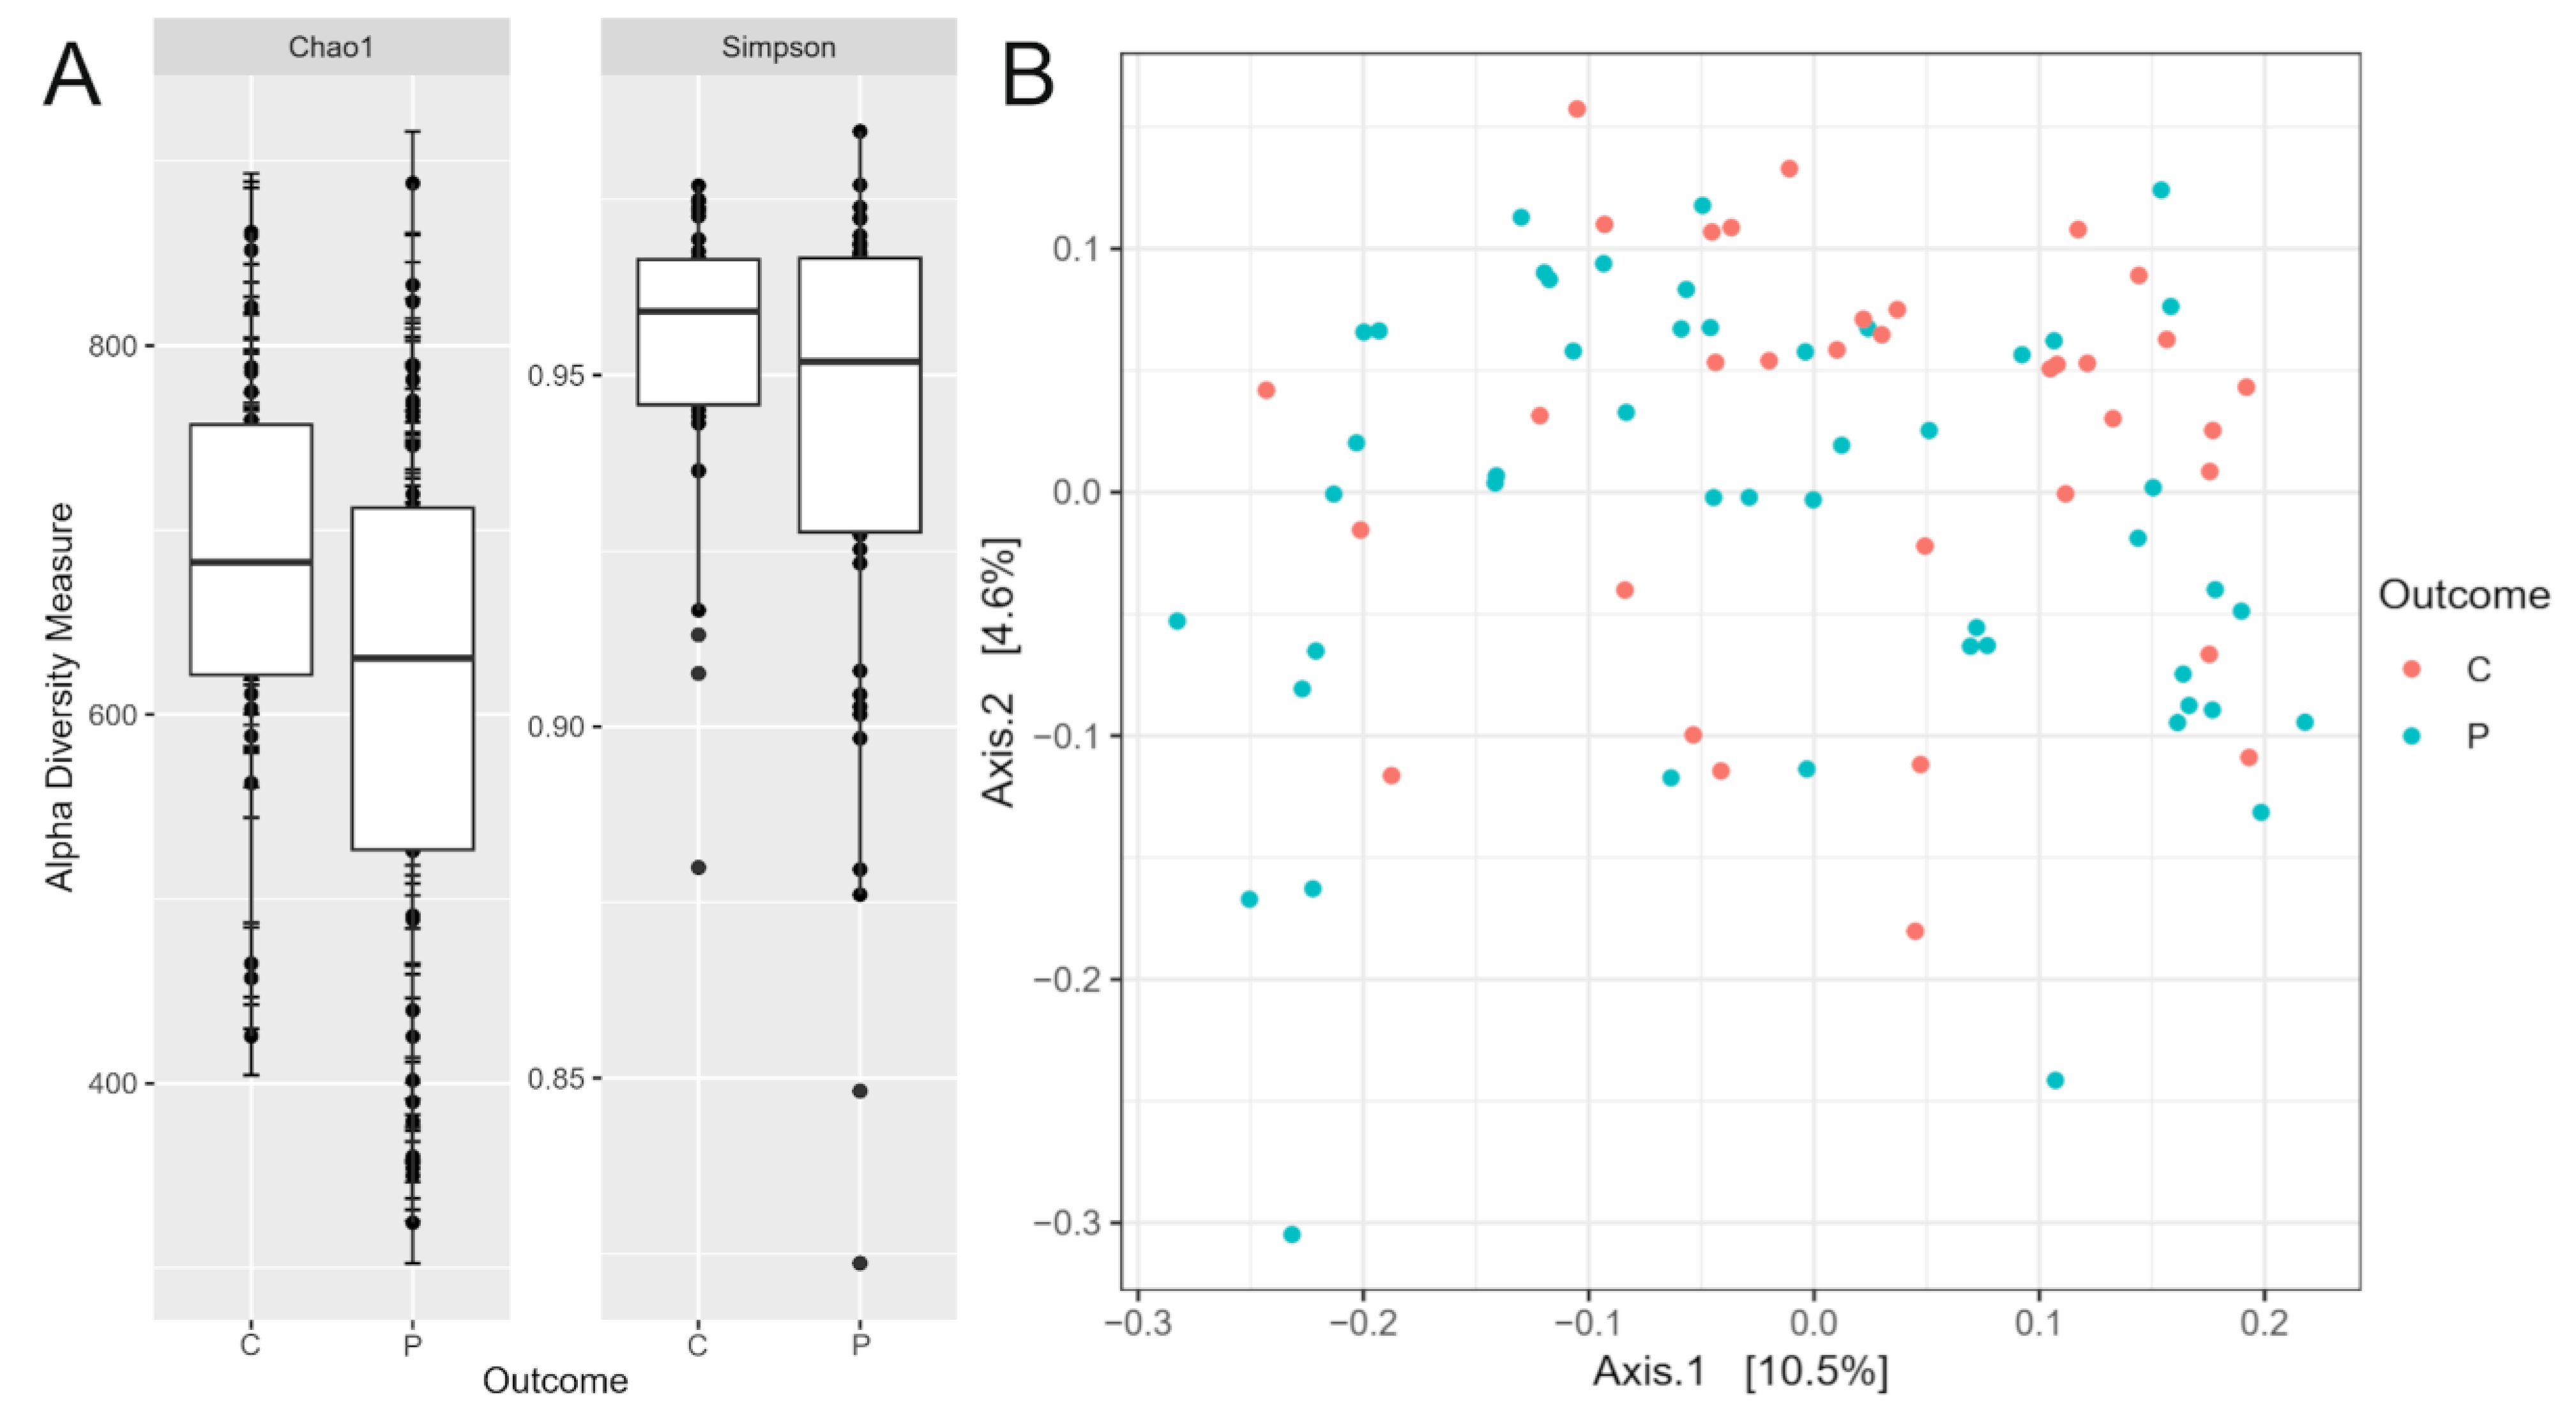
Figure 2.
Relative abundance of phyla in the gut microbiome od PD patients and healthy controls. Relative abundance comparison of top 20 bacterial families in the gut microbiome of the PD patients (P) and healthy controls (C).
Figure 2.
Relative abundance of phyla in the gut microbiome od PD patients and healthy controls. Relative abundance comparison of top 20 bacterial families in the gut microbiome of the PD patients (P) and healthy controls (C).
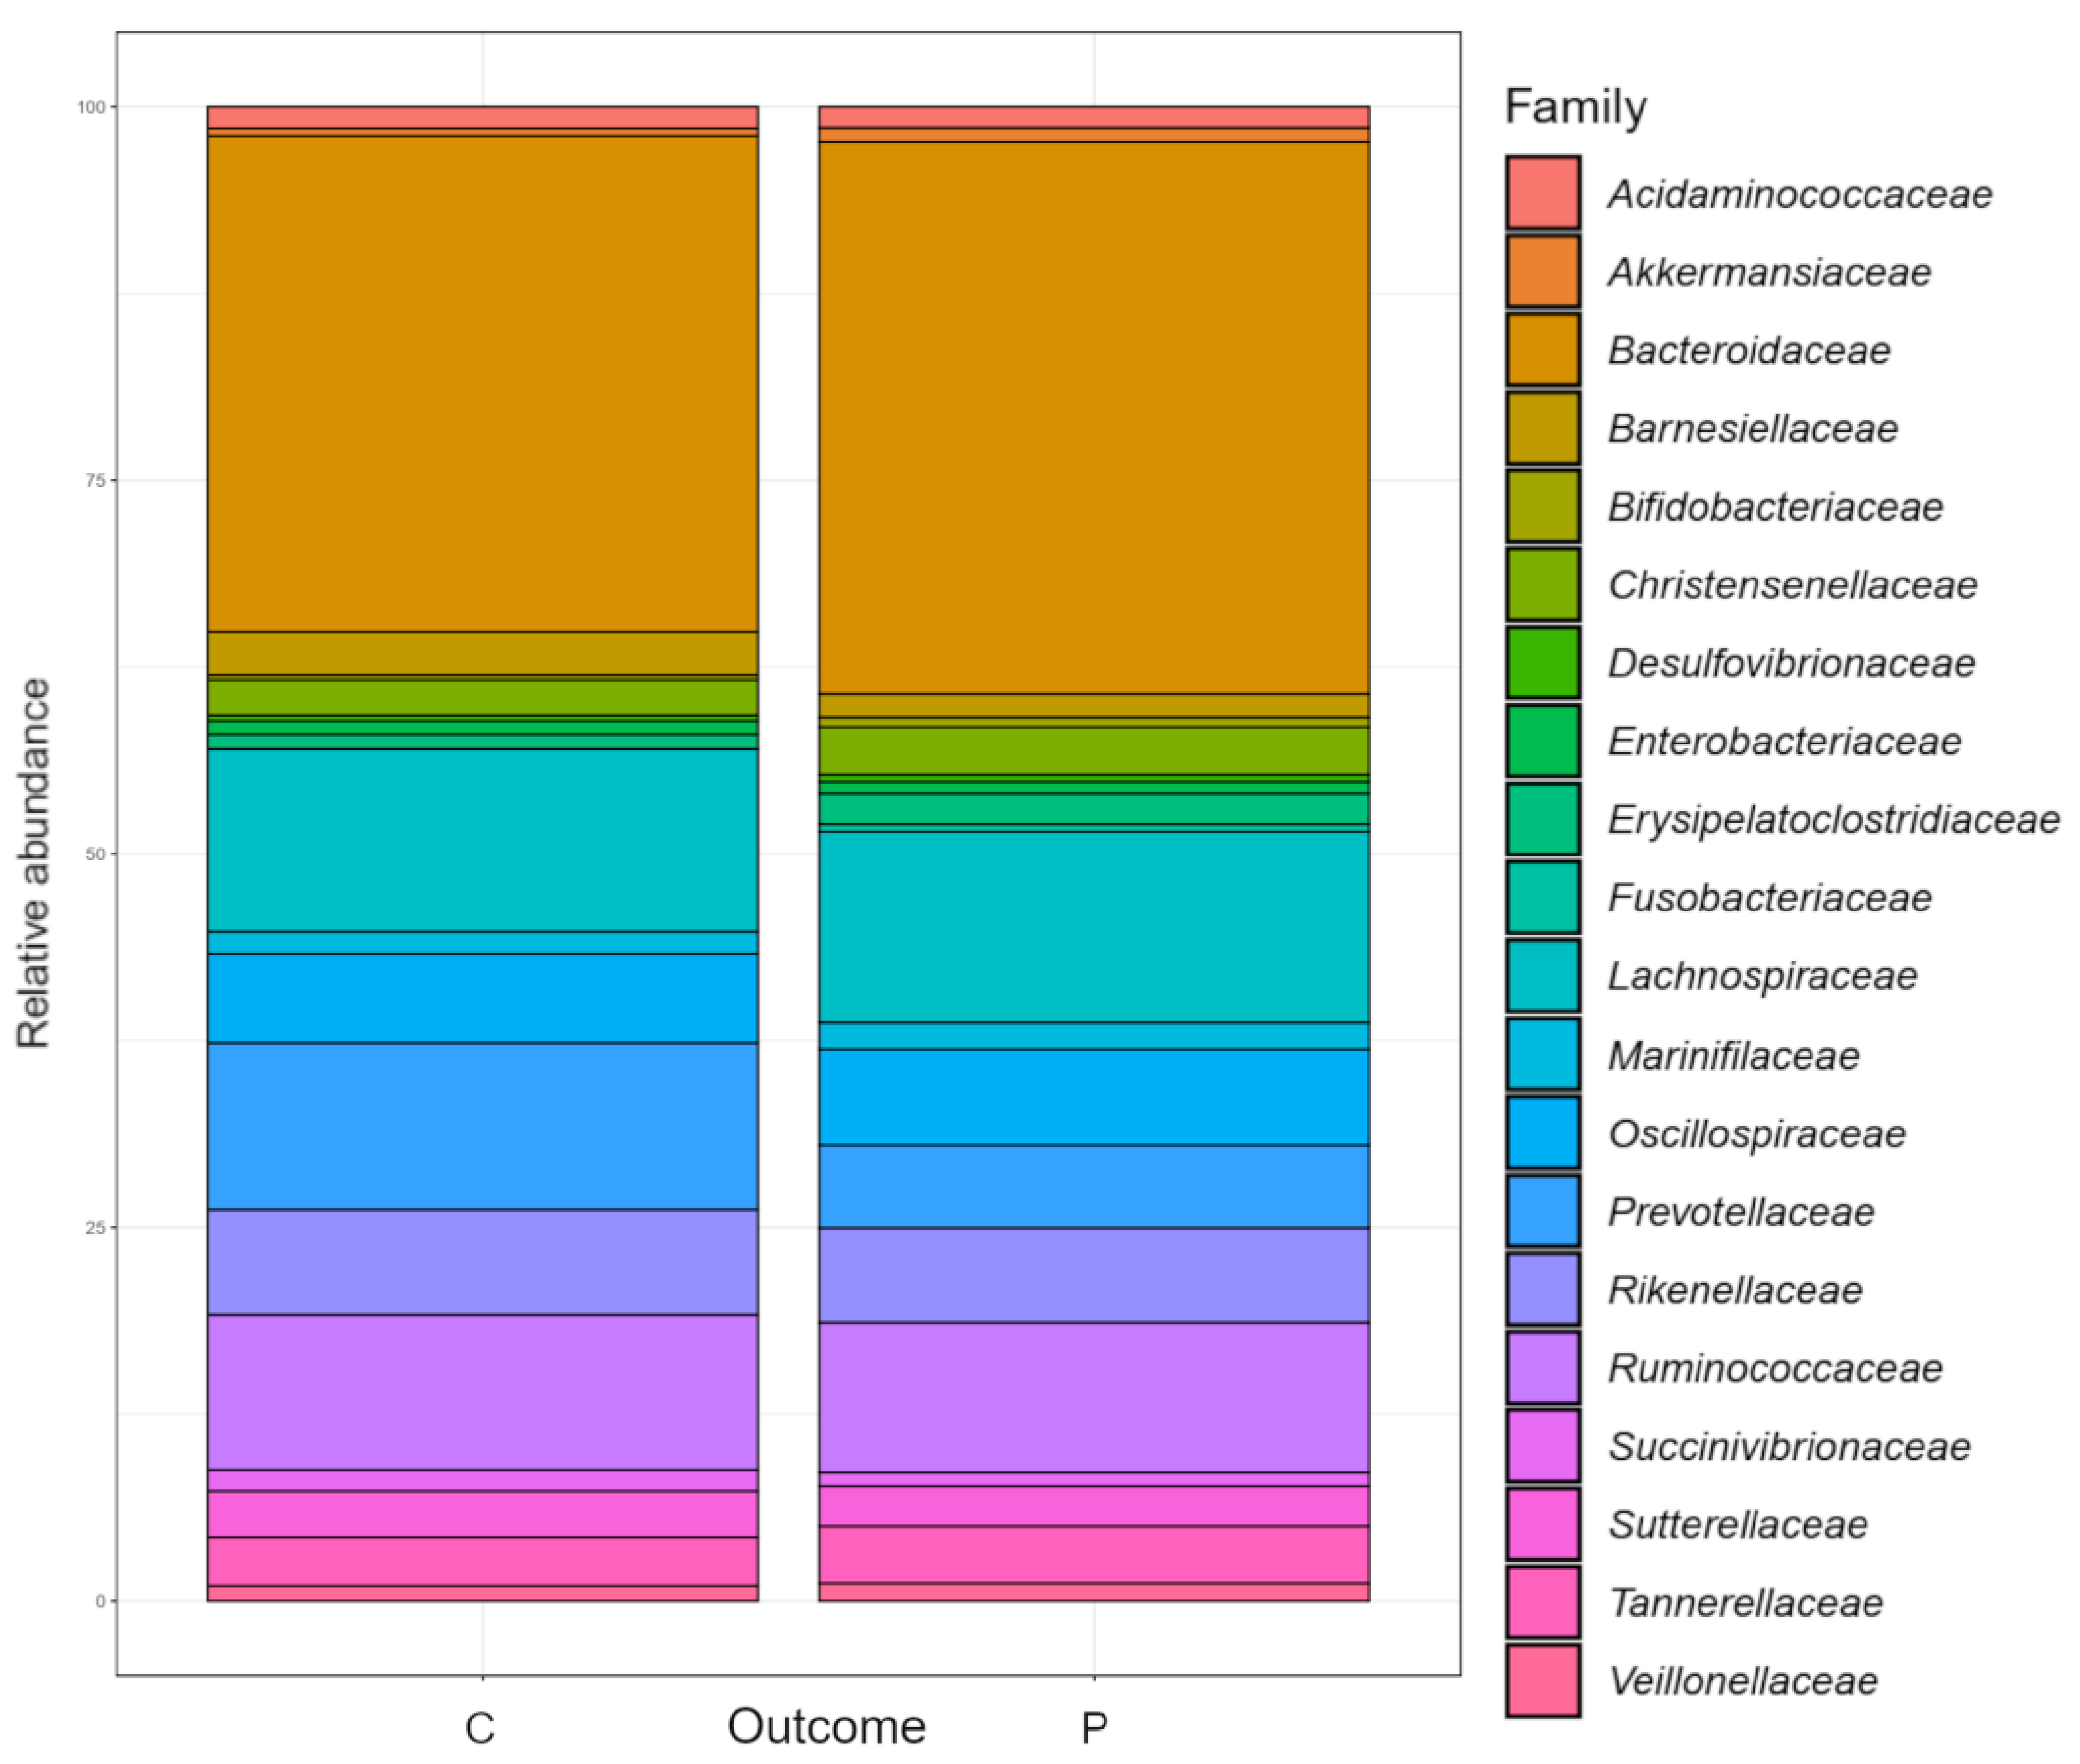
Figure 3.
Differential relative abundance of gut bacteria in PD patients and healthy controls. (A) Differential relative abundance of phyla, and (B) genera and species in log2fold change between the PD patients and healthy controls.
Figure 3.
Differential relative abundance of gut bacteria in PD patients and healthy controls. (A) Differential relative abundance of phyla, and (B) genera and species in log2fold change between the PD patients and healthy controls.
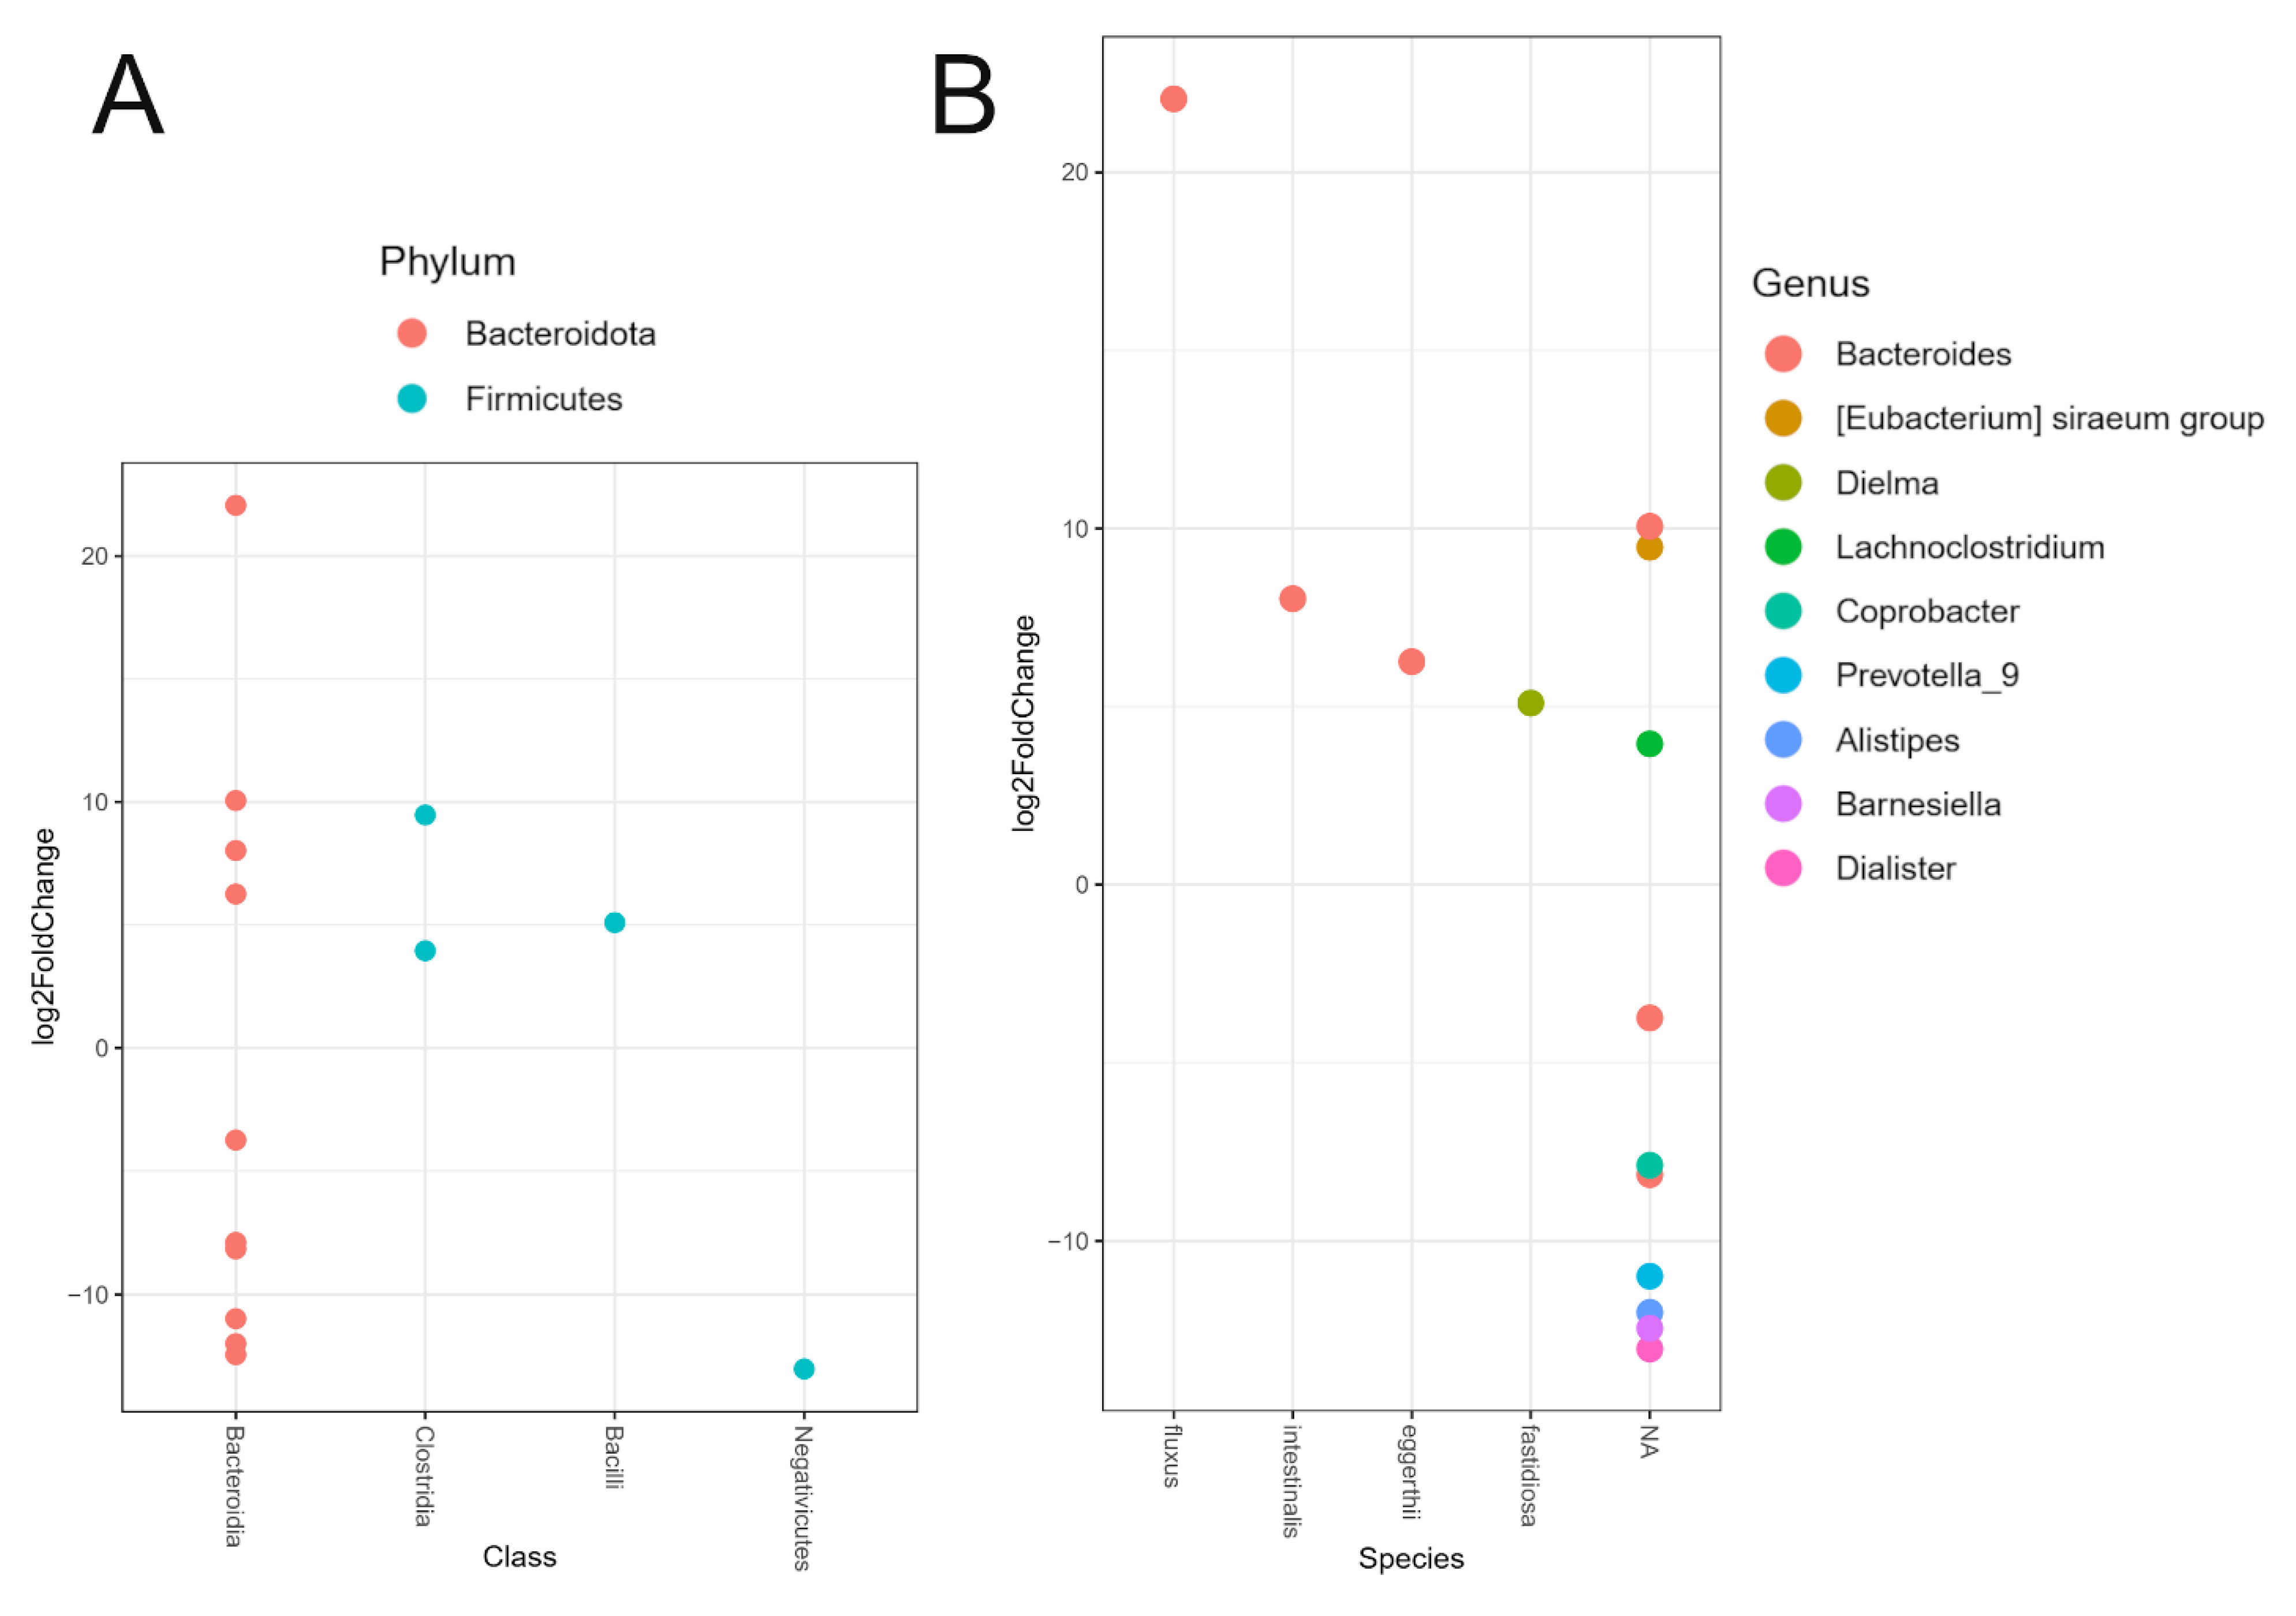

Table 1.
Demographic and clinical characteristics.
| Demographic and clinical characteristics | PD | Controls | P-value, χ2 test, * Mann-Whitney test |
|---|---|---|---|
| Total, N=83 | 49 | 34 | |
| Male | 24 | 8 | p<0.05 |
| Female | 25 | 26 | p<0.05 |
| Age | 63.73 ± 11.94 | 46.47 ± 13.26 | p<0.05 |
| Positive family history | 10 | 2 | p<0.05 |
| Early onset of PD | 5 | / | / |
| Mediterranean diet | 43 | 30 | p=1.0 |
| Coffee consumption (at least 1x a day) | 34 | 31 | p=0.035 |
| Regular alcohol consumption | 32 | 32 | p<0.05 |
| Wine | 21 | 25 | p<0.05 |
| Beer | 13 | 15 | p = 0.096 |
| Smokers | 4 | 13 | p<0.05 |
| Non-smokers | 45 | 21 | |
| Average NSAD | 8.10 ± 4.98 | 7.32 ± 4.80 | p=0.24 |
| Average HRLSI | 102.75 ± 101.33 | 80.00 ± 102.80 | p=0.23 |
| Clinical characteristics | |||
| Average UPDRS I | 1.92 ± 1.68 | 0.67 ± 0.84 | p<0.05 |
| Average UPDRS II | 7.79 ± 4.74 | 0.32 ± 1.45 | p<0.05 |
| Average UPDRS III | 21.04 ± 11.37 | 0.97 ± 1.66 | p<0.05 |
| Average NMSQ | 7.39 ± 5.21 | 3.29 ± 3.05 | p<0.05 |
| Average MoCA | 25.94 ± 3.67 | 29.35 ±1.02 | p<0.05 |
| Constipation | 21 | 14 | p = 0.879 |
| Stool incontinence | 5 | 0 | p = 0.055 |
| Incomplete defecation | 9 | 3 | p<0.05 |
* Parametric continuous variables were tested using an unpaired t-test and are given as means ± standard deviations; nonparametric continuous variables were tested using the Mann–Whitney U-test. NSAD – NSAD Stress questionnaire, HRLSI - Holmes-Rahe Lifestyle Stress Inventory, UPDRS - Unified Parkinson’s disease Rating Scale, NMSQ - Non-Motor Symptom Questionnaire, MoCA - Montreal Canada Cognitive Assessment.
Disclaimer/Publisher’s Note: The statements, opinions and data contained in all publications are solely those of the individual author(s) and contributor(s) and not of MDPI and/or the editor(s). MDPI and/or the editor(s) disclaim responsibility for any injury to people or property resulting from any ideas, methods, instructions or products referred to in the content. |
© 2025 by the authors. Licensee MDPI, Basel, Switzerland. This article is an open access article distributed under the terms and conditions of the Creative Commons Attribution (CC BY) license (https://creativecommons.org/licenses/by/4.0/).
Copyright: This open access article is published under a Creative Commons CC BY 4.0 license, which permit the free download, distribution, and reuse, provided that the author and preprint are cited in any reuse.


