
Submitted:
24 December 2024
Posted:
24 December 2024
You are already at the latest version
Abstract
Optical coherence tomography (OCT) is a cellular-resolution imaging technique that can be used as non-invasive and real-time imaging and is useful for detecting early stages of diseases. Five in vitro skin cells were measured by the Mirau-based full-field OCT, including keratinocyte (HaCaT cell line), melanocyte, squamous cell carcinoma cell line (A431), and 2 melanoma cell lines, i.e., A375 and A2058. Deep learning algorithms (particularly convolutional neural networks, CNN) that extract features from images efficiently process the OCT’s complex images. We used four models to classify the images of five types of 2D-OCT skin cells. Based on ResNet-15 model, the mean accuracy (average accuracy of 10-fold cross-validation) reaches 98.47%, and the standard deviation is only 0.28% with the data augmentation method. Interestingly, while two normal skin cell images mix and the other three cancer skin cell images mix, the model still works to identify normal and cancer cell features. The mean accuracy reaches 96.77%. Furthermore, we used k-fold analysis to detect the model reliability and adopt the Gradient-weighted Class Activation Mapping (GRAD-CAM) to explain the discrimination results. The deep learning algorithm is successfully and efficiently applied to discriminate the OCT skin cell images.
Keywords:
Optical coherence tomography
; convolutional neural network
; skin
; cancer
1. Introduction
Cellular-resolution imaging is critical in medical diagnosis and research because it can reveal fine-scale structures within tissues. It can be an early indicator of diseases, such as distinguishing between malignant and benign tumors, retinal disorders, or neurodegenerative conditions. The real-time monitoring of cellular-resolution imaging helps surgeons target diseased cells precisely and reduces the risk of operation complications. It even helps in understanding the disease mechanisms, such as the behaviors of cancer cells [1], how nerve cells degenerate in conditions like Alzheimer’s, or how cells respond to treatment. The cellular-resolution imaging technology provides precise information, improves the chances of successful treatment, and slows disease progression.
Optical coherence tomography (OCT) [2,3] is a cellular-resolution imaging measurement with the advantages of non-invasive, painless, fast, real-time imaging, etc. OCT uses a low-coherence light source to obtain the cross-section images from interferometric signals of the reference and sample arms. It measures different tissue depths by adjusting the length of the reference arm and results in micro-scaled 3D spatial resolution. The most common use of OCT is for Ophthalmology [4], especially for diagnosing and managing retinal diseases like macular degeneration, diabetic retinopathy, and glaucoma. It allows visualization of the retina’s layers, detecting fluid, swelling, or thinning. In cardiology, OCT helps in imaging coronary arteries to assess plaques and assist in stent placement during angioplasty [5,6,7]. OCT is also suitable for Dermatology for imaging skin layers to detect abnormalities such as tumors or changes in skin texture.
Skin cancer [8,9,10,11,12,13] is one of the common cancers, and cellular-resolution imaging holds significant potential for diagnosing, treating, and monitoring skin cancers. Such as confocal microscopy [14], multiphoton microscopy, and OCT can be applied to detect skin cancers [15,16] at their earliest stages by examining changes at the cellular level, such as basal cell carcinoma (BCC) and squamous cell carcinoma (SCC) [17,18]. Researchers can use skin cell imaging to study how skin cancer cells interact with immune cells or how they respond to experimental drugs. It helps screen new therapies and speed up the drug development process.
Our previous research [19] used a full-field-OCT (FF-OCT) to scan various skin cells, including normal and cancer cells. The measured information provides various 3D cell features, such as volume, compactness, surface roughness, average intensity, and internal intensity standard deviation of cells, which can differentiate the skin cells. However, quantizing the morphology and intensity distribution of skin cells has not been able to distinguish cells perfectly, especially between cancer cells. Therefore, the Raman spectra measurement was used to assist OCT. The cell features from the 3D OCT images and the full Raman spectra were fed into the ensemble machine learning algorithms for cell classification, which improves classification accuracy. But is there any more suitable method to simplify the OCT with a Raman spectra measurement system? Deep learning is powerful for OCT due to its ability to process the complex, high-dimensional data generated by OCT. Deep learning models, particularly convolutional neural networks (CNNs) [20], extract features from OCT images without manual intervention and identify subtle tissue differences. It efficiently processes large datasets, handles the complexity of 3D structures, and detects patterns across multiple slices or volumes of OCT data that would be hard for humans or traditional algorithms. In this paper, we used deep learning algorithms to analyze the OCT images, and we performed very well without Raman spectra measurement.
2. The Optical Imaging System and Deep Learning Algorithms
2.1. Mirau-Based FF-OCT
This study employs a Mirau-based FF-OCT [21,22] as the cellular-resolution imaging. It captures the whole field of view (FOV) in a single scan, which enhances the imaging speed and avoids inaccuracies in the lateral scan. Generally, FF-OCT has higher resolution along the axial direction due to the longer exposure time per en-face image. Mirau-based OCT system combines the reference arm, beam splitter, and sample arm, efficiently decreasing the noises, getting better dispersion dissipation, shortening the beam path, and compacting the system.
The Mirau-based FF-OCT is shown in Figure 1. Its light source is a cerium-doped yttrium aluminum garnet (Ce:YAG) single-clad crystal fiber, fabricated by laser-heated pedestal growth and pumped by a 445-nm LD. The Ce:YAG single-clad crystal fiber generates a broadband light source with a 560-nm central wavelength and a 99-nm FWHM. The OCT’s penetration depth is ~200 μm. The total power on the cell line is 3 mW, which falls in the IEC Class 3R range and is not hazardous for the skin. The lateral and axial resolutions of OCT are 0.8 and 0.75 μm (in tissue), respectively. The mechanical stage of OCT scanning is used here. The distance of each movement is one-quarter of the FOV along the x direction (72.9 μm) and one-third of the FOV along the y direction (73.2 μm). Each sample will sweep 12 points with an integration time of 4 s and an average of 100 measurements.
2.2. Skin Cells and Image Processing
Skin cancer is one of the most common cancers and is among the costliest of all cancers to treat. Among them, melanoma cancer has the highest mortality rate. In the past decade, the number of new invasive melanoma cases diagnosed annually increased by 32 percent. Squamous cell carcinoma cell (SCC) is one of the most common skin cancers. An estimated 1.8 million cases of SCC are diagnosed in the U.S. each year. Most skin cancers are associated with exposure to ultraviolet (UV) radiation from the sun. In our study, five in vitro skin cells are incubated as OCT-measured samples, including normal keratinocyte (HaCaT), melanocyte, SCC cell line (A431), and 2 melanoma cell lines (A375 and A2058).
The cell line was placed in a Petri dish with DMEM-high glucose (GibcoTM) and 10% fetal bovine serum solution, and the dish was placed in an incubator at 37°C and 5% carbon dioxide. After about 1 week of culture, we add trypsin-EDTA to the dish, which breaks down the attached proteins between the cells and the dish. When the cells are detached from the dish, add the appropriate serum to stop the effect of trypsin. Finally, the cell preparation is completed by adding a 4% paraformaldehyde fixation solution to the Petri dish.
One FOV of the Mirau-based FF-OCT is 291.6 μm × 219.6 μm. The original images (648×488 pixels) for five skin cells are shown in the left column of Figure 2. It takes about 3 minutes to do the z-axis scan to measure a 3D volumetric data of one FOV (291.6 μm × 219.6 μm × 200 μm) by using a 0.812 μm/sec z-axis scan speed. A larger area can also be scanned by a horizontally moved 2D translational stage, and an expanding 3D volume can be stitched by a few pieces of FOV.
Here, the 2D OCT images are analyzed quantitatively by ImageJ®, an open-source image processing and analysis program to segment the cells. There are 4 steps of image processing: (1) adjusting the proper brightness, (2) dimensions are scaled to obtain a square of 0.5μm for each side, (3) a 3D Gaussian filter of sigma 0.5 is applied to reduce the noise, and (4) extract the single cell and resize it to a 60 μm × 60 μm, 120 × 120 pixels’ image. After the 4-step image processing, about 600 single-cell images are cropped for each type of skin cell, as shown in the right column of Figure 2.
2.3. Deep learning model
This study applies four CNN-based deep-learning classifiers to discriminate the five skin cells, as listed in Table 1. All the classifiers are trained and tested using PyTorch. First, the simplest model-1 is similar to the LeNet-5 (2 convolution layers with pooling layer + 3 fully connected layers = 5 layers) [23]; the difference compared to the original LeNet-5 is that we use ReLU as the activation function instead of the sigmoid activation function, and max-pooling instead of average-pooling. Secondly, we tried to add more filters in convolution layers and one more convolution layer into the LeNet-5 making it model-2 (6 layers). Thirdly, one more fully connected layer is added to model-2 and becomes model-3 (7 layers). However, the performance of model-3 with more parameters doesn’t always improve compared with model-2. As neural networks grow deeper, the gradients of the loss function for the earlier layers tend to become smaller and smaller during backpropagation. This phenomenon, known as the vanishing gradient problem, makes it difficult for the network to learn meaningful representations in the early layers. Therefore, we adopt ResNet-15 (15 layers) [23] as our model-4 as shown in Figure 3. The Residual blocks introduce a “skip connection” that directly adds the input to the output of a layer stack. This allows the gradient to flow directly to earlier layers, bypassing deeper networks’ potential gradient vanishing issue. This allows for the training of much deeper networks than was previously possible and helps in faster convergence during train, making the training process more efficient. As shown in Table 1, the parameter used in ResNet-15 is only 2.8 M which is the minimum in four models.
Early stopping is a regularization technique generally used in deep learning to prevent overfitting. It works by monitoring the performance on a validation set during training and stopping the training process when the performance stops improving. The Patience parameter specifies the number of epochs to wait after the last improvement in validation loss before stopping the training, which set 10 for four models. By dividing the data into multiple folds, the k-fold cross-validation method provides a more robust estimate of a model’s generalization performance by evaluating it with k subsets of the data. Using the 10-fold cross-validation analysis, the original image data (2,946 images for five skin cells) was divided into 10 parts. Each time, one part of the data is chosen as validation data, and the others are used as training data. The average accuracy of 10 subsets analysis is called mean accuracy. The standard deviation (STD) tells the stability of the model.
3. Discrimination Results
First, four deep-learning models were used to distinguish two normal skin cells, HaCaT and melanocyte. In Figure 4, the mean accuracy reaches 94.76% for the simplest model-1 (LeNet-5) and then increases to 96.74% with one more convolution layer of model-2. Further, it increased to 97.85% with one more fully connected layer of model-3. Finally, the mean accuracy is enhanced to 98.80% in the model-4 (ResNet-15). To get higher accuracy, we utilized the data augmentation method. The 2,946 original images expand 6 times in quantity and become 17,676 images total for five skin cells. The mean accuracy becomes higher than 99.60% and the STD is lower than 0.21% for four models, illustrating the importance of plenty of training data for deep learning algorithms.
Secondly, we try to distinguish three skin cancer cells: SCC (A431) and melanoma (A375 and A2058). In Figure 5, the mean accuracy reaches 93.43% for model-1 and increases to 93.99% for model-2. However, the performance has no improvement with one more fully connected layer of model-3. Finally, the mean accuracy enhanced to 96.74% in the model-4 (ResNet-15). Utilizing the data augmentation method, the mean accuracy becomes higher than 97.40% for all models and reaches a maximum of 99.34 % for model-4. The deep learning technique performs well in classifying normal skin cells and skin cancer cells, respectively.
Thirdly, we wonder if the model still works to distinguish the characteristics between normal and cancer cells. Therefore, we mixed two normal skin cell (HaCaT and Melanocyte) images and three cancer skin cell (A431, A375, and A2058) images, respectively. As shown in Figure 6, it is interesting that the model still works, although the accuracy decreases slightly. The mean accuracy reaches 84.73% for model-1, enhancing to 90.02% in the model-4. With the data augmentation method, the mean accuracy is 92.16% for model-1 and enhanced as 96.77% for model-4. The excellent performance shows that the deep learning algorithm is very effective in detecting the characteristics of cellular-resolution 2D-OCT images even if we mix similar types of cells.
Four models are applied to discriminate five skin cells, including HaCaT, squamous cell carcinoma (A431), melanocyte, and cancerous forms (A375 and A2058). The results are shown in Figure 7. Using original images, the mean accuracy reached 84.83% for model-1 and is enhanced to 92.40% in model-4. After utilizing the data augmentation method, the accuracy is highly improved, which ranges from 94.67% to 98.47% for four models, and the standard deviation decreases with increasing deep learning layers. At the same time, ResNet-15 gets STD=0.28% as the minimum.
4. Discussions
4.1. Comparison of Deep Learning Model with Mechanical Learning
In our previous research [19], the same Mirau-based FF-OCT system was used to measure the skin cells. The cell volume, compactness, surface roughness, average intensity, and internal intensity standard deviation were extracted from 3D-OCT images. We adopted six ensemble learning algorithms to discriminate the skin cells, i.e., boosting + LDA, bagging + LDA, subspace + LDA, subspace + KNN, boosting + TREE, and bagging + TREE [25,26,27]. The classification accuracy was about 70% among cancer cells due to no significant differences in the morphological features among the cancer cells. The maximum accuracy was about 85% in distinguishing normal and cancer cells. Therefore, the Mirau-based FF-OCT has to be assisted with Raman spectra measurement to enhance the machine-learning results [19].
This study used four deep-learning algorithms to analyze 2D-OCT skin cells. The performance (with 6-times data augmentation) is listed in Table 2. Using model-4 (ResNet-15), the accuracy reaches 99.86% while distinguishing normal keratinocytes (HaCaT) and normal melanocytes. The accuracy is 96.77% in classifying normal and cancerous cells. The accuracy is 99.34% in classifying three skin cancers, which shows the strong discrimination ability of deep learning compared to that of ensemble learning. While classifying 5 skin cells, the mean accuracy reaches 98.47%. Notice here how robust the deep-learning algorithm is.
4.2. 10-Fold Cross-Validation Analysis
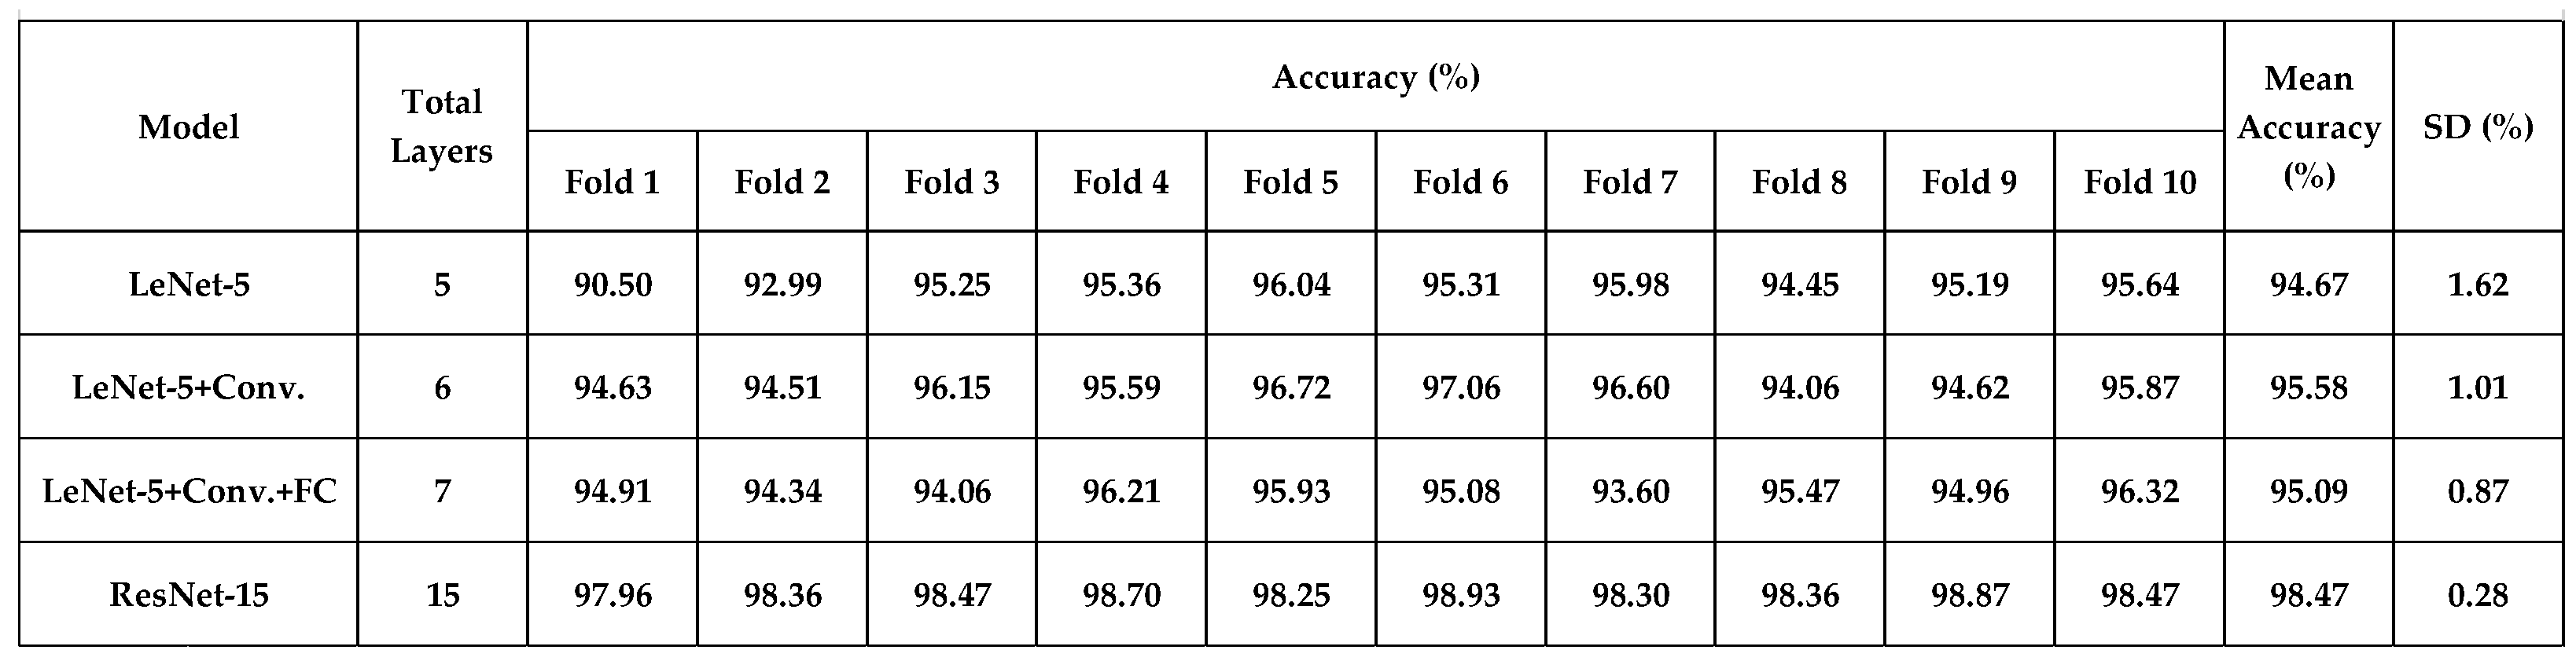
Table 3 shows the overall accuracy of 10-fold cross-validation in classifying 5 skin cells (with data augmentation). The mean accuracy ranges from 94.67% to 98.47%, and the standard deviation reached a minimum of 0.28% using model-4 (ResNet-15). The confusion matrices of 10-fold cross-validation are shown in Figure 8. It shows the reliability of ResNet-15.
4.3. Gradient-Weighted Class Activation Mapping (GRAD-CAM) Analysis
To determine what the deep-learning algorithm has been learned from the feature map, we adopted GRAD-CAM [28] to figure it out. GRAD-CAM is a technique in deep learning and computer vision that helps us understand how a Convolutional Neural Network (CNN) arrives at its predictions. It does this by visualizing the areas of an image that the CNN focuses on when making a decision. We depict corresponding heat maps from the feature map of model-4 (ResNet-15).
In Figure 8, we show two heat maps for each skin cell. Figure 8 (a) shows the HaCaT heat map, it detects the cell membrane surface shape and the backscattered signals from the cell organelle, which similarly matches the higher intensity of the original image. Figure 8 (b) shows the melanocyte heat map, it detects no importance on the cell membrane surface shape, but the backscattered intensity of the cell organelle is important. While HaCaT(Figure 2(a)) forms cancer cells as SCC(Figure 2(c)), the cancer cell surface becomes irregular and unclear. Comparing the heat maps in Figure 8(a) and (c), the concerned features of SCC move to the backscattered intensity of cell organelle from the cell surface of HaCaT. As melanocyte (Figure 2(b)) forms cancer cells as A375 and A2058(Figure 2(d)(e)), the cell surface generates some protrudes. Therefore, the A375 (Figure 8(d)) and A2058 (Figure 8(e)) heat maps strongly focus on the protruding shape of the surface and the backscattered signal of the cell organelle. These heat map features differ from the melanocyte, which does not care about the cell surface. Comparing the cancer cell heat maps of SCC with A375 and A2058, the SCC doesn’t concern the cell surface, which is the key feature for the heat maps of A375 and A2058. Based on the above analysis, deep learning does learn the features of the 2D-OCT images and presents an explainable result.
4. Conclusions
The information provided by 3D-OCT images includes cell volume, compactness, surface roughness, average intensity, and internal intensity standard deviation. However, the 2D-OCT image does not clearly show the cell volume (or 2D surface size), compactness, and surface roughness because the 2D-cell surface size changes with the scanning depth, and the 2D image shows no compactness and surface roughness. Nevertheless, according to the analysis of GRAD-CAM and k-fold cross-validation, the stability of the deep learning model and the interpretability of feature learning are shown, and we can see that deep learning not only learns the correct cell features; but also shows ultra-high accuracy. Based on ResNet-15, the mean accuracy (average accuracy of 10-fold cross-validation) reaches 98.47%, and the standard deviation is only 0.28% with the data augmentation method. In summary, the deep learning algorithm is successfully and efficiently applied to discriminate the OCT skin cell images and shows a powerful ability to catch image features. Deep learning algorithm-assisted cell-level resolution OCT has the potential to become the most advanced technology for cytopathic detection and disease prevention.
Author Contributions
Conceptualization, Jui-Yun Yi; Formal analysis, Shiun Li and Chun-Yeh Chen; Funding acquisition, Jui-Yun Yi; Methodology, Sheng-Lung Huang; Resources, Sheng-Lung Huang; Software, Shiun Li and Yu-You Yen; Validation, Yu-You Yen; Writing – original draft, Jui-Yun Yi; Writing – review & editing, Jui-Yun Yi.
Funding
This research was funded by the National Science and Technology Council, Taiwan, under Grant# NSTC 113-2635-E-017-001-MY2.
Data Availability Statement
The data of this article are available from the corresponding author upon reasonable request.
Conflicts of Interest
The authors declare no conflicts of interest.
Acknowledgments
The authors thank the National Center for High-Performance Computing (NCHC) for providing computational and storage resources.
References
- Peng, S.; Alexander, H.; Adam, de la Z.; Bryan, R.S. Optical Microscopy and Coherence Tomography of Cancer in Living Subjects. Trends in cancer 2020, 6(3), 205-222. [CrossRef]
- Wolfgang, D.; James, G.F. State-of-the-art retinal optical coherence tomography. Prog. Retin. Eye Res. 2008, 27(1), 45-88. [CrossRef]
- Ilya, K.; Alexey, S.; Bernhard, R. Advances in the simulation of light–tissue interactions in biomedical engineering. Biomed. Eng. Lett. 2019, 9, 327-337. [CrossRef]
- Mirjam, E.J. van V.; Dirk, J.F.; Frank, D.V.; Ton, G. van L.; Marc, D. de S. Recent developments in optical coherence tomography for imaging the retina. Prog. Retin. Eye Res. 2007, 26(1), 55-77. [CrossRef]
- Viscusi, M. M., La Porta, Y., Migliaro, G., Gargano, G. M., Nusca, A., Gatto, L., Budassi, S., Paolucci, L., Mangiacapra, F., Ricottini, E., Melfi, R., Rinaldi, R., Prati, F., Ussia, G. P., & Grigioni, F. Current Applications and New Perspectives in Optical Coherence Tomography (OCT) Coronary Atherosclerotic Plaque Assessment: From PCI Optimization to Pharmacological Treatment Guidance. Photonics, 2023, 10(2), 158. [CrossRef]
- Taishi, Y.; Ik-Kyung, J. Cardiac Optical Coherence Tomography History, Current Status, and Perspective. JACC: Asia. 2024, 4(2), 89-107.
- Woo June Choi. Optical coherence tomography angiography in preclinical neuroimaging. Biomed. Eng. Lett. 2019, 9, 311-325. [CrossRef]
- Tamara, S.H.; Steven, R.F.; Phillip, M.W.; Alan, B.F.J.; Neal, D.G.; Jose, M.A.; G.John, C. Skin cancer is among the most costly of all cancers to treat for the Medicare population. J. Am. Acad. Dermatol. 2003, 48, 425-429. [CrossRef]
- Howard, W.R.; Martin, A.W.; Ashlynne, R.H.; Steven, R.F.; Alan, B.F.; Brett M.C. Incidence estimate of nonmelanoma skin cancer in the United States, 2006. Arch. Dermatol. 2010, 146(3), 283–287. [CrossRef]
- S.E.H., H.; C.E.J., D.; L., M.; D., C.; A., G.; S., K.; D., D.; O.M., D. Skin cancer trends in Northern Ireland and consequences for provision of dermatology services. Br. J. Dermatol. 2007, 156(6), 1301–1307. [CrossRef]
- Matthew, R.D.; Brett, M.C. No end in sight: the skin cancer epidemic continues. Semin. Cutan. Med. Surg. 2011, 30(1), 3–5. [CrossRef]
- Judy Sng, M.M.; David, K.; Wong Chia Siong, M.M.; Tai Bee, C. Skin cancer trends among Asians living in Singapore from 1968 to 2006. J. Am. Acad. Dermatol. 2009, 61(3), 426–432. [CrossRef]
- Ulrike, L.; Ulrike, K.; Thomas, E.; Alexander, K.; Bernd, H.; Peter, M.C.G. Incidence, mortality, and trends of nonmelanoma skin cancer in Germany. J. Invest. Dermatol. 2017, 137(9), 1860–1867. [CrossRef]
- Stefania, B.; Riccardo, P.; Aimilios, L.; Athanassios , K.; Elvira, M.; Elisa, B.; Margherita R.; Giovanni, P.; Iris, Z.; Giuseppe, A.; Caterina, L. Clinical Indications for Use of Reflectance Confocal Microscopy for Skin Cancer Diagnosis. JAMA Dermatology. 2016, 152(10), 1093-1098. [CrossRef]
- Chetan, A.P.; Harish, K.; Darrel, L.E.; Ton, G. van L.; Anita, M.J. Clinical Instrument for Combined Raman Spectroscopy-Optical Coherence Tomography of Skin Cancers. Lasers Surg. Med. 2011, 43(2), 143-151. [CrossRef]
- Valery, P.Z.; Ivan, A.B.; Dmitry, N.A.; Oleg, O.M.; Dmitry, V.K.; Sergey, V.K.; Alexander, A.M. Comparative analysis of 141 combined spectral and optical tomography methods for detection of skin and lung cancers. J. Biomed. Opt. 2015, 20(2), 1-8. [CrossRef]
- Chi-Jui, H.; Manuel, C.D.; Ming-Yi, L.; Jeng-Wei, T.; Sheng-Lung, H.; Homer, H.C. Classification of squamous cell carcinoma from FF-OCT images: Data selection and progressive model construction. Comput. Med. Imaging Graph. 2021, 93, 101992-1-10. [CrossRef]
- Chi-Jui, H.; Manuel, C.D.; Chin-Cheng, C.; Ming-Yi, L.; Jeng-Wei, T.; Sheng-Lung, H.; Homer, H. C. Detecting mouse squamous cell carcinoma from submicron full-field optical coherence tomography images by deep learning. J. Biophotonics. 2021, 14, 101992-1-12. [CrossRef]
- Cian, Y.; Jui-Yun, Y.; Ting-Wei, H.; Sheng-Lung, H. Integration of cellular-resolution optical coherence tomography and Raman spectroscopy for discrimination of skin cancer cells with machine learning. J. Biomed. Opt. 2023, 28, 096005-1-14. [CrossRef]
- Laith, A.; Jinglan, Z.; Amjad, J.H; Ayad, A.D.; Ye, D.; Omran, A.S.; J., S.; Mohammed, A.F.; Muthana, A.A.; Laith, F. Review of deep learning: concepts, CNN architectures, challenges, applications, future directions. J. Big Data. 2021, 8(53), 1-74.
- Chien-Chung, T.; Chia-Kai, C.; Kuang-Yu, H.; Tuan-Shu, H.; Ming-Yi, L.; Jeng-Wei, T.; Sheng-Lung, H. Full-depth epidermis tomography using a Mirau-based full-field optical coherence tomography. Biomed. Opt. Express. 2014, 5(9), 3001-3010. [CrossRef]
- Arnaud, D.; Weikai, X.; O. L.; P., B.; Anne-Lise, C.; Jonas, O. Mirau-based line-field confocal optical coherence tomography. Opt. Express. 2020, 28(6), 7918-7927. [CrossRef]
- Y., L.; L., B.; Y., B.; P., H. Gradient-based learning applied to document recognition. Proceedings of the IEEE. 1998, 86(11), 2278-2324. [CrossRef]
- Kaimimg, H.; Xiangyu, Z.; Shaoqing, R.; Jian, S. Deep Residual Learning for Image Recognition. 2016 IEEE Conference on Computer Vision and Pattern Recognition (CVPR), Las Vegas, NV, USA, 27-30 June 2016. [CrossRef]
- Tharwat, A.; Gaber, T.; Ibrahim, A.; Hassanien, A.E. Linear discriminant analysis: a detailed tutorial. AI Commun. 2017, 30(2), 169-190. [CrossRef]
- J., L.; E., O. (1996). Classification with learning k-nearest neighbors. Proceedings of International Conference on Neural Networks (ICNN’96), Washington, DC, USA, 03-06 June 1996. [CrossRef]
- J.R., Q. Induction of decision trees. Mach. Learn. 1986, 1(1), 81-106. [CrossRef]
- Ramprasaath. R. S.; Michael C.; Abhishek D.; Ramakrishna V.; Devi P.; Dhruv B. Grad-CAM: Visual Explanations from Deep Networks via Gradient-Based Localization. IEEE Int. Conf. Comput. Vis. 2017, Venice, Italy, 22-29 October 2017. https://doi. org/10.1109/ICCV.2017.74.
Figure 1.
Mirau-based FF-OCT. (LD, laser diode; DM, dichroic mirror; PBS, polarization beam splitter; AQWP, achromatic quarter-wave plate; PZT, piezoelectric transducer).
Figure 1.
Mirau-based FF-OCT. (LD, laser diode; DM, dichroic mirror; PBS, polarization beam splitter; AQWP, achromatic quarter-wave plate; PZT, piezoelectric transducer).
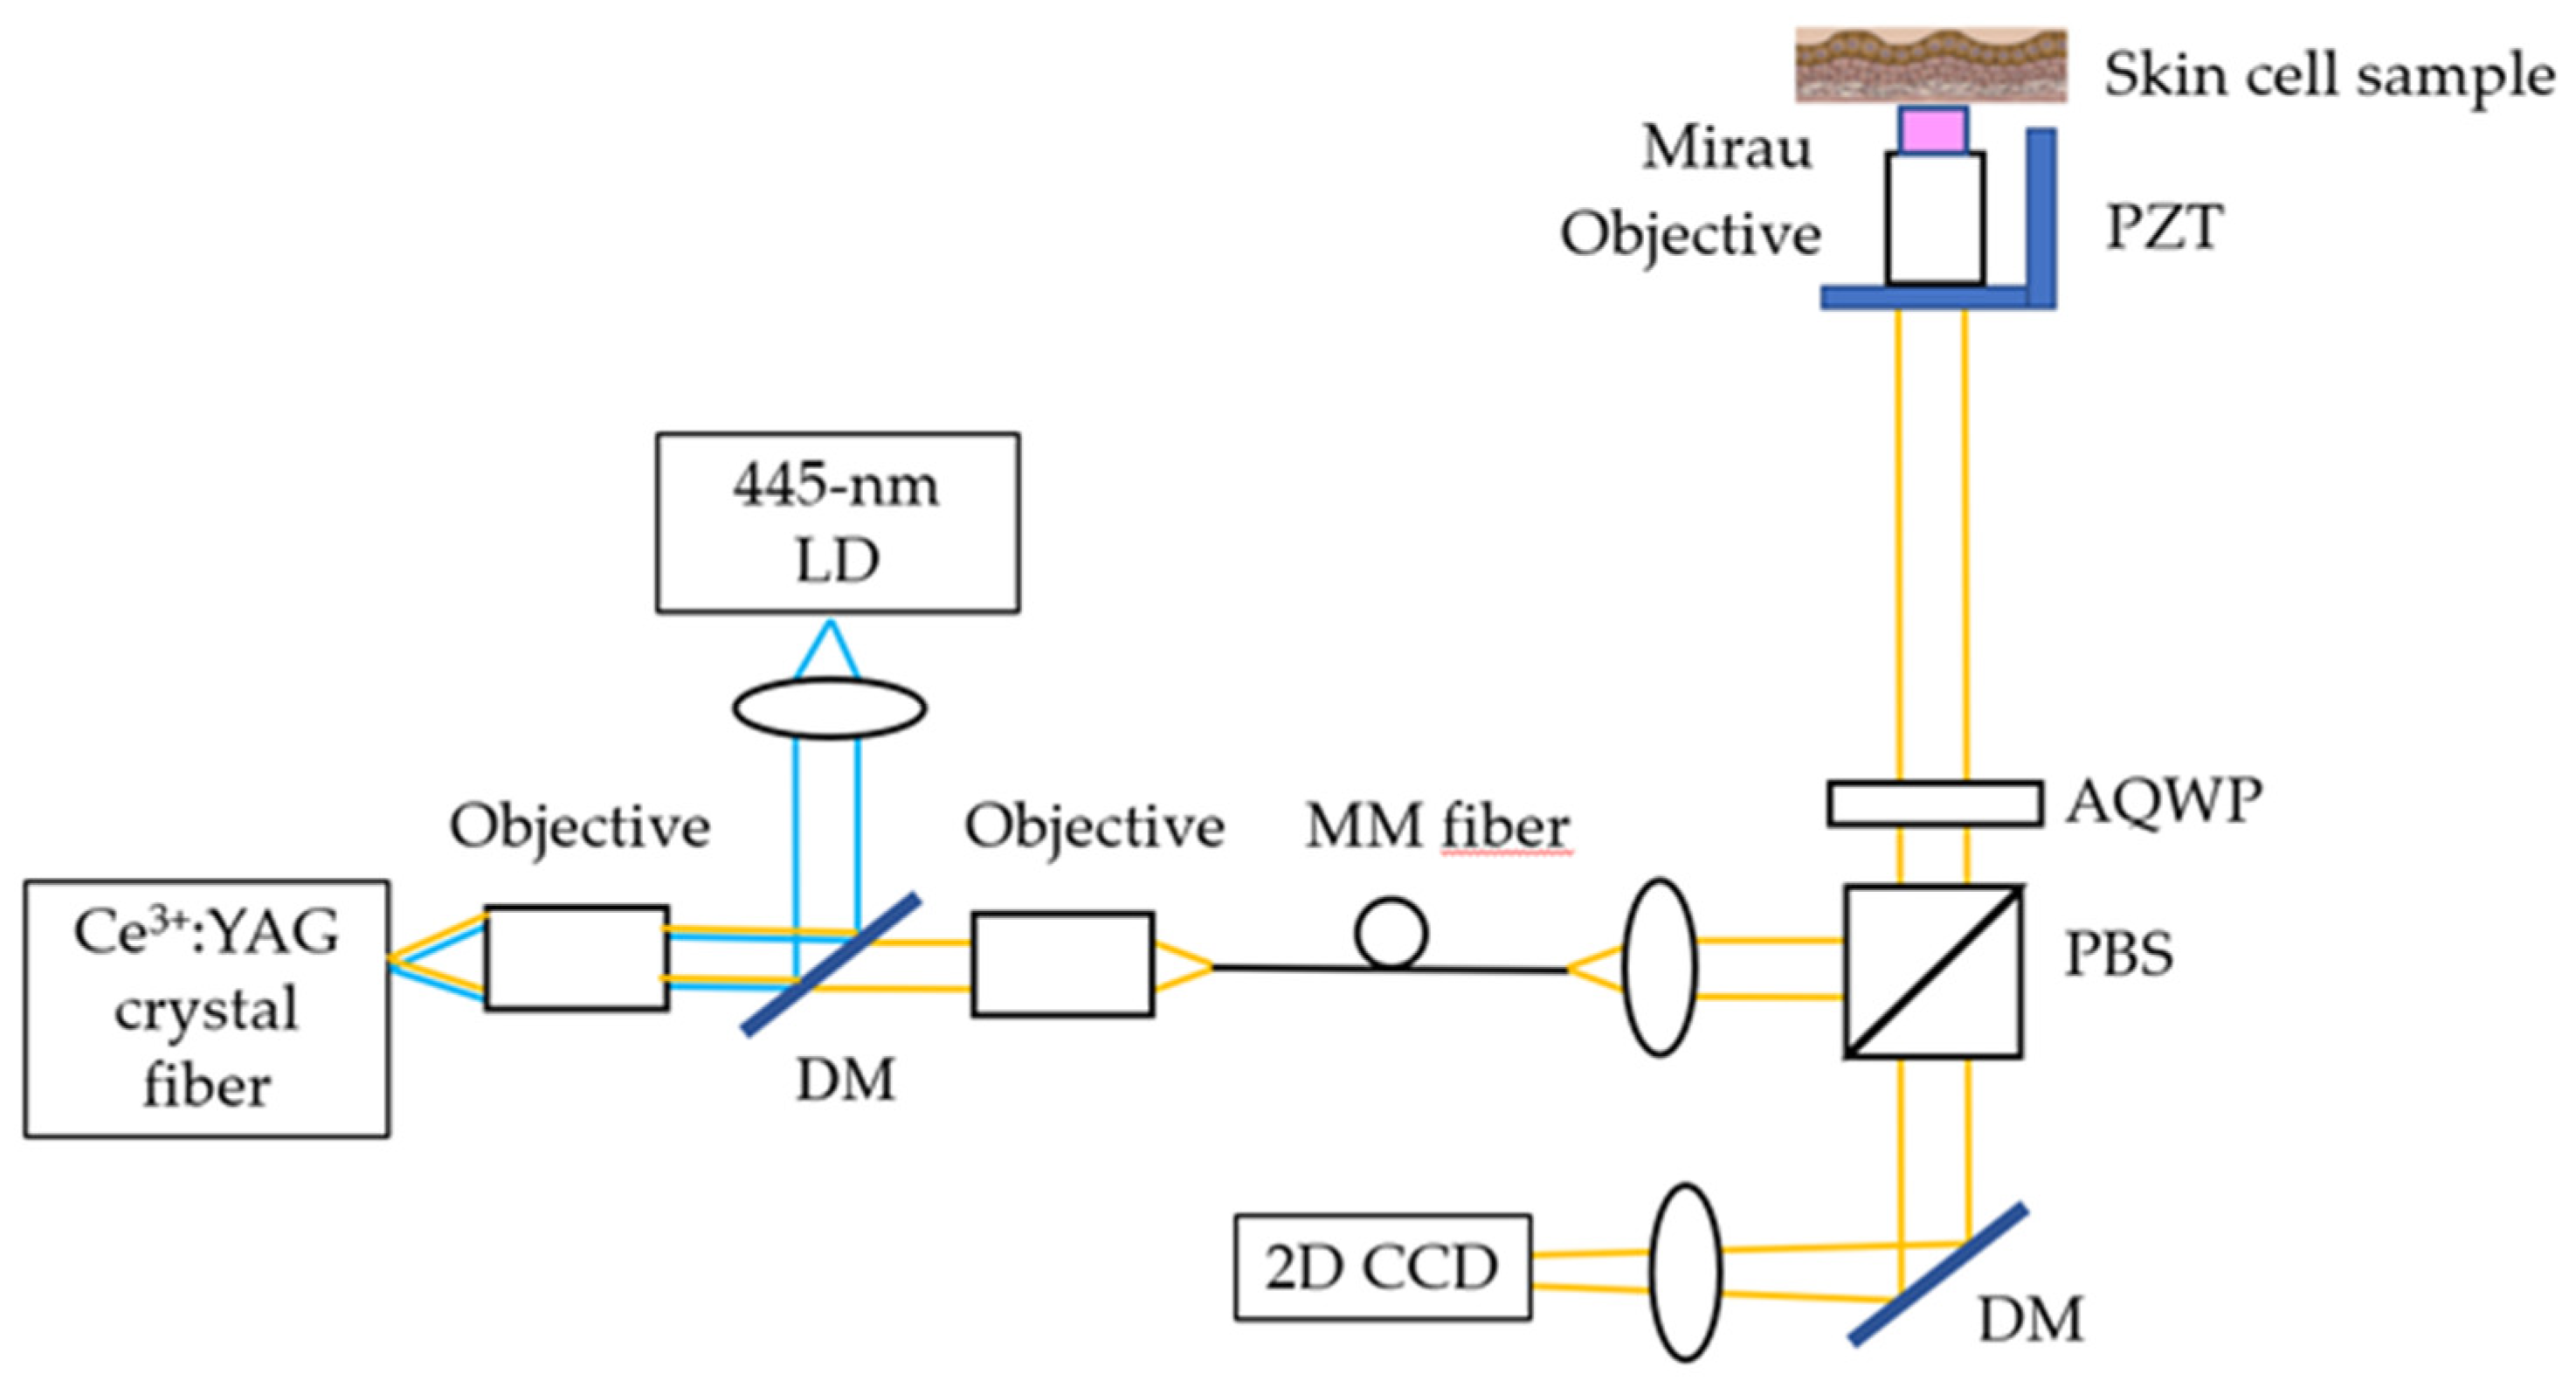
Figure 2.
OCT images of the five types of skin cells. (a) HaCaT (normal) (b) Melanocyte (normal) (c) SCC (cancer) (d) A375 melanoma (cancer) (e) A2058 melanoma (cancer). (left figure: original image 291.6×219.6 μm2 (648×488 pixels). Right figure: image after processing 60×60 μm2 (120×120 pixels)).
Figure 2.
OCT images of the five types of skin cells. (a) HaCaT (normal) (b) Melanocyte (normal) (c) SCC (cancer) (d) A375 melanoma (cancer) (e) A2058 melanoma (cancer). (left figure: original image 291.6×219.6 μm2 (648×488 pixels). Right figure: image after processing 60×60 μm2 (120×120 pixels)).
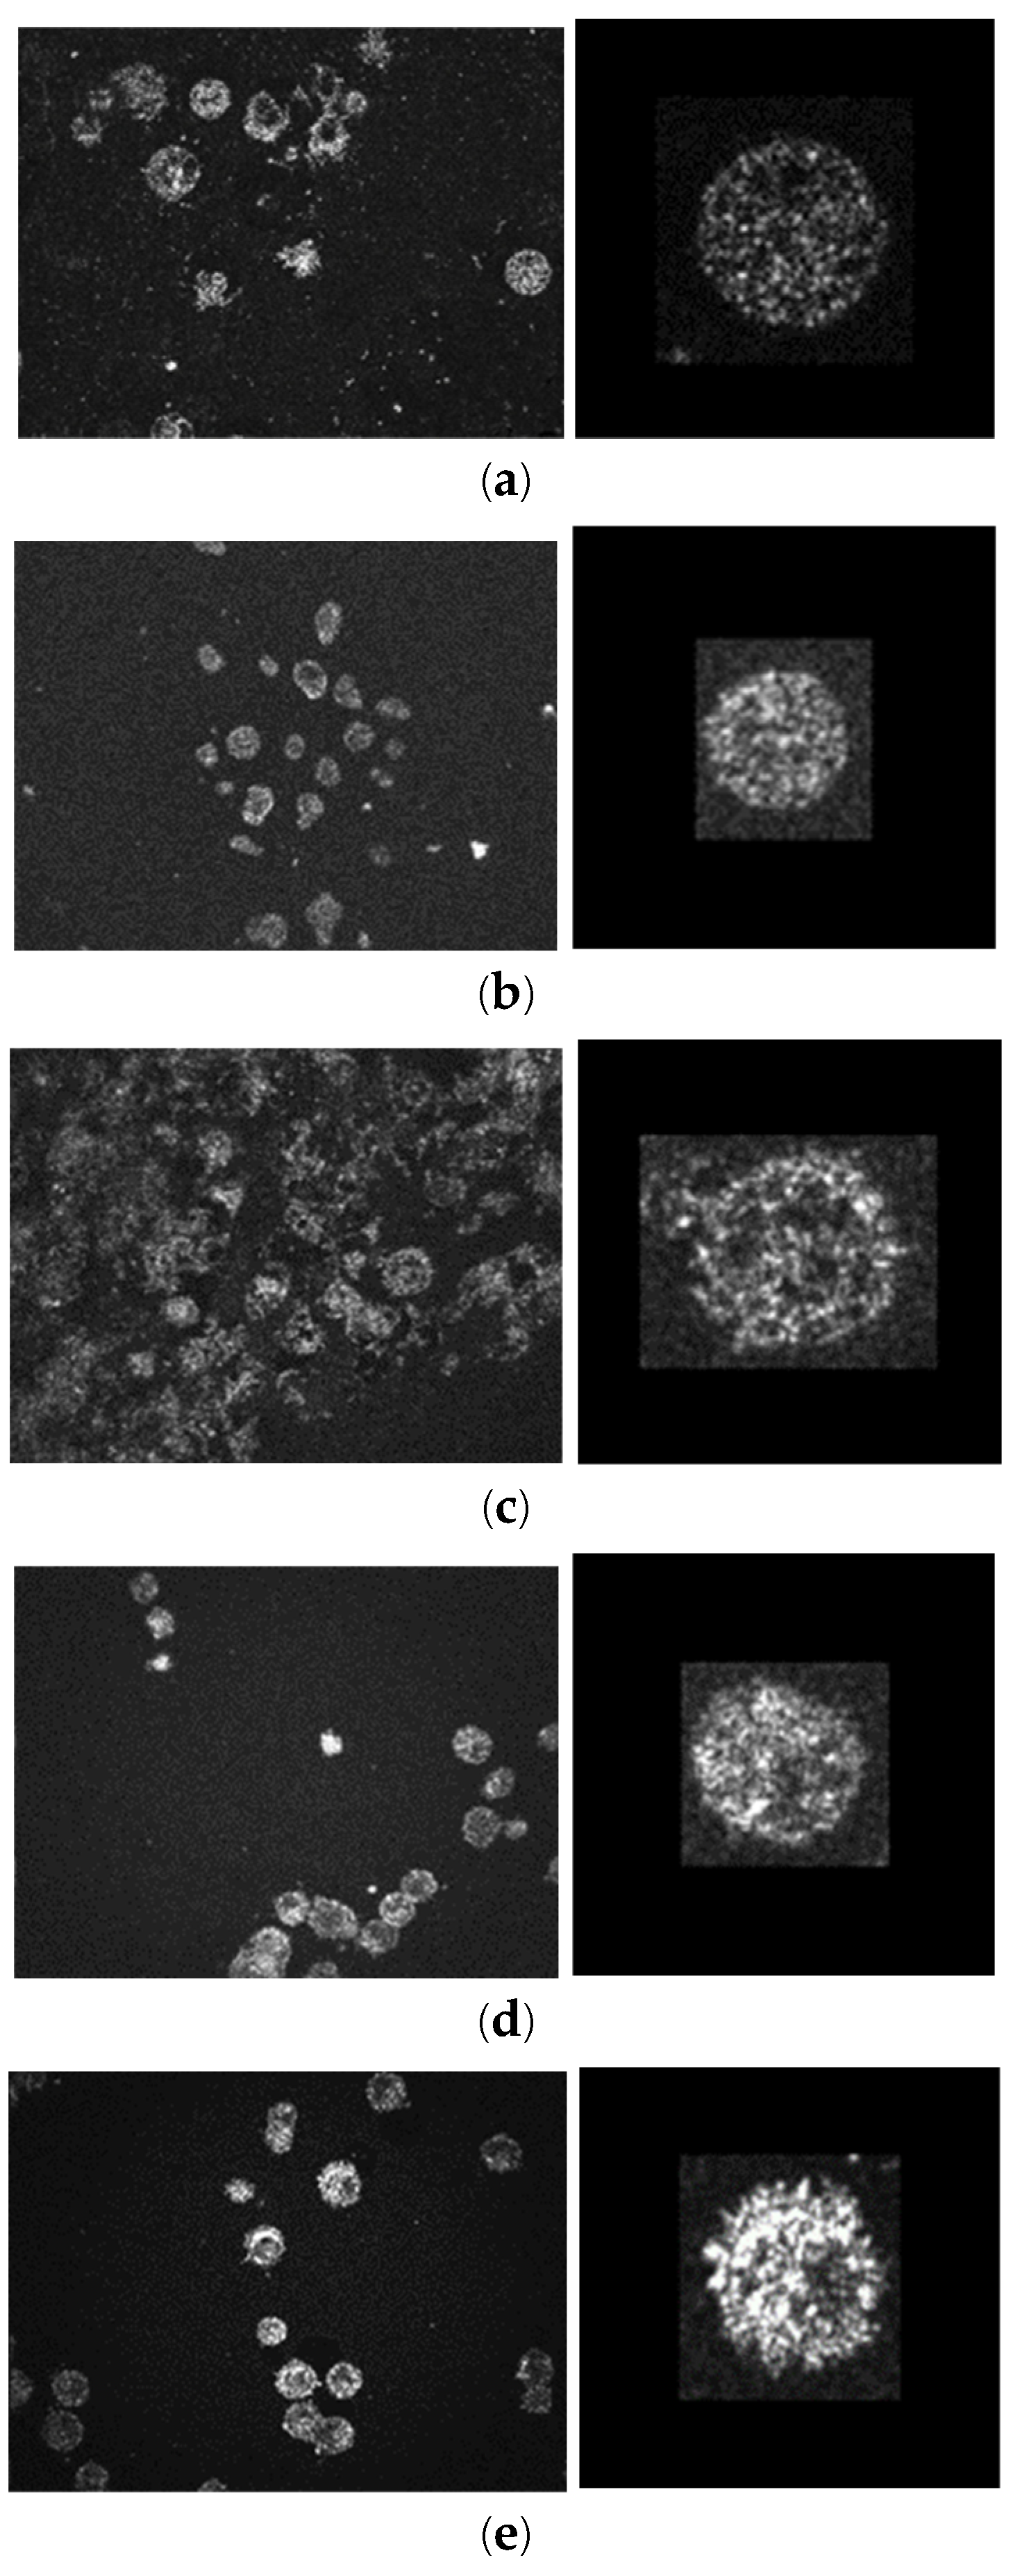
Figure 3.
The deep-learning model-4 (ResNet-15).
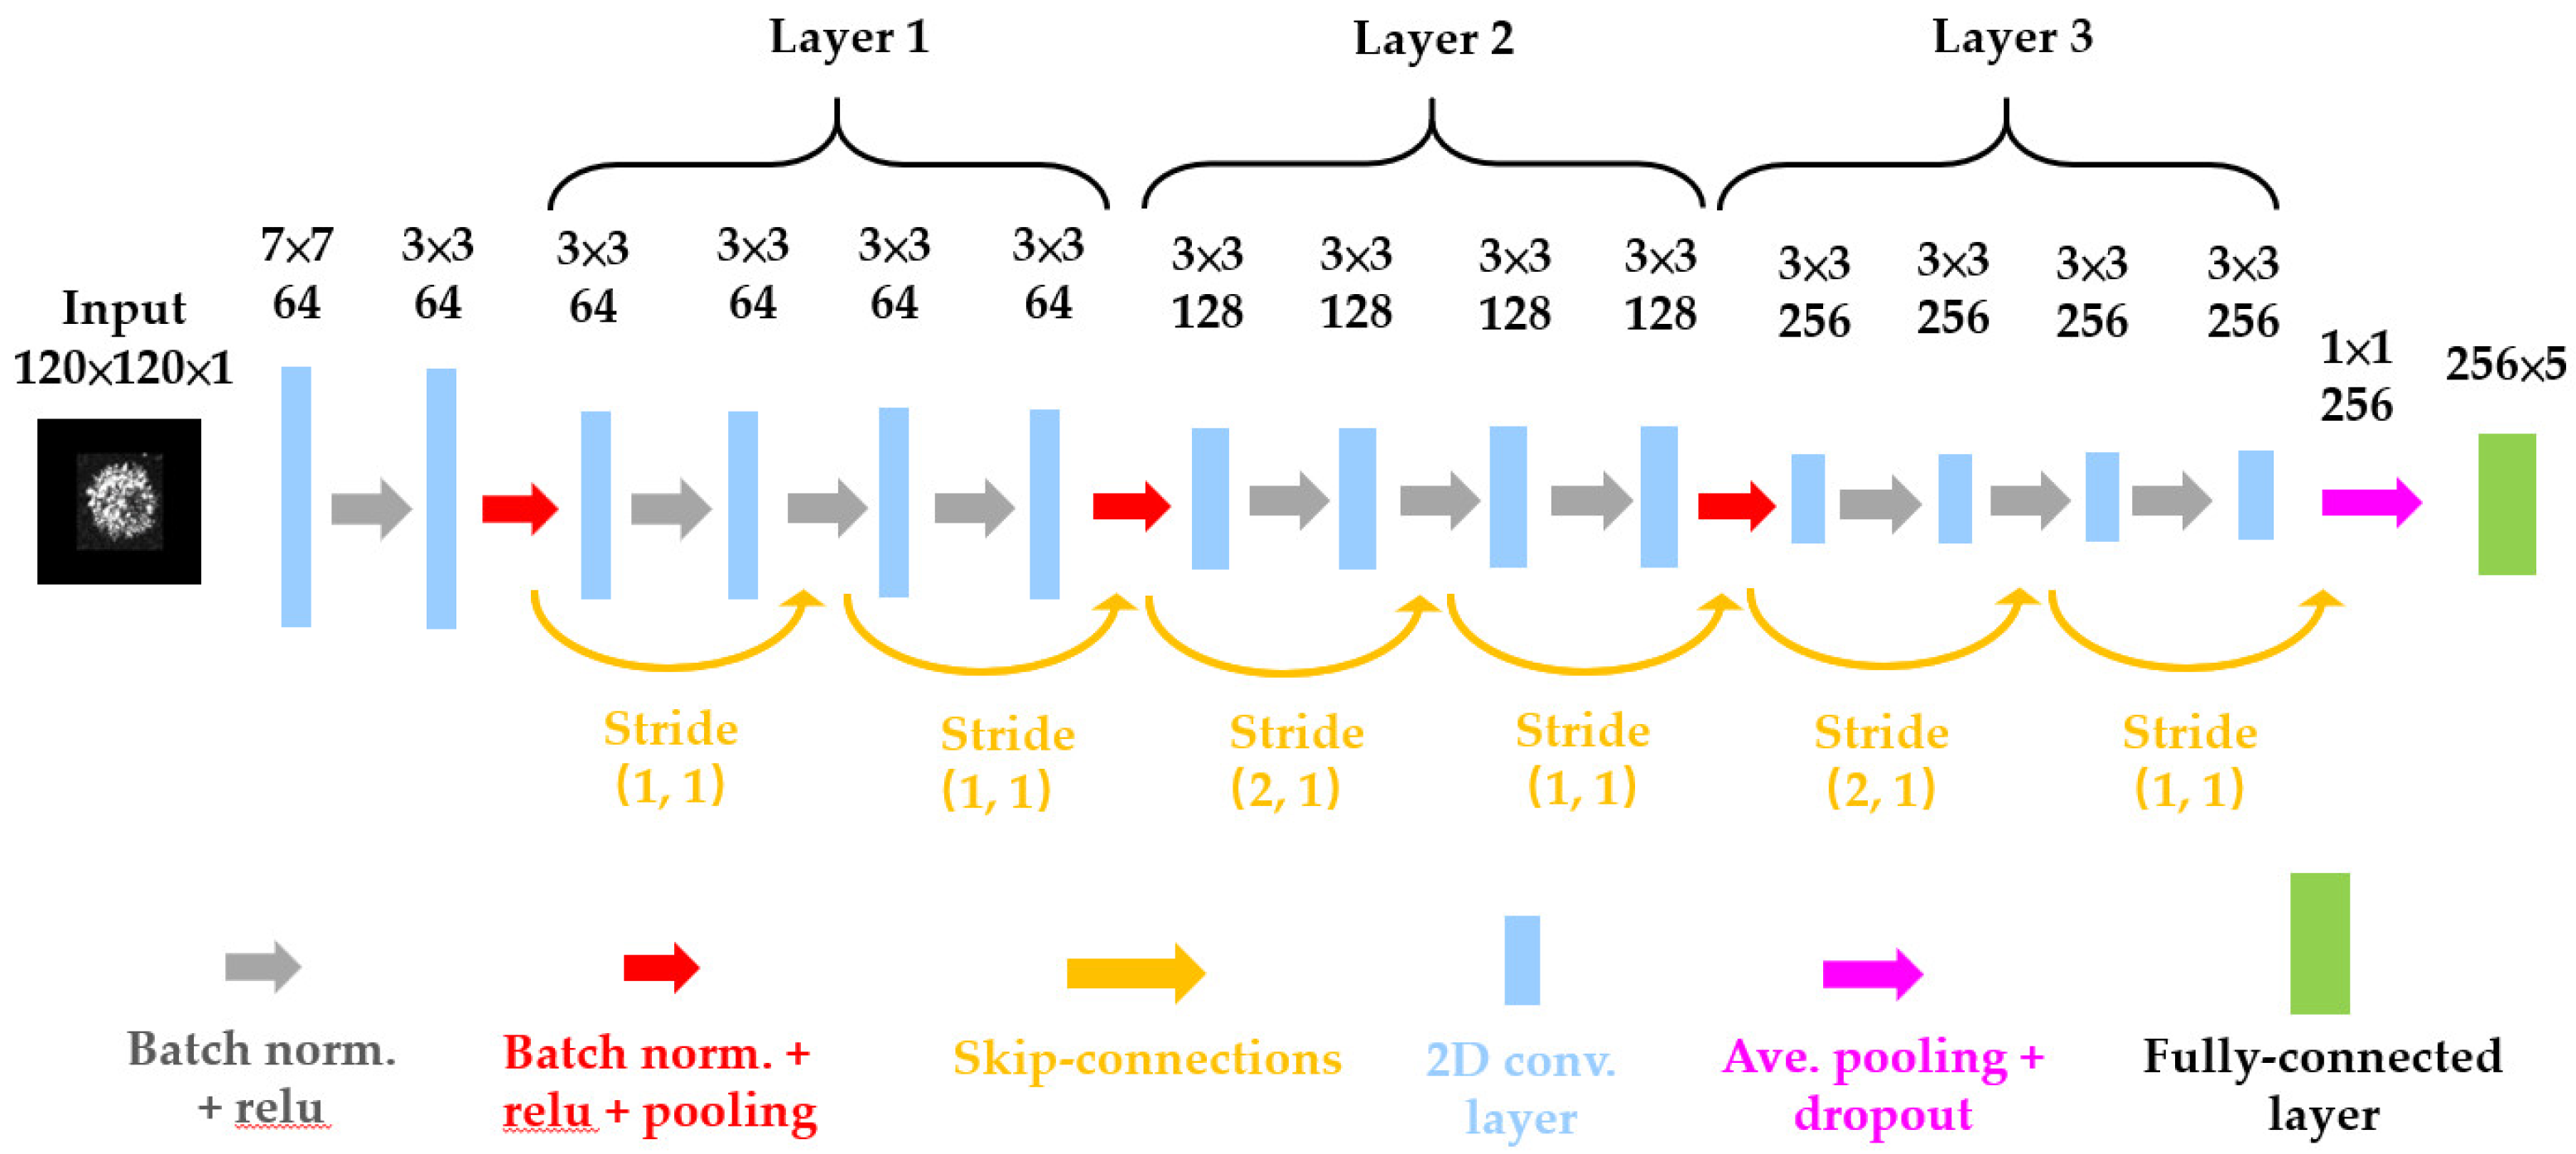
Figure 4.
The performance of four models discriminating HaCaT and Melanocyte skin cells.
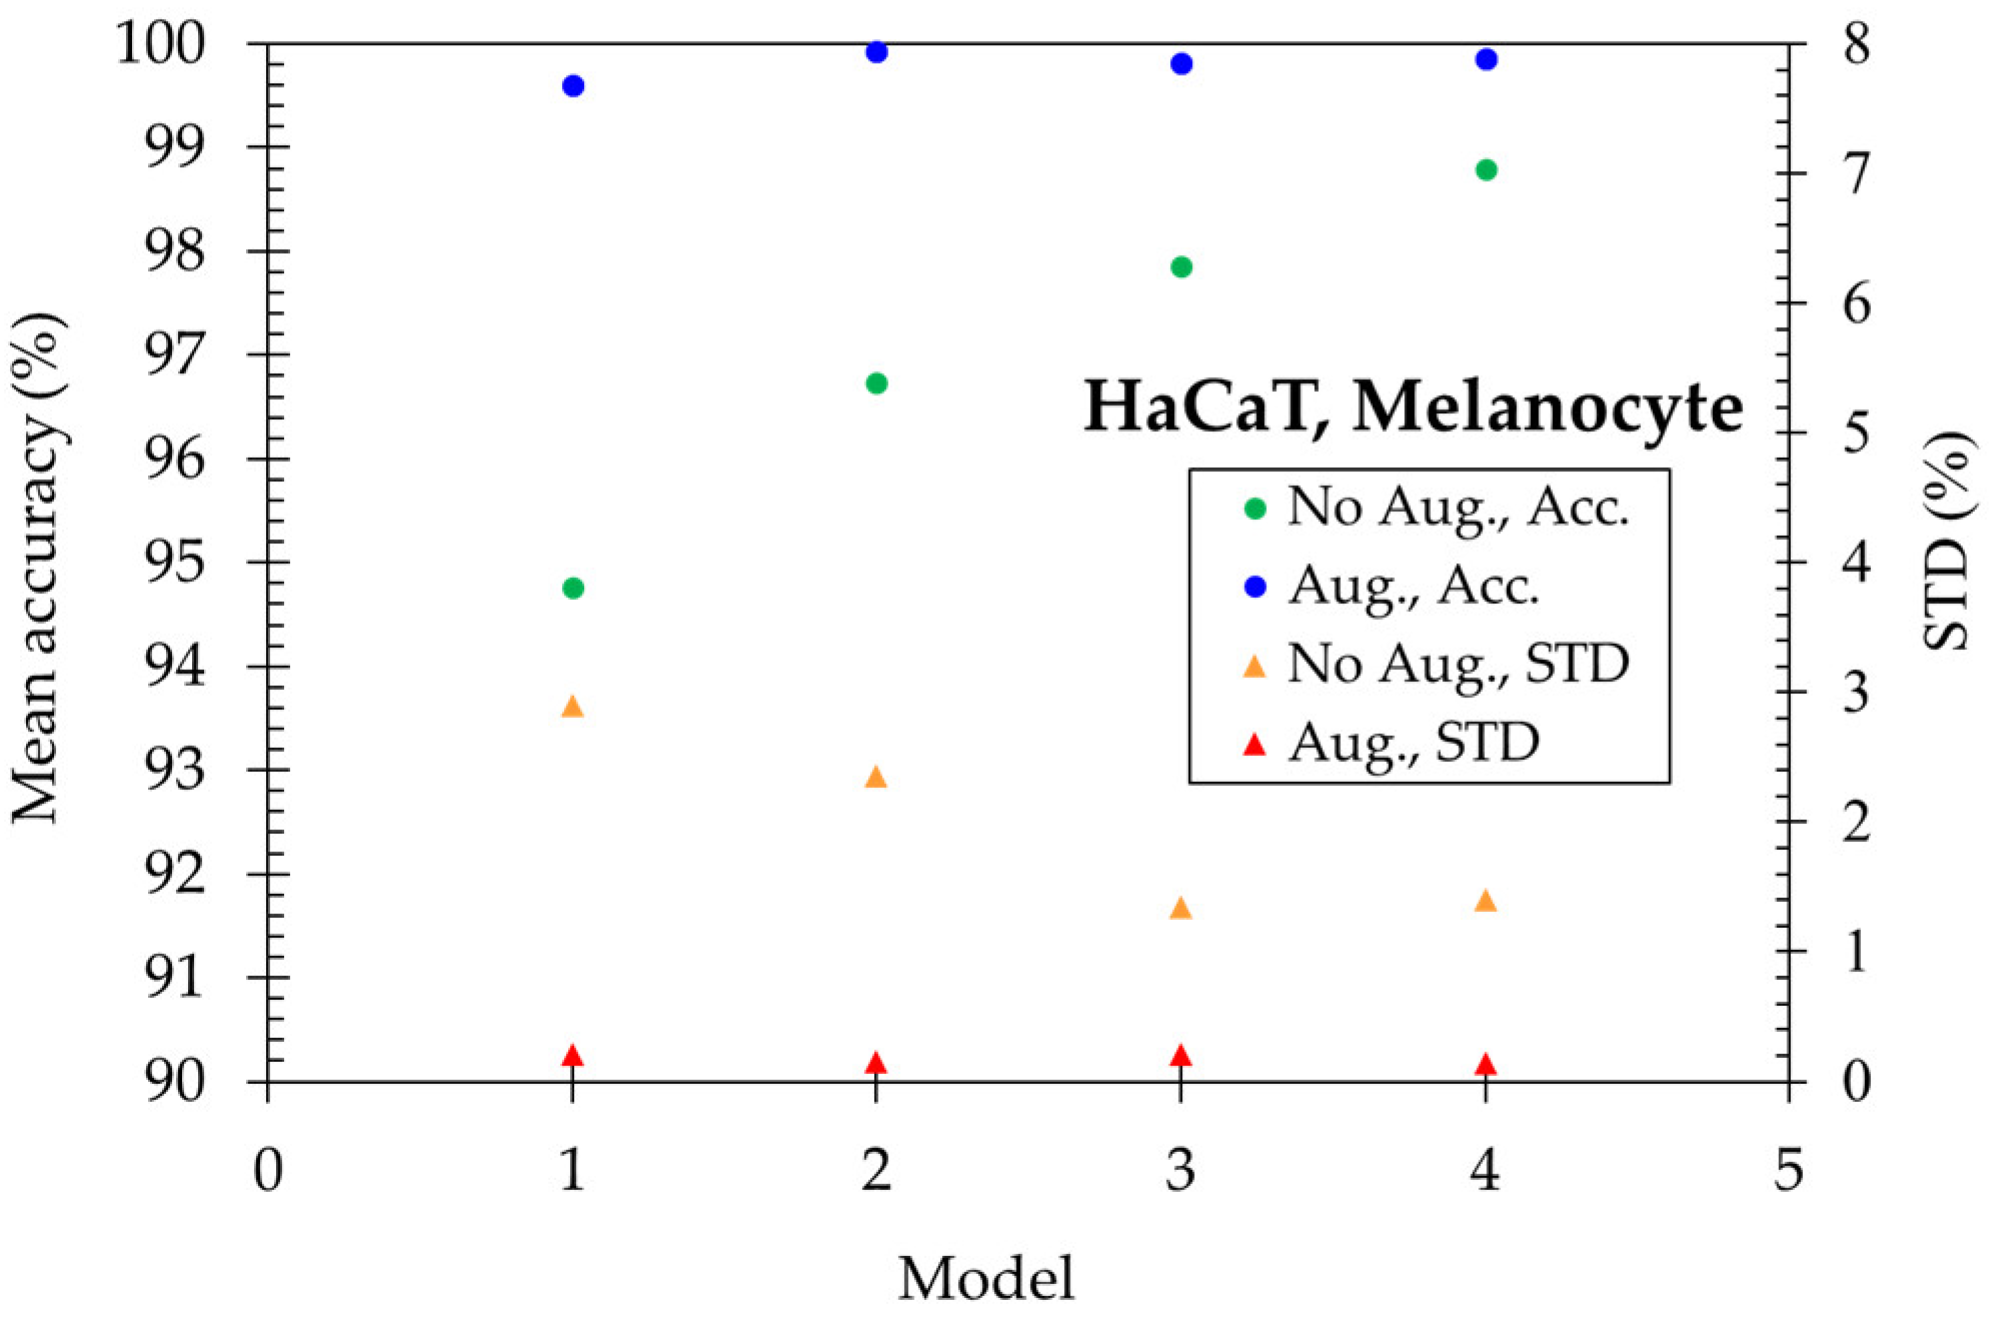
Figure 5.
The performance of four models discriminating skin cancer cells (A431, A375, and A2058).
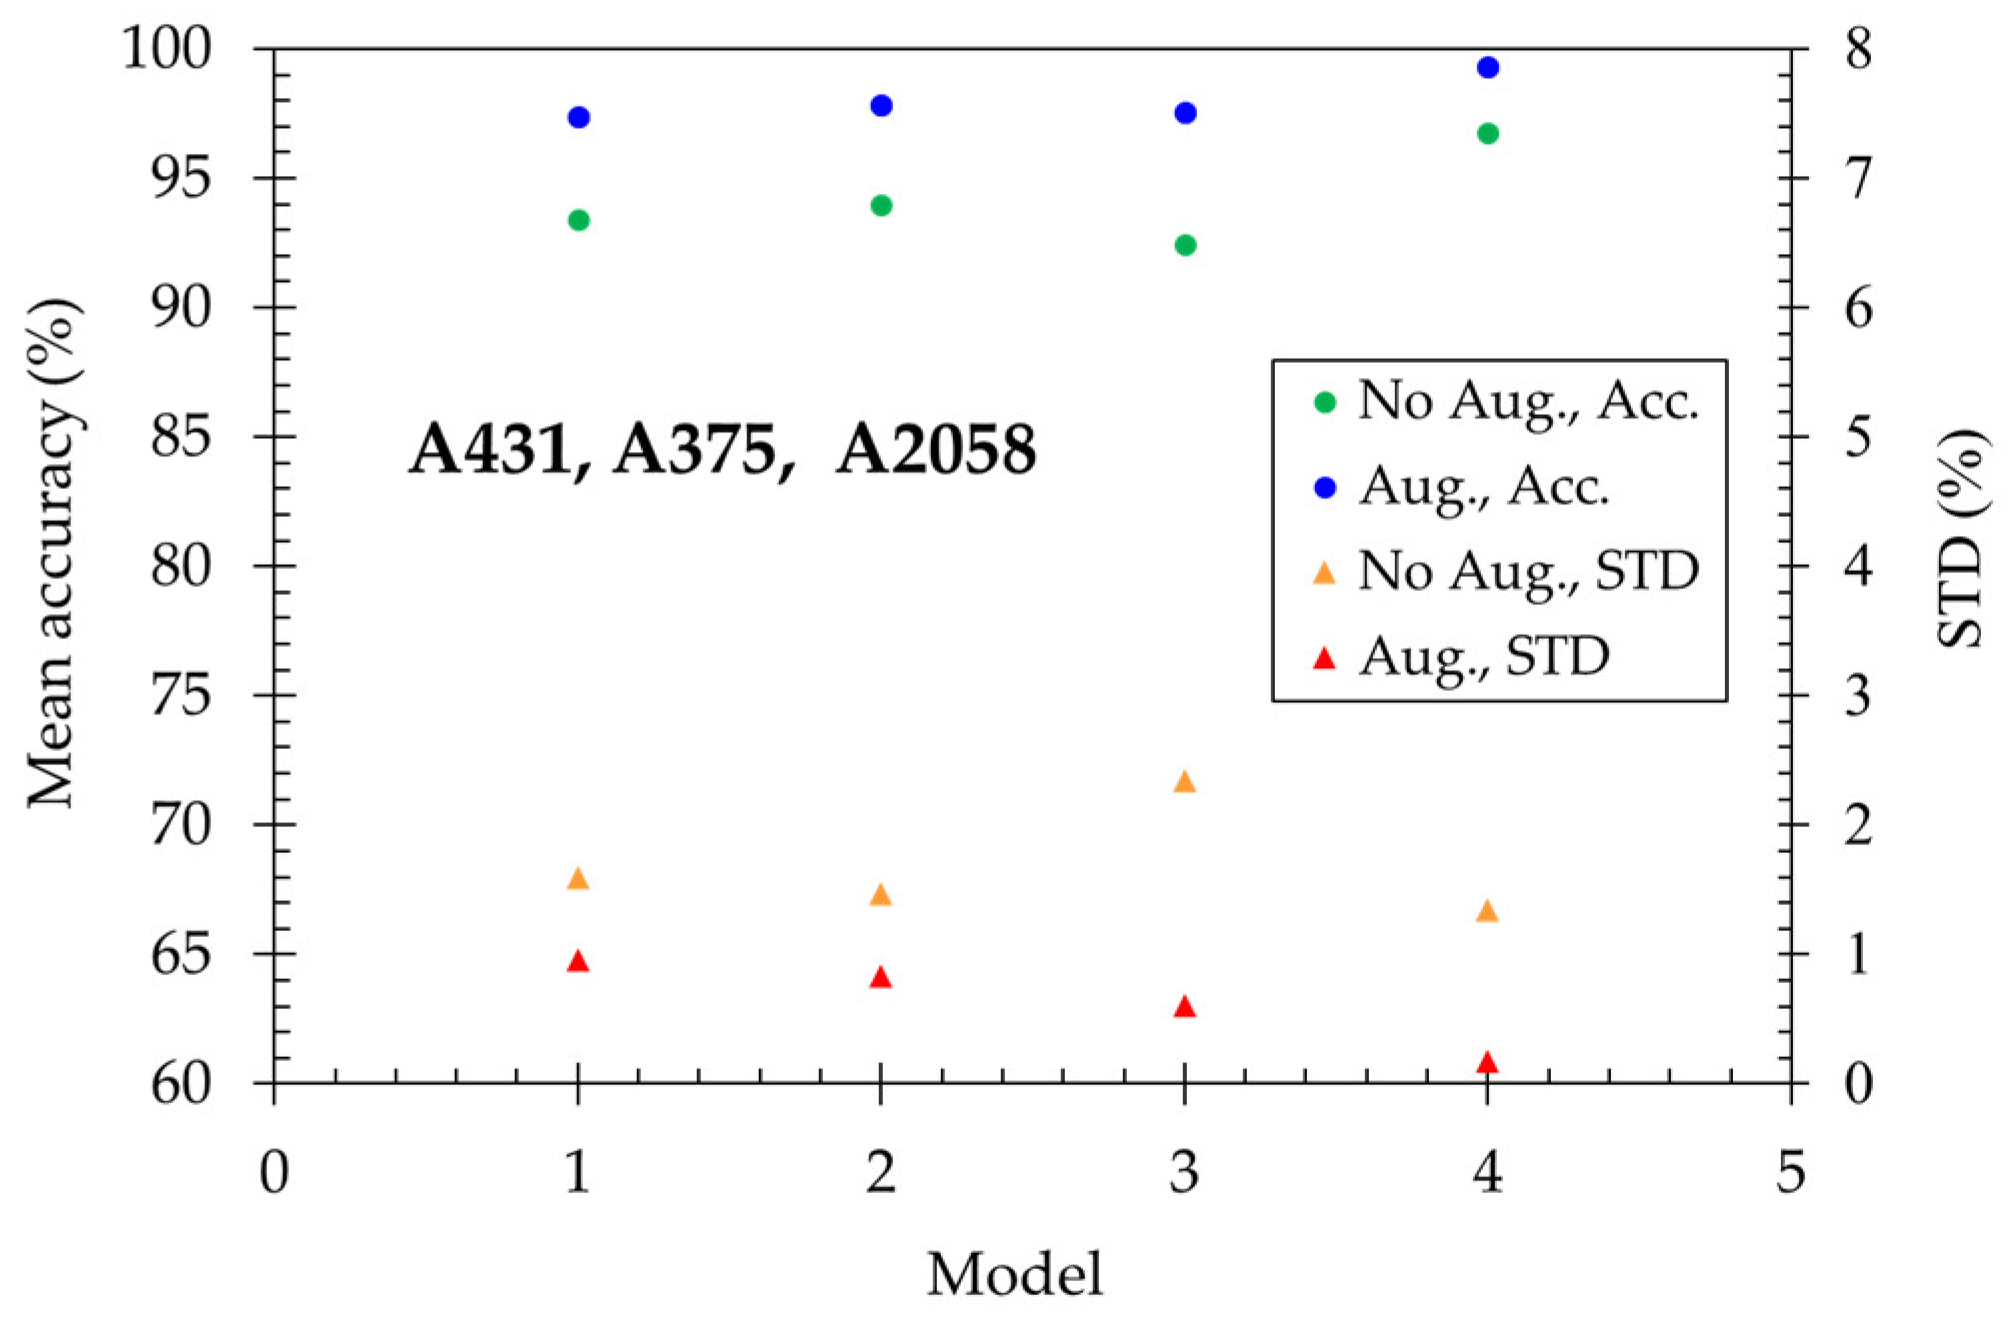
Figure 6.
The performance of four models discriminating skin normal and cancer cells (normal cells: HaCaT and Melanocyte; cancer cells: A431, A375, and A2058).
Figure 6.
The performance of four models discriminating skin normal and cancer cells (normal cells: HaCaT and Melanocyte; cancer cells: A431, A375, and A2058).
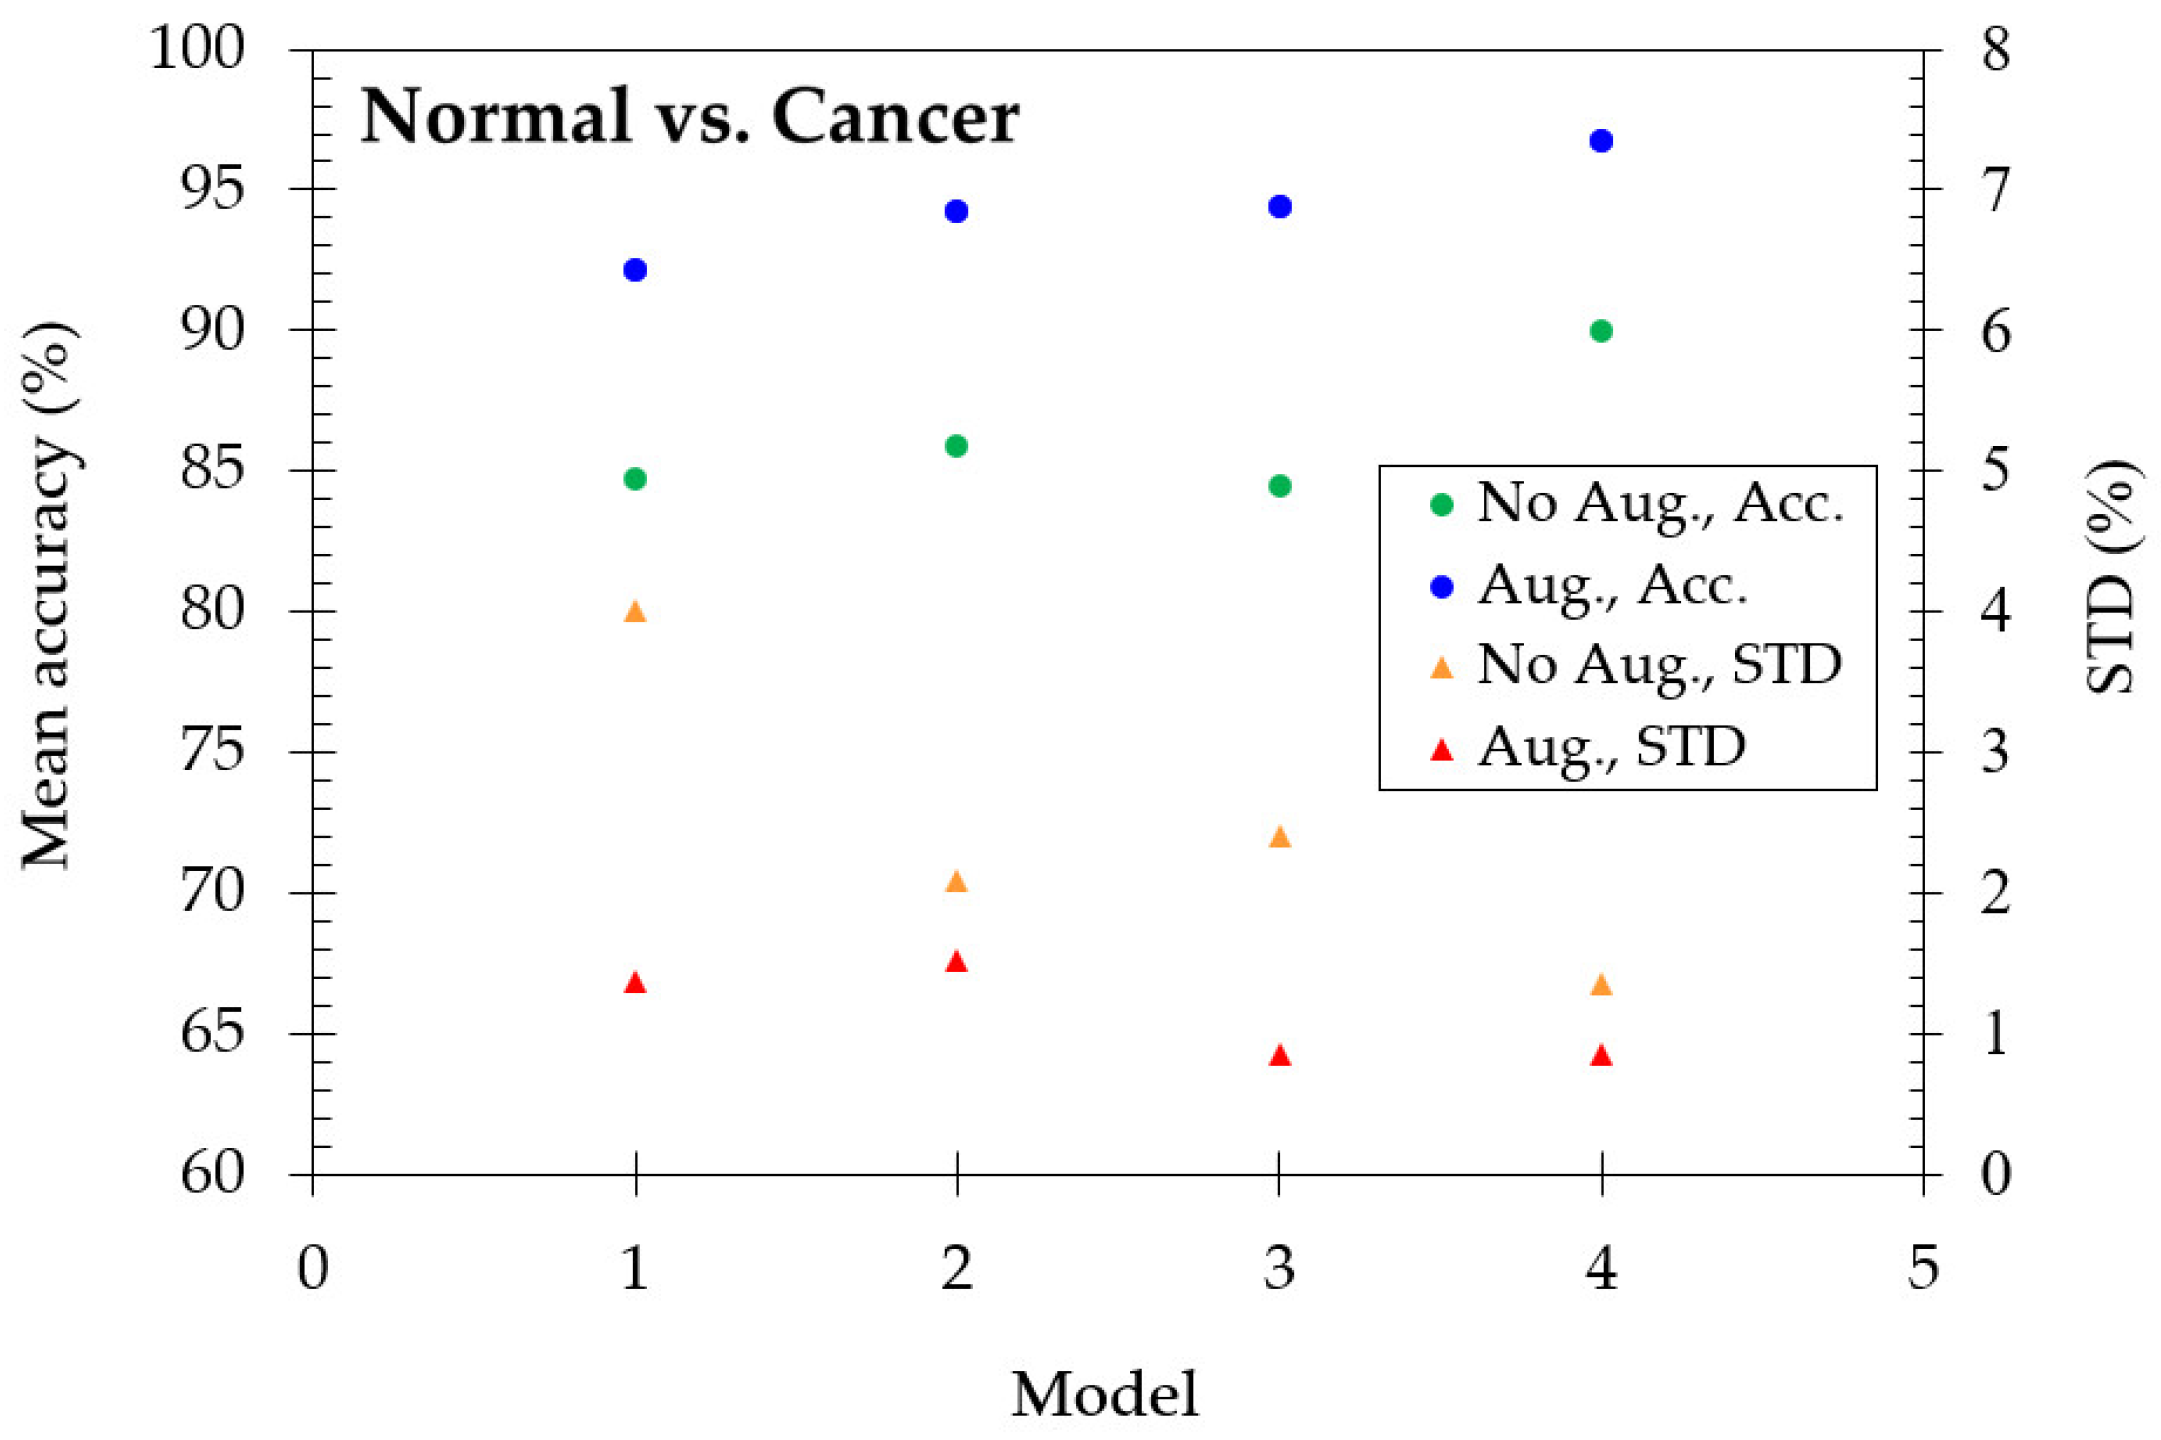
Figure 7.
The performance of four models discriminating five skin cells (HaCaT, Melanocyte, A431, A375, and A2058).
Figure 7.
The performance of four models discriminating five skin cells (HaCaT, Melanocyte, A431, A375, and A2058).
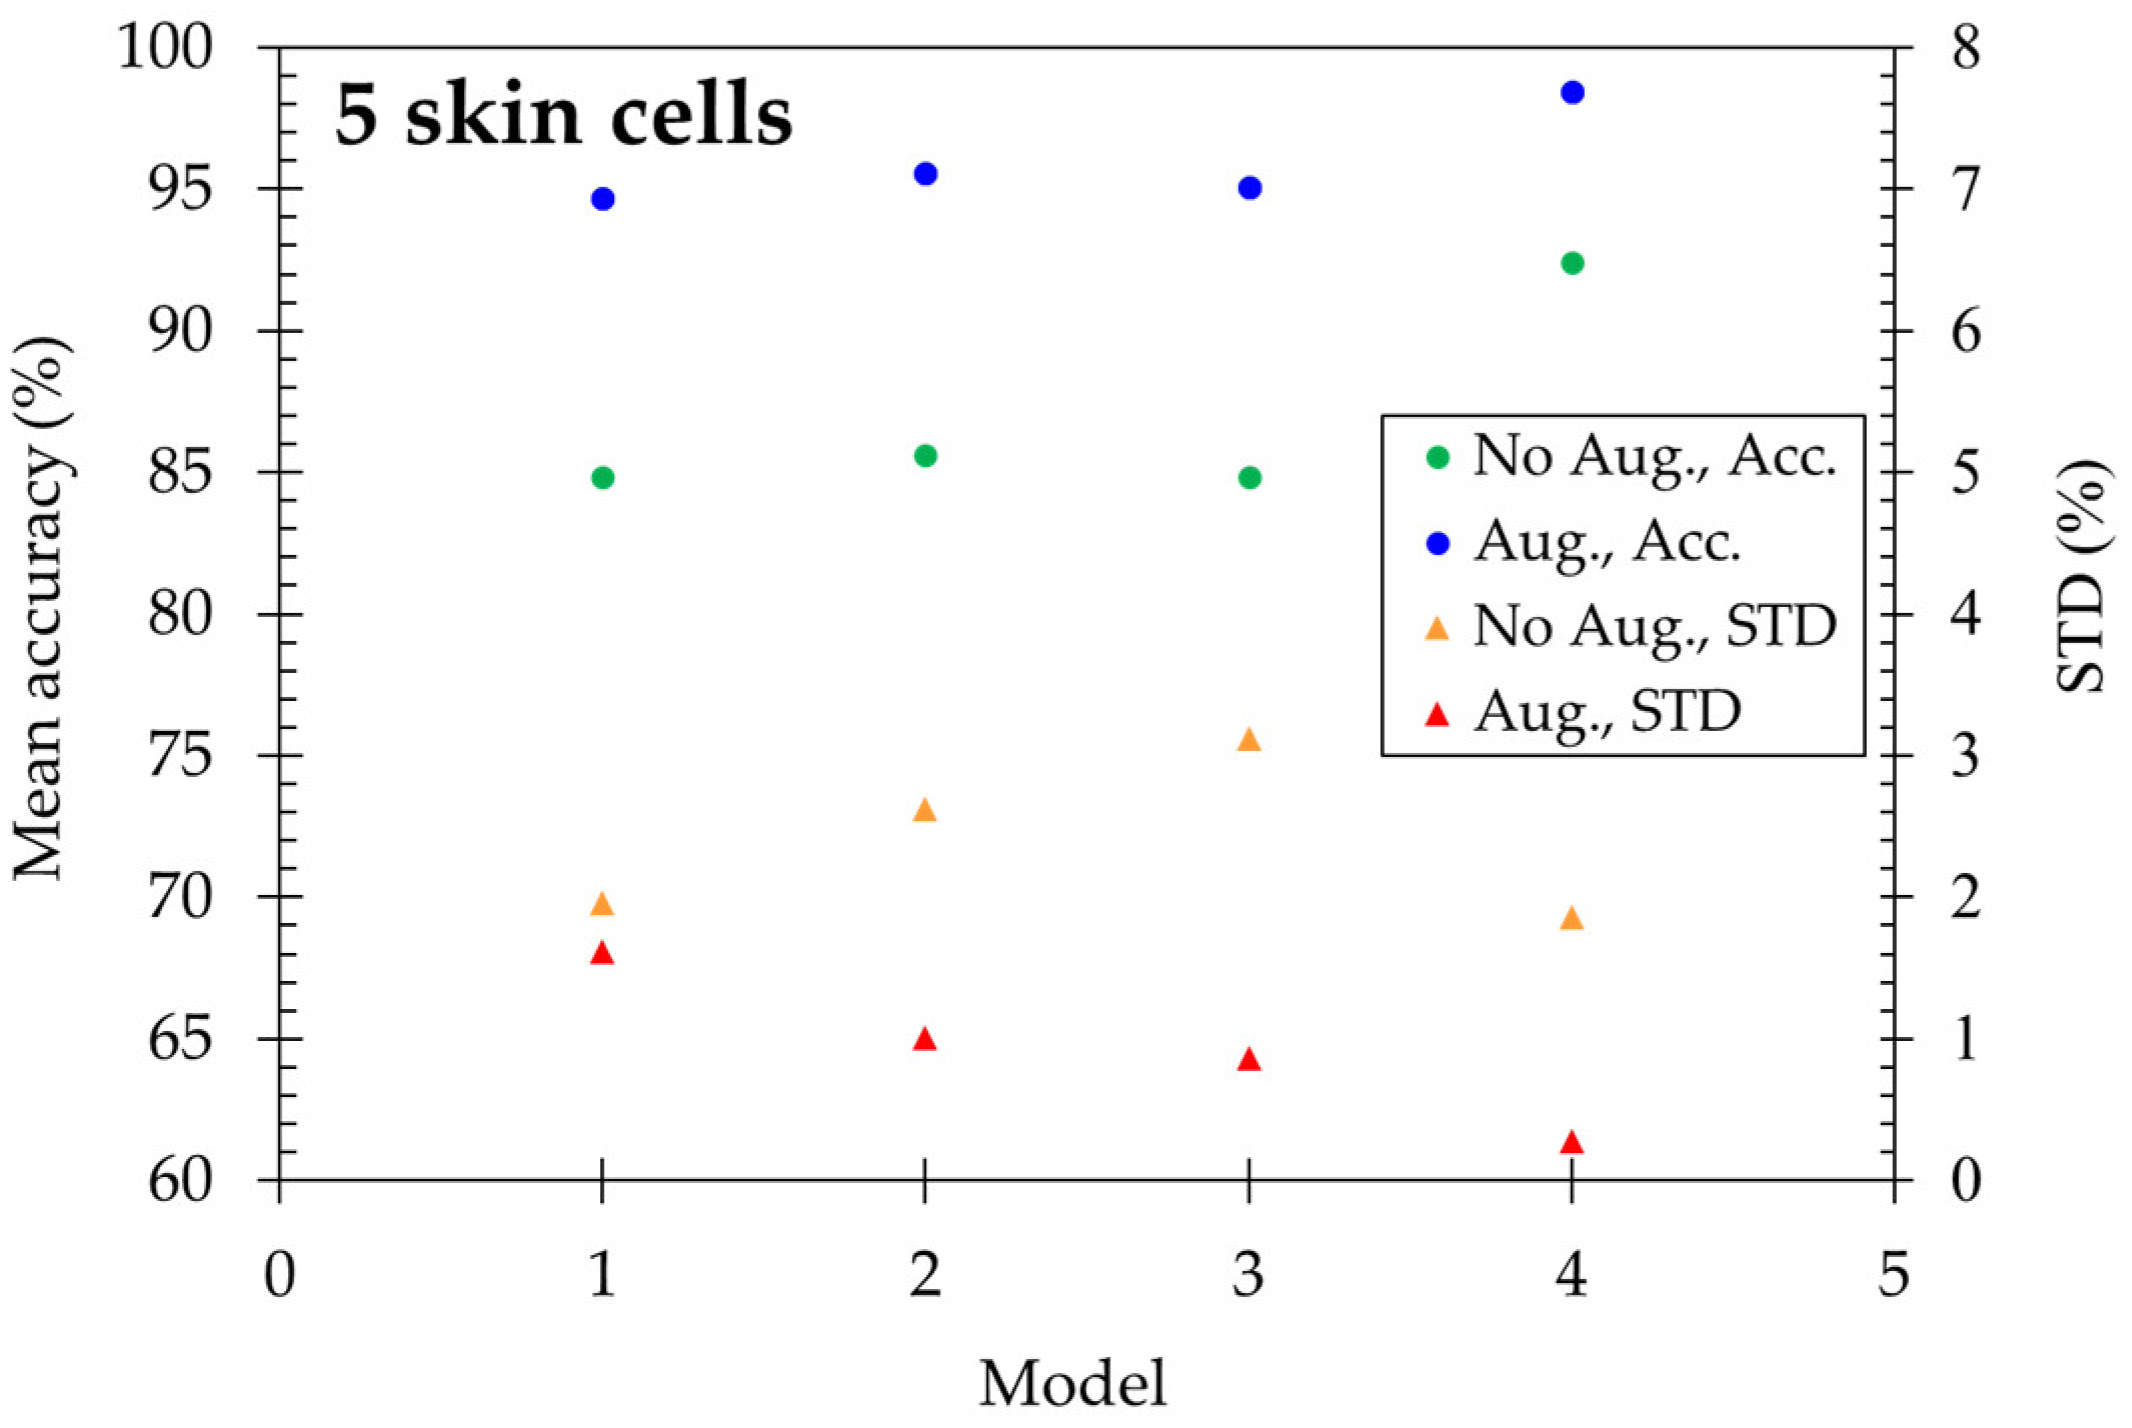
Figure 8.
Confusion matrices of 10-fold cross-validation for model-4 (ResNet-15) with 6-times data augmentation.
Figure 8.
Confusion matrices of 10-fold cross-validation for model-4 (ResNet-15) with 6-times data augmentation.
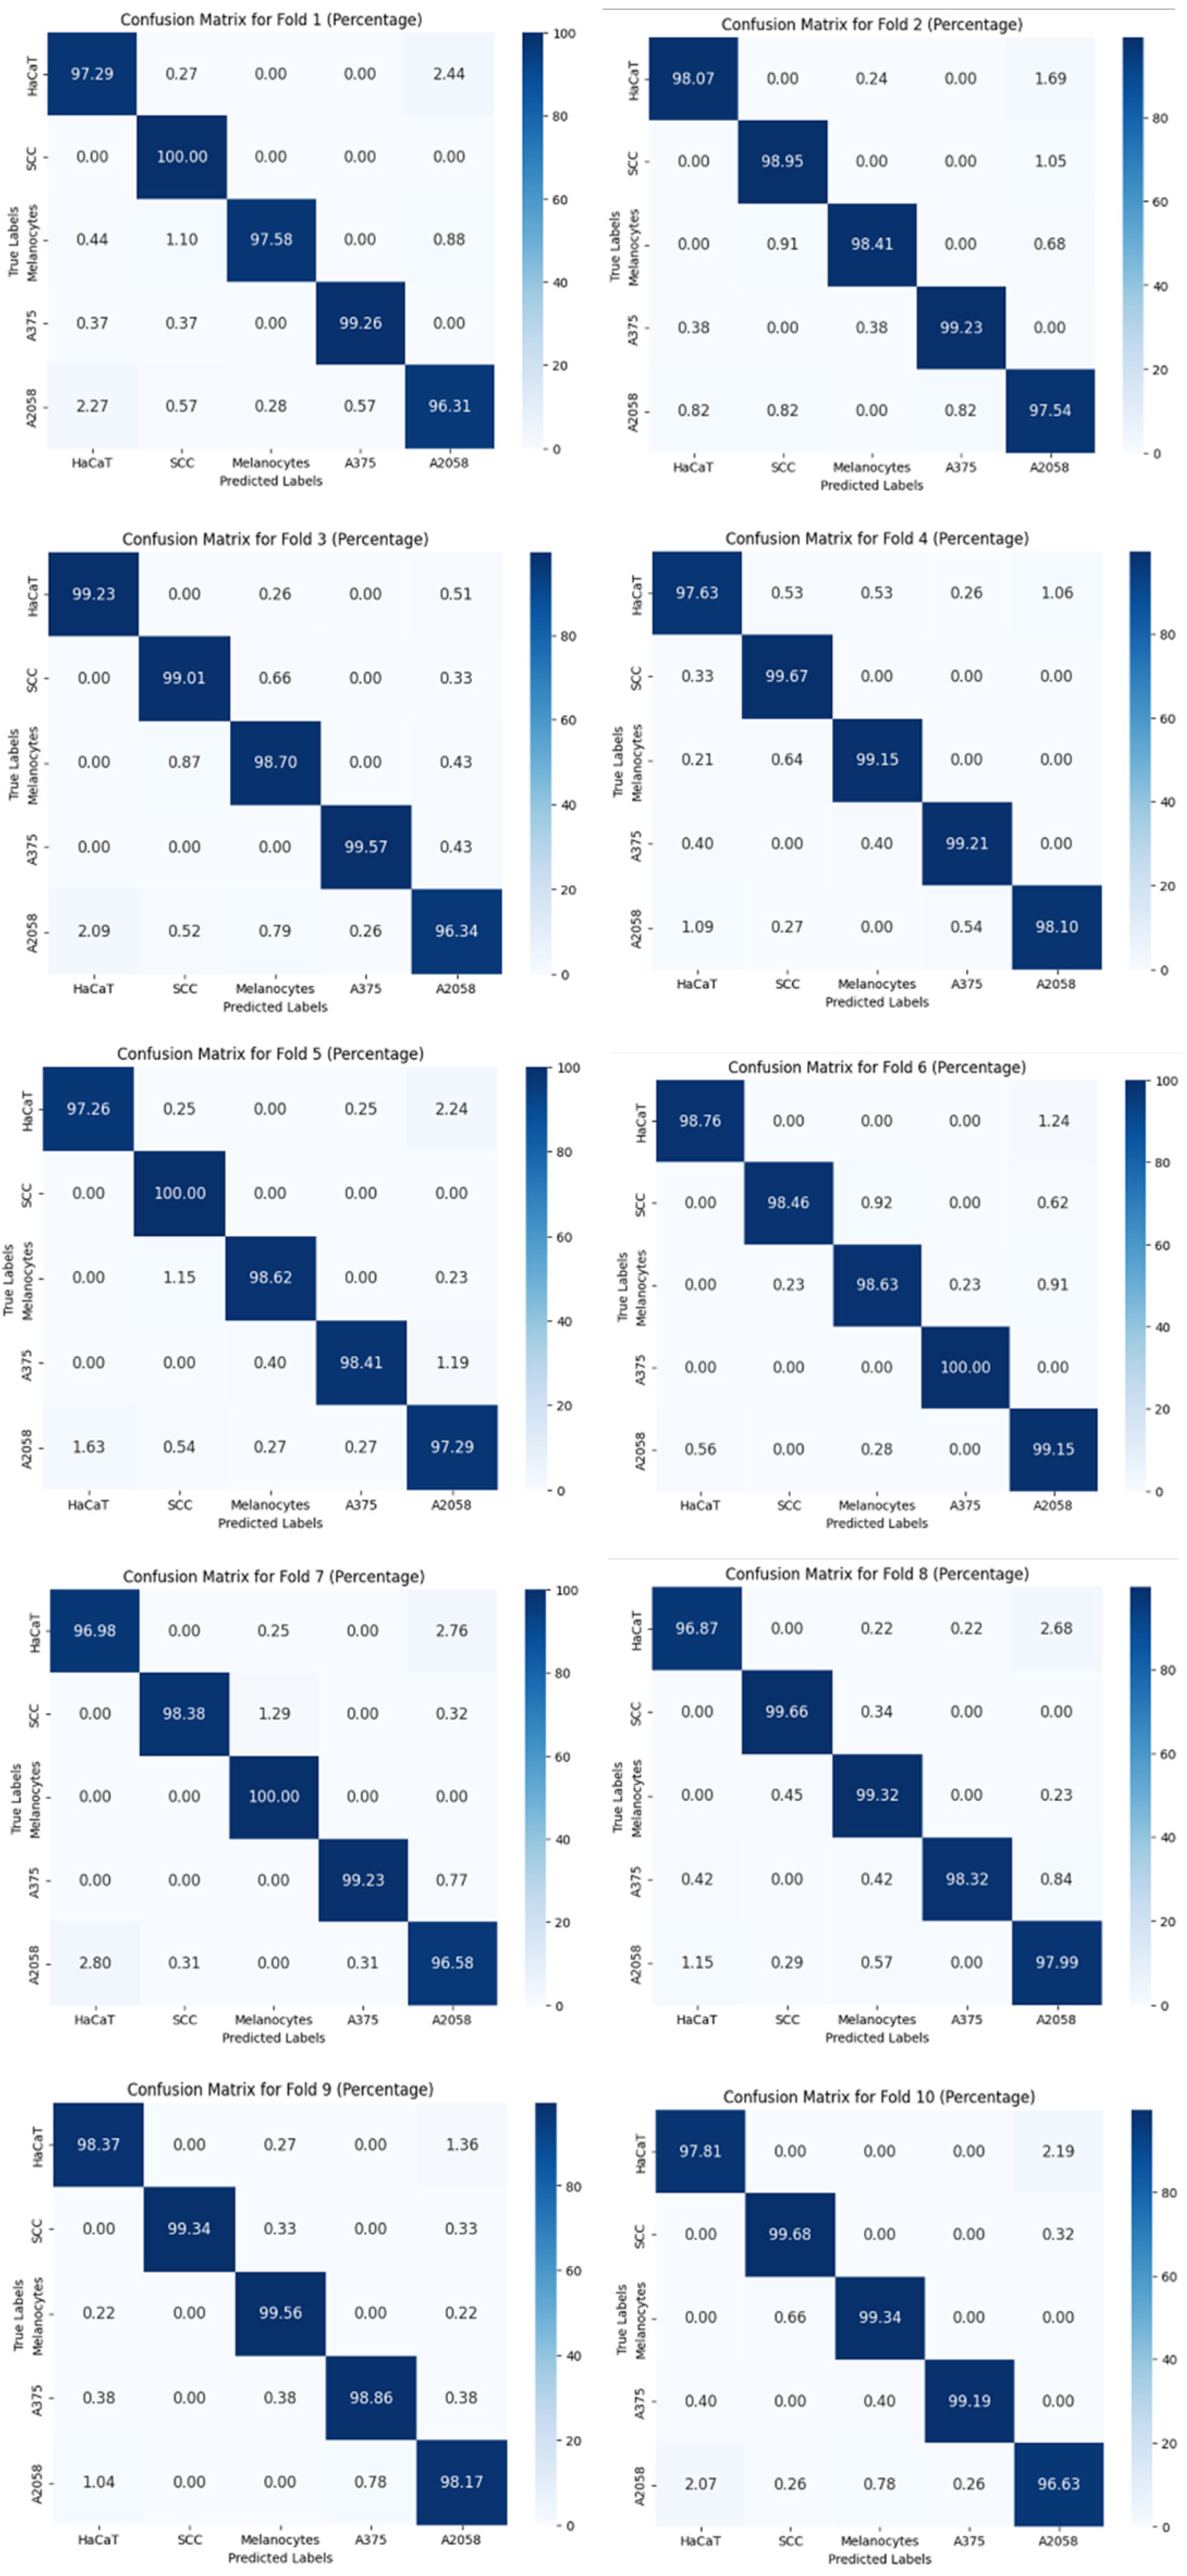
Figure 8.
Heat maps of five skin cells of ResNet-15 (a) HaCaT (normal) (b) Melanocyte (normal) (c) SCC (cancer) (d) A375 melanoma (cancer) (e) A2058 melanoma (cancer).
Figure 8.
Heat maps of five skin cells of ResNet-15 (a) HaCaT (normal) (b) Melanocyte (normal) (c) SCC (cancer) (d) A375 melanoma (cancer) (e) A2058 melanoma (cancer).
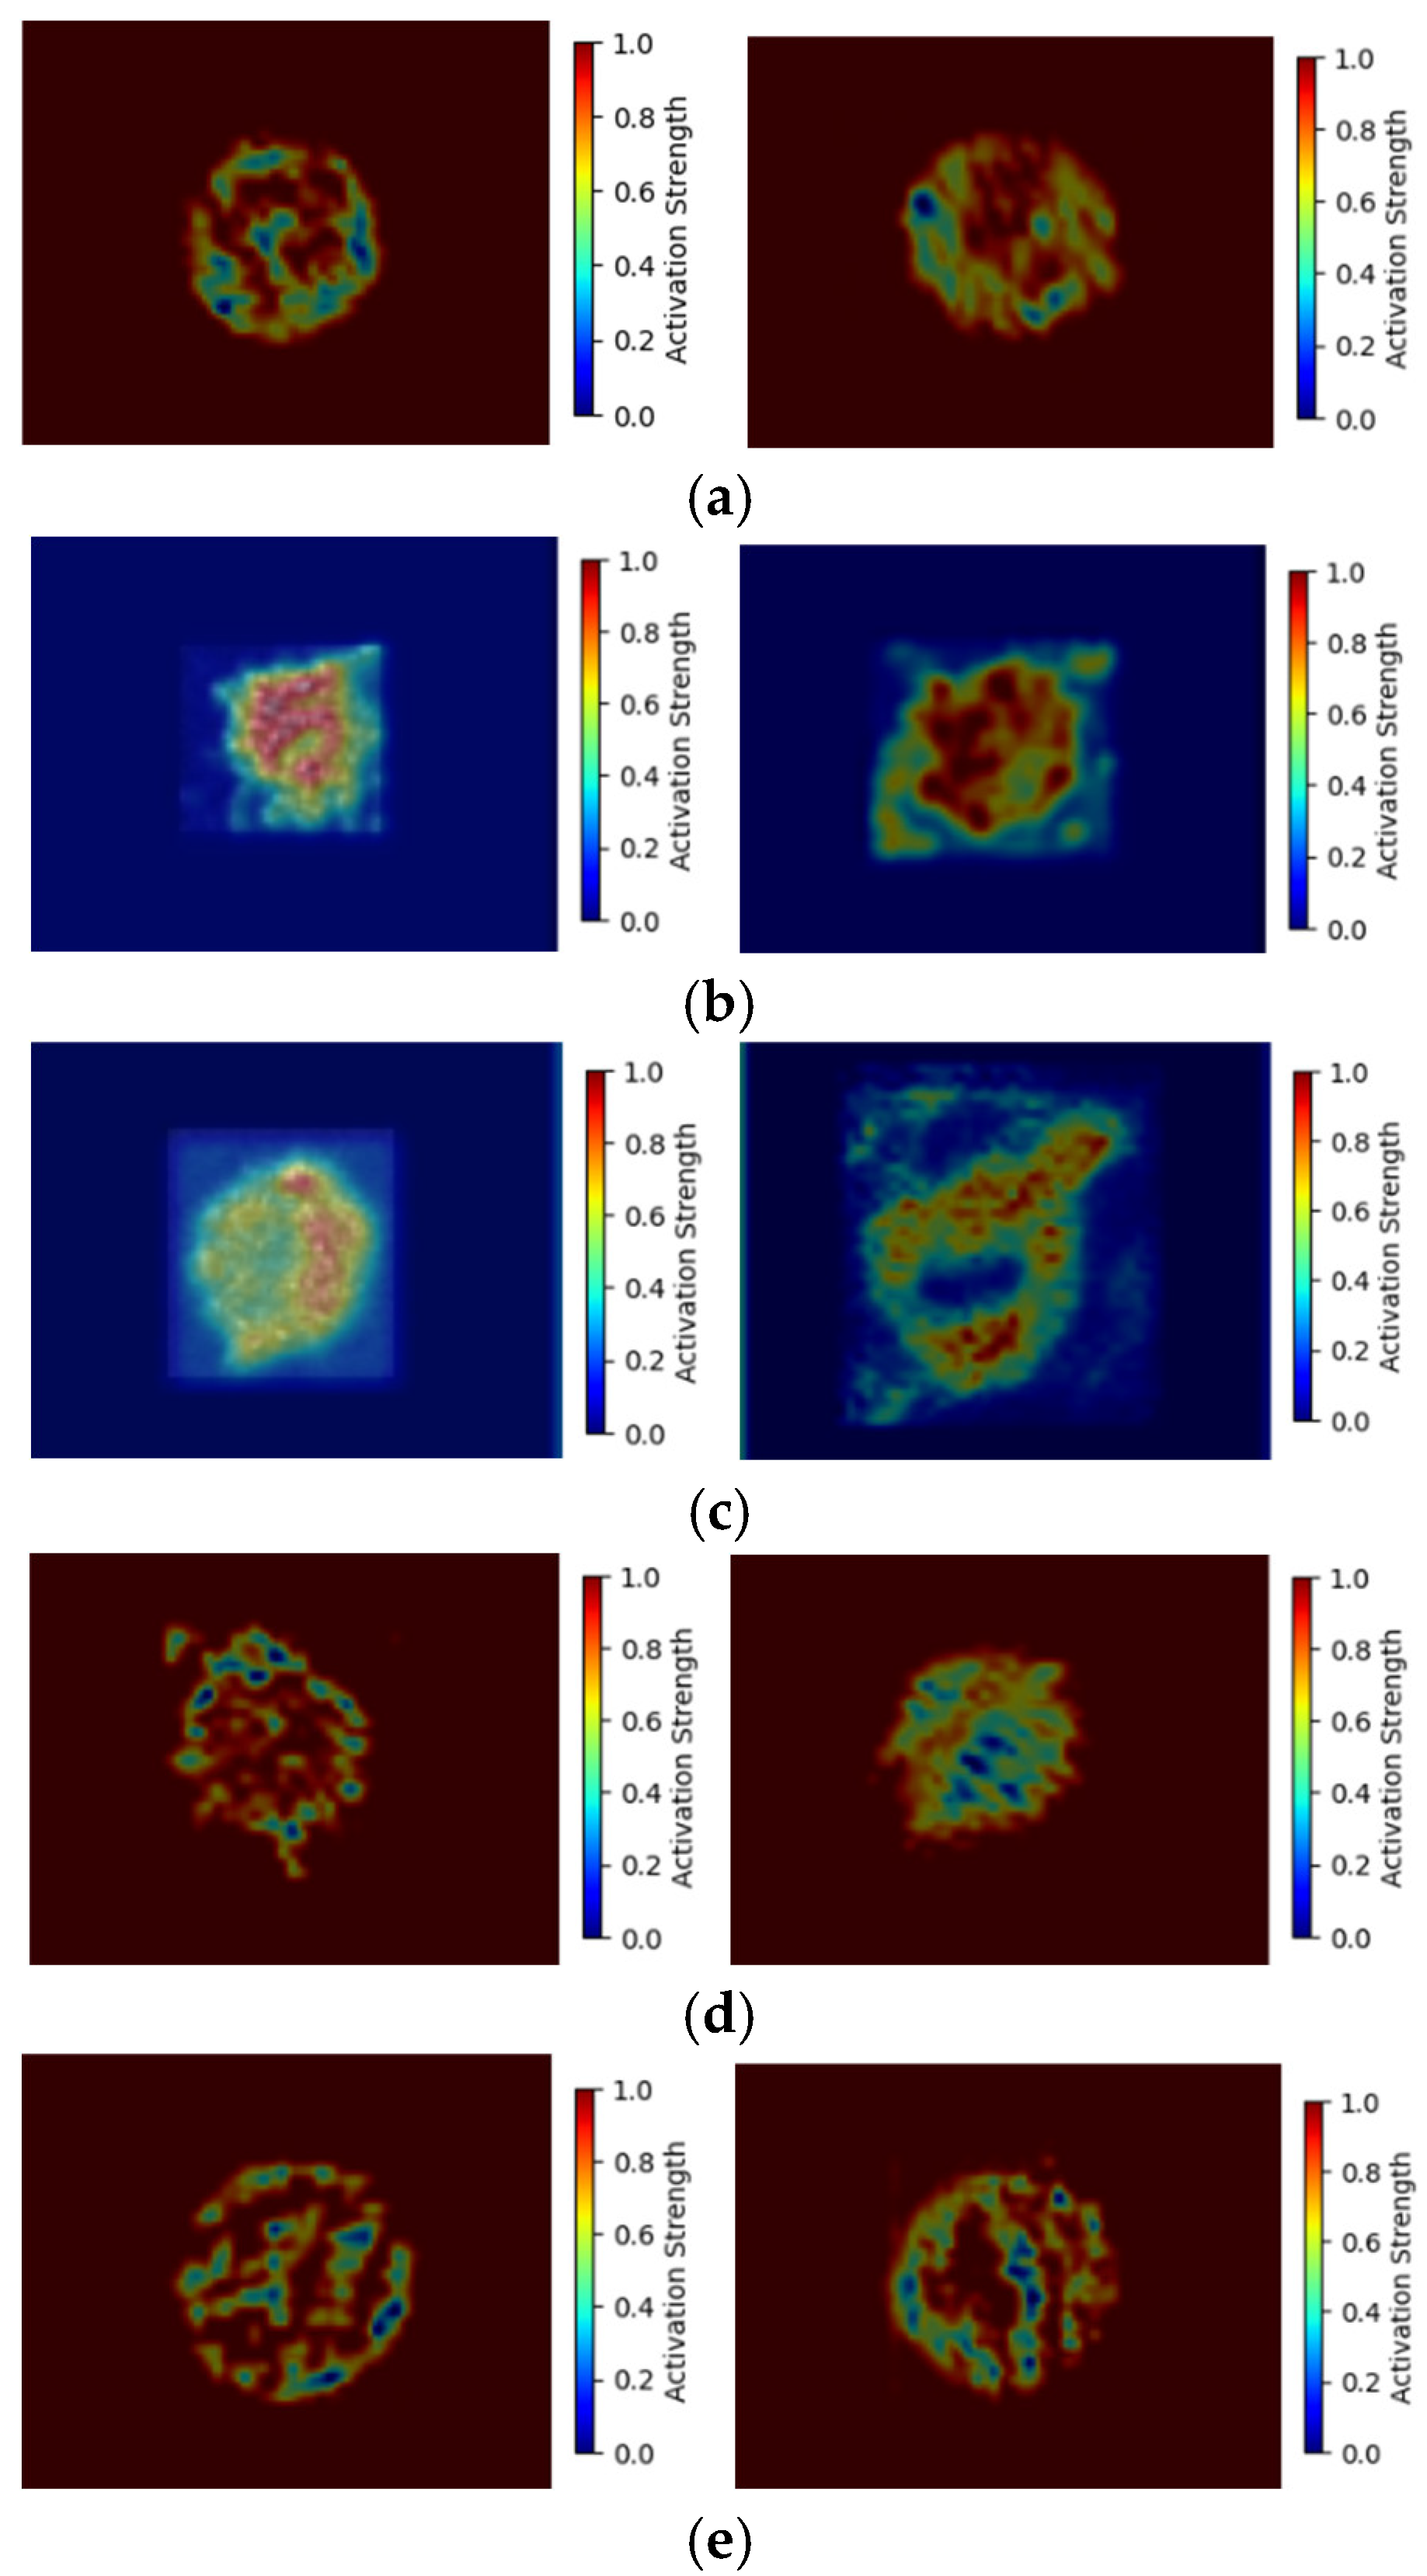

Table 1.
Four Deep learning models.
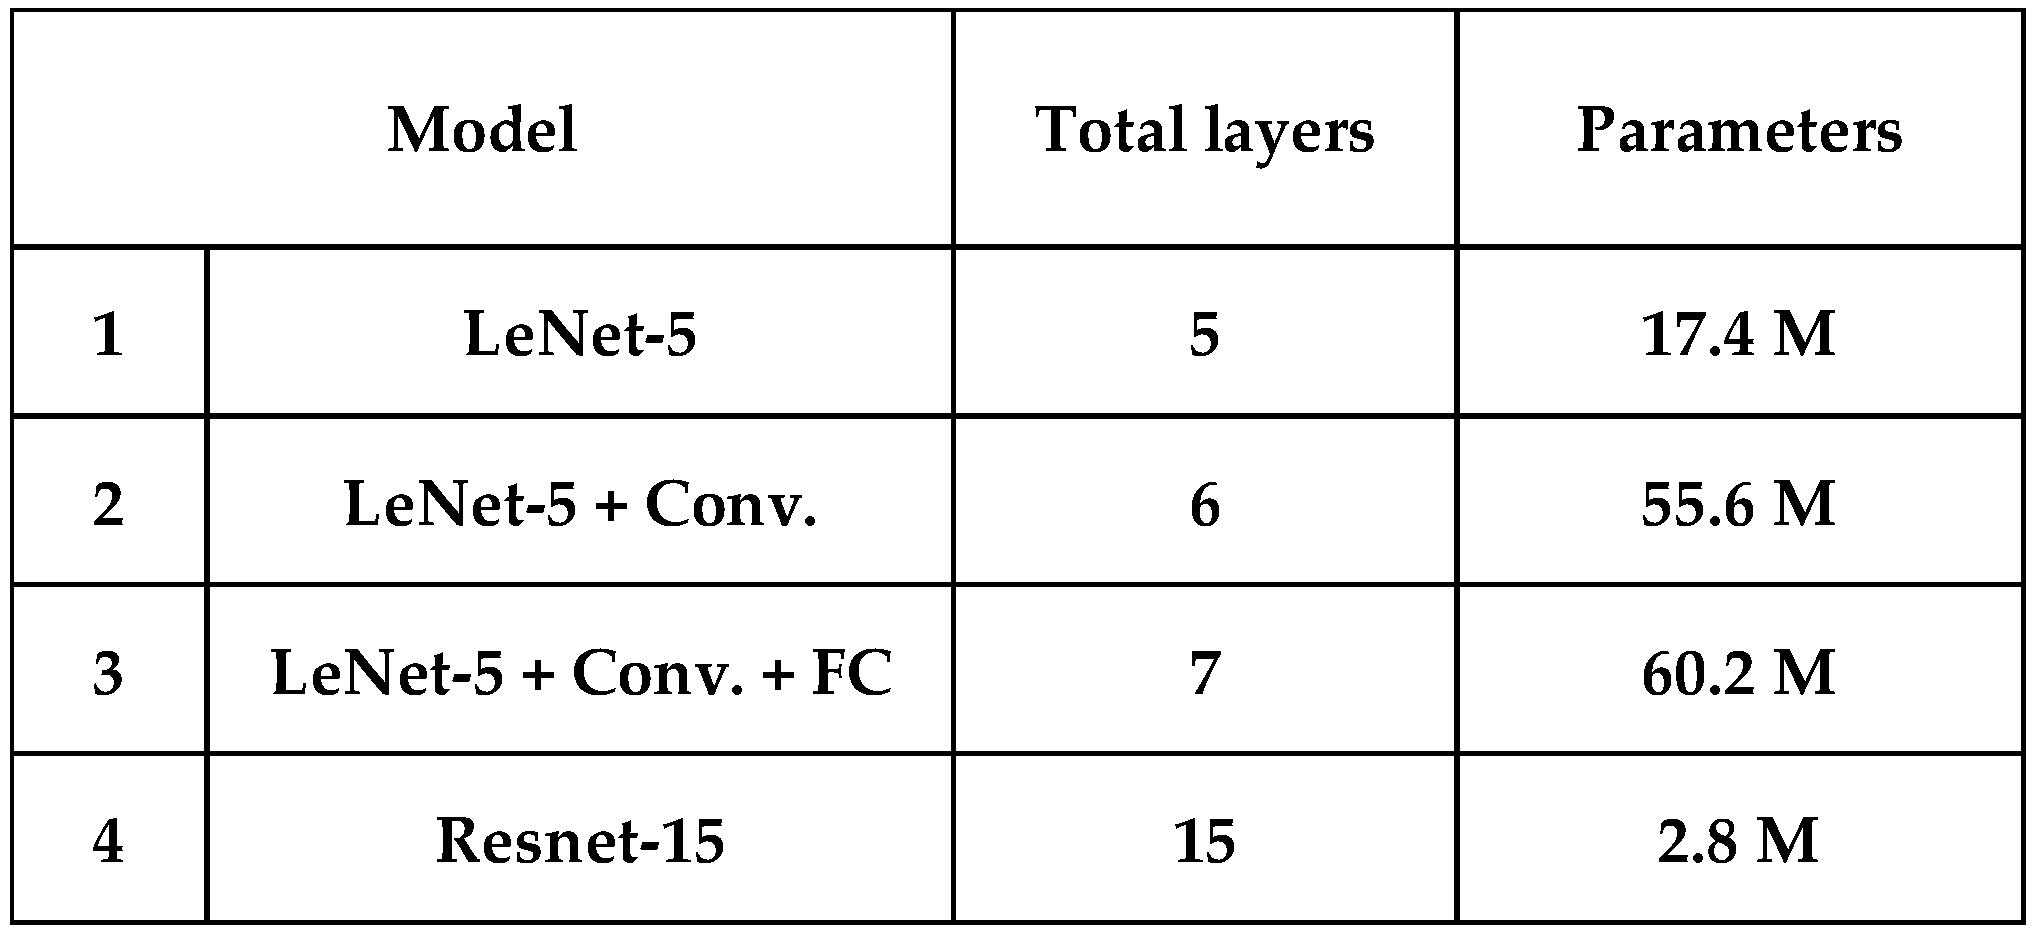 |
Table 2.
The classification accuracy for four models with 6-times data augmentation.
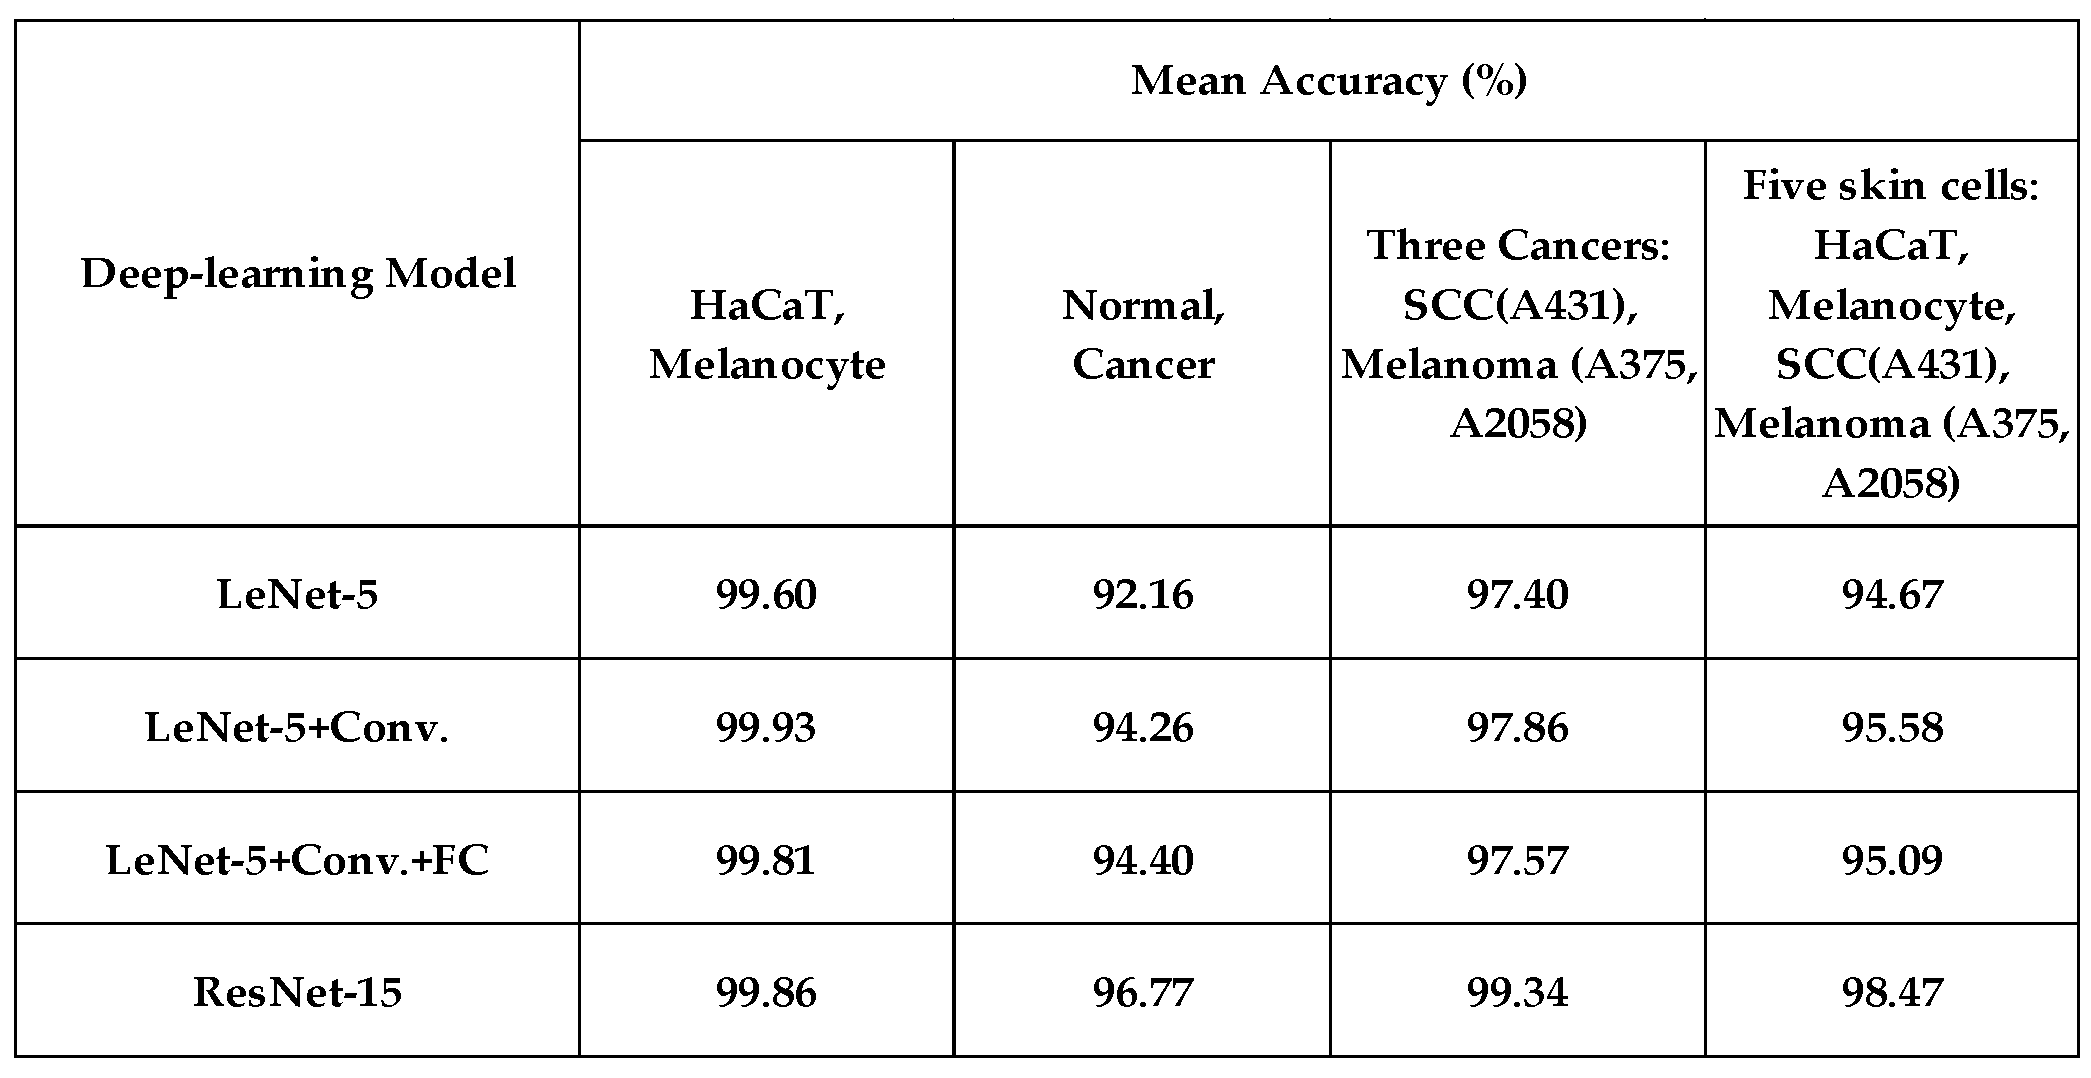 |
Table 3.
The overall accuracy of 10-fold cross-validation in classifying 5 skin cells for four deep-learning models (with 6-times data augmentation).
Table 3.
The overall accuracy of 10-fold cross-validation in classifying 5 skin cells for four deep-learning models (with 6-times data augmentation).
 |
Disclaimer/Publisher’s Note: The statements, opinions and data contained in all publications are solely those of the individual author(s) and contributor(s) and not of MDPI and/or the editor(s). MDPI and/or the editor(s) disclaim responsibility for any injury to people or property resulting from any ideas, methods, instructions or products referred to in the content. |
© 2024 by the authors. Licensee MDPI, Basel, Switzerland. This article is an open access article distributed under the terms and conditions of the Creative Commons Attribution (CC BY) license (http://creativecommons.org/licenses/by/4.0/).
Copyright: This open access article is published under a Creative Commons CC BY 4.0 license, which permit the free download, distribution, and reuse, provided that the author and preprint are cited in any reuse.


