Background
Bhutan went through a significant developmental transition during the reign of the Third Druk Gyalpo Jigme Dorji Wangchuck. The year 1952 marked the beginning of modernization with the introduction of land reforms. The following year, the National Assembly was established. In 1961, the First Five-Year Plan was commenced which aimed at stimulating the Bhutanese economy and promoting economic self-reliance (Tashi & Maxwell, 2016). Furthermore, during the reign of the Fourth Druk Gyalpo, the concept of Gross National Happiness (GNH) framework was introduced in 1972. GNH is a developmental philosophy/framework that the prioritizes happiness of the people over Gross Domestic Product (GNH Center, n.d.) and the incorporation of the GNH framework in the country’s economic pursuit led to a more sustainable economic development. The Twelfth Five Year Plan ended in 2023 and the Thirteenth Five Year Plan is in the process of being finalized. Among its numerous aims, one of them is to transform the country into a ‘high-income sustainable economy by 2034’ (Pem, 2024). In the following paragraphs, findings on Bhutan’s position in its economic development trajectory are discussed and analyzed to determine Bhutan’s current economic situation along with its future prospects.
Developmental Indicators
To carry out discussions on Bhutan’s position in its economic development trajectory, a total of five economic development indicators are identified as follows:
Gross Domestic Product
Living standards
Education
Poverty
Gross National Happiness
Gross Domestic Product
Gross Domestic Product (GDP) is the total market/monetary value of finished products within a country’s borders during a specific period (National Statistics Bureau). The GDP is measured both in current and constant prices with the year 2000 as the base year. The current price estimate is the money value of all goods and services produced in the economy at prices prevailing in the year of reporting, while the constant price estimate reflects the money value of all goods and services at base year prices. The table below shows the GDP report in the National Accounts Statistics 2022 published by the National Statistics Bureau.
Table 1.
Gross Domestic Product.
Table 1.
Gross Domestic Product.
| Year |
GDP (Nu. Million) |
GDP growth rate (%) |
| 2011 |
82938.12 |
7.98 |
| 2012 |
95186.52 |
5.12 |
| 2013 |
102909.95 |
2.12 |
| 2014 |
116388.56 |
5.78 |
| 2015 |
128534.63 |
6.64 |
| 2016 |
145072.86 |
8.13 |
| 2017 |
159571.70 |
4.65 |
| 2018 |
167339.97 |
3.06 |
| 2019 |
178561.73 |
5.76 |
| 2020 |
172295.25 |
(10.01) |
| 2021 |
187772.77 |
4.09 |
| Average |
4.71 |
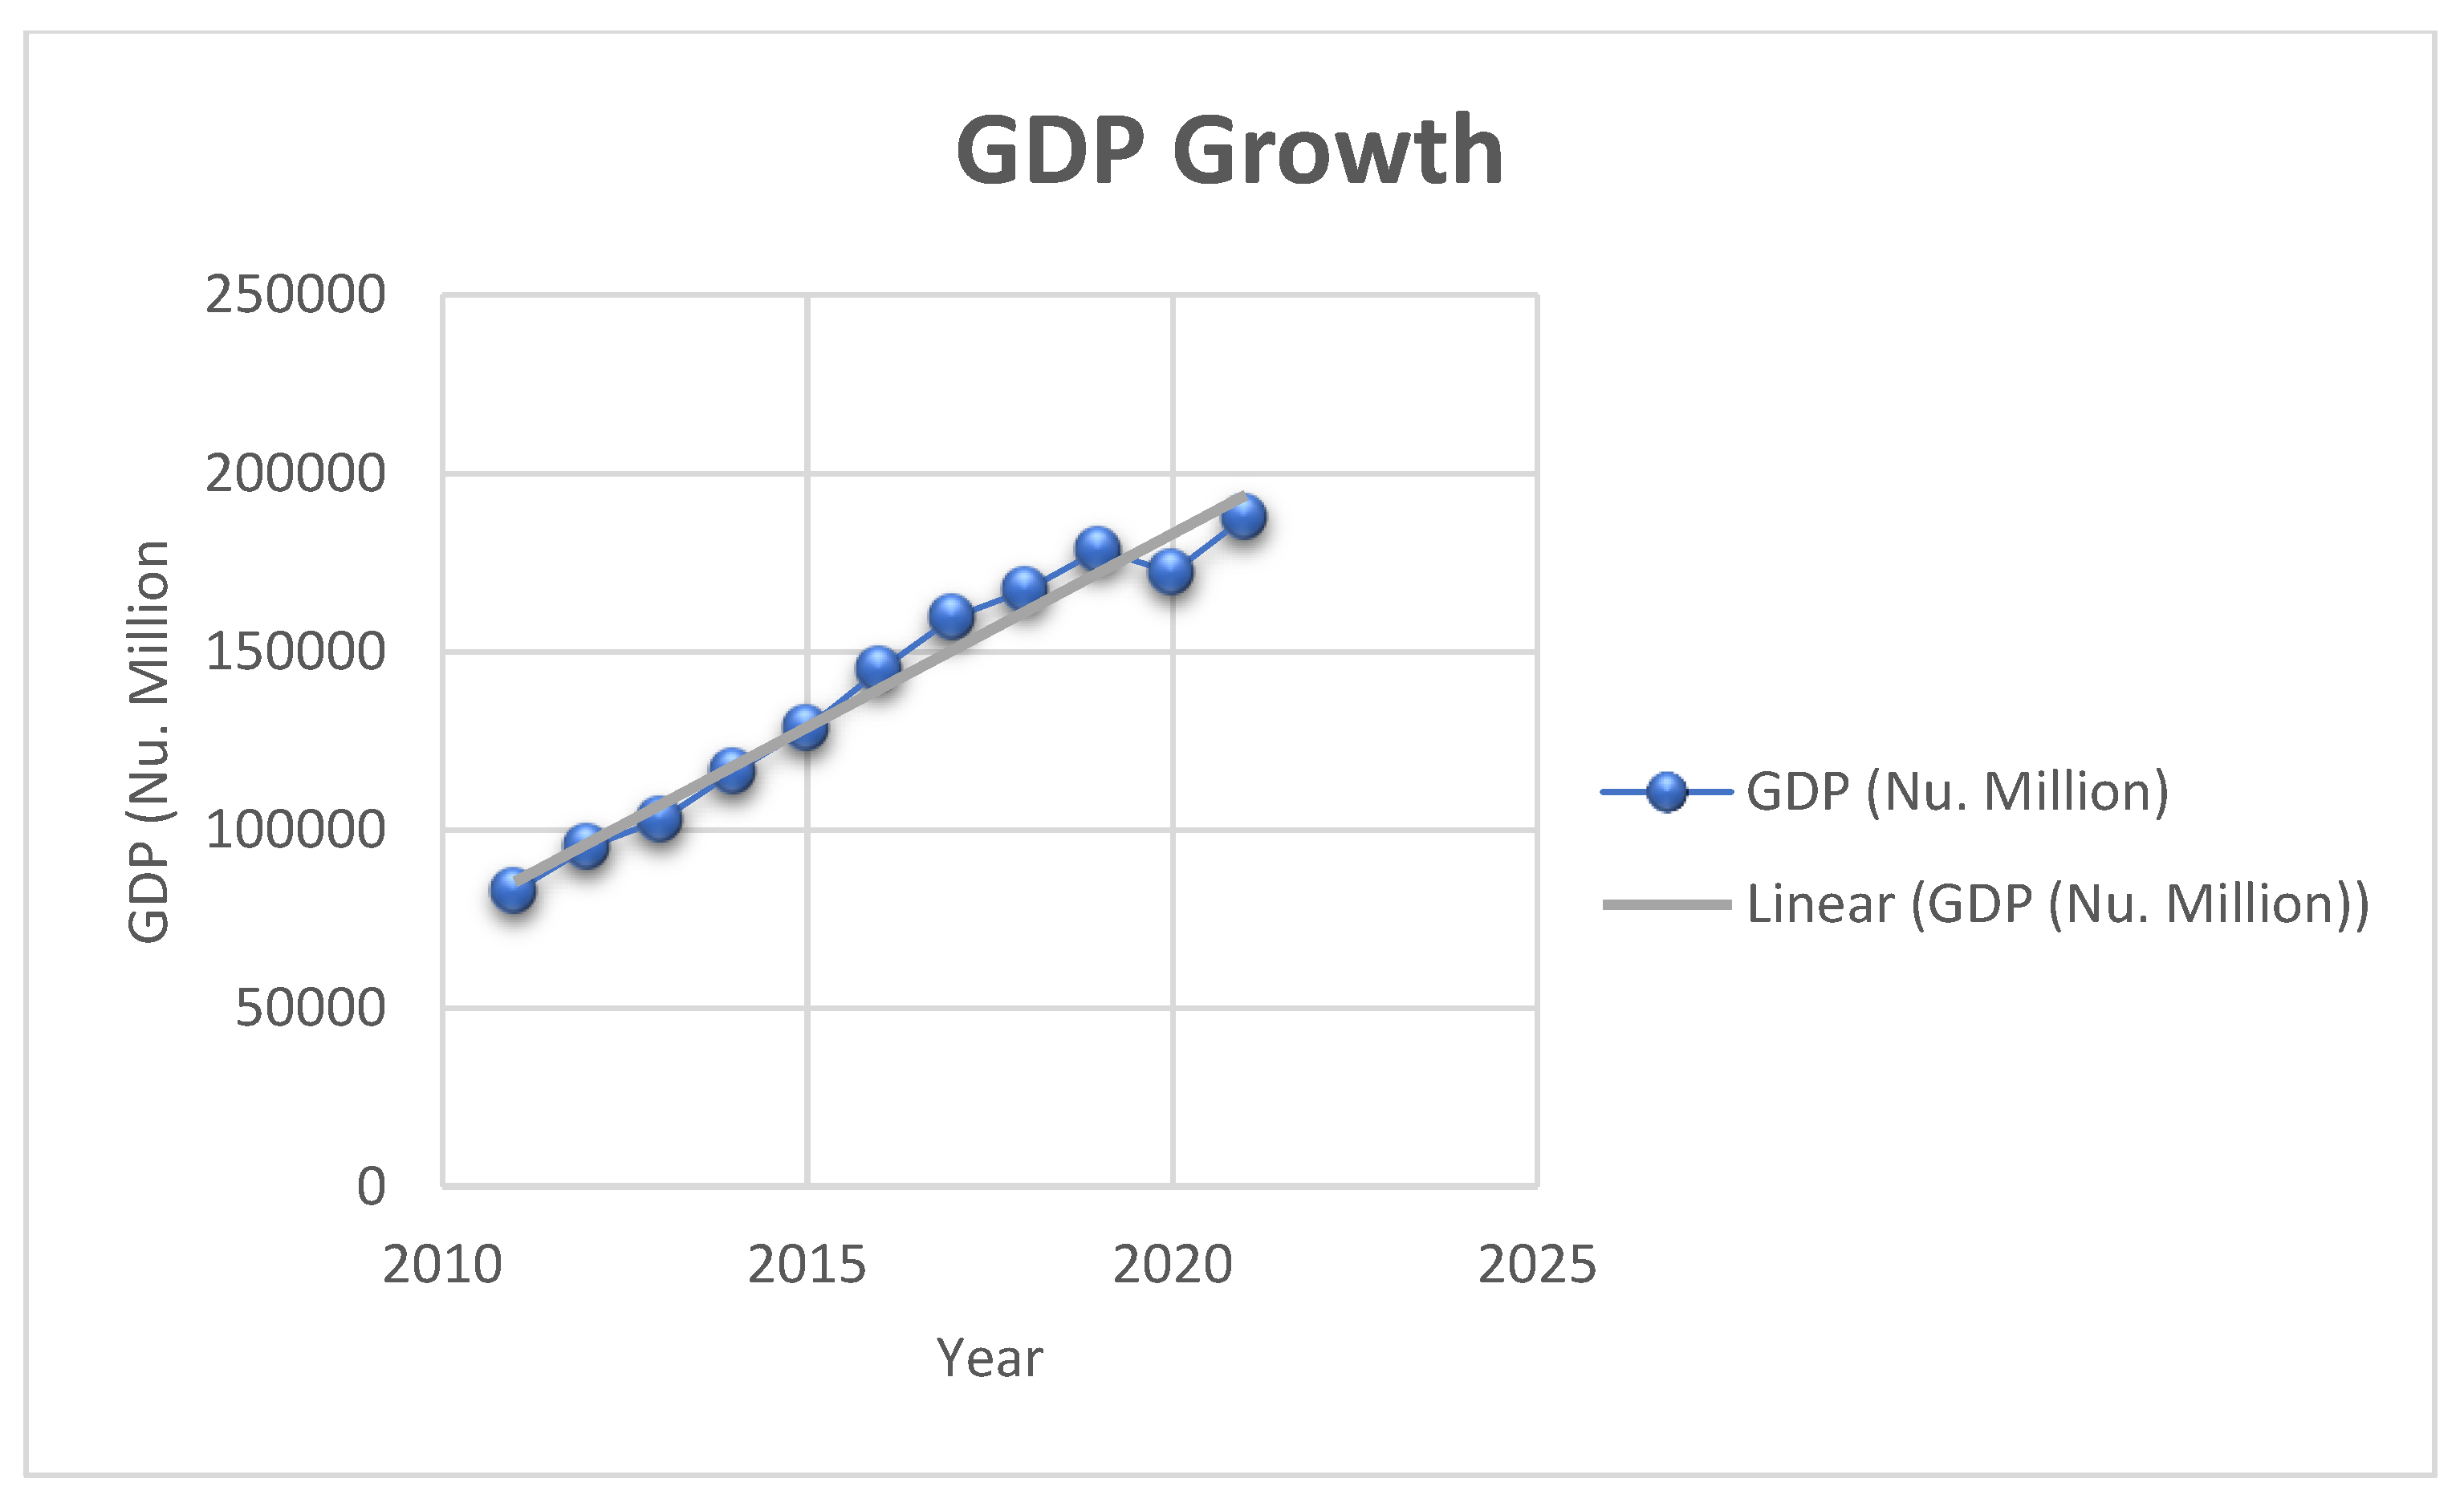
Bhutan’s GDP has been relatively stable with an average annual growth rate of 4.71% between 2011 and 2021. GDP in constant prices increased to Nu. 178561.73 million in 2021 from Nu. 82938.12 million in 2011, showing an increase of 126.40 percent.
Figure 1. shows increasing trend in the country’s GDP indicating economic development. Sectors such as Hotels & Restaurants and Mining and Quarrying contributed the largest share to 2011’s GDP. Similarly, Mining & Quarrying, Transport & Communication, Construction, and Wholesale and Retail Trade were leading contributors to 2021’s GDP. Industrialization of numerous economic sectors are evident along with expansion and development of tertiary sectors such as communication.
Living Standard
Bhutan conducts a series of living standard surveys with the fifth and the latest one being conducted in 2022. The Bhutan Living Standard Survey (BLSS) provides insight into the living conditions of the Bhutanese people. The 2012 BLSS reported that several residents residing in Thimphu city demanded sewage connection and piped drinking water. Moreover, it reported an increased use of domestic fuelwood and kerosene in the country. This indicated the poor living conditions in cities with improper sewage systems and a lack of clean drinking water. The use of dirty energy sources is linked to health effects and lack of clean energy sources nonetheless, it was reported that 92% of households had access to electricity. A strong neighborhood connection (community vitality) was also reported (Asian Development Bank, 2019). On the other hand, the 2022 BLSS focused on healthcare expenditure and impoverishment which showed an increasing trend. It was also reported that rural dwellers and poorer households struggled with transportation costs. The living standard of the well-off citizens of the country shows improvement however, the marginalized citizens are the ones suffering.
Education
The table below compares the literacy rate and unemployment rate as reported in BLSS 2012 and 2022.
Table 2.
Literacy & Unemployment Rate.
Table 2.
Literacy & Unemployment Rate.
| Year |
Literacy rate (< 6 years) |
Unemployment rate |
| 2012 |
63.0 |
2.7 |
| 2022 |
70.2 |
5.9 |
The literacy rate has increased by 7.2% however, the unemployment rate has also increased by 3.2%. Education leads to individuals with the knowledge and skills necessary to participate in the workforce. Moreover, it can create s strong and competitive economy and promote social mobility. The improved literacy rate indicates potential economic progress in the country. On the other hand, with the increased unemployment rate, economic progress could be negative. Lhaden (2023) reported that numerous youths are going abroad due to unemployment. This greatly hampers the country’s economy through decreased human capital and brain drain.
Poverty
For economic development to occur, there should be poverty reduction (Remenyi, 2004). Bhutan’s Poverty Analysis Report (PAR) 2012 reported an estimated 12% of the population to be poor at poverty line Nu. 1,704.84 per person per month. PAR 2022 reported an estimated 12.4% of the population to be poor at poverty line Nu 6,204 per person per month. There is no significant change in the poverty level of the country from 2012 till 2022. Taking poverty as the country’s economic indicator, it can be assumed that Bhutan’s economy is at a standstill with little to no improvement in poverty reduction.
Gross National Happiness (GNH)
With GNH at the heart of the country’s developmental philosophy, the focus is on the overall well-being of the people rather than solely on economic growth (Ukai,2016). GNH framework is more of a qualitative indicator of growth guided by the four pillars and nine domains. By prioritizing a holistic approach to economic development rather than traditional which only measures economic output, it brings together the cultural, spiritual, social, environmental, and economic aspects. GNH has been successful in terms of preserving the rich natural resources of the country and preventing rapid industrialization. Though the setback of this is the slow economic progress, it has not halted the economic progress. Sustainable economic growth has been prevalent with GDP and GNH acting as complements rather than substitutes (Lepeley, 2017).
Current Economic Situation
Until December 2019, Bhutan was a least developed country (LDC) as reported by the United Nations. Currently, Bhutan has achieved significant improvement in the economic sector with its GDP growth rate of 5.21% (NSB, 2022), general literacy rate of 70.2% (NSB, 2022), and labor force participation rate of 65% (NSB, 2023). All mentioned indicators have shown improvements over the years. Furthermore, discussions on living standards, poverty, and happiness gave insights into the country’s economic progress. It can be said that Bhutan is a middle-income country with neither slow nor rapid economic development. For a small landlocked country, Bhutan is doing exceptionally well in terms of sustainable economic development. However, the government has a greater role in reducing social disparities, inequalities, poverty, inequal resource allocation, and corruption which hinders economic progress. Bhutan can grow further in the economic sector with minimal utilization of natural resources. Future economic development agendas should focus more on the enhancement of secondary and tertiary sectors and building efficiency in primary sectors of the economy.
W.W Rostow’s Model
Rostow’s stage theory has five stages of economic development. Applying the model to Bhutan’s economy, it can be implied that Bhutan is currently at second stage, the transitional stage. Numerous entrepreneurs have started to come in recent years such as online shopping services. Additionally, the government has been developing roads, farm roads, transportation, hospitals, and hydropower plants among others. However, Bhutan’s current economy is not confined to the second stage. Bhutan’s economy shows some characteristics of the third stage, the take-off stage. In many parts of the country, agricultural productivity has increased due to high yielding seed varieties and improved technologies (Poudel, 2023). The government also encourages and invests in industries such as hydropower and tourism among others (ANI News, 2023). Inversely, the country still has subsistence-based economy in numerous rural communities which is the key characteristic of the model’s first stage.
Conclusion
On the whole, Bhutan has undergone significant economic development over the years, marked by steady GDP growth, improvements in living standards and education, and the unique emphasis on Gross National Happiness. While the country has transitioned from a least developed status to a middle-income economy, challenges remain, including addressing social disparities, reducing poverty, and enhancing resource allocation. In terms of Rostow’s stage model, Bhutan is at its second stage; the transitional stage but not confined to it. Moving forward, Bhutan's focus should be on fostering sustainable growth, particularly by strengthening secondary and tertiary sectors while maintaining the balance with environmental conservation and social well-being. With strategic planning and effective governance, Bhutan can continue on its path towards a prosperous and inclusive future.
References
-
Bhutan becomes seventh country to graduate out of Least Developed Country category | Office of the High Representative for the Least Developed Countries, Landlocked Developing Countries and Small Island Developing States. (n.d.). Available online: https://www.un.org/ohrlls/news/bhutan-becomes-seventh-country-graduate-out-least-developed-country-category#:~:text=Bhutan%20is%20the%20seventh%20country,difficult%2C%20if%20not%20impossible.%E2%80%9D.
-
Bhutan has developed industries closely linked to its natural, cultural resources: Report. (2023, June 9). ANI News. Available online: https://www.aninews.in/news/world/asia/bhutan-has-developed-industries-closely-linked-to-its-natural-cultural-resources-report20230609140001/.
-
Bhutan Living Standards Survey 2012. (2019, August 27). Asian Development Bank. Available online: https://www.adb.org/publications/bhutan-living-standards-survey-2012.
- Brooks, J. S. (2013). Avoiding the limits to growth: Gross National Happiness in Bhutan as a model for sustainable development. Sustainability, 5(9), 3640-3664. [CrossRef]
-
Gross domestic product: an economy’s all. (2019, June 15). IMF. Available online: https://www.imf.org/en/Publications/fandd/issues/Series/Back-to-Basics/gross-domestic-product-GDP.
-
HISTORY OF GNH – GNH Centre Bhutan. (n.d.). Available online: https://www.gnhcentrebhutan.org/history-of-gnh/.
- Lepeley, M. T. (2017). Bhutan’s gross national happiness: An approach to human centred sustainable development. South Asian Journal of Human Resources Management, 4(2), 174-184.
- National statistics Bureau. (2012). Bhutan Living Standards Survey 2012Report.
- National statistics Bureau. (2012). Bhutan Poverty Analysis 2012.
- National statistics Bureau. (2022). National Accounts Statistics.
- National statistics Bureau. (2022). National Accounts Statistics.
- National statistics Bureau. (2022). Poverty Analysis Report.
- National statistics Bureau. (2022). Bhutan Living Standards Survey Report.
- Pem, S. (2024, February 20). Prime Minister reviews ministries’ proposals for 13th Five-Year Plan. BBSCL. Available online: https://www.bbs.bt/news/?p=199347.
- Poudel, Y. (2023). Ministry to launch four agri-food hubs for sustainability. Kuensel Online. Available online: https://kuenselonline.com/ministry-to-launch-four-agri-food-hubs-for-sustainability/.
- Remenyi, J. (2004). Poverty and development: The struggle to empower the poor. Key issues in development, 190-220.
- Tashi, T., & Maxwell, T. W. (2016). The Developer: A Monarch who Strived to Modernise his Kingdom. Research UNE. Available online: https://rune.une.edu.au/web/handle/1959.11/19094.
- Ukai, A. K. (2016). Gross national happiness-based economic growth. John F. Kennedy School of Government, Harvard University.
|
Disclaimer/Publisher’s Note: The statements, opinions and data contained in all publications are solely those of the individual author(s) and contributor(s) and not of MDPI and/or the editor(s). MDPI and/or the editor(s) disclaim responsibility for any injury to people or property resulting from any ideas, methods, instructions or products referred to in the content. |
© 2024 by the authors. Licensee MDPI, Basel, Switzerland. This article is an open access article distributed under the terms and conditions of the Creative Commons Attribution (CC BY) license (http://creativecommons.org/licenses/by/4.0/).