
Submitted:
21 December 2024
Posted:
23 December 2024
You are already at the latest version
Abstract
TSLP is an alarmin released upon activation of epithelia in response to various external stimuli and is involved in type 2 cytokine-mediated pathological disorders. The formation of a high-affinity heterodimeric receptor complex, comprising the thymic stromal lym-phopoietin receptor (TSLPR) chain and IL-7Rα, is required for signaling. This study investigated whether TSLP and TSLPR expression in peripheral blood or nasal polyps could provide a valuable approach for the molecular phenotyping of patients with chronic rhinosinusitis with nasal polyps (CRSwNP). The study population comprised 156 unre-lated Caucasian individuals, including 45 controls and 111 patients with CRSwNP. Quantitative PCR analysis of TSLP and TSLPR was performed on the population study’s peripheral blood and nasal biopsy. The data were analyzed for potential associations, and possible use as a biomarker was studied. Significant differences were observed in TSLP and TSLPR blood expression between the control group and patients. Similarly, the expression of TSLP observed in biopsy samples was statistically significantly elevated in the polyp tissue of the patient compared with healthy controls. The combination of TSLP and TSLPR expression testing with peripheral blood eosinophils represents a more specific biomarker in patients exhibiting low eosinophil values. Further investigation of TSLP/TSLPR mRNA levels in peripheral blood may yield new minimally invasive biomarkers.
Keywords:
TSLP
; TSLPR
; N-ERD
; CRSwNP
; biomarker
; gene expression
; nasal polyp
1. Introduction
Chronic rhinosinusitis with nasal polyps (CRSwNP) is a chronic sinonasal inflammatory disease with a complex pathogenesis that can significantly impair patients' quality of life [1]. CRSwNP can be associated with asthma or nonsteroidal anti-inflammatory drug (NSAID)-exacerbated respiratory disease (N-ERD) [2]. A common feature of these three entities is that a type 2 inflammatory pathway drives all [3,4]. The inflammatory mechanism of CRSwNP is initiated by the activation of epithelial cells by different triggers, which subsequently induce the production of other interleukins (ILs) [5]. These ILs, in turn, stimulate the production of cytokines with a role in T2 inflammation, such as thymic stromal lymphopoietin (TSLP) [6].
TSLP is an alarmin released upon activation of the epithelia in response to various external stimuli. Two isoforms have been identified in humans: long-form TSLP (lfTSLP) and short-form (sfTSLP) [7]. Despite the distinct differences between the two isoforms of TSLP in humans, the specific functions of sfTSLP remain unclear [8]. lfTSLP has been involved in immune responses, especially in inflammation and allergy, while sfTSLP may play a homeostatic role, acting as an inflammation suppressor [9]. TSLP is produced by different cell types, including airway epithelial cells, dendritic cells, T cells, NK-T cells, eosinophils, mast cells [10,11,12], monocytes, macrophages, and granulocytes [8]. TSLP expression is induced in response to pathogenic stimuli upon contact with airway epithelial cells, including aeroallergens such as fungi, dust mites, cockroaches, and pollen [13].
TSLP signaling requires the formation of a high-affinity heterodimeric receptor complex comprising the thymic stromal lymphopoietin receptor (TSLPR) chain and IL-7Rα [12]. TSLP can exert biological functions by acting on a wide range of immune cells that express TSLP receptors [13]. These include dendritic cells (DCs), basophils, CD4 + T cells, and group 2 innate lymphoid cells (ILC2s) [14,15,16,17,18,19,20,21,22], which drive T2 inflammatory responses, such as asthma [23] or CRSwNP [24]. In Western populations, TSLP can also significantly influence eosinophils, leading to eosinophilia in patients with CRSwNP [25]. That is because eosinophils express IL-7Rα [9].
Upon binding its receptor complex, TSLP activates Janus kinases (JAK), which in turn activate the phosphorylation and signal transducer and activator of transcription (STAT), thereby initiating pro-inflammatory signaling [26]. In patients with asthma and nasal polyps (NPs), TSLP activates fibroblasts and smooth muscle cells in conjunction with other cytokines, such as IL-1, IL-6, and TNF-alpha, to induce smooth muscle hypertrophy and increased remodeling of bronchial and nasal epithelium [26]. Studies have demonstrated that TSLP mRNA expression is elevated in nasal polyps [27] and epithelial cells of individuals with asthma compared to healthy tissue [28], indicating its potential involvement in the pathogenesis of CRSwNP [29] induced airway obstruction and disease severity [30].
TSLP, IL-25, and IL-33 are key players in type 2 inflammatory responses associated with allergic rhinitis (AR), chronic rhinosinusitis (CRS), and asthma [31,32]. There is growing evidence that several single-nucleotide polymorphisms (SNPs) in the genes encoding these cytokines are associated with the development of asthma. That includes SNPs located in the TSLP gene´s promoter region and SNPs in the IL-33 gene [33,34,35,36]. Furthermore, SNPs in TSLP and IL-33 have been shown to increase susceptibility to develop CRSwNP [37,38,39].
In addition, TSLP has been linked to other conditions, including atopic dermatitis and eosinophilic esophagitis (EoE) [40]. In this sense, a study demonstrated that specific SNPs and alleles of TSLP were associated with an increased risk of developing EoE [41]. However, TSLP in serum was not elevated in EoE patients compared to healthy controls [42]. Conversely, children and adults with atopic dermatitis exhibited significantly elevated serum TSLP levels compared to healthy individuals [43].
Moreover, epigenetic mechanisms, such as DNA methylation, can affect TSLP gene expression. They have been identified as a contributing factor in the development and worsening of atopic diseases, which include dermatitis, asthma, and allergic rhinoconjunctivitis [44]. A negative correlation between TSLP methylation levels and TSLP expression has been demonstrated in previous studies [36,45,46,47,48,49]. Additionally, a preliminary study showed that DNA methylation at the TSLP locus was associated with CRSwNP pathogenesis [50].
The first investigational anti-TSLP medicine, Tezepelumab, a human immunoglobulin G2λ monoclonal antibody that inhibits the interaction of TSLP with its heterodimeric receptor, has recently been approved [30]. Tezepelumab has been demonstrated to reduce exacerbation rates, improve lung function, and reduce multiple biomarkers of inflammation [43]. In the phase III NAVIGATOR trial, subjects with severe asthma and CRSwNP who received Tezepelumab significantly improved Sinonasal Outcome Test-22 (SNOT-22) scores over a 52-week treatment period [51].
Regarding TSLPR, two Phase 2 clinical trials have been initiated with the monoclonal antibody anti-TSLPR named Verekitug (UPB-101). One trial has been undertaken in severe asthma patients and another in patients with chronic rhinosinusitis with nasal polyps. Verekitug is a novel recombinant fully human immunoglobulin G1 monoclonal antibody that blocks TSLPR and inhibits TSLP-driven inflammation. The Phase 1b trial in asthma patients demonstrated that Verekitug significantly affected exhaled nitric oxide and blood eosinophils [52,53,54].
In summary, considerable evidence suggests that TSLP is implicated in the pathogenesis of allergic and asthmatic diseases [11,55]. This evidence further indicates that TSLP levels might serve as a potential biomarker for diagnosis, prognosis, and monitoring of treatment response [56]. Accordingly, this study aimed to investigate the involvement of TSLP and TSLPR expression in asthma, CRSwNP, and N-ERD. To this end, the expression of TSLP and TSLPR mRNA in the blood and tissue of patients was compared to that of healthy individuals.
2. Results
2.1. Characteristics of the Population Study
The study population comprised 156 individuals; 45 were included in the control group, 21 patients were diagnosed with asthma with CRSwNP, 49 were patients with N-ERD, and 41 were diagnosed as patients with CRSwNP without asthma. The characteristics of the study population are shown in Table 1.
No differences in age distribution between patients and healthy controls (HCs) were observed. However, the sex distribution showed significant differences between the two groups. As expected, atopy distribution was different between HCs and patients but not between the various subgroups of patients. Furthermore, IgE was significantly higher in the global patient group compared to HCs (p<0.001), as well as when compared to each patient subgroup (CRSwNP without asthma: p=0.003, N-ERD: p<0.001, and asthmatics with CRSwNP: p<0.001). On the other hand, peripheral blood eosinophils (PBE) were significantly higher in patients than in HCs (p<0.001), as well as in all patient subgroups (p<0.001), but we did not observe significant differences between patient subgroups. No significant differences were observed between patients regarding SNOT22 or FeNO levels (Table 1). Moreover, these results are not affected by atopy in any patient subgroup (data not shown).
2.2. TSLPR and TSLP Expression in Peripheral Blood Samples
Significant differences were observed in TSLPR blood expression between the control group and patients (p<0.001) as well as between controls and all patient subgroups (p<0.001 in all the comparisons). Similarly, TSLP blood expression also exhibited significant differences when comparing the control group with patients (p<0.001) and with all patient subgroups (CRSwNP without asthma: p<0.001, N-ERD: p=0.002, and asthmatics with CRSwNP: p=0.041) (Table 2; Figure 1).
2.3. Characteristics of the Population of the Biopsy Study
In order to ascertain the differences in expression between peripheral blood and nasal biopsy, a total of 33 patients from the previous population study were analyzed. The biopsy cohort comprised 11 individuals with CRSwNP and asthma, 11 with N-ERD, 11 with CRSwNP without asthma, and 11 healthy controls. The characteristics of this population are described in Table 3.
Regarding demographic and clinical characteristics of the subjects, no significant differences were observed in the distributions by sex and age between the control and patient subgroups. As expected, significant differences in atopy and IgE levels were found when comparing the HCs and the patient subgroups (p=0.002). In addition, peripheral blood eosinophils (PBE) were significantly higher in the global patient cohort compared to HCs (p<0.001) and in the subgroup of asthmatics with CRSwNP (p=0.001) and N-ERD (p=0.005) compared to HCs. Nevertheless, no differences were observed between the HCs and the CRSwNP subgroup without asthma (p=0.239). No differences were observed between the global patient group, patient subgroups, and the HCs for the remaining variables (Table 3). Furthermore, these results are not affected by atopy in any patient subgroups (data not shown).
2.4. TSLPR and TSLP Expression in Nasal Biopsy Samples
The expression of TSLPR was observed to be elevated in the polyps of all patient groups compared to the nasal tissue of the control subjects (7.01±17.99 vs. 2.06±1.44; p=0.144). However, this increase was not found to be statistically significant. Notably, the highest expression was observed in the polyp tissue of patients with CRSwNP and asthma (13.98±30.65; p=0.341). This lack of statistical significance may be attributed to the relatively small sample size.
The expression of TSLP observed in biopsy samples was found to be statistically significantly elevated in the polyp tissue of all patient subgroups in comparison with HCs (CRSwNP without asthma: 72.41±53.64, p=0.048; N-ERD: 121.23±145.03, p=0.009; and asthmatics with CRSwNP: 104.49±76.78, p=0.009). However, no statistically significant differences regarding TSLP were identified between the groups in peripheral blood samples (Table 4 and Figure 2). Furthermore, a correlation was observed between TSLPR and TSLP expression levels (r=0.692, p=0.018).
2.5. TSLP and TSLPR Levels as a Potential Biomarker
To assess the potential of TSLPR and TSLP mRNA expression as a biomarker for polyposis, we performed a Receiver Operating Characteristic (ROC) analysis between gene expression and peripheral blood eosinophil count (Table 5).
The area under the curve (AUC) analysis revealed that blood eosinophil count was the most accurate predictor for patients (AUC=0.841, 95% CI=0.778–0.903, p < 0.001). However, the predictive power of the model is further enhanced when a combined model is established between eosinophils and TSLPR expression levels (AUC=0.876, 95% CI=0.819–0.933, p < 0.001), PBE and TSLP (AUC=0.907, 95% CI=0.861–0.954), p < 0.001), or the three together (AUC=0.920, 95% CI=0.876–0.964, p < 0.001). Furthermore, when eosinophils are considered alone, some patients are incorrectly classified as controls (sensitivity: 80.53%; specificity: 56.76%). The combined eosinophil count with TSLPR or TSLP expression demonstrated an increase in sensitivity and specificity. The sensitivity was 89.62%, and the specificity was 73.53% for the PBE+TSLPR combination; 87.50% and 76.32% for the PBE+TSLP combination; and 89.91% and 78.05% for the PBE+TSLPR+TSLP combination. These findings suggest that TSLR and TSLP may provide additional information regarding eosinophil levels, potentially serving as a patient biomarker. However, no statistically significant differences in AUC were observed between the patient groups (CRSwNP+Asthma vs. N-ERD; CRSwNP vs. CRSwNP+Asthma; CRSwNP vs. N-ERD).
A comparable result was observed in the 33 patients who underwent polyp biopsy. According to the ROC curve, the best predictor of patients was blood eosinophil count (AUC=0.879, 95% CI=0.769–0.990, p < 0.001). Nevertheless, the establishment of a combined model between PBE and TSLPR (AUC=0.884, 95% CI=0.772–0.995, p < 0.001), PBE and TSLP (AUC=0.915, 95% CI=0.814–1.000, p < 0.001) or the three together (AUC=0.929, 95% CI=0.836–1.000, p < 0.001) would yield even more accurate results. Moreover, when eosinophils are considered alone, some patients are incorrectly classified as controls (sensitivity: 87.88%; specificity: 70.00%). The combined eosinophil count with TSLPR or TSLP expression demonstrated an increase in sensitivity and specificity (PBE+TSLPR: sensitivity: 88.24%; specificity: 77.78%; PBE+TSLP:sensitivity: 88.24%; specificity: 77,78% and PBE+TSLPR+TSLP:sensitivity: 90.91%; specificity: 80.00%). These findings suggest that TSLPR and TSLP may provide additional information regarding eosinophil levels, potentially as biomarkers in patient biopsy samples. Furthermore, no statistically significant differences in AUC were observed between the patient subgroups (CRSwNP+Asthma vs. N-ERD; CRSwNP vs. CRSwNP+Asthma; CRSwNP vs. N-ERD) (Table 6).
2.6. Diagnostic Value of TSLP and TSLPR in Peripheral Blood
As the ROC analyses showed that combining genes with PBE could better discriminate between patients and healthy subjects, we used logistic regression analysis to determine which combination might effectively predict a specific condition (Table 7). The diagnostic values of each combination were determined using cut-offs calculated from the ROCs (Table 8). Likelihood ratios (LRs) above 10 (LR+) or below 0.1 (LR−) are considered to provide strong evidence to rule in or rule out a diagnosis, respectively[57].
The data indicated that the sensitivity and specificity were superior when PBE was utilized alone or in conjunction with TSLPR and TSLP expression. Notably, the combination of TSLPR and TSLP expression exhibited superior sensitivity and specificity compared to PBE. The combination of TSLP expression with PBE may be considered a promising biomarker for disease exclusion (LR-= 0.10), as well as a combination of TSLP, TSLPR, and PBE (LR-= 0.05). On the other hand, all combinations of genes and PBE were more effective at confirming a diagnosis (LR+≥10). As a result, we can confirm that the optimal combination for differentiating between healthy controls and patients included all three parameters.
However, the establishment of a cut-off of ≥252.5 eosinophils in PBE (specificity of 90.70%) resulted in the erroneous classification of 27.03% (n = 30) of patients as false negatives. In this case, using PBE and TSLPR expression (cut-off= 0.575-fold difference; specificity of 80%) enabled to identify 18 patients (60%) from the total number of false negatives (specificity of 97.67%). As illustrated in Figure 3, the aforementioned cut-offs (≥252.5 eosinophils (Ln= 5.53) and ≥0.575-fold difference (Ln= -0.55) TSLPR expression) determine four quadrants (Q1, Q2, Q3, Q4). Ln was used to facilitate the visualization of the data.
The patients identified with the combination of PBE+TSLPR were situated in the Q2 quadrant and were distributed into the following groups: CRSwNP without asthma (12 patients), CRSwNP with asthma (4 patients), N-ERD (2 patients). This result suggests that the TSLPR expression test, in conjunction with PBE, represents a more specific biomarker in patients exhibiting low eosinophil values (<252.5 eosinophils), providing additional information beyond that provided by eosinophil levels (Table 9 and Figure 3).
A similar result was obtained with a cut-off of TSLP≥3.07-fold difference (specificity= 86.67%) in conjunction with the eosinophils cut-off (252.5 cells/μL). This approach identified 20 patients (66.67%) from the total of false negatives (specificity= 97.67%). As illustrated in Figure 4, the aforementioned cut-offs (≥252.5 eosinophils (Ln= 5.53) and ≥3.07- fold difference (Ln= 1.12) TSLP expression) delineated four quadrants (Q1, Q2, Q3, Q4). Again, Ln was used to facilitate the visualization of the data. The patients identified with the combination of PBE+TSLP were situated in the Q2 quadrant and were distributed into the following groups: CRSwNP without asthma (10 patients), CRSwNP with asthma (7 patients), and N-ERD (3 patients). These findings suggest that the TSLP expression test in conjunction with PBE is a more specific biomarker in patients with low eosinophil values (<252.5 eosinophils), providing additional information beyond that obtained from eosinophil levels (Table 10 and Figure 4).
3. Discussion
This study investigated whether TSLP and TSLPR mRNA expression differed between patients and controls in peripheral blood and biopsy samples. TSLP and TSLPR are involved in type 2 cytokine-mediated pathological disorders [43,58], including asthma, chronic rhinosinusitis, allergic rhinitis, eosinophilic esophagitis, and atopic dermatitis [27,59] playing a key role in their development and progression as well as host immunity [60]. Our results demonstrated that the expression of TSLP and TSLPR in peripheral blood samples was elevated in all patient subgroups compared to the control group and that this increase was not influenced by atopy. These data support the hypothesis that the elevated expression of the receptor and TSLP in the peripheral blood of patients could be associated with the inflammatory process that these patients are experiencing due to their disease [61].
TSLPR exhibits a high binding affinity for TSLP but not for IL-7Rα, which requires the formation of the binary complex (TSLPR-IL-7Rα) to initiate intracellular signalling [62,63]. TSLPR is expressed in immune cells such as mast cells, NKT cells, and eosinophils, making them responsive to TSLP [64]. Moreover, TSLPR is upregulated or constitutively expressed in many patients with rheumatoid arthritis and acute lymphoblastic leukaemia [65]. That has prompted research into TSLP, TSLPR, and its associated signalling pathways.
Many studies have focused on the expression of TSLP in several tissues, including the gut, skin, and lung [66]. The levels of TSLP in the lungs of asthmatic patients or keratinocytes within acute and chronic lesions of atopic dermatitis were linked to disease severity [67,68]. The present study revealed a significant difference in TSLP expression levels between nasal polyps and the control nasal mucosa across all patient subgroups, whereas no such difference was observed in TSLPR expression. These findings indicate that TSLP and TSLPR expressions may be regulated differently in nasal polyps, suggesting that polyps may play a pivotal role as TSLP sources, enhancing the signaling through airway cells. Indeed, Kaur et al. showed that TSLP expression was elevated in airway smooth muscle (ASM) in patients with mild-to-moderate disease and that it activates mast cells, which increase chemokine and cytokine production [69]. Redhu et al. suggested that TSLP/TSLPR-mediated autocrine activation of ASM may be a contributing factor [70]. Nagarkar et al. provided evidence indicating that, in addition to the observed increase in mRNA TSLP levels, there was a significant elevation of TSLPR in polyp tissue from patients with CRSwNP compared to control subjects [27].
Furthermore, Buchheit et al. demonstrated that TSLP mRNA was also similarly detected in N-ERD and CRSwNP patients in nasal polyps [71]. Another study indicated that TSLPR expression was similarly elevated in CRSwNP and CRSwtNP (CRS without NP) [72], whereas TSLP mRNA expression was notably higher in individuals with N-ERD than CRSwtNP [73]. Moreover, it has been demonstrated that the increased expression of TSLP in nasal epithelial cells of patients with allergic rhinitis can be associated with developing nasal polyps [74].
Additionally, a comprehensive transcriptome RNA sequencing of 42 polyps (CRSwNP-NP), 33 paired nonpolyp inferior turbinate tissue samples from patients with polyposis (CRSwNP-IT), and 28 inferior turbinate tissue samples from controls (CS-IT) revealed the presence of gene signatures associated with impaired host defences, inflammation, and aberrant extracellular matrix metabolism in CRSwNP [75]. The results demonstrated that TSLP was differentially expressed in the comparison between CRSwNP-NP vs. CS-IT but not in CRSwNP-NP vs. CRSwNP-IT [75], which supports the findings of our study. PBE counts have been suggested to be a biomarker for monitoring polyp growth in CRSwNP patients with eosinophilia, asthma, and/or N-ERD [76]. In our study, the analysis of TSLP/TSLPR in combination with PBE could help to diagnose or exclude nasal polyposis. By examining both gene expression and PBE, we may be able to more accurate patient classification and improved treatment strategies. Stratifying patients according to biomarkers and disease subtypes allows for a more personalized and effective treatment, improving outcomes and reducing side effects [77,78,79].
Recently, several humanized monoclonal antibodies have been developed for targeted therapies, including anti-TSLP (tezepelumab) and anti-TSLPR (verekitug) as part of the immune system response pathways associated with chronic inflammation such as CRSwNP [1,23, 51-54]. Treatment with the tezepelumab significantly improved both asthma outcomes and sino-nasal symptoms in patients with severe asthma and comorbid CRSwNP [51]. Although less advanced in clinical development than tezepelumab, verekitug is a promising treatment for nasal polyps, particularly in patients who do not respond well to conventional therapies [51-54]. In this sense, biomarker studies such as the present work could provide valuable insights into the application of personalized precision medicine through better patient classification to predict their response to these new treatments.
As a limitation of this study, the limited biopsy sample size may have reduced the capacity of the sub-analyses to detect significant differences between controls and patients. Consequently, these findings need to be confirmed in larger cohorts.
4. Materials and Methods
4.1. Study Population
All patients were recruited from the Allergy Department of the University Hospital of Salamanca. The study was approved by the Clinical Research Ethics Committee of the Institute for Biomedical Research of Salamanca (IBSAL) (PI 2020-02-433). The study was conducted following the recommendations of the Ethics Committee of the University Hospital of Salamanca. All participants signed a written informed consent form. Controls fulfilled the following criteria: (i) Absence of symptoms or history of asthma, nasal polyposis, N-ERD, or other pulmonary diseases, (ii) Absence of symptoms or history of rhinitis, (iii) Absence of symptoms or history of allergic diseases, (iv) Negative results on skin prick tests to a battery of common aeroallergens; (v) Absence of a family history of asthma, rhinitis, or atopy, and (vi) Age > 16 years old.
In addition, the patients were selected according to the following criteria: (i) A physiciandiagnosis of respiratory allergy (asthma, rhinitis, nasal polyposis or N-ERD), and (ii) an age of greater than 16 years. Skin prick tests were conducted using a battery of common aeroallergens [80] by the recommendations of the European Academy of Allergy and Clinical Immunology (EAACI) [81]. Histamine 10 mg/ml was employed as the positive control, while saline 0.9% was the negative control. A positive result was a wheal of at least 3 mm diameter larger than the negative control. Patients were considered atopic if they exhibited a positive skin reaction to at least one allergen. The severity of asthma was evaluated according to the Spanish Guide for the Management of Asthma (GEMA 5.4) [82], while allergic rhinitis was classified with the Allergic Rhinitis and its Impact of Asthma (ARIA) guidelines modified by Valero et al. [83]. None of the subjects were receiving oral corticosteroids.
Fractional exhaled nitric oxide (FeNO), total IgE, and lung function parameters were evaluated for all the patients. CRSwNP improvement was assessed utilizing the Sino-nasal Outcome Test (SNOT-22) [84].
In this study nasal polyps and nasal mucosa tissue were biopsied from patients and healthy controls, respectively. Following the biopsy, tissues were immediately immersed in RNAlater and stored at -80°C for later use.
4.2. Clinical Measurements
Peripheral blood eosinophils, basophils, leucocytes, monocytes, lymphocytes, and platelets were counted automatically using a counter (Beckman Coulter) and the MAXM A/L system (Beckman Coulter). Serum levels of total IgE were quantified by a fluoroenzyme immunoassay (ImmunoCap System, ThermoFisher Scientific, Waltham, MA, USA). The fractional exhaled nitric oxide (FeNO) was determined using NIOX VERO (Circassia, Uppsala, Sweden). In nasal polyps, hematoxylin/eosin staining was performed for eosinophil count with high field magnification (40x).
4.3. RNA Isolation and RT-PCR
Total RNA was isolated from peripheral blood samples stored with RNA Later at -20°C, using the RiboPure-Blood kit (Ambion, Thermo Fisher Scientific, Waltham, MA, USA) according to the manufacturer's instructions. DNAse treatment was conducted using Turbo DNAse (Ambion, Thermo Fisher Scientific, Waltham, MA, USA). The concentrations and RNA quality ratios were determined using a NanoDrop 1000 (Thermo Fisher Scientific, Waltham, MA, USA). Reverse transcription (RT) was performed on 500 ng of total RNA using the Superscript III First-Strand Synthesis System for RT-PCR (Invitrogen, Thermo Fisher Scientific, Waltham, MA, USA). The thermal cycler (MultiGene Opti-Max, Labnet International Inc., Edison, NJ, USA) was employed with a total volume of 20 µL, comprising a single cycle and incubation periods of 65°C for 5 min, 25°C for 10 min, 50°C for 50 min, 85°C for 5 min, and 37°C for 20 min. All the samples were subjected to the same reverse transcription reaction conditions.
Furthermore, RNA extraction was conducted on polypoid tissue and healthy nasal mucosa in addition to the blood RNA isolation. A homogenizer (Fisherbrand™) was employed to disaggregate tissues from selected patients. The subsequent purification of the isolated RNA was performed using the RiboPure™ RNA Purification Kit (Ambion, Thermo Fisher Scientific, Waltham, MA, USA). The DNAse treatment was performed using Turbo DNAse (Ambion, Thermo Fisher Scientific, Waltham, MA, USA). The concentrations and RNA quality ratios were determined using a NanoDrop 1000 (Thermo Fisher Scientific, Waltham, MA, USA). RT was performed using the Superscript III First-Strand Synthesis System for RT-PCR (Invitrogen, Thermo Fisher Scientific, Waltham, MA, USA) with 1000 ng or 2000 ng of total RNA, as determined by the amount of starting genetic material. The thermal cycler (MultiGene Opti-Max, Labnet International Inc., Edison, NJ, USA) was employed for this process. The reaction mixture was prepared in a total volume of 20 µL, comprising a single cycle and incubation periods of 65°C for 5 min, 25°C for 10 min, 50°C for 50 min, 85°C for 5 min, and 37°C for 20 min. All the samples were subjected to the same reverse transcription reaction conditions.
4.4. Quantitative PCR Expression Analysis
Relative quantitative PCR (qPCR) was performed using the LightCycler480® Instrument and SYBR Green I Master (Roche, Basel, Switzerland). The fold induction was calculated using the formula 2-(ΔΔCt) by the comparative Ct method [85]. Primers for the TSLP receptor (TSLPR), and TSLP were designed using the software Primer 3.0 [86] and subsequently refined using the Beacon Designer software [87]. The GAPDH reference gene primers were selected from the Real-Time Ready Human Reference Gene Panel (Roche Applied Science, Indianapolis, IN, USA). The primer sequences used are presented in Table 11.
The efficacy of the primers was evaluated by amplifying serial dilutions of a cDNA sample with a known concentration in accordance with the following equation: E = (10−1/slope − 1) × 100. All reactions were performed in triplicate. The triplicates were considered valid if the standard deviation was less than 0.35. In each experiment, non-template controls and a calibrator were included. The PCR conditions included 10 min at 95°C followed by 45 cycles of 10 s at 95°C for denaturation, 10 s at 60°C for annealing, and 10 s at 72°C for polymerization. All procedures were conducted per the guidelines set forth by the Minimum Information for Publication of Quantitative Real-Time PCR Experiments (MIQE) [88].
4.5. Statistical Analysis
Data analysis and graphs were performed using the SPSS Software, version 28 (IBM, Armonk, NY, USA). Kolmogorov–Smirnov Z test was employed to ascertain the normality of the distribution. The analysis of variance (ANOVA) with Dunnett's multiple comparisons test (DMS) was employed to compare continuous parametric data, whereas the Kruskal–Wallis test was used for non-parametric data. In cases involving multiple comparisons, Bonferroni corrections were utilized to adjust the original p-values, considering the original p-value as p<0.05 to calculate the new p-values. Proportions were compared using the Chi-squared test. Pearson correlations were conducted to examine the relationships between variables.
Logistic regression models were applied to evaluate the predictive value of the biomarkers. The ability of these biomarkers to differentiate between patient groups was evaluated through the parameters of sensitivity, specificity, and area under the ROC curve (AUC). In the analyses using AUC and prediction, the groups were predicted using the ordered value of the variable and looking for an optimal cut-off point and, in the end, determining thresholds for each variable; these thresholds were confirmed as logical from the clinical point of view. In the case of multiparametric variables, the values of each variable were aggregated by regression, and the method previously described was applied.
To increase the robustness of the analyses, certain factors, such as age, sex, and atopy, were considered that could affect the results. These subgroups prompted further analyses to confirm the effect of these variables in the overall studies. The threshold for statistical significance was set at p<0.05 for all analyses unless otherwise specified. Graphical representations of the data included box plots, scatter plots, and ROC curves to facilitate visual interpretation and comparison between groups.
While in some instances, the differences between the means and standard deviation of the groups can be large, analyses based on the difference between the distributions give a more reliable measure since the data may contain outliers. For this purpose, different statistical tests that are more dependent or more independent of the mean have been included.
5. Conclusions
In conclusion, our results indicate that TSLP and TSLPR play a role in inflammatory diseases such as CRSwNP and N-ERD. TSLP levels were significantly elevated in the peripheral blood and biopsies of patients compared to controls. However, our study showed a significant increase in TSLPR levels only in the peripheral blood of patients, possibly due to the small number of biopsy samples and the heterogeneity of the patients. Considering these findings, we propose that peripheral blood mRNA levels of TSLP/TSLPR should be investigated as potential new minimally invasive biomarkers that could assist in molecular phenotyping and selecting patients for treatment with specific antagonists.
Author Contributions
Conceptualization, A.G-S., C.S, I.D., M.I.-G. and M.G.-M.; methodology, E.M.-J., N.M.-Ll., M.G.-G., C.S., A.G-S., I.D., M.G-M., and M.I.-G.; software, E.M.-J., NM.-Ll., A.G.-S., and C.S.; validation, E.M.-J., NM.-Ll., A.G.-S., and C.S; resources, C.S., I.D., M.I.-G, and M.G.-M.; data curation, E.M.-J., NM.-Ll., M.G.-G., A.G-S., I.D., and C.S.; writing—original draft preparation, E.M.-J., N.M.-Ll., M.G.-G., AG.-S., and C.S.; writing—review and editing, E.M-J., N.M-Ll., C.S., I.D., M.I.-G, M.G.-M. and A.G.-S.; supervision, A.G-S., I.D., M.I.-G., and C.S.; funding acquisition, C.S., I.D., and M.I.-G. All authors have read and agreed to the published version of the manuscript.
Funding
This study has been funded by the projects PI20/00268, funded by Instituto de Salud Carlos III (ISCIII) and co-funded by the European Union; RD21/0002/0054 and PMP22/00124, funded by Instituto de Salud Carlos III (ISCIII) and European Union -NextGeneration EU, Mecanismo para la Recuperación y la Resiliencia (MRR); IMP/00009, funded by Instituto de Salud Carlos III (ISCIII) and European Regional Development Fund "A way to make Europe;" by the Grant PID2021-125117OB-I00 funded by MCIN/AEI/10.13039/501100011033 and by "ERDF A way of making Europe;" and by the Grant IES161P20, funded by Junta de Castilla y León and by "ERDF A way to make Europe." M. Gómez-García is a recipient of a Sara Borrell postdoctoral fellowship from the ISCIII (CD23/ 00185), co-funded by the European Social Fund. E. Moreno-Jiménez is a recipient of a predoctoral grant PFIS, funded by ISCIII through the project “FI-21/00048” and co-funded by the EU. N. Morgado receives a predoctoral fellowship from the “Junta de Castilla y León” co-financing by the Ministry of Education, the European Social Fund Plus (FSE+) and the University of Salamanca.
Institutional Review Board Statement
The study was conducted in accordance with the Declaration of Helsinki and approved by the Clinical Research Ethics Committee of the Institute for Biomedical Research of Salamanca (IBSAL) (PI 2020-02-433).
Informed Consent Statement
All participants signed a written informed consent form.
Data Availability Statement
The datasets presented in this article are not readily available because the data are part of an ongoing study.
Acknowledgments
The authors would like to express their gratitude to the staff of the Allergy Department at Salamanca University Hospital.
Conflicts of Interest
Asunción García-Sánchez has received payment for lectures from Leti. Ignacio Dávila has received payment for lectures, including service on speaker's bureaus from Allergy Therapeutics, Astra-Zeneca, Chiesi, Diater, GSK, Leti, Novartis, Sanofi; for a consultancy from Allergy Therapeutics, ALK-Abello, Astra-Zeneca, GSK, Merck, MSD, Novartis, Sanofi; and grants for Thermofisher Diagnostics. María Gil-Melcón has received payment for lectures from Astra-Zeneca, GSK, and Sanofi. The rest of the authors declare no conflict of interest. The funders had no role in the study's design, in the collection, analyses, or interpretation of data, in the writing of the manuscript, or in the decision to publish the results.
References
- Shen S, Xian M, Yan B, Lan F, Wang C, Zhang L. Anti-thymic stromal lymphopoietin monoclonal antibody in patients with chronic rhinosinusitis with nasal polyps (DUBHE): Rationale and design of a multicenter, randomized, double-blind, placebo-controlled study. Asia Pac Allergy. 2024;14(1):26–31. [CrossRef]
- W.J. Fokkens, V.J. Lund, C. Hopkins, P.W. Hellings, R. Kern SR. International Rhinology Journal European Position Paper on Rhinosinusitis and Nasal Polyps. Epos 2020. 2020;1(2):7–8.
- Ledda AG, Costanzo G, Sambugaro G, Caruso C, Bullita M, Di Martino ML, et al. Eosinophil Cationic Protein Variation in Patients with Asthma and CRSwNP Treated with Dupilumab. Life. 2023;13(9):1–11. [CrossRef]
- Woo SD, Luu QQ, Park HS. NSAID-Exacerbated Respiratory Disease (NERD): From Pathogenesis to Improved Care. Front Pharmacol. 2020;11(July):1–11. [CrossRef]
- Brescia G, Zanotti C, Parrino D, Barion U, Marioni G. Nasal polyposis pathophysiology: Endotype and phenotype open issues. American Journal of Otolaryngology - Head and Neck Medicine and Surgery. 2018;39(4):441–4.
- Mamuladze T, Kipnis J. Type 2 immunity in the brain and brain borders. Cell Mol Immunol. 2023;20(11):1290–9. [CrossRef]
- Fornasa G, Tsilingiri K, Caprioli F, Botti F, Mapelli M, Meller S, et al. Dichotomy of short and long thymic stromal lymphopoietin isoforms in inflammatory disorders of the bowel and skin. Journal of Allergy and Clinical Immunology. 2015;136(2):413–22. [CrossRef]
- Canè L, Poto R, Palestra F, Iacobucci I, Pirozzi M, Parashuraman S, et al. Thymic Stromal Lymphopoietin (TSLP) Is Cleaved by Human Mast Cell Tryptase and Chymase. Int J Mol Sci. 2024;25(7). [CrossRef]
- Smolinska S, Antolín-Amérigo D, Popescu FD, Jutel M. Thymic Stromal Lymphopoietin (TSLP), Its Isoforms and the Interplay with the Epithelium in Allergy and Asthma. Int J Mol Sci. 2023;24(16). [CrossRef]
- Kashyap M, Rochman Y, Spolski R, Samsel L, Leonard WJ. Thymic Stromal Lymphopoietin Is Produced by Dendritic Cells. The Journal of Immunology. 2011;187(3):1207–11. [CrossRef]
- Bjerkan L, Schreurs O, Engen SA, Jahnsen FL, Baekkevold ES, Blix IJ, et al. The short form of TSLP is constitutively translated in human keratinocytes and has characteristics of an antimicrobial peptide. Mucosal Immunol. 2015;8(1):49–56. [CrossRef]
- Soumelis V, Reche PA, Kanzler H, Yuan W, Edward G, Homey B, et al. Human epithelial cells trigger dendritic cell-mediated allergic inflammation by producing TSLP. Nat Immunol. 2002;3(7):673–80. [CrossRef]
- Brister DL, Omer H, Whetstone CE, Ranjbar M, Gauvreau GM. Multifactorial Causes and Consequences of TLSP Production, Function, and Release in the Asthmatic Airway. Biomolecules. 2024;14(4). [CrossRef]
- Omori M, Ziegler S. Induction of IL-4 Expression in CD4+ T Cells by Thymic Stromal Lymphopoietin. The Journal of Immunology. 2007;178(3):1396–404. [CrossRef]
- Kabata H, Flamar AL, Mahlakõiv T, Moriyama S, Rodewald HR, Ziegler SF, et al. Targeted deletion of the TSLP receptor reveals cellular mechanisms that promote type 2 airway inflammation. Mucosal Immunol. 2020;13(4):626–36. [CrossRef]
- Ito T, Wang YH, Duramad O, Hori T, Delespesse GJ, Watanabe N, et al. TSLP-activated dendritic cells induce an inflammatory T helper type 2 cell response through OX40 ligand. Journal of Experimental Medicine. 2005;202(9):1213–23. [CrossRef]
- Al-Shami A, Spolski R, Kelly J, Fry T, Schwartzberg PL, Pandey A, et al. A role for thymic stromal lymphopoietin in CD4+ T cell development. Journal of Experimental Medicine. 2004;200(2):159–68. [CrossRef]
- Kitajima M, Lee HC, Nakayama T ZSF. TSLP enhances the function of helper type 2 cells. Eur J Immunol. 2011;41(7):1862–71. [CrossRef]
- Noti M, Wojno EDT, Kim BS, Siracusa MC, Giacomin PR, Nair MG, et al. Thymic stromal lymphopoietin-elicited basophil responses promote eosinophilic esophagitis. Nat Med. 2013;19(8):1005–13. [CrossRef]
- Hussain M, Borcard L, Walsh KP, Pena Rodriguez M, Mueller C, Kim BS, et al. Basophil-derived IL-4 promotes epicutaneous antigen sensitization concomitant with the development of food allergy. Journal of Allergy and Clinical Immunology. 2018;141(1):223-234.e5. [CrossRef]
- Noti M, Kim BS, Siracusa MC, Rak GD, Kubo M, Moghaddam AE, et al. Exposure to food allergens through inflamed skin promotes intestinal food allergy via TSLP-basophil axis. Journal of Allergy and Clinical Immunology. 2014;133(5):1390–9.
- Kim BS, Wang K, Siracusa MC, Saenz SA, Brestoff JR, Monticelli LA, Noti M, Tait Wojno ED, Fung TC, Kubo M AD. Basophils promote innate lymphoid cell responses in inflamed skin. The Journal of Immunology. 2014;139(7):3717–25.
- Duchesne M, Okoye I, Lacy P. Epithelial cell alarmin cytokines: Frontline mediators of the asthma inflammatory response. Front Immunol. 2022;13(October):1–18. [CrossRef]
- Yamashita Y, Terada K, Kodama Y, Nakadegawa R, Masumitsu H, Motobayashi Y, et al. Tezepelumab improved chronic rhinosinusitis with nasal polyps in a Patient with aspirin exacerbated respiratory disease. Respir Med Case Rep. 2024;50(February):102041. [CrossRef]
- Hogan SP, Rosenberg HF, Moqbel R, Phipps S, Foster PS, Lacy P, et al. Eosinophils: Biological properties and role in health and disease. Vol. 38, Clinical and Experimental Allergy. 2008. 709–750 p. [CrossRef]
- Dobrican-Băruța CT, Deleanu DM, Muntean IA, Nedelea I, Bălan RG, Filip GA, et al. The Alarmin Triad—IL-25, IL-33, and TSLP—Serum Levels and Their Clinical Implications in Chronic Spontaneous Urticaria. Int J Mol Sci. 2024;25(4).
- Nagarkar DR, Poposki JA, Tan BK, Comeau MR, Peters AT, Hulse KE, Suh LA, Norton J, Harris KE, Grammer LC, Chandra RK, Conley DB, Kern RC, Schleimer RP, Kato A and AK. Thymic stromal lymphopoietin activity is increased in nasal polyps of patients with chronic rhinosinusitis. Journal of Allergy and Clinical Immunology. 2013;132(3):593-600.e12. [CrossRef]
- Ying S, O’Connor B, Ratoff J, Meng Q, Mallett K, Cousins D, et al. Thymic Stromal Lymphopoietin Expression Is Increased in Asthmatic Airways and Correlates with Expression of Th2-Attracting Chemokines and Disease Severity. The Journal of Immunology. 2005;174(12):8183–90. [CrossRef]
- Dogan M, Sahin M, Yenisey C. Increased TSLP, IL-33, IL-25, IL-19, IL 21 and amphiregulin (AREG) levels in chronic rhinosinusitis with nasal polyp. European Archives of Oto-Rhino-Laryngology. 2019;276(6):1685–91.
- Shikotra A, Choy DF, Ohri CM, Doran E, Butler C, Hargadon B, et al. Increased expression of immunoreactive thymic stromal lymphopoietin in patients with severe asthma. Journal of Allergy and Clinical Immunology. 2012;129(1):104-111.e9. [CrossRef]
- Li Y, Wang W, Lv Z, Li Y, Chen Y, Huang K, et al. Elevated Expression of IL-33 and TSLP in the Airways of Human Asthmatics In Vivo: A Potential Biomarker of Severe Refractory Disease. The Journal of Immunology. 2018;200(7):2253–62. [CrossRef]
- Hong H, Liao S, Chen F, Yang Q, Wang DY. Role of IL-25, IL-33, and TSLP in triggering united airway diseases toward type 2 inflammation. Allergy: European Journal of Allergy and Clinical Immunology. 2020;75(11):2794–804. [CrossRef]
- Ketelaar ME, Portelli MA, Dijk FN, Shrine N, Faiz A, Vermeulen CJ, et al. Phenotypic and functional translation of IL33 genetics in asthma. Journal of Allergy and Clinical Immunology. 2021;147(1):144–57. [CrossRef]
- Aneas I, Decker DC, Howard CL, Sobreira DR, Sakabe NJ, Blaine KM, et al. Asthma-associated genetic variants induce IL33 differential expression through an enhancer-blocking regulatory region. Nat Commun. 2021;12(1):1–12. [CrossRef]
- Harada M, Hirota T, Jodo AI, Hitomi Y, Sakashita M, Tsunoda T, et al. Thymic stromal lymphopoietin gene promoter polymorphisms are associated with susceptibility to bronchial asthma. Am J Respir Cell Mol Biol. 2011;44(6):787–93. [CrossRef]
- Cianferoni A, Spergel J. The importance of TSLP in allergic disease and its role as a potential therapeutic target. Expert Rev Clin Immunol. 2014;10(11):1463–74. [CrossRef]
- Buysschaert ID, Grulois V, Eloy P, Jorissen M, Rombaux P, Bertrand B, et al. Genetic evidence for a role of IL33 in nasal polyposis. Allergy: European Journal of Allergy and Clinical Immunology. 2010;65(5):616–22.
- Nakayama T, Hirota T, Asaka D, Sakashita M, Ninomiya T, Morikawa T, et al. A genetic variant near TSLP is associated with chronic rhinosinusitis with nasal polyps and aspirin-exacerbated respiratory disease in Japanese populations. Allergology International. 2020;69(1):138–40. [CrossRef]
- Henmyr V, Vandeplas G, Halldén C, Säll T, Olze H, Bachert C, et al. Replication study of genetic variants associated with chronic rhinosinusitis and nasal polyposis. Journal of Allergy and Clinical Immunology. 2014;133(1):273–5. [CrossRef]
- Ko HK, Cheng SL, Lin CH, Lin SH, Hsiao YH, Su KC, et al. Blood tryptase and thymic stromal lymphopoietin levels predict the risk of exacerbation in severe asthma. Sci Rep. 2021;11(1):1–10. [CrossRef]
- Ruffner MA, Cianferoni A. Phenotypes and endotypes in eosinophilic esophagitis. Annals of Allergy, Asthma and Immunology. 2020;124(3):233–9. [CrossRef]
- Higgins LL, Beitia R, Speck O. Utility of a Noninvasive Serum Biomarker Panel for Diagnosis and monitoring of eosinophilic esophagitis : A prospective study. 2016;2015(6):821–7. [CrossRef]
- Nakajima S, Kabata H, Kabashima K, Asano K. Anti-TSLP antibodies: Targeting a master regulator of type 2 immune responses. Allergology International. 2020;69(2):197–203. [CrossRef]
- Wang WR, Chen NT, Hsu NY, Kuo IY, Chang HW, Wang JY, et al. Associations among phthalate exposure, DNA methylation of TSLP, and childhood allergy. Clin Epigenetics. 2021;13(1):1–12. [CrossRef]
- Junge KM, Bauer T, Geissler S, Hirche F, Thürmann L, Bauer M, et al. Increased Vitamin D levels at birth and in early infancy increase offspring allergy risk - Evidence for involvement of epigenetic mechanisms. Journal of Allergy and Clinical Immunology. 2016;137(2):610–3. [CrossRef]
- Wang IJ, Chen SL, Lu TP, Chuang EY, Chen PC. Prenatal smoke exposure, DNA methylation, and childhood atopic dermatitis. Clinical and Experimental Allergy. 2013;43(5):535–43.
- Van Bodegom D, Zhong J, Kopp N, Dutta C, Kim MS, Bird L, et al. Differences in signaling through the B-cell leukemia oncoprotein CRLF2 in response to TSLP and through mutant JAK2. Blood. 2012;120(14):2853–63.
- Luo Y, Zhou B, Zhao M, Tang J, Lu Q. Promoter demethylation contributes to TSLP overexpression in skin lesions of patients with atopic dermatitis. Clin Exp Dermatol. 2014;39(1):48–53. [CrossRef]
- Henry EK, Inclan-rico JM, Siracusa MC, State R the. Parasites and Allergic Inflammation. 2018;3(6):346–59. [CrossRef]
- Li J, Jiao J, Gao Y, Zhang Y, Zhang L. Association between methylation in nasal epithelial TSLP gene and chronic rhinosinusitis with nasal polyps. Allergy, Asthma and Clinical Immunology. 2019;15(1):1–8. [CrossRef]
- Jacobs J, Hoyte F, Spahn J, Ambrose C, Martin N, Vong S, et al. Tezepelumab Efficacy By SNOT-22 Score In Patients With Severe, Uncontrolled Asthma And Comorbid Nasal Polyps In NAVIGATOR. Journal of Allergy and Clinical Immunology. 2023;151(2):AB17. [CrossRef]
- Singh D, Deykin A, Lloyd P, Nestorov I, Kalra A, Biswas S, et al. A Multiple Ascending-dose Study With Verekitug, A Novel Antibody to the Human Thymic Stromal Lymphopoietin Receptor, in Adults With Asthma. Am J Respir Crit Care Med. 2024;A6996–A6996.
- Bio. U. Upstream Bio initiates a phase 2 clinical trial of Verekitug (UPB-101) in severe asthma and doses first patients [Internet]. 2024. Available from: https://www.biospace.com/upstream-bio-initiates-a-phase-2-clinical-trial-of-verekitug-upb-101-in-severe-asthma-and-doses-first-patient.
- PatSnap. June 3,. 2024. Phase 2 Trial Begins for Verekitug in CRSwNP Patients. Available from: https://synapse.patsnap.com/article/phase-2-trial-begins-for-verekitug-in-crswnp-patients.
- Ziegler SF, Roan F, Bell BD, Stoklasek TA, Kitajima M, Han H. The Biology of Thymic Stromal Lymphopoietin (TSLP). Adv Pharmacol. 2013;66:129–55. [CrossRef]
- Vrsalović R, Korošec P, Štefanović IM, Bidovec-Stojkovič U, Čičak B, Harjaček M, et al. Value of thymic stromal lymphopoietin as a biomarker in children with asthma. Respir Med. 2022;193(October 2021):1–7. [CrossRef]
- Hayden SR, Brown MD. Likelihood ratio: A powerful tool for incorporating the results of a diagnostic test into clinical decisionmaking. Ann Emerg Med. 1999;33(5):575–80.
- Zhong J, Sharma J, Raju R, Palapetta SM, Prasad TSK, Huang TC, et al. TSLP signaling pathway map: A platform for analysis of TSLP-mediated signaling. Database. 2014;2014:1–8. [CrossRef]
- Elmasry MF, Nagui NAR, Rashed LA, El Darbi R. Cutaneous expression of thymic stromal lymphopoietin (TSLP) in vitiligo patients: a case-control study. Int J Dermatol. 2019;58(5):589–92. [CrossRef]
- Poposki JA, Klingler AI, Stevens WW, Peters AT, Hulse KE, Grammer LC, Schleimer RP, Welch KC, Smith SS, Sidle DM, Conley DB, Tan BK, Kern RC KA. Proprotein convertases generate a highly functional heterodimeric form of thymic stromal lymphopoietin in humans Julie. Journal of Allergy and Clinical Immunology. 2017;139 (5)(1):1559-1567.e8.
- De Corso E, Hellings PW, Fokkens WJ, Klimek L, Peters AT, Scadding GK, et al. Thymic Stromal Lymphopoietin (TSLP): Evidence in Respiratory Epithelial-driven Diseases Including Chronic Rhinosinusitis with Nasal Polyps. Curr Allergy Asthma Rep. 2025;25(1). [CrossRef]
- Verstraete K, Van Schie L, Vyncke L, Bloch Y, Tavernier J, Pauwels E, et al. Structural basis of the proinflammatory signaling complex mediated by TSLP. Nat Struct Mol Biol. 2014;21(4):375–82. [CrossRef]
- Verstraete K, Peelman F, Braun H, Lopez J, Van Rompaey D, Dansercoer A, et al. Structure and antagonism of the receptor complex mediated by human TSLP in allergy and asthma. Nat Commun. 2017;8. [CrossRef]
- Ziegler EL and SF. Thymic Stromal Lymphopoietin (TSLP) and Cancer. The Journal of Immunology. 2014;193(9):4283–8.
- Marković I, Savvides SN. Modulation of Signaling Mediated by TSLP and IL-7 in Inflammation, Autoimmune Diseases, and Cancer. Front Immunol. 2020;11(July):1–19. [CrossRef]
- Ziegler SF, Artis D. Sensing the outside world: TSLP regulates barrier immunity. Nat Immunol. 2010;11(4):289–93. [CrossRef]
- Yoo J, Omori M, Gyarmati D, Zhou B, Aye T, Brewer A, et al. Spontaneous atopic dermatitis in mice expressing an inducible thymic stromal lymphopoietin transgene specifically in the skin. Journal of Experimental Medicine. 2005;202(4):541–9. [CrossRef]
- Hui CCK, Yu A, Heroux D, Akhabir L, Sandford AJ, Neighbour H, et al. Thymic stromal lymphopoietin (TSLP) secretion from human nasal epithelium is a function of TSLP genotype. Mucosal Immunol. 2015;8(5):993–9. [CrossRef]
- Kaur D, Doe C, Woodman L, Wan WYH, Sutcliffe A, Hollins F, et al. Mast cell-airway smooth muscle crosstalk: The role of thymic stromal lymphopoietin. Chest. 2012;142(1):76–85.
- Redhu NS, Gounni AS. Function and mechanisms of TSLP/TSLPR complex in asthma and COPD. Clinical and Experimental Allergy. 2012;42(7):994–1005. [CrossRef]
- Buchheit KM, Cahill KN, Katz HR, Murphy KC, Feng C, Lee-Sarwar K, Lai J, Bhattacharyya N, Israel E, Boyce JA LTM. Thymic stromal lymphopoietin controls prostaglandin D2 generation in aspirin-exacerbated respiratory disease. Journal of Allergy and Clinical Immunology. 2016;137(5):1566-1576.e5.
- Boita M, Garzaro M, Raimondo L, Riva G, Mazibrada J, Vizio B, et al. The expression of tslp receptor in chronic rhinosinusitis with and without nasal polyps. Int J Immunopathol Pharmacol. 2011;24(3):761–8. [CrossRef]
- Klimek L, Hagemann J, Welkoborsky HJ, Cuevas M, Casper I, Förster-Ruhrmann U, et al. Epithelial immune regulation of inflammatory airway diseases: Chronic rhinosinusitis with nasal polyps (CRSwNP). Allergol Select. 2022;6(01):148–66.
- Kimura S, Pawankar R, Mori S, Nonaka M, Masuno S, Yagi T, et al. Increased expression and role of thymic stromal lymphopoietin in nasal polyposis. Allergy Asthma Immunol Res. 2011;3(3):186–93. [CrossRef]
- Peng Y, Zi XX, Tian TF, Lee B, Lum J, Tang SA, et al. Whole-transcriptome sequencing reveals heightened inflammation and defective host defence responses in chronic rhinosinusitis with nasal polyps. European Respiratory Journal. 2019;54(5).
- Drake VE, Rafaels N, Kim J. Peripheral blood eosinophilia correlates with hyperplastic nasal polyp growth. Int Forum Allergy Rhinol. 2016;6(9):926–34. [CrossRef]
- Pérez-Pazos J, García-Sánchez A, Estravís M, Moreno-Jimenez E, Morgado N, Gómez-García M, et al. Beyond type 2 asthma biomarkers: risk stratification for NSAID-exacerbated respiratory disease. ERJ Open Res. 2024;10(4). [CrossRef]
- Elena-Pérez S, Heredero-Jung DH, García-Sánchez A, Estravís M, Martin MJ, Ramos-González J, et al. Molecular Analysis of IL-5 Receptor Subunit Alpha as a Possible Pharmacogenetic Biomarker in Asthma. Front Med (Lausanne). 2021;7(February):1–13. [CrossRef]
- García-Sánchez A, Estravís M, Martin MJ, Pérez-Pazos J, Martín-García C, Gil-Melcón M, et al. PTGDR2 expression in peripheral blood as a potential biomarker in adult patients with asthma. J Pers Med. 2021;11(9). [CrossRef]
- San Segundo-Val I, García-Sánchez A, Sanz C, Cornejo-García JA, Isidoro-García M, Dávila I. Promoter genotyping and mRNA expression– based analysis of the PTGDR gene in allergy. J Investig Allergol Clin Immunol. 2020;30(2):117–26.
- Immunology SC on ST of the EA of A and C. Skin tests used in type I allergy testing Position paper. Allergy, Asthma and Clinical Immunology. 1989;44:11–59.
- GEMA. GEMA 5.1. Spanish Guide for the Management of Asthma [Internet]. 2024 [cited 2024 Sep 11]. Available from: https://www.gemasma.com.
- Valero, A.; Muñoz, R. Comments on the classification of allergic rhinitis according to the ARIA guidelines 2008. J Investig Allergol Clin Immunol 2008;18(5):324-6.
- Kennedy JL, Hubbard MA, Huyett P, Patrie JT, Borish L, Payne SC. Surgical Improvement in Patients With Chronic Sinusitis. Ann Allergy Asthma Immunol. 2014;111(4):246–51.
- Livak KJ, Schmittgen TD. Analysis of relative gene expression data using real-time quantitative PCR and the 2-ΔΔCT method. Methods. 2001;25(4):402–8.
- Primer 3.0 [Internet]. [cited 2021 Nov 10]. Available from: http://bioinfo.ut.ee/primer3-0.4.0/.
- Beacon Designer [Internet]. [cited 2021 Nov 10]. Available from: www.premierbiosoft.com.
- Applied Biosystems. Guide to Performing Relative Quantification of Gene Expression Using Real-Time Quantitative PCR. Waltham, MA, USA; 2008.
Figure 1.
The boxplots illustrate: (A) The expression of TSLPR in peripheral blood and (B) The expression of TSLP in peripheral blood. CRSwNP: chronic rhinosinusitis with nasal polyposis without asthma; N-ERD: NSAID-exacerbated respiratory disease; *** p < 0.001; ** p < 0.01; * p < 0.05; p-value of the Kruskal-Wallis test for each group of patients vs. controls.
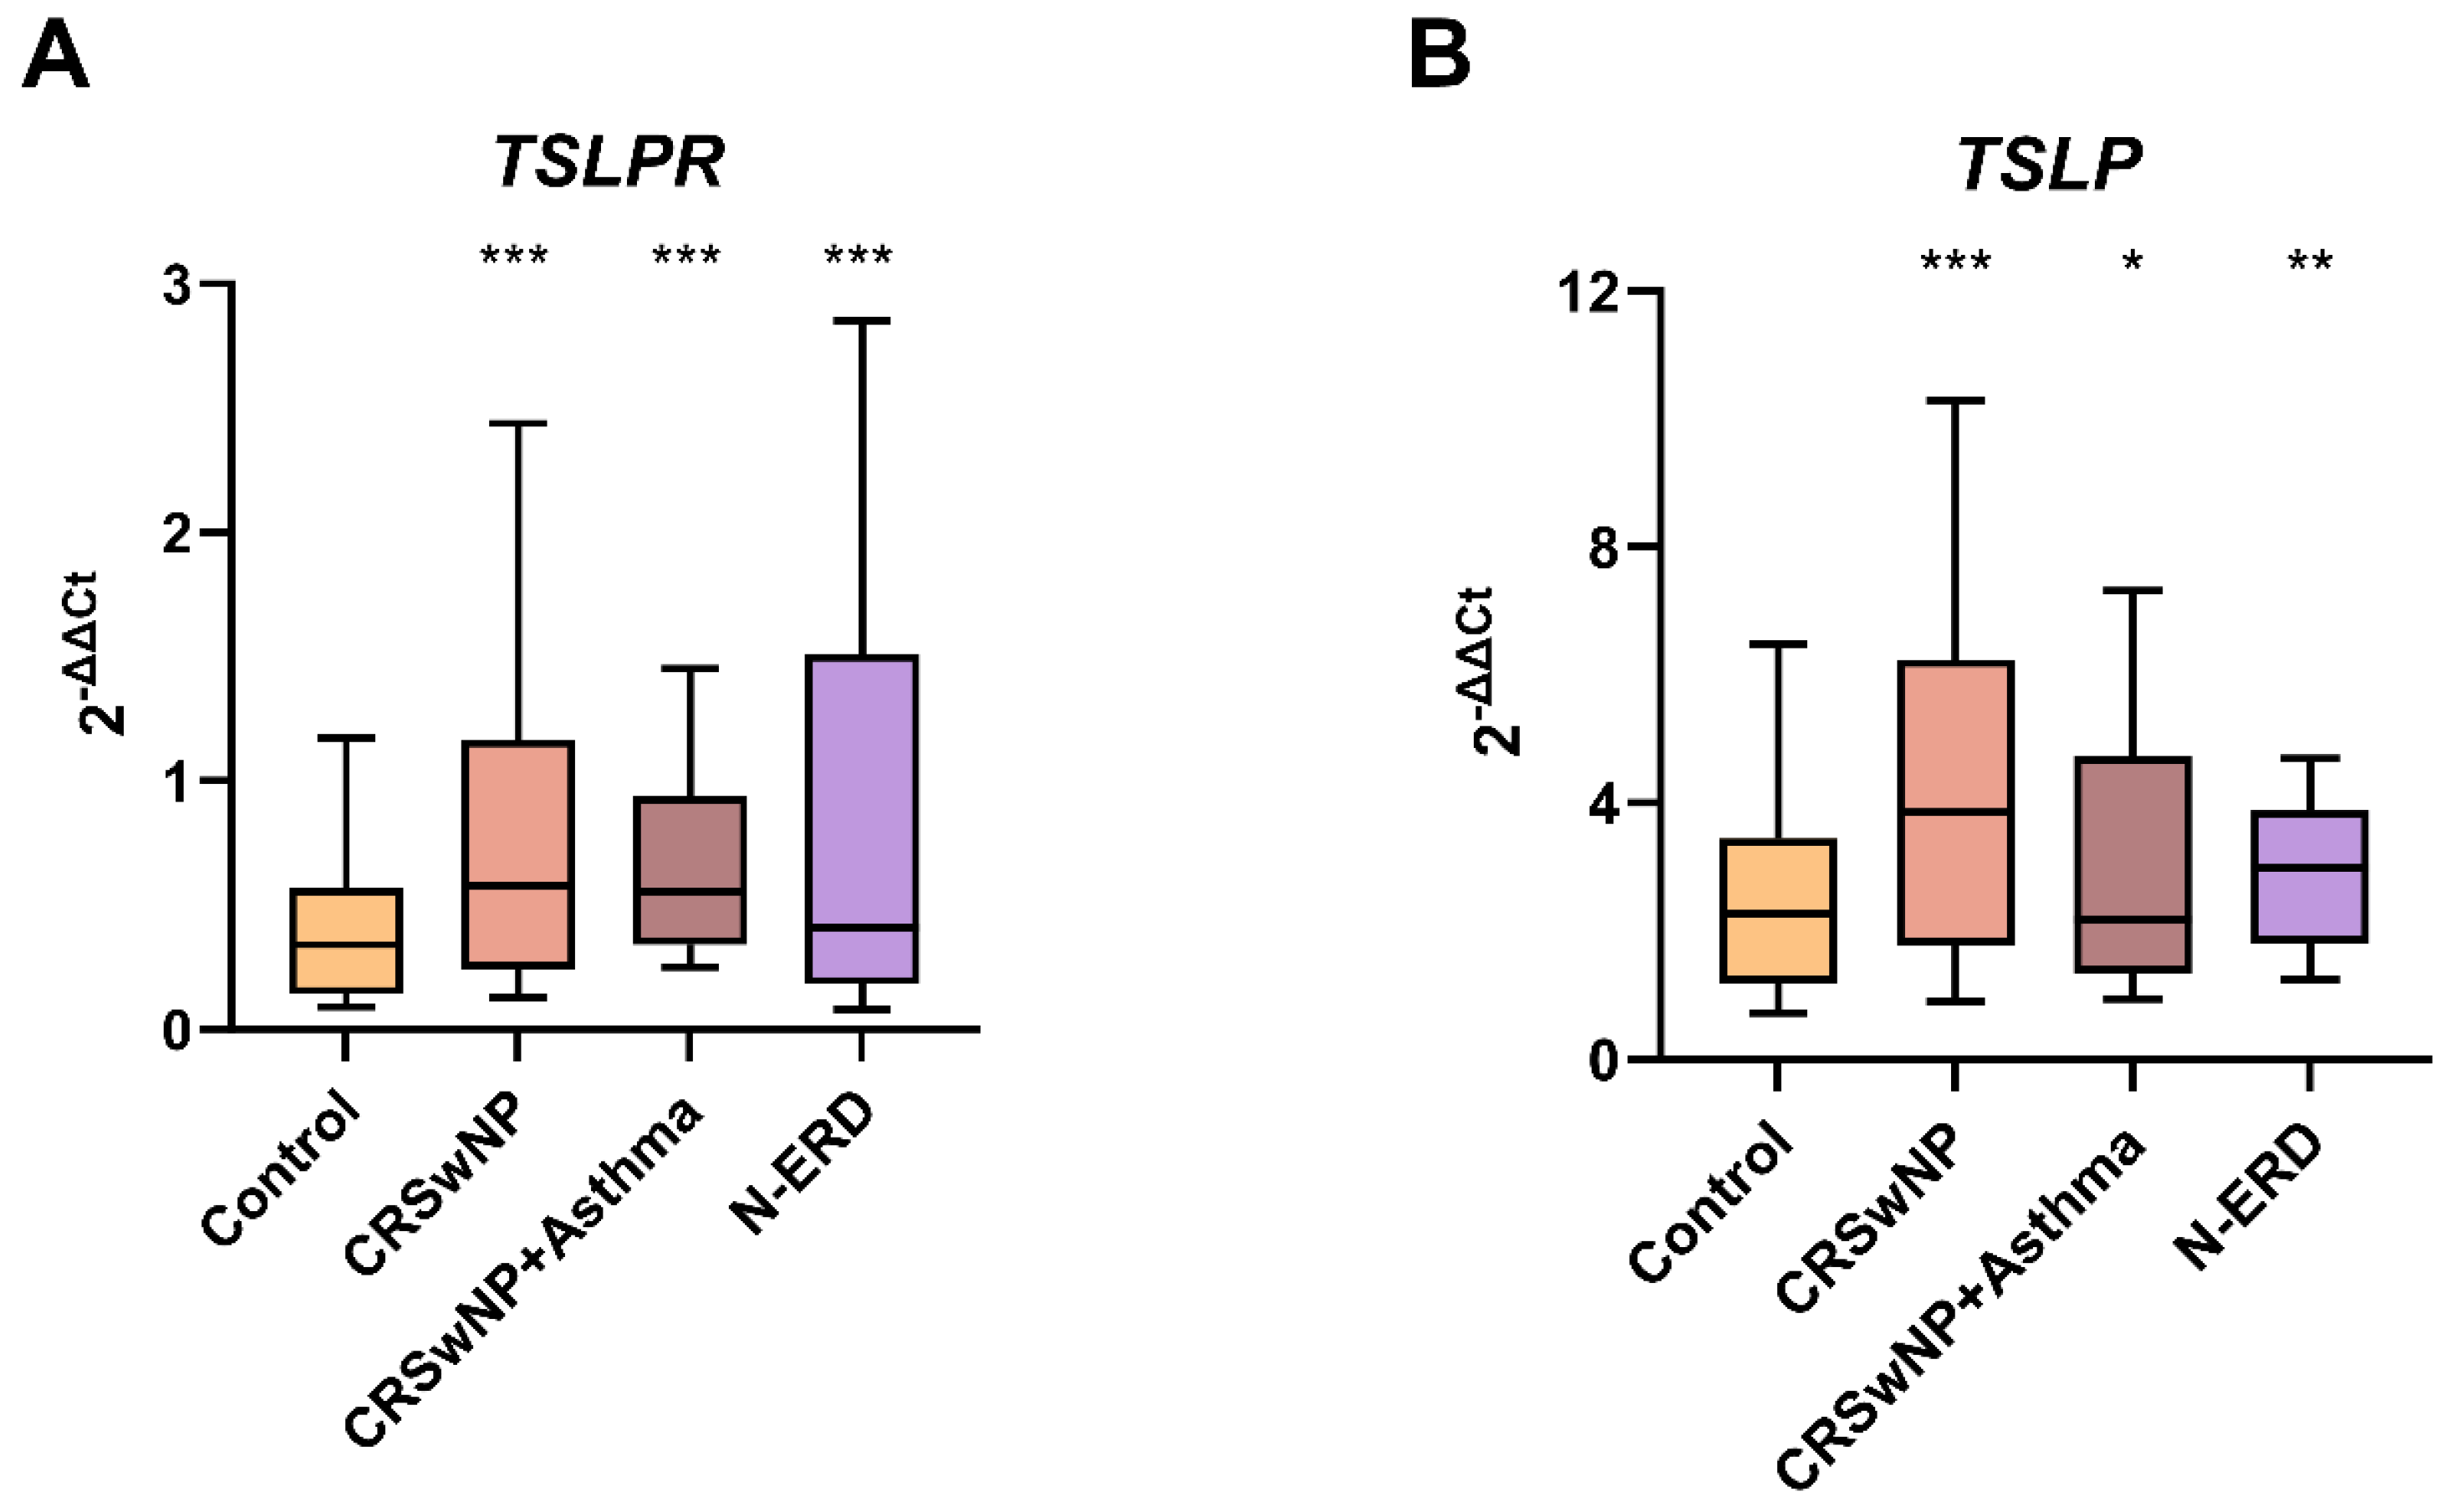
Figure 2.
The boxplots illustrate: (A) The expression of TSLPR in tissue biopsy, (B) The expression of TSLP in tissue biopsy, (C) The expression of TSLPR in peripheral blood, and (D) The expression of TSLP in peripheral blood. CRSwNP: chronic rhinosinusitis with nasal polyposis; N-ERD: NSAID-exacerbated respiratory disease; *** p < 0.001; ** p < 0.01; * p < 0.05; p-value of the Kruskal-Wallis test for each patient's group vs controls.
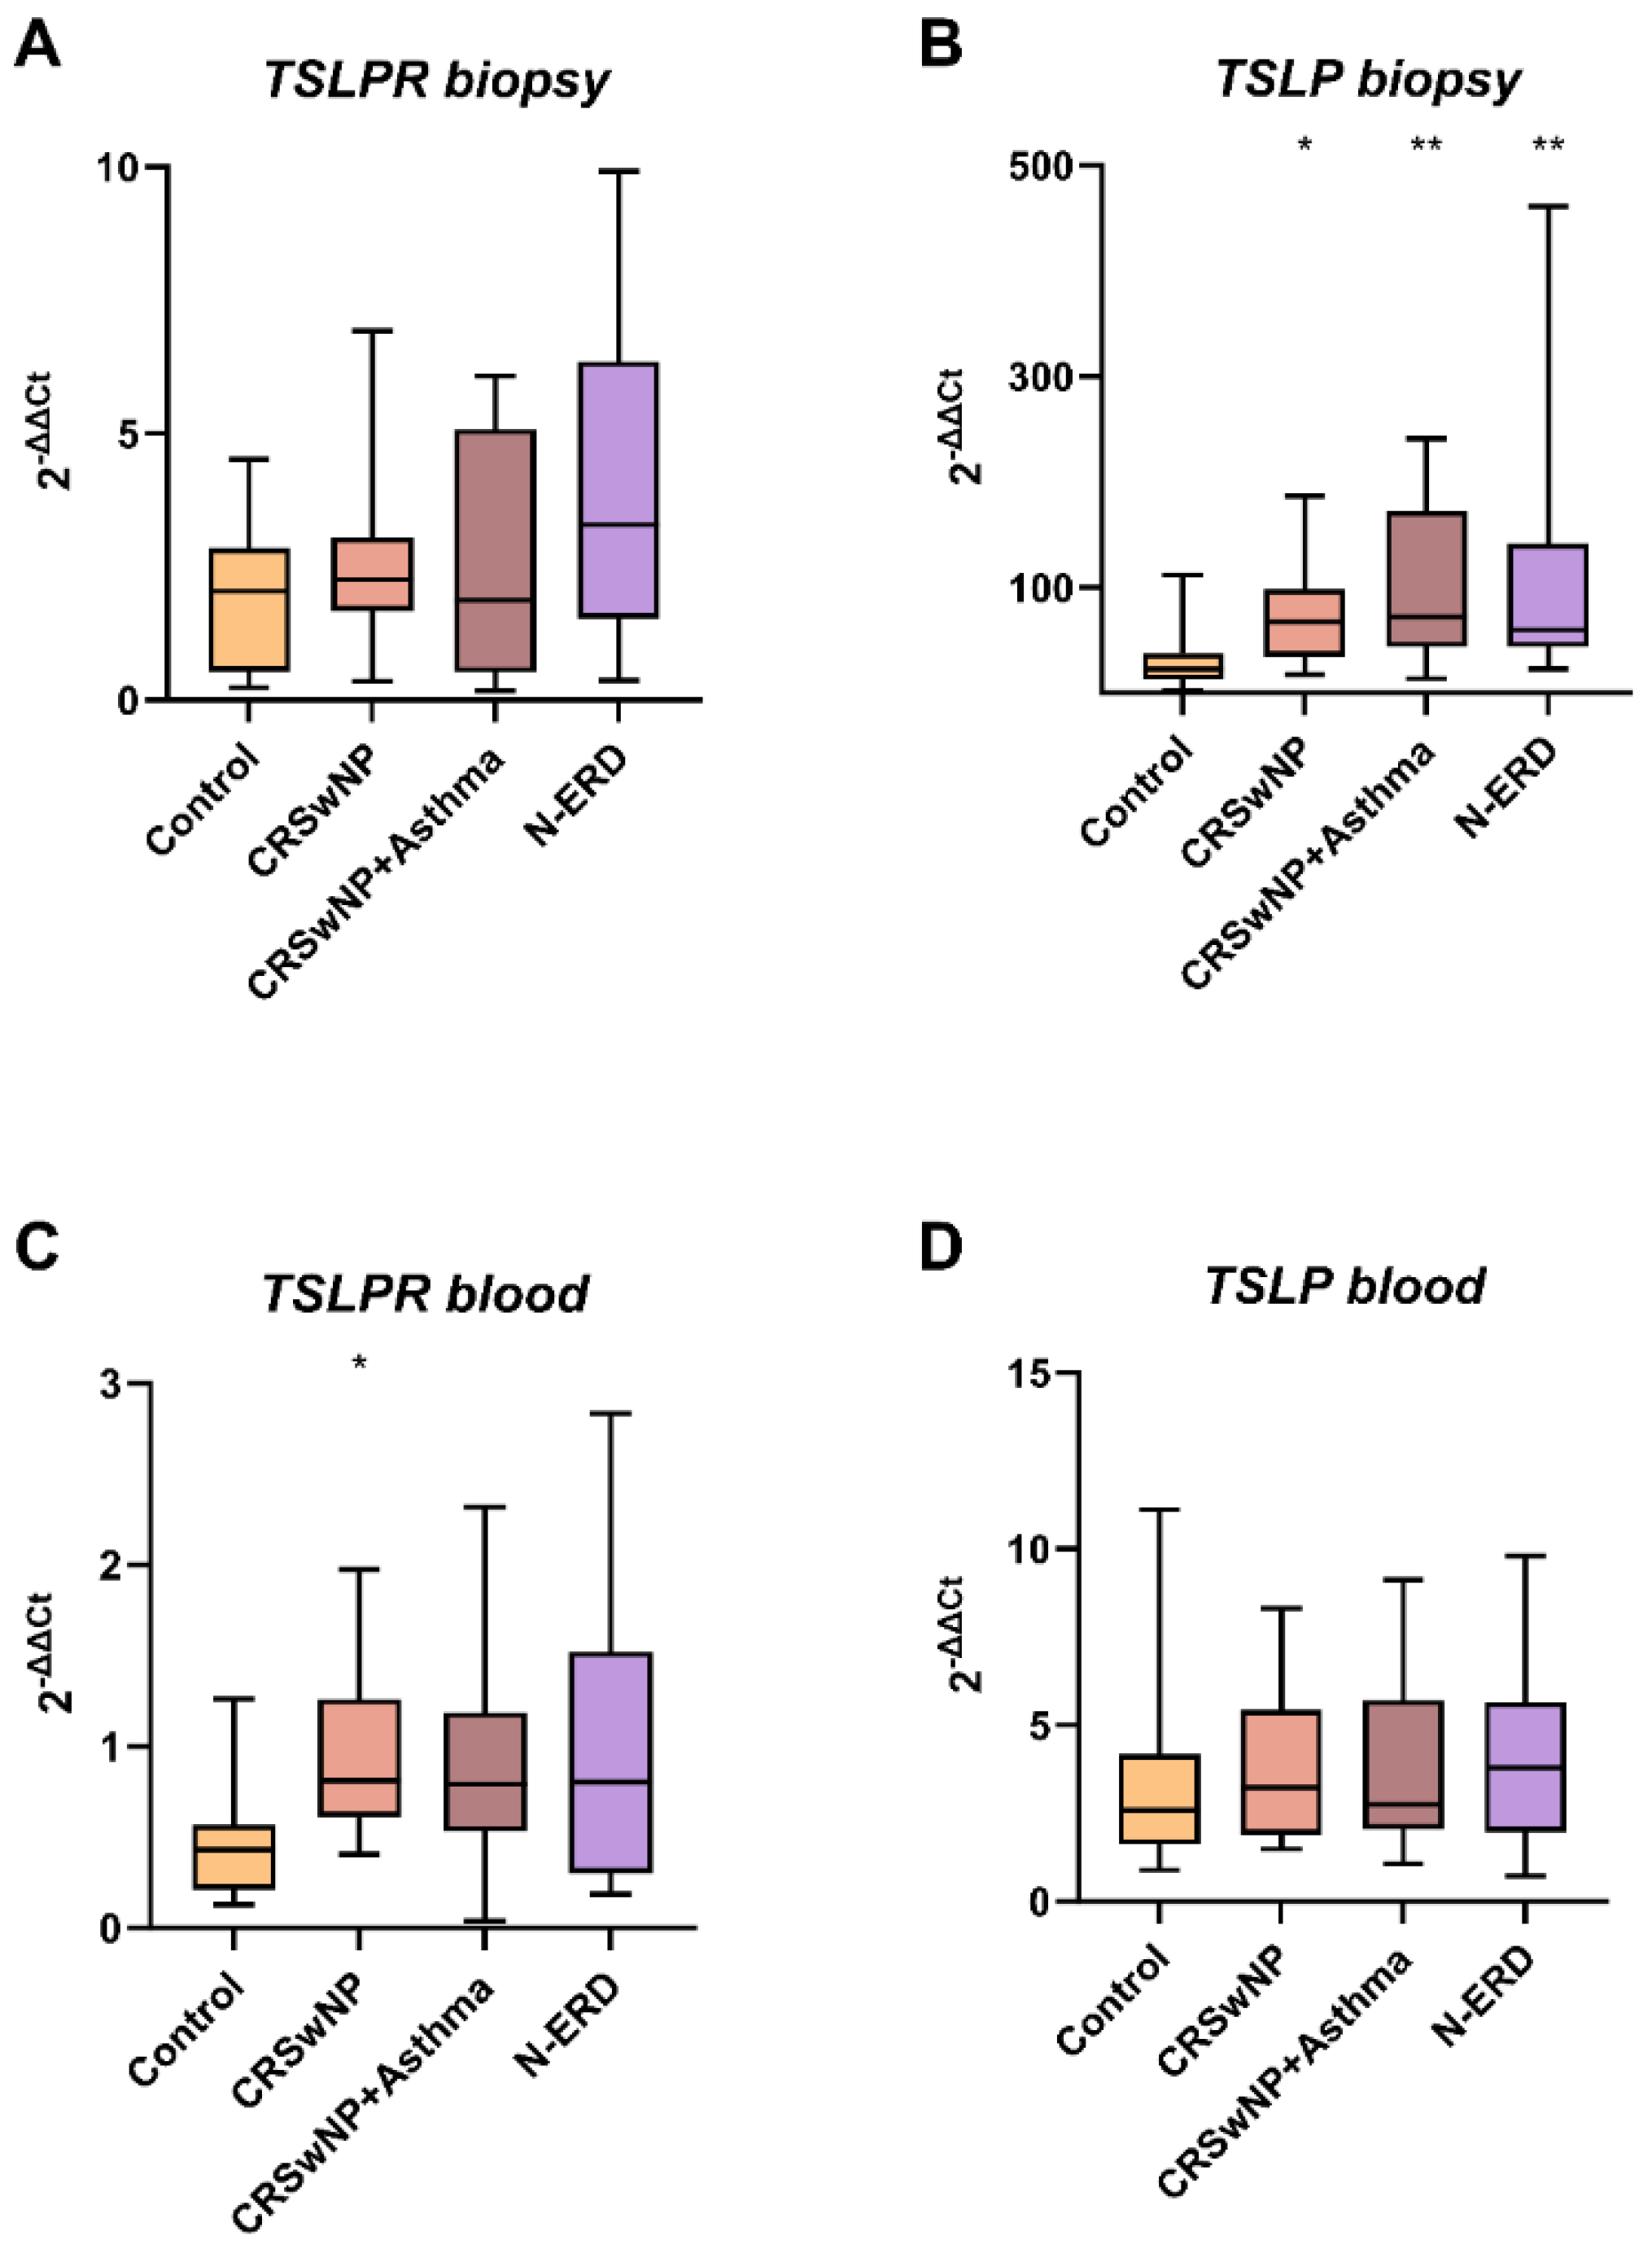
Figure 3.
Scatter plot of the Ln relationship of TSLPR expression and peripheral eosinophil counts. Four quadrants were obtained by dividing according to a positivity cut-off of 252.5 eosinophils cells/µL (Ln= 5.53) (Specificity=90.70%) and a cut off of 0.575-fold difference (Ln= -0.55) for TSLPR expression (Specificity=80%): Q1(PBE<252.5cells/µL; TSLPR<0.575-fold); Q2(PBE<252.5cells/µL; TSLPR>0.575-fold); Q3(PBE>252.5cells/µL; TSLPR>0.575-fold); Q4(PBE>252.5cells/µL; TSLPR<0.575-fold).
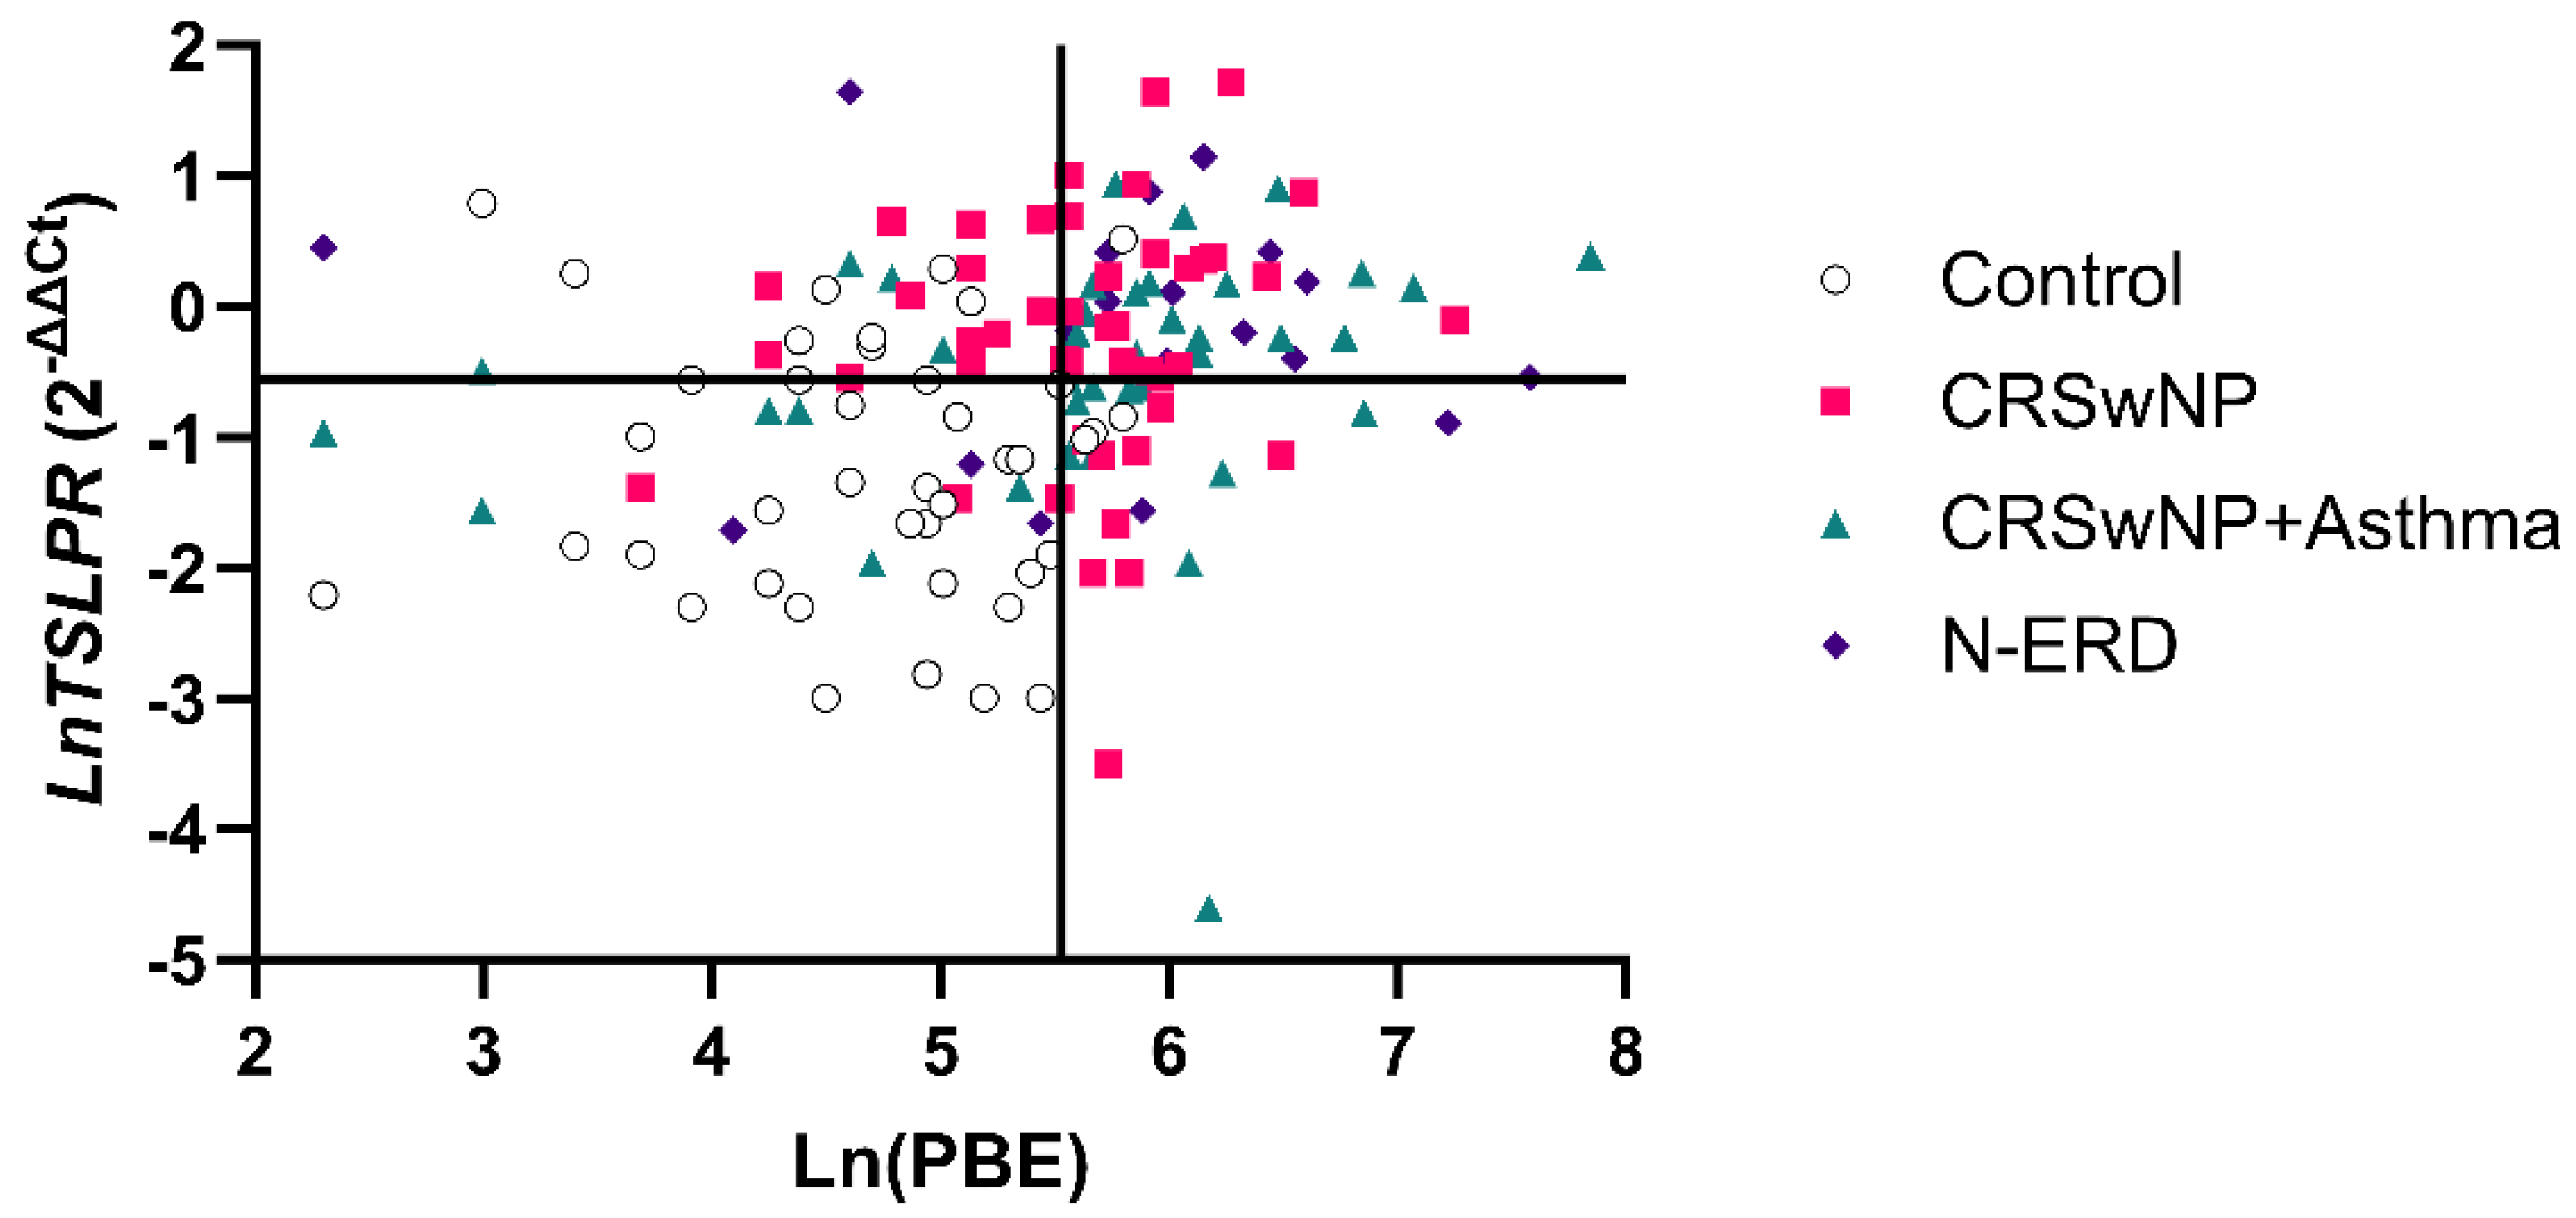
Figure 4.
Scatter plot of the Ln relationship of TSLP expression and peripheral eosinophil counts. Four quadrants were obtained by dividing according to a positivity cut-off of 252.5 eosinophils cells/µL (Ln= 5.53) (Specificity= 90.70%) and a cut off of 3.07-fold difference (Ln= 112) for TSLP expression (Specificity= 86.67%): Q1(PBE<252.5cells/µL; TSLP<3.07-fold); Q2(PBE<252.5cells/µL; TSLP>3.07-fold); Q3(PBE>252.5cells/µL; TSLP>3.07-fold); Q4(PBE>252.5cells/µL; TSLP<3.07-fold).
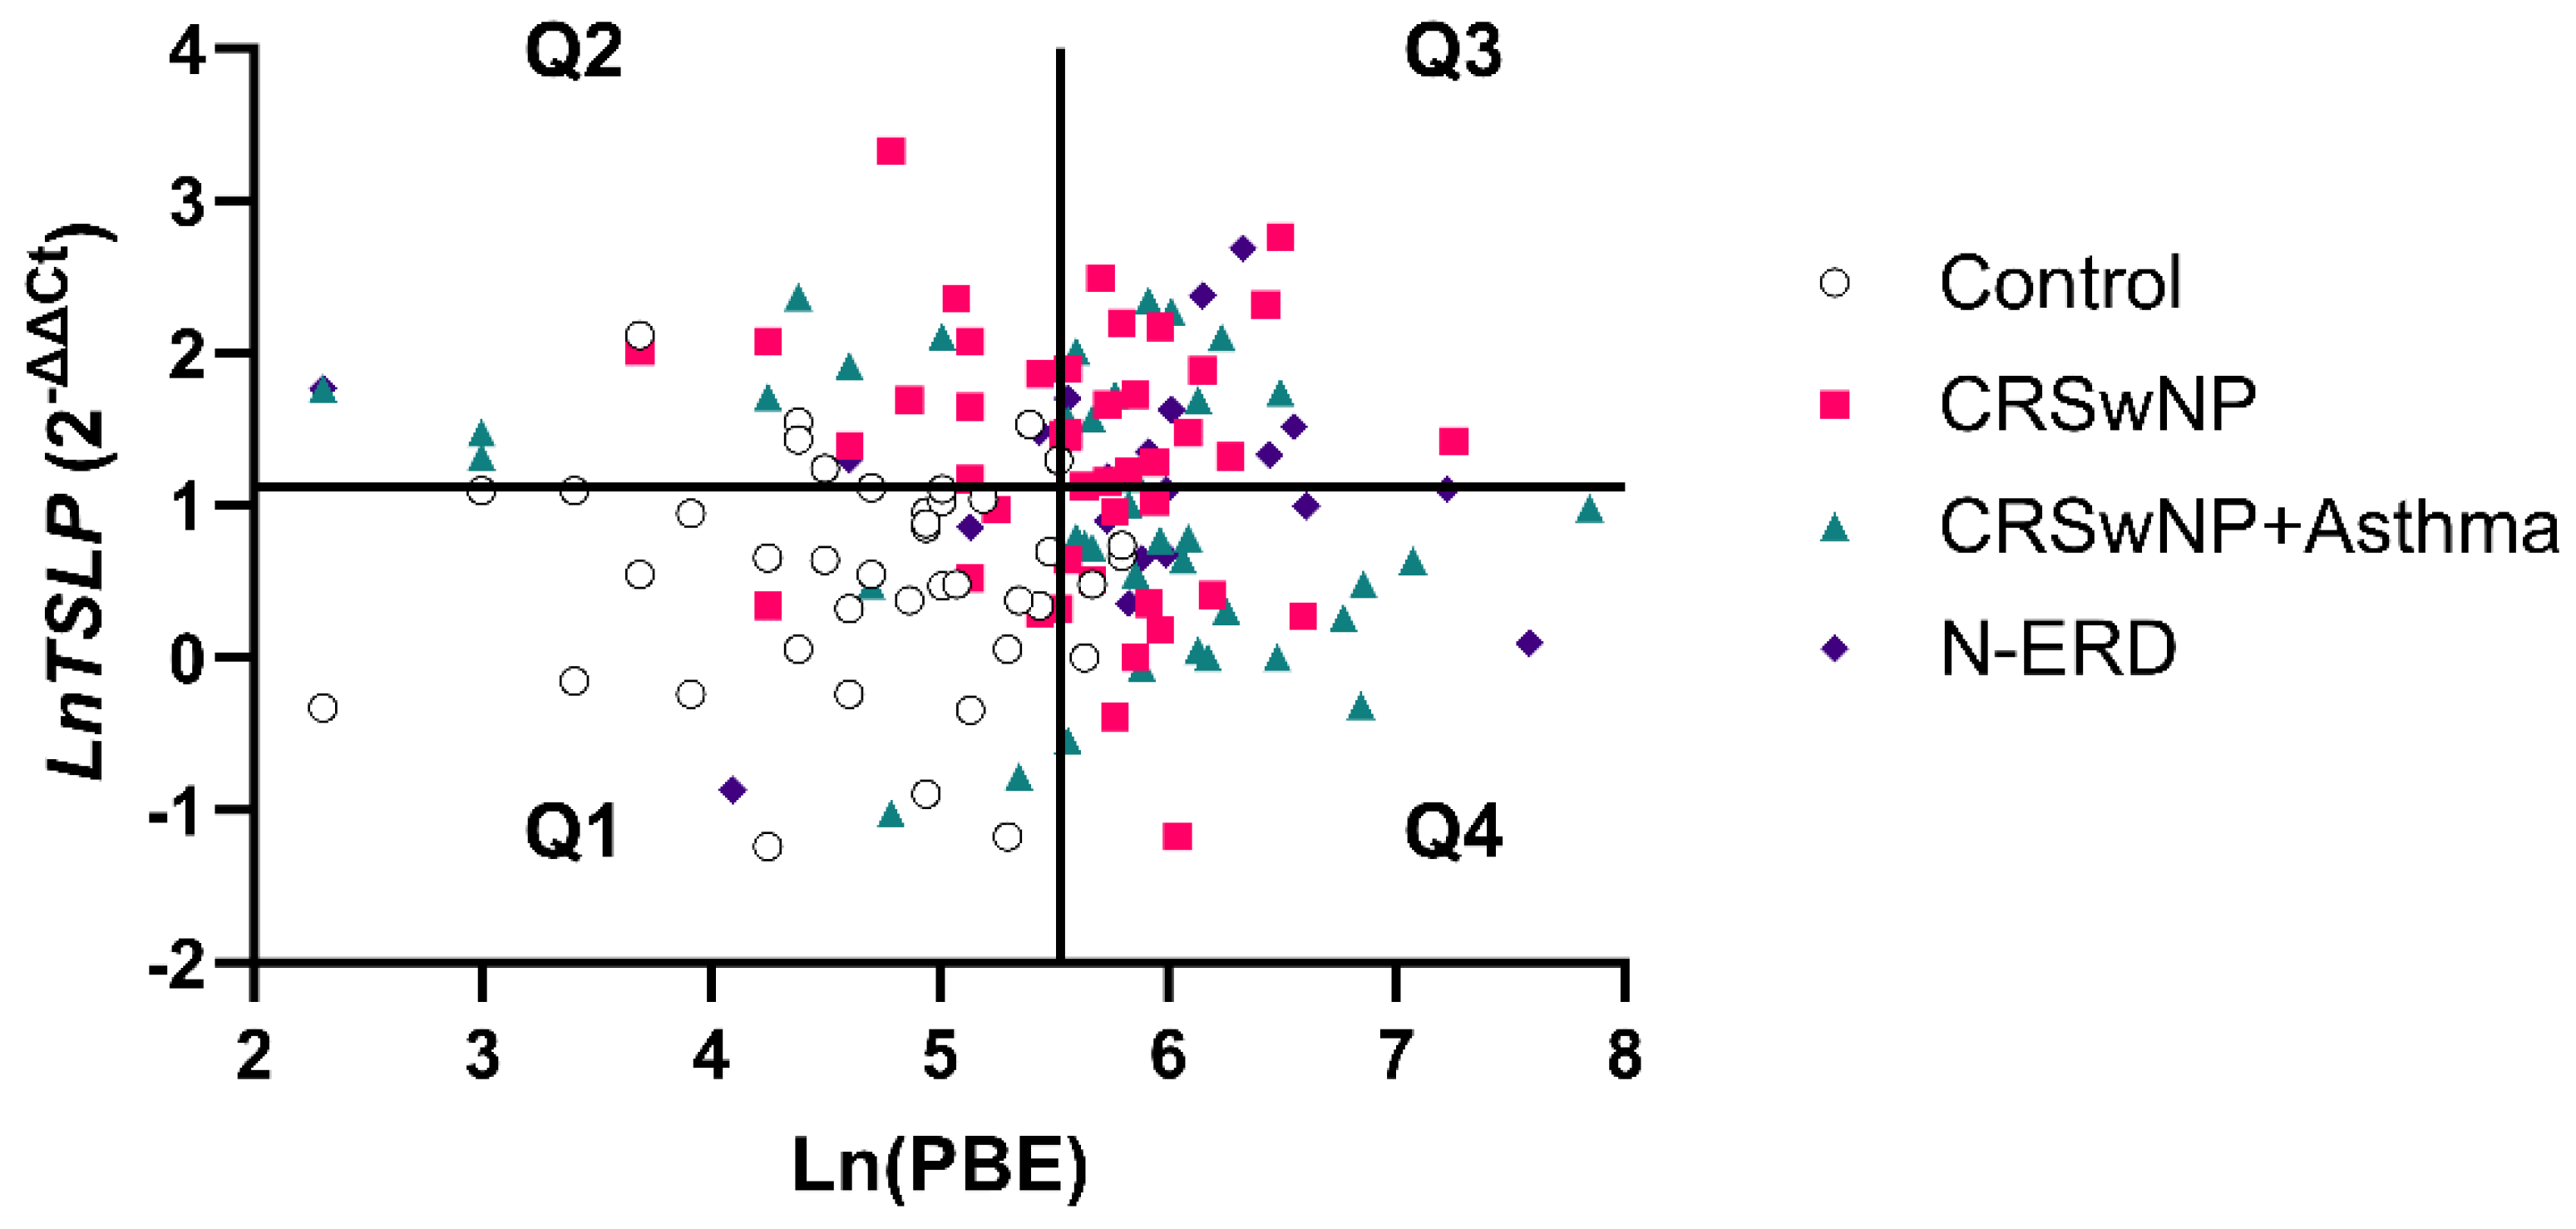

Table 1.
Clinical and phenotypic characteristics of the study population.
| HCs | PATIENTS | ||||
|---|---|---|---|---|---|
| Total | CRSwNP | CRSwNP +Asthma | N-ERD | ||
| N | 45 | 111 | 41 | 21 | 49 |
| Age (y) (mean± SD) | 55.51 ± 18.76 | 54.68±16.43 | 55.98±16.60 | 55.43±14.04 | 53.29±17.41 |
| Sex, F (%) | 35(77.8)a | 42(37.8)* | 20(48.8)b | 12(57.1)a,b | 10(20.4)c |
| Atopy (%) | 0a | 49(44.1)* | 21(51.2)b | 10(47.6)b | 18(36.7)b |
| Total IgE (kU/L) | 41.97 ± 49.77 | 225.18 ± 424.56* | 344.90±628.37*¥ | 179.15±187.34* | 141.09±206.52* |
|
PBE (cells/µl) |
133.02±86.75 | 395.37 ± 362.82* | 427.25±433.64* | 483.81±447.07* | 327.28±221.33* |
| SNOT-22 | - | 48.93±20.51 | 53.91±21.29 | 52.27±22.62 | 42.57±17.72 |
| FeNO (ppb) | - | 67.89±62.69 | 78.24±67.03 | 49.45±49.11 | - |
Values are expressed as the mean ± standard deviation or percentage (%). Data were analyzed using Kruskal-Wallis analysis and adjusted using Bonferroni correction. Only statistically significant differences are indicated: (*): p<0.05 compared to HCs; and (¥): p<0.05 compared to the CRSwNP group. The superscript (a,b,c) denoting each letter represents a subset of group categories whose column proportions do not differ significantly from each other at the 0.05 level. N: Number; HCs: healthy controls; CRSwNP: chronic rhinosinusitis with nasal polyposis without asthma; N-ERD: NSAID-exacerbated respiratory disease; PBE: peripheral blood eosinophils: FeNO: Fraction of exhaled nitric oxide; ppb: parts per billion; SNOT-22: Sinonasal outcome test.
Table 2.
TSLP and TSLPR expression levels in peripheral blood samples of the study population.
| HCs | PATIENTS | ||||
|---|---|---|---|---|---|
| Total | CRSwNP | CRSwNP +Asthma | N-ERD | ||
| N | 40 | 111 | 49 | 41 | 21 |
| TSLPR | 0.41±0.38 | 1.01±0.97* | 1.11±1.11* | 0.81±0.57* | 1.18±1.18* |
| TSLP | 2.10±1.52 | 4.31±3.86* | 4.99±4.68* | 3.61±2.90* | 4.09±3.27* |
Values are expressed as the mean ± standard deviation. Gene expression levels were determined by qPCR (2-ΔΔCt), and the mean and standard deviation were presented. Data were analyzed using Kruskal-Wallis analysis and adjusted using Bonferroni correction. Only statistically significant differences are indicated: (*): p<0.05 compared to healthy controls (HCs). N: Number; CRSwNP: chronic rhinosinusitis with nasal polyposis without asthma; N-ERD: NSAID-exacerbated respiratory disease; TSLP: Thymic stromal lymphopoietin; TSLPR: TSLP receptor.
Table 3.
Clinical and phenotypic characteristics of the study population with nasal biopsy samples.
| HCs | PATIENTS | ||||
|---|---|---|---|---|---|
| Total | CRSwNP | CRSwNP +Asthma | N-ERD | ||
| N | 11 | 33 | 11 | 11 | 11 |
| Age (y) (mean± SD) | 54.36±17.05 | 54.55±16.93 | 55.09±18.67 | 55.00±18.24 | 53.55±15.29 |
| Sex, F (%) | 9(81.8) a | 19(57.6) | 4(36.4) a | 8(72.7) a | 7(63.6) a |
| Atopy (%) | 0 a | 20(60.6)* | 6(54.5) b | 7(63.6) b | 7(63.6) b |
| Total IgE (kU/L) | 39.52 ± 71.50 | 220.59 ± 276.05* | 172.87±307.36 | 280.70±308.46* | 212.96±216.88* |
|
PBE (cells/µl) |
114.55±97.20 | 345.94 ± 185.85* | 250.91±83.60 | 391.00±150.51* | 400.00±254.01* |
| EO biopsy | - | 71.84±64.67 | 57.50±49.67 | 99.14±81.39 | 60.50±60.46 |
| SNOT-22 | - | 51.14±22.70 | 46.50±11.47 | 49.00±28.58 | 56.50±24.95 |
| FeNO (ppb) | - | 54.58±48.35 | - | 67.83±56.95 | 47.20±39.87 |
Values are expressed as mean ± standard deviation or percentage (%). Data were analyzed using Kruskal-Wallis analysis and adjusted using Bonferroni correction. Only statistically significant differences are indicated: (*): p<0.05 compared to healthy controls (HCs); Each letter in the superscript (a,b,c) denotes a subset of group categories whose column proportions are not significantly different at the 0.05 level. N: Number; CRSwNP: chronic rhinosinusitis with nasal polyposis without asthma; N-ERD: NSAID-exacerbated respiratory disease; PBE: peripheral blood eosinophils: FeNO: Fraction of exhaled nitric oxide; ppb: parts per billion; SNOT-22: Sinonasal outcome test.
Table 4.
TSLP and TSLPR relative expression in the study population with nasal biopsy samples.
| HCs | PATIENTS | ||||
|---|---|---|---|---|---|
| Total | CRSwNP | CRSwNP +Asthma | N-ERD | ||
| N | 11 | 33 | 11 | 11 | 11 |
| TSLPRbiopsy | 2.06±1.44 | 7.01±17.99 | 2.79±2.15 | 13.98±30.65 | 4.25±3.24 |
| TSLPbiopsy | 34.14±34.35 | 99.37±98.68* | 72.41±53.64* | 104.49±76.78* | 121.23±145.03* |
| TSLPRblood | 0.51±0.38 | 0.97±0.68* | 1.00±0.53* | 0.91±0.69 | 1.01±0.86 |
| TSLPblood | 3.56±3.30 | 3.95±2.54 | 3.84±2.26 | 3.86±2.73 | 4.14±2.84 |
Values are expressed as the mean ± standard deviation or percentage (%). Gene expression values were determined by qPCR (2-ΔΔCt); the mean and standard deviation are presented. Data were analyzed using Kruskal-Wallis analysis and adjusted using Bonferroni correction. Only statistically significant differences are indicated: (*): p<0.05 compared to healthy controls (HCs). N: Number; CRSwNP: chronic rhinosinusitis with nasal polyposis without asthma; N-ERD: NSAID-exacerbated respiratory disease; TSLP: Thymic stromal lymphopoietin; TSLPR: TSLP receptor.
Table 5.
Receiver operating curve analysis in the population study.
| Total | CRSwNP vs. HCs |
CRSwNP+ Asthma vs. HCs |
N-ERD vs. HCs |
CRSwNP+ Asthma vs. N-ERD |
CRSwNP vs. CRSwNP+ Asthma |
CRSwNP Vs. N-ERD |
|
|---|---|---|---|---|---|---|---|
| PBE blood |
0.841¥ (0.778-0.903) |
0.848 (0.769-0.928) |
0.822 (0.723-0.920) |
0.860 (0.740-0.980) |
0.548 (0.394-0.701) |
0.566¥ (0.441-0.691) |
0.624 (0.468-0.781) |
| TSLPRblood |
0.759¥ (0.674-0.845) |
0.765¥ (0.669-0.862) |
0.739¥ (0.633-0.846) |
0.785¥ (0.669-0.901) |
0.583 (0.426-0.740) |
0.436*¥ (0.317-0.554) |
0.515*¥ (0.365-0.664) |
| TSLPblood |
0.701*¥ (0.618-0.784) |
0.743*¥ (0.641-0.845) |
0.628*¥ (0.508-0.748) |
0.746*¥ (0.614-0.877) |
0.577 (0.431-0.723) |
0.411*¥ (0.292-0.530) |
0.454*¥ (0.313-0.596) |
|
TSLPR+ TSLP |
0.795¥ (0.722-0.868) |
0.824¥ (0.737-0.911) |
0.761¥ (0.659-0.863) |
0.788¥ (0.665-0.911) |
0.571 (0.410-0.732) |
0.629 (0.512-0.745) |
0.535* (0.396-0.675) |
|
PBE+ TSLPR |
0.876 (0.819-0.933) |
0.894 (0.826-0.962) |
0.838 (0.743-0.933) |
0.903 (0.809-0.996) |
0.613 (0.460-0.766) |
0.624 (0.505-0.742) |
0.636 (0.483-0.789) |
|
PBE+ TSLP |
0.907 (0.861-0.954) |
0.927 (0.875-0.980) |
0.886 (0.814-0.958) |
0.901 (0.805-0.998) |
0.558 (0.405-0.710) |
0.610 (0.489-0.731) |
0.611 (0.461-0.761) |
|
PBE+ TSLPR+ TSLP |
0.920 (0.876-0.964) |
0.946 (0.902-0.990) |
0.889 (0.816-0.962) |
0.926 (0.837-1.000) |
0.610 (0.454-0.765) |
0.662 (0.545-0.779) |
0.617 (0.471-0.763) |
Data are presented as the area under the receiver operating characteristic curve (AUC) (95% confidence interval). For each patient group (columns), yellow shading indicates the highest absolute value of the AUC for each single variable. Grey-shaded cells indicate that the AUC is significantly lower than the highest AUC value (*: p<0.05 compared with yellow shading; ¥: p<0.05 compared with orange shaded). Orange-shaded cells indicate the highest AUC of variable combinations compared to the AUC of single variables. In all other cells, the AUC values are statistically equivalent (p>0.05) to the highest AUC value. Bold cells show statistically significant AUCs. AUC: Area under the curve; CI: Confidence Interval; CRSwNP: chronic rhinosinusitis with nasal polyposis without asthma; N-ERD: Nonsteroidal anti-inflammatory drug (NSAID)-exacerbated respiratory disease; PBE: peripheral blood eosinophils.
Table 6.
Receiver operating curve analysis in the study population with biopsy samples.
| Total | CRSwNP vs. HCs |
CRSwNP+ Asthma vs. HCs |
N-ERD vs. HCs |
CRSwNP+ Asthma vs. N-ERD |
CRSwNP vs. CRSwNP+ Asthma |
CRSwNP vs. N-ERD |
|
|---|---|---|---|---|---|---|---|
| PBE blood |
0.879 (0.769-0.990) |
0.872 (0.711-1.000) |
0.941 (0.843-1.000) |
0.831¥ (0.638-1.000) |
0.518 (0.258-0.778) |
0.818 (0.613-1.000) |
0.686 (0.437-0.935) |
| TSLPRbiopsy |
0.650*¥ (0.481-0.819) |
0.612*¥ (0.371-0.852) |
0.628*¥ (0.377-0.879) |
0.711* (0.486-0.936) |
0.537 (0.287-0.788) |
0.554*¥ (0.297-0.811) |
0.612¥ (0.360-0.863) |
| TSLPbiopsy |
0.802¥ (0.646-0.958) |
0.752*¥ (0.540-0.964) |
0.826*¥ (0.646-1.000) |
0.826¥ (0.648-1.000) |
0.455 (0.206-0.703) |
0.620*¥ (0.376-0.863) |
0.587¥ (0.341-0.833) |
|
TSLPR+ TSLP |
0.804¥ (0.659-0.950) |
0.744*¥ (0.535-0.953) |
0.860*¥ (0.701-1.000) |
0.826¥ (0.643-1.000) |
0.479 (0.220-0.738) |
0.636*¥ (0.396-0.877) |
0.678¥ (0.447-0.908) |
|
PBE+ TSLPR |
0.884 (0.772-0.995) |
0.868 (0.707-1.000) |
0.936 (0.832-1.000) |
0.893 (0.760-1.000) |
0.500 (0.242-0.758) |
0.836 (0.638-1.000) |
0.711 (0.477-0.944) |
|
PBE+ TSLP |
0.915 (0.814-1.000) |
0.901 (0.758-1.000) |
0.955 (0.861-1.000) |
0.901 (0.766-1.000) |
0.500 (0.243-0.757) |
0.818 (0.613-1.000) |
0.777 (0.548-1.000) |
|
PBE+ TSLPR+TSLP |
0.929 (0.836-1.000) |
0.876 (0.717-1.000) |
0.955 (0.861-1.000) |
0.950 (0.866-1.000) |
0.527 (0.270-0.784) |
0.827 (0.626-1.000) |
0.785 (0.582-0.989) |
Data are presented as the area under the receiver operating characteristic curve (AUC) (95% confidence interval). For each patient group (columns), yellow shading indicates the highest absolute value of the AUC for each single variable. Grey-shaded cells indicate that the AUC is significantly lower than the highest AUC value (*: p<0.05 compared with yellow shading; ¥: p<0.05 compared with orange shaded). Orange-shaded cells indicate the highest AUC of variable combinations compared with the AUC of single variables; in all other cells, the AUC values are statistically equivalent (p>0.05) to the highest AUC value. Bold cells show statistically significant AUCs. AUC: Area under the curve; CI: Confidence Interval; CRSwNP: Chronic rhinosinusitis with nasal polyposis without asthma; N-ERD: Nonsteroidal anti-inflammatory drug (NSAID)-exacerbated respiratory disease; PBE: peripheral blood eosinophils.
Table 7.
Regression analysis of potential biomarkers in blood.
| Healthy controls versus patients | ||||||||||||||
|---|---|---|---|---|---|---|---|---|---|---|---|---|---|---|
| SLR | Biomarker | PBE | TSLPR | TSLP | ||||||||||
| OR | 1.014 | 5.645 | 1.538 | |||||||||||
| (95% CI) | (1.008-1.019) | (1.976-16.125) | (1.159-2.039) | |||||||||||
| p-value | <0.001 | <0.001 | <0.01 | |||||||||||
| MLR | Biomarker | PBE | + | TSLPR | PBE | + | TSLP | PBE | + | TSLPR | + | TSLP | ||
| OR | 1.014 | 4.413 | 1.017 | 1.905 | 1.017 | 4.589 | 1.946 | |||||||
| (95% CI) | (1.008-1.020) | (1.306-14.913) | (1.009-1.024) | (1.289-2.816) | (1.009-1.025) | (1.067-19.730) | (1.268-2.986) | |||||||
| p-value | <0.001 | <0.01 | <0.001 | <0.001 | <0.001 | <0.05 | <0.001 | |||||||
Potential biomarkers in peripheral blood were tested individually by simple logistic regression (SLR) and multiple logistic regression (MLR). Bold text indicates statistically significant values. The values were adjusted for sex, age, and atopy. PBE: peripheral blood eosinophils; TSLPR: thymic stromal lymphopoietin receptor; TSLP: thymic stromal lymphopoietin.
Table 8.
Diagnostic values of peripheral blood eosinophils, thymic stromal lymphopoietin, and thymic stromal lymphopoietin receptor.
Table 8.
Diagnostic values of peripheral blood eosinophils, thymic stromal lymphopoietin, and thymic stromal lymphopoietin receptor.
| Healthy controls versus patients | |||||||
|---|---|---|---|---|---|---|---|
| Biomarkers (cut-off) | Combinations (cut-off) | ||||||
| PBE (≥252.5) |
TSLPR (≥0.575) |
TSLP (≥3.07) |
PBE (≥252.5) + TSLPR (≥0.575) |
PBE (≥252.5) + TSLP (≥3.07) |
PBE (≥252.5) + TSLPR (≥0.575) + TSLP (≥3.07) |
TSLPR (≥0.575) + TSLP (≥3.07) |
|
| S (%) | 71.96 | 67.57 | 54.05 | 87.85 | 90.65 | 95.33 | 81.98 |
| SP (%) | 90.70 | 80.00 | 86.67 | 97.67 | 97.67 | 100.00 | 100.00 |
| LR (+) | 7.74 | 3.38 | 4.05 | 37.78 | 38.98 | - | - |
| LR (-) | 0.31 | 0.41 | 0.53 | 0.12 | 0.10 | 0.05 | 0.18 |
| PPV (%) | 95.06 | 89.29 | 90.91 | 98.95 | 98.98 | 100.00 | 100.00 |
| NPV (%) | 56.52 | 50.00 | 43.33 | 76.36 | 80.77 | 89.58 | 69.23 |
| AUC (95% CI) | 0.841 | 0.759 | 0.701 | 0.876 | 0.907 | 0.920 | 0.795 |
Cut-off values for each potential biomarker were calculated from receiver operating characteristic curve data using the Jouden index. PBE is expressed as cells/μL−1 and gene expression from quantitative PCR as 2-ΔΔCt. PBE: peripheral blood eosinophils; S: sensitivity; SP: specificity; LR: likelihood ratio; PPV: positive predictive value; NPV: negative predictive value; AUC: area under the receiver operating characteristic curve.
Table 9.
Phenotypic and clinic characteristics of the four quadrants were obtained by dividing according to values for eosinophils count (252.5 cells/µL) and TSLPR expression in controls (0.575-fold difference), both with a specificity ≥95%.
Table 9.
Phenotypic and clinic characteristics of the four quadrants were obtained by dividing according to values for eosinophils count (252.5 cells/µL) and TSLPR expression in controls (0.575-fold difference), both with a specificity ≥95%.
| Q1 (PBE<252.5 cells/µL; TSLPR <0.575-fold difference) | ||||||||
| N | †Sex | Age, Year | IgE, KU/L | PBE | SNOT-22 | FeNO | TSLPR | |
| Controls | 31 | 23 | 57.42±15.79 | 38.27±43.40 | 120.32±72.23 | n/a | n/a | 0.25±0.17 |
| Total Patients | 12 | 6 | 52.33±17.93 | 99.70±133.98 | 117.50±83.90 | 52.75±26.24 | 42.50±23.98 | 0.27±0.10 |
| CRSwNP | 3 | 1 | 37.33±11.24 | 38.97±9.29 | 150.00±105.36 | n/a | n/a | 0.24±0.01 |
| CRSwNP +Asthma | 6 | 3 | 56.33±19.82 | 71.78±70.26 | 83.33±72.57 | 36.00±29.70 | 32.00±14.18 | 0.31±0.13 |
| N-ERD | 3 | 2 | 59.33±14.15 | 216.27±240.92 | 153.33±86.22 | 69.50±7.78 | 74.00 | 0.22±0.07 |
| Q2 (PBE<252.5 cells/µL; TSLPR ≥0.575-fold difference) | ||||||||
| N | †Sex | Age, Year | IgE, KU/L | PBE | SNOT-22 | FeNO | TSLPR | |
| Controls | 8 | 6 | 53.63±20.40 | 81.32±85.83 | 95.00±52.37 | n/a | n/a | 1.16±0.48 |
| Total Patients | 18 | 4 | 55.94±16.95 | 179.01±212.12 | 128.89±62.77 | 36.62±16.34 | 55.25±58.98 | 1.36±1.06 |
| CRSwNP | 12 | 3 | 55.08±19.08 | 87.01±63.55 | 151.67±54.41 | 37.33±18.14 | n/a | 1.15±0.51 |
| CRSwNP +Asthma | 4 | 0 | 60.00±13.49 | 491.00±270.25 | 97.50±55.60 | 36.67±16.17 | 70.33±62.07 | 0.99±0.38 |
| N-ERD | 2 | 1 | 53.00±15.56 | 107.00±8.49 | 55.00±63.64 | 30.00 | 10.00 | 3.37±2.55 |
| Q3 (PBE≥252.5 cells/µL; TSLPR ≥0.575-fold difference) | ||||||||
| N | †Sex | Age, Year | IgE, KU/L | PBE | SNOT-22 | FeNO | TSLPR | |
| Controls | 1 | 1 | 77.00 | 57,1 | 330 | n/a | n/a | 1.67 |
| Total Patients | 54 | 21 | 54.89±14.23 | 299.20±581.31 | 532.69±414.47 | 49.33±18.82 | 77.95±69.24 | 1.39±1.01 |
| CRSwNP | 22 | 5 | 51.00±13.02 | 183.44±269.57 | 433.86±250.27 | 44.08±16.13 | 12.00 | 1.64±1.37 |
| CRSwNP +Asthma | 18 | 9 | 58.61±14.69 | 550.64±911.22 | 631.11±541.80 | 53.31±18.19 | 97.75±75.87 | 1.22±0.57 |
| N-ERD | 14 | 7 | 56.21±14.92 | 148.47±145.57 | 561.43±429.51 | 50.75±23.75 | 56.50±53.24 | 1.20±0.75 |
| Q4 (PBE≥252.5 cells/µL; TSLPR <0.575-fold difference) | ||||||||
| N | †Sex | Age, Year | IgE, KU/L | PBE | SNOT-22 | FeNO | TSLPR | |
| Controls | 3 | 3 | 58.67±28.68 | 17.55±4.45 | 300.00±26.46 | n/a | n/a | 0.39±0.04 |
| Total Patients | 23 | 11 | 57.09±20.21 | 170.66±188.48 | 426.53±257.55 | 70.83±18.04 | 60.50±62.85 | 0.33±0.17 |
| CRSwNP | 9 | 1 | 66.11±20.77 | 157.30±213.53 | 360.00±117.47 | 57.00±26.87 | n/a | 0.25±0.14 |
| CRSwNP +Asthma | 12 | 8 | 52.08±13.32 | 143.28±108.32 | 403.33±192.61 | 77.75±10.50 | 68.00±63.90 | 0.39±0.18 |
| N-ERD | 2 | 2 | 46.50±13.44 | 395.00±420.02 | 865.00±714.18 | n/a | 8.00 | 0.31±0.14 |
Number of cases (percentage) or mean media ± SD; †Female Sex; CRSwNP: Chronic rhinosinusitis with nasal polyposis without asthma; N-ERD: Aspirin exacerbated respiratory disease; PBE: absolute eosinophils count (cells/µL); FeNO: Fraction of exhaled nitric oxide; ppb: parts per billion; n/a: not available.
Table 10.
Phenotypic and clinic characteristics of the four quadrants were obtained by dividing according to values for eosinophils count (252.5 cells/µL) and TSLP expression in controls (3.070-fold difference), both with a specificity ≥95%.
Table 10.
Phenotypic and clinic characteristics of the four quadrants were obtained by dividing according to values for eosinophils count (252.5 cells/µL) and TSLP expression in controls (3.070-fold difference), both with a specificity ≥95%.
| Q1 (PBE<252.5 cells/µL; TSLP <3.070-fold difference) | ||||||||
| N | †Sex | Age, Year | IgE, KU/L | PBE | SNOT-22 | FeNO | TSLP | |
| Controls | 33 | 25 | 56.91±17.08 | 43.35±52.76 | 113.03±66.54 | n/a | n/a | 1.68±0.86 |
| Total Patients | 10 | 3 | 55.20±16.85 | 114.34±103.60 | 158.00±65.63 | 42.00±23.12 | 39.00±23.93 | 1.37±0.78 |
| CRSwNP | 5 | 2 | 55.00±19.07 | 92.78±33.74 | 182.00±70.14 | 23.67±20.11 | n/a | 1.69±0.55 |
| CRSwNP +Asthma | 3 | 0 | 55.33±19.86 | 172.90±189.48 | 146.67±55.08 | n/a | 27.33±6.51 | 0.81±0.69 |
| N-ERD | 2 | 1 | 55.50±17.68 | 80.40±72.97 | 115.00±77.78 | 69.50±7.78 | 74.00 | 1.39±1.37 |
| Q2 (PBE<252.5 cells/µL; TSLP ≥3.070-fold difference) | ||||||||
| N | †Sex | Age, Year | IgE, KU/L | PBE | SNOT-22 | FeNO | TSLP | |
| Controls | 6 | 4 | 55.17±15.08 | 52.88±56.24 | 126.67±86.18 | n/a | n/a | 4.83±1.78 |
| Total Patients | 20 | 7 | 54.15±17.70 | 163.76±217.01 | 107.50±68.66 | 39.75±15.54 | 58.75±57.70 | 7.27±5.29 |
| CRSwNP | 10 | 2 | 49.80±19.63 | 69.71±69.77 | 136.00±55.82 | 44.17±14.02 | n/a | 8.62±7.09 |
| CRSwNP +Asthma | 7 | 3 | 58.86±16.97 | 268.00±309.51 | 64.29±51.27 | 36.40±18.74 | 75.00±58.39 | 6.46±2.38 |
| N-ERD | 3 | 2 | 57.67±13.65 | 234.00±220.05 | 113.33±110.60 | 30.00 | 10.00 | 4.65±1.11 |
| Q3 (PBE≥252.5 cells/µL; TSLP ≥3.070-fold difference) | ||||||||
| N | †Sex | Age, Year | IgE, KU/L | PBE | SNOT-22 | FeNO | TSLP | |
| Controls | 0 | n/a | n/a | n/a | n/a | n/a | n/a | n/a |
| Total Patients | 38 | 17 | 56.05±13.13 | 286.26±674.31 | 423.03±209.46 | 46.59±23.28 | 59.71±59.77 | 6.28±3.25 |
| CRSwNP | 20 | 4 | 53.20±13.63 | 177.26±271.92 | 423.25±260.44 | 44.86±20.17 | n/a | 6.09±3.44 |
| CRSwNP +Asthma | 10 | 7 | 58.90±12.82 | 646.28±1266.88 | 390.00±125.08 | 44.20±26.81 | 85.33±79.61 | 6.53±2.32 |
| N-ERD | 8 | 6 | 59.63±12.08 | 140.13±160.51 | 463.75±155.65 | 51.40±28.24 | 40.50±42.10 | 6.45±4.09 |
| Q4 (PBE≥252.5 cells/µL; TSLP <3.070-fold difference) | ||||||||
| N | †Sex | Age, Year | IgE, KU/L | PBE | SNOT-22 | FeNO | TSLP | |
| Controls | 4 | 4 | 63.25±25.15 | 30.73±23.05 | 307.50±26.30 | n/a | n/a | 1.67±0.49 |
| Total Patients | 39 | 15 | 55.05±18.78 | 231.88±212.89 | 576.92±477.57 | 57.32±16.23 | 77.41±69.77 | 1.72±0.71 |
| CRSwNP | 11 | 2 | 59.36±21.61 | 171.66±215.61 | 392.73±128.54 | 47.00±15.35 | 12.00 | 1.49±0.75 |
| CRSwNP +Asthma | 20 | 10 | 54.55±18.46 | 263.19±209.10 | 615.00±527.84 | 65.25±12.39 | 87.06±72.60 | 1.65±0.63 |
| N-ERD | 8 | 3 | 50.38±16.37 | 228.44±233.31 | 735.00±610.11 | 49.67±19.43 | 59.60±62.85 | 2.20±0.71 |
Number of cases (percentage) or mean media ± SD; †Female Sex; CRSwNP: Chronic Rhinosinusitis with Nasal polyposis without asthma; N-ERD: Aspirin exacerbated respiratory disease; PBE: absolute eosinophils count (cells/µL); FeNO: Fraction of exhaled nitric oxide; ppb: parts per billion; n/a: not available.
Table 11.
Sequences of primers used in the qPCR assay.
| Primer | Sequence 5’-3’ | |
|---|---|---|
| TSLP | Forward | CGTAAACTTTGCCGCCTATGA |
| Reverse | TTCTTCATTGCCTGAGTAGCATTTAT | |
| TSLPR | Forward | AAGCGACTGGTCAGA-GGTGACA |
| Reverse | GAGGAGAGACACCATCA-GAAGG | |
| GAPDH | Forward | CTCTGCTCCTCCTGTTCGAC |
| Reverse | ACGACCAAATCCGTTGACTC | |
GAPDH: Glyceraldehyde 3-phosphate dehydrogenase; TSLP: Thymic stromal lymphopoietin; TSLPR: TSLP receptor.
Disclaimer/Publisher’s Note: The statements, opinions and data contained in all publications are solely those of the individual author(s) and contributor(s) and not of MDPI and/or the editor(s). MDPI and/or the editor(s) disclaim responsibility for any injury to people or property resulting from any ideas, methods, instructions or products referred to in the content. |
© 2024 by the authors. Licensee MDPI, Basel, Switzerland. This article is an open access article distributed under the terms and conditions of the Creative Commons Attribution (CC BY) license (http://creativecommons.org/licenses/by/4.0/).
Copyright: This open access article is published under a Creative Commons CC BY 4.0 license, which permit the free download, distribution, and reuse, provided that the author and preprint are cited in any reuse.


