
Submitted:
19 December 2024
Posted:
20 December 2024
You are already at the latest version
Abstract
In experimental research, animal welfare should always be of the highest priority. Currently, physical in-person observations are the standard. This is time consuming, and results are subjective. Video-based machine learning models to monitor experimental pigs provides a continuous and objective observation method for animal misthrive detection. The aim of this study was to develop and validate a pig tracking technology, using video-based data in a machine learning model to analyze posture and activity level of experimental pigs living in single-pig pens. A research prototype was created using a microcomputer and a ceiling mounted camera for live recording based on the obtained images from the experimental facility and a combined model was created based on the Ultralytics YOLOv8n for object detection trained on the obtained images. As a second step, the Lucas-Kanade sparse optical flow technique for movement detection was applied. The resulting model successfully classified whether individual pigs were laying, standing, or walking. The validation test showed an accuracy of 90.66%, precision of 90.91%, recall of 90.66%, and a correlation coefficient of 84.53% compared with observed ground truth. In conclusion, the model demonstrates how machine learning can be used to monitor experimental animals potentially to improve animal welfare.
Keywords:
Machine learning
; monitoring
; pig behavior
; activity tracking
; animal welfare
; animal experiments
; video
; sensing
1. Introduction
Animal welfare in research should always be considered due to ethical, financial, and academic reasons [1,2]. The current standard for observing pigs in experimental research is through in-person observations done by trained animal caretakers, scoring the pig on a list of parameters[3]. The observations are standardized but could still be influenced by subjectivity and experience from the animal caretaker [3,4]. In addition, this only allows observation of the pigs during working hours, when the staff is present, and researchers and veterinarians only have limited access to the observations in real time. Also, in-person observation methods are time-consuming, which limits the possibilities to prioritize care for sicker pigs. Considering these conditions, the practice of animal handling in experimental survival studies could arguably be improved using modern sensor technologies to quickly identify and alert staff in case of misthrive which allows for faster and more effective treatment of the animals [4]. Eventually this will lead to less discomfort and a higher level of animal welfare. Strategies for implication of newer approached to heighten animal welfare is described in the three R’s: replacement, reduction and refinement – principles to minimize and optimize the use of animal in experimental research [5]. An automatic, continuous monitoring system could potentially improve the Refinement principle that defines how current experimental practice could be changed to lower the number and intensity of discomforting events or how to improve the framework and experimental set-up around the animals to improve the animals’ quality of life.
Recent studies on surveillance and welfare of pigs primarily focuses on pigs in the food industry with pigs living in groups in multiple pig pens, typically around seven to fifteen pigs per pen [6,7,8,9]. Examples of methods used are convolutional neural networks-based detector and a correlation filter-based tracker to identify and track individual pigs in multi-pig pens [6] and 3D-video approach to detect the 24-hour activity level [8]. 3D-based analysis can also be used to analyze the behavior of pigs which also includes feeding and drinking habits [10].
Not only the activity level has been a subject of interest in video analysis of pigs. A research group have equipped a farm-house with a Charge-coupled device that detected drinking events and validated the results with sensors on the drinking faucet [11], while another research group have tested human face-based methods to analyze the facial recognition of livestock pigs [12]. Even estimates of the body weights are possible through video analysis as shown in a study report with the use of Structure from Motion (SfM) photogrammetry [13].
The welfare of these pigs can be considered with analyses of their activity level and behavioral patterns using video- or sensor-based data in complex software models. In a recent report, a DeepSORT algoritm including multiple object detection models is used to identify and detect lying, eating and laying of group-housed livestock pigs [14]. Deep-learning-based techniques is also used in a study that combines two machine learning models to improve detection accuracy by taking overexposed pictures and annotations cost for pig data into account [7].
Commonly for all the above-mentioned research is that landrace pigs living in multiple pig pens are the subjects of interests. However, the actual behavior of the pigs could be influenced by other pigs in the pen, since pigs are social animals that adapt and react to their surroundings. By observing pigs that live alone in their pens, these sources of errors can be excluded, and a video-based monitoring system could give even more sophisticated and precise knowledge about behavior of healthy and non-healthy pigs. To the best of our knowledge, this has not previously been done in an animal experiment on Göttingen minipigs living in single-pig pens.
The aim of this study is to develop and validate a new pig tracking technology, using video-based data in a machine learning model to analyze posture and activity level of experimental pigs living in single-pig pens.
2. Materials and Methods
2.1. Experimental Site
The model has been developed using Göttingen minipigs. These are of a domestic pig breed, that is specifically produced for biomedical research due to its unique characteristics with human-like physiology and slow growth reaching around 40 kg when fully grown. The breed allows for more controlled research and easier handling for long-term survival pigs. When the research pigs were subjected to operative procedures, they must be kept in a single pen, but near other pigs, with the possibility for snout contact.
The pigs lived in single pig pens measuring 240x266cm in size with six pens in each room at the research facilities, where trained professionals handled the daily care and management of the pigs. The rooms were automatically lit 12 hours each day from around 6:30 am to 6:30 pm.
2.2. Component Deployment
A camera (USB Camera with Wide-Angle Lens, Marhynchus, China) [15] was mounted using a clamp (Metal Camera Clamp, SMALLRIG Ballhead Clamp, China)[16] over each pen pointing downwards in an angle around 10°. The camera is connected to a Raspberry Pi (Raspberry Pi 4B 4 GB, Raspberry Pi Ltd, England) [17] containing a SD-card (SanDisk Extreme 128 GB). The UML deployment diagram is shown in Figure A1 (appendix A).
2.3. Data Collection Platform
A video-based sensor and AI platform named Pigspies was developed to support real time continuously data capture across six pig pens. A Raspberry Pi Model 4 was selected with a USB video camera, ceiling mounted with a special metal camera clamp [16]. A software daemon service for running on Pigspies devices was developed using Python. This included using a video-based object detection YOLO-model in combination with a context-aware recording software: Recordings would start when light was detected and would end when lights were off.
The Pigspies software was developed to run in two modes, data collection for training of the YOLO model, and real-time for life monitoring. In data collection mode, a folder structure for each day of recording and the wide-angle lens (110°) of the camera was fully utilized to maximize information capture from the pig pen. The video capture framerate was 25 fps. In real time, the framerate was reduced to 1 fps to allow the YOLO-model to run in real time.
2.4. Activity Monitoring Capability
The activity tracking model was developed using two main algorithms to categorize the state of the pigs. Firstly, the annotation process started using our trained Ultralytics YOLOv8n [18], a model renowned for its rapid processing and high accuracy in object detection. The YOLOv8n, known as a ”nano” model, was specifically tailored for edge devices such as the Raspberry Pi 4B [17]. The model identifies whether the pig is laying or standing.
Secondarily, as the next sequential step, in case the pig was identified as standing, the Lucas-Kanade sparse optical flow technique distinguished whether the pig was standing still or in movement. Combined, the two algorithms categorized the pig in three different states, laying, standing, or walking, coded as levels 1, 2 and 3, respectively. Figure 1
2.4.1. Pig posture recognition
Roboflow [19] software was used for the annotation process. Different annotation classes were selected for the model to identify: “Pig-laying”, “Pig-standing” and “Keeper”. “Keeper” class is used to identify human presence in the pen. The pig’s activity is influenced by humas interactions during feeding, training, examinations, or routine maintenance of the pen. “Keeper” recognition also allows for picture exclusion when humans are present to protect personal data. An example of “Keeper” recognition can be found in Figure A2 (appendix A). Figure 2
Following the annotation, the training phase was done in Google Colab [20] using an Ultralytics Jupyter notebook [21] Roboflow API was used to fetch the annotated data and the model was trained on the dataset in Ultralytics YOLO framework. The result of the extensive training process is a PyTorch model capable of identifying and classifying categories.
2.4.2. Movement Detection
Lucas-Kanade sparse optical flow algorithm from the OpenCV library [22] was used to track pig movements within a bounding box. This method allows to focus specifically on the pig’s activities reducing the influence of other objects or animals in the pen. The bounding boxes isolate the pig from the background and other objects, ensuring that the movement calculations are specific to the pig.
2.5. Framerates
The possibility to analyze the video in real-time was examined. Examination upon whether this change in analysis method is feasible was done using a paired t-test in R studio[23]. The test compared the analysis results from two models – the original 25 fps model and a newer model that analyzed 1 fps.
For the 1 fps model, distance thresholds were adjusted to maintain accurate categorization, ensuring that significant movements were still detected and correctly classified. This allows for precise activity state detection even with the reduced frame rate, ensuring that the model correctly interprets standing or walking behaviors based on the accumulated distance traveled per second.
3. Results
Our major findings consist of 1) Model performance, 2) Training metrics, 3) Validation, 4) Longitudinal activity data and 5) Posture recognition:
3.1. Model Performance
To illustrate the effectiveness of the training, the following confusion matrix provides a detailed view of the model’s performance.
In Figure 3, the matrix displays a comparison between the true labels (horizontal axis) and the predicted labels (vertical axis). Each cell shows the count of predictions for each specific true-predicted label pair. The diagonal cells represent correct classifications, highlighting the model’s accuracy, while the off-diagonal cells reveal instances of misclassification. The model achieves an overall precision of 93%.
3.2. Training Metrics
Figure 4 represents training and validation metrics for the Pigspies object detection model. The metrics are described in Table 1:
The graphs in Figure 4 illustrate how the model’s performance changes over the course of 40 epochs, where the epoch is understood as the number of passes the dataset is run in the algorithm:
The training metrics illustrate the model’s performance progression over time in terms of accuracy, precision, and robustness in detecting and classifying objects in images. Declining values in the box, classification, and distribution focal loss metrics suggest that the model is improving its ability to accurately locate and label objects. At the same time, rising precision, recall, and mAP metrics indicate effective reduction of false positives and false negatives, enhancing the model's reliability.
3.3. System Validation
The system categorized pig movements using the numbers 1, 2, and 3, which correspond to laying, standing, and walking, respectively. For validation, these same numerical values were used in a manual posture registration via a dedicated validation script. This approach ensured that human inputs align precisely with the model’s output categories, allowing for a straightforward comparison to verify the model’s categorization accuracy.
3.3.1. Validation Results
To assess the accuracy and reliability of the model, a comparison was conducted between the model’s predictions and human observations. From the validation process, the followings results were obtained:
The confusion matrix in Figure 5 presents the combined results of the model’s predictions against human observations, considered the ground truth, across all three categories. It details the counts of true positives, false positives, false negatives, and true negatives for each category. As shown in Figure 5 key performance metrics are an accuracy of 90.66%, precision of 90.91%, recall of 90.66%, and a correlation coefficient of 84.53%.
3.4. Activity Levels
In Figure 6, all data from seven pigs have been analyzed and the hourly averages of the activity level have been calculated. These are compared to the certain pig’s own average value based of all measured activity independent of day, timepoint or health status. This is done to surpass inter-pig variation in the baseline values to make comparisons more intuitive.
The figure shows distinct peaks throughout the day, with increases in activity around early morning and mid-afternoon, followed by declines in activity during late morning and evening.
3.5. Comparing the 25 fps with a 1 fps algorithm
A comparative analysis of the system’s performance at both 1 fps and 25 fps was conducted using video from 60 hours of recording. This involved downscaling the original 25 fps data to 1 fps and comparing the two frame rates through statistical tests.
The paired t-test revealed a statistically significant mean difference of 2.1% between the two frame rates (mean difference of 0.021 [CI-95%: 0.0188; 0.0242], p < 0.001). Additionally, the binomial test (Table 2) indicated significant differences in the proportions of observed activity levels across frame rates, with p-values below .001.
3.6. Misclassifications
3.7. Posture Recognition
Figure 9 shows examples of the model detecting all three classes with screenshots also including the bounding box around the pig and the confidence level on a scale from 0 to 1 above the bounding box upper border.
4. Discussion
4.1. Main Outcome
This study developed a monitoring model utilizing a camera setup mounted above each pen. The camera feeds were processed through a Raspberry Pi system that classified pig postures (laying, standing, or walking) with validation from human observation.
The model’s precision in object detection was evaluated over 40 training epochs, using the box, classification, and distribution focal losses metrics. Overall, the training metrics demonstrate the model’s increasing proficiency in object detection, confirming its readiness for practical deployment where consistent and accurate object recognition is essential. The 25-fps model achieved a strong overall performance, with a 93% precision rate, with the main challenges centered on distinguishing the background from objects across all classes. The precision rate on 93% is considered sufficient and corresponds to results from similar articles with comparable, but different still methods of pig posture recognition[7,8].
4.2. Training and Accuracy
Key performance metrics of the main 25 fps model include an accuracy of 90.66%, a precision of 90.91%, a recall of 90.66%, and a correlation coefficient of 84.53%. While the system’s accuracy of 90.66% is slightly lower compared to similar systems [7], it still demonstrates strong performance and reliability. The difference between the observed ground truth and the model’s results could arguably be attributed to the observer not always reacting with the same speed and proficiency as the algorithm, that is observer bias caused by human inadequacies. The difference in accuracy could also be influenced by the specific dataset used for training, the complexity of the environmental conditions, and the model architecture Despite the lower accuracy, the system’s results indicate that it is an acceptable tool for monitoring pig activities.
4.3. Validation of the Monitoring System for 1 fps
Initially, the system was validated at 25 fps, which provided high detail but did not reflect the typical 1 fps operational rate. Statistical validation using paired t-tests and binomial tests revealed only a small mean difference of 2.1% [CI-95%: 0.0188; 0.0242], p < 0.001), suggesting acceptable performance variance between frame rates. These findings confirm a statistically significant difference in algorithm performance between 1 fps and 25 fps. However, the practical impact is minimal, with only minor differences in data accuracy and reliability across frame rates, indicating that 1 fps is sufficient for operational use without compromising data integrity.
Future work with testing at 1 fps would offer a more realistic assessment, reinforcing the system’s effectiveness in real-world deployments where accurate behavior monitoring is crucial.
4.4. Bounding Boxes
In this model, a bounding box around the pig was used to calculate movement with the Lucas-Kanade sparse optical flow algorithm. Unlike analyzing the entire pen, this method ensures that the activity data specifically reflects the pig’s movements, minimizing the impact of other objects or animals and enhancing data reliability and validity. Validation, however, showed that the system has poor performance, when distinguishing between standing and walking as seen in Figure 5. This difficulty may result from threshold settings or the need for frame-by-frame human validation to establish a more accurate ground truth. While the bounding box approach allows for precise monitoring, future studies could explore integrating broader pen analysis for a more comprehensive understanding of pig activity and behavior.
4.5. Activity Patterns
Preliminary analysis from data collected during the development process could give more insights towards the activity patterns of the individual pigs, which can be used in the future to map out how their behavior is influenced by misthrive or discomfort to detect this in future studies. As seen in figure 6, all seven pigs that were included in long-term data collection showed similar trends, when looking at their hourly activity average during the day. Only complete days of recording were included since the initial days of recording presented us with obstacles. These include raspberry pi breakdowns, video storage problems and non-reliant pig survival. All pigs show increased activity level during two time periods from 7 a.m to 9 a.m and 13 p.m to 15 p.m. both for working days and weekend days. These trends correspond to several other studies measuring activity patterns of pigs in different ways[24,25].
It is important to note several differences between this study and the referenced studies that could influence the observed activity patterns. Firstly, the referenced studies use landrace pigs, while this study uses Göttingen minipigs. Additionally, the pigs in the referenced studies were kept together in one pen, while these pigs live in single-pig pens. The social dynamics of pigs being together versus individually could affect their activity levels. However, legislations and ethics command snout contact between pigs, therefore no animal live isolated in rooms. Furthermore, the timing of when the keepers feed the pigs is not necessarily comparable, where in this study the second feeding is at around 12:15 pm, which can be seen on the figure as elevation in activity level of all pigs at this timepoint. This suggests a benefit to exclude data if humans are present in future development of the model.
4.6. Misclassification of Objects
The misclassifications mentioned in the Results can be attributed to limitations in the training dataset and inherent characteristics of the YOLOv8n model. Specifically, because the dataset lacks a diverse representation of environmental contexts without pigs and includes insufficient examples of potential confounding objects, the model may struggle to accurately differentiate between pigs and objects with similar appearances.
- Enhanced Data Annotation: Expanding the training dataset to include more varied environmental images, particularly those featuring commonly misidentified objects, could enable the model to better distinguish these from the target category.
- Model Retuning: Adjusting the YOLO model’s parameters or refining it on a more targeted subset of data may improve its discrimination capabilities.
- Post-processing Algorithms: Integrating additional algorithms to review detected objects based on movement patterns and environmental context could help reduce false positives.
- Confidence Threshold: Increasing the confidence threshold of the YOLO model may prevent misclassification, such as mistaking a wall for a pig, by requiring a higher certainty for detections to be considered valid.
4.7. Challenges with the Raspberry Pi Platform
The Raspberry Pi platform was selected for the monitoring system due to their ease of setup, cost efficiency, and the straightforward process of duplicating system images across multiple devices. This choice enabled rapid deployment and scalability of the monitoring system. However, challenges with several Raspberry Pi devices shutting down unexpectedly were encountered. To address the problem several strategies is proposed for future work:
- Smart Plugs for Easy Management: By using smart plugs, remote management becomes easier, and the Raspberry Pi devices can be restarted remotely or automatically. Keepers and researchers will no longer need to manually reset the gadgets as a result.
- Cooling Solutions: It is advisable to equip the Raspberry Pi devices with fans to solve any potential overheating concerns that might be causing the unplanned shutdowns. Device longevity and stability can be improved with adequate cooling.
- Regular Restart Scheduling: Which will generally help clean up memory leaks and hanging processes. Such restart should be scheduled frequently, with a frequency of 1 to 24 times a day.
4.8. Future Development
4.8.1. Accounting Keeper Presence
To enhance the accuracy of activity monitoring, the system could be evolved to consider the presence of an animal caretaker. Thereby, stratification of data with and without human present is possible. Since the object detection model can classify if an object is an animal caretaker, future development should include integrating this capability to adjust activity data analysis. Specifically, the system should differentiate between pig activities when an animal caretaker is present and when pigs are alone. This feature is also important to protect personal data. Adjustments could involve:
- Activity Filtering: Implementing a filtering mechanism to exclude or separately annotate activity data collected while an animal caretaker is detected, ensuring that the pigs’ natural behavior is accurately represented.
- Behavioral Adjustments: Adjusting behavioral algorithms to account for the presence of keepers, which may temporarily alter pigs’ activity patterns, thus providing a more accurate analysis of their natural behavior.
4.8.2. 24-Hour Monitoring
Extending the monitoring to cover a full 24-hour period could provide better activity data and a more comprehensive understanding of the pigs’ behavior. Utilizing night vision and other types of heat sensitive cameras could arguably facilitate effective monitoring during nighttime. This extension would ensure continuous data collection, capturing potential abnormal nocturnal activity patterns that are currently missed due to the limited monitoring hours.
4.8.3. Behavioral Analysis Integration
The developed system could be used to exemplify how observations in animal experiments should be done in the future, ultimately leading to earlier detection of misthrive, allowing for timely interventions, and reducing pain and suffering in experimental animals. Integrating advanced behavioral analysis algorithms could provide deeper insights into the pigs’ health and wellbeing. This could include adding more sensors, such as temperature sensors to monitor the pig’s body temperature, water intake sensors to measure the amount of water the pig drinks, and weight sensors to track the pig’s weight. Additionally, incorporating feces assessment to monitor the pig’s digestive health, sensors to measure the amount of urine, and indicators to detect if the pig is sedated could arguably improve the data visualization and overall health monitoring.
4.8.4. Real Time Deployment
Real time deployment with live analysis of the 25-fps video that was retrieved from the camera to the Raspberry Pi, the system faced constraints due to the device’s limited processing power, which could not efficiently handle data analysis at 25 fps. To accommodate this, analysis was changed to be done at 1 fps, which would be a feasible solution to this problem. While this is a reasonable and practical solution to the problem, further optimizations of the algorithms should be considered. Other solutions to this problem could be to use more expensive hardware with stronger processing power. Another solution could be to send the pictures to a server for processing on a more powerful computer.
5. Conclusions
A machine-learning-based software system to monitor and automatically detect the posture and activity levels of pigs in experimental research facilities was designed, tested, and validated. The software reliably identified key behavioral states (laying, standing, and walking) using a combination of YOLOv8n object detection and the Lucas-Kanade optical flow algorithm.
Validation of the system demonstrated an accuracy of 90.66%, a precision of 90.91%, a recall of 90.66%, and a correlation coefficient of 84.53% when processing video at 25 frames per second. The system’s operational frame rate of 1 fps showed a minor mean difference of 2.1% in performance compared to 25 fps, indicating consistent functionality. This change in operational scheme require less computer power leading to increased reliability. While the YOLOv8n model performed well, cases of object misclassification revealed areas for future improvement, including refining object detection algorithms and enhancing activity tracking accuracy when distinguishing standing and walking. Incorporating additional data sources could also enable more comprehensive behavioral insights.
In conclusion, the present study provides valuable contributions to automated pig monitoring using non-invasive machine learning technologies. Further research and engineering are needed to enhance the robustness of the data collection platform and expand its machine learning-based analytical capabilities to include more fine-grained behavioral assessments.
Author Contributions
Conceptualization: F.D., S.R.W, M.G.W., A.K.K.; methodology: F.D., L.H.S., F.H.; software: S.R.W., L.H.S., F.H.; validation: F.D., L.H.S., F.H.; formal analysis: F.D., L.H.S., F.H., S.R.W.; investigation: F.D., L.H.S., F.H., S.R.W.; resources: F.D., S.R.W.; data curation: F.D, L.H.S., F.H.; writing—original draft preparation: F.D., L.H.S., F.H.; writing—review and editing: M.G.W, A.K.K., C.F., C.M., S.R.W.; visualization: F.D., L.H.S., F.H.; supervision: M.G.W., A.K.K., and S.R.W.; project administration: A.K.K., M.G.W., C.F., C.M., S.R.W.; funding acquisition: F.D., A.K.K., C.F., C.M., and S.R.W. All authors have read and agreed to the published version of the manuscript.
Funding. This research conducted with funding from The A.P. Moeller Foundation for Medical Research, grant number L-2023-00228.
Institutional Review Board Statement
The model is developed in relation to an animal experiment with accepted animal experiment license (2023-15-0201-01352)[26].
Data Availability Statement
The data presented in this study are available on request from the corresponding author.
Acknowledgments
An immense thank you and acknowledgment goes to the staff at the research facilities at the Department of Clinical Medicine, Aarhus University for daily care and management of the pigs, as well as allowance and effective co-operation in setting up and testing the monitoring equipment.
Conflicts of Interest
The authors declare no conflict of interest.
Appendix A
Figure A1.
Figure A1. The UML deployment diagram illustrates the PigSpies system. It visualized the system's hardware and software components.
Figure A1.
Figure A1. The UML deployment diagram illustrates the PigSpies system. It visualized the system's hardware and software components.

Figure A2.
Figure A2. Example of the model’s detection of “Keeper” being a human with the picture frame. This can be used to protect personal data by excluding pictures with a human presence, but also to refine the data from the pig activity, since the pigs will be affected by human presence.
Figure A2.
Figure A2. Example of the model’s detection of “Keeper” being a human with the picture frame. This can be used to protect personal data by excluding pictures with a human presence, but also to refine the data from the pig activity, since the pigs will be affected by human presence.

References
- Poole, T. , Happy animals make good science. Laboratory animals : journal of the Laboratory Animal Science Association., 1997. 31(2): p. 116-124.
- Martínez-Miró, S.; Tecles, F.; Ramón, M.; Escribano, D.; Hernández, F.; Madrid, J.; Orengo, J.; Martínez-Subiela, S.; Manteca, X.; Cerón, J.J. Causes, consequences and biomarkers of stress in swine: an update. BMC Veter. Res. 2016, 12, 171. [Google Scholar] [CrossRef]
- Lohmann, S.; Eijken, M.; Møldrup, U.; Møller, B.K.; Hunter, J.; Moers, C.; Ploeg, R.J.; Baan, C.C.; Jespersen, B.; Keller, A.K. A Pilot Study of Postoperative Animal Welfare as a Guidance Tool in the Development of a Kidney Autotransplantation Model With Extended Warm Ischemia. Transplant. Direct 2019, 5, e495. [Google Scholar] [CrossRef] [PubMed]
- Tuyttens, F.; de Graaf, S.; Heerkens, J.; Jacobs, L.; Nalon, E.; Ott, S.; Stadig, L.; Van Laer, E.; Ampe, B. Observer bias in animal behaviour research: can we believe what we score, if we score what we believe? Anim. Behav. 2014, 90, 273–280. [Google Scholar] [CrossRef]
- Russell, W. and R. Burch, The Principles of Humane Experimental Technique. Medical Journal of Australia, 1960. 1(13): p. 500-500.
- Zhang, L.; Gray, H.; Ye, X.; Collins, L.; Allinson, N. Automatic Individual Pig Detection and Tracking in Pig Farms. Sensors 2019, 19, 1188. [Google Scholar] [CrossRef] [PubMed]
- Ahn, H.; Son, S.; Kim, H.; Lee, S.; Chung, Y.; Park, D. EnsemblePigDet: Ensemble Deep Learning for Accurate Pig Detection. Appl. Sci. 2021, 11, 5577. [Google Scholar] [CrossRef]
- Kim, J.; Chung, Y.; Choi, Y.; Sa, J.; Kim, H.; Chung, Y.; Park, D.; Kim, H. Depth-Based Detection of Standing-Pigs in Moving Noise Environments. Sensors 2017, 17, 2757. [Google Scholar] [CrossRef] [PubMed]
- T. Psota, E. T. Psota, E., et al., Long-Term Tracking of Group-Housed Livestock Using Keypoint Detection and MAP Estimation for Individual Animal Identification. Sensors, 2020. 20(13): p. 3670.
- Matthews, S.G.; Miller, A.L.; Plötz, T.; Kyriazakis, I. Automated tracking to measure behavioural changes in pigs for health and welfare monitoring. Sci. Rep. 2017, 7, 17582. [Google Scholar] [CrossRef] [PubMed]
- Kashiha, M.; Bahr, C.; Haredasht, S.A.; Ott, S.; Moons, C.P.; Niewold, T.A.; Ödberg, F.O.; Berckmans, D. The automatic monitoring of pigs water use by cameras. Comput. Electron. Agric. 2013, 90, 164–169. [Google Scholar] [CrossRef]
- Hansen, M.F.; Smith, M.L.; Smith, L.N.; Salter, M.G.; Baxter, E.M.; Farish, M.; Grieve, B. Towards on-farm pig face recognition using convolutional neural networks. Comput. Ind. 2018, 98, 145–152. [Google Scholar] [CrossRef]
- Pezzuolo, A.; Milani, V.; Zhu, D.; Guo, H.; Guercini, S.; Marinello, F. On-Barn Pig Weight Estimation Based on Body Measurements by Structure-from-Motion (SfM). Sensors 2018, 18, 3603. [Google Scholar] [CrossRef]
- Tu, S.; Zeng, Q.; Liang, Y.; Liu, X.; Huang, L.; Weng, S.; Huang, Q. Automated Behavior Recognition and Tracking of Group-Housed Pigs with an Improved DeepSORT Method. Agriculture 2022, 12, 1907. [Google Scholar] [CrossRef]
- Amazon. USB Camera Automatic Webcam Board 3MP Mini USB 2.0 Webcam Board Manual. 2024 [cited 2024 4th of june]; USB Camera]. Available from: https://www.amazon.de/dp/B0BQGXKQ9M/ref=pe_27091401_487027711_TE_SCE_dp_i1.
- Amazon. SMALLRIG Mini Magic Arm with Super Clamp. 2024 [cited 2014 15th november]; Available from: https://www.amazon.de/-/en/1138-CF-SMALLRIG-Ballhead-Clamp-DE0729/dp/B00SIRAYX0.
- Raspberrypi.dk. Raspberry Pi 4 Model B Starter Kit. 2024 [cited 2024 15th november]; Available from: https://raspberrypi.dk/produkt/raspberry-pi-4-model-b-starter-kit-2/?gad_source=1&gbraid=0AAAAADwblR1uPS2WSqIZJg5Mvbmivbv2a&gclid=CjwKCAjw-JG5BhBZEiwAt7JR60rWYQ0QVpkxibxQZx8aFwih7k9C0aSdSLvnPgMMgvSHj7b8EyrfihoCKhQQAvD_BwE.
- Ultralytics.com. Ultralytics, Quickstart. 2023 [cited 2024 15th november]; Available from: https://docs.ultralytics.com/quickstart/.
- Roboflow.com. Roboflow: Computer vision tools for developers and enterprises. 2024 [cited 2024 15th november]; Available from: https://roboflow.com.
- Google.com. Google Colab. 2019 [cited 2024 15th november]; Available from: https://colab.research.google.com/github/roboflow-ai/notebooks/blob/main/notebooks/train-yolov8-object-detection-on-custom-dataset.ipynb#scrollTo=Wjc1ctZykYuf.
- Ultralytics.com. A Guide on How to Use JupyterLab to Train Your YOLO11 Models. 2024 [cited 2024 1/12]; Available from: https://docs.ultralytics.com/integrations/jupyterlab/.
- OpenCV.org. OpenCV - Open Computer Vision Library.. 2024 [cited 2024 15th november]; Available from: https://opencv.org.
- Postit.com. R Studio Desktop. 2024 [cited 2024 9/12]; Available from: https://posit.co/download/rstudio-desktop/.
- Huang, Y.; Xiao, D.; Liu, J.; Liu, Y.; Tan, Z.; Hui, X.; Huang, S. Analysis of pig activity level and body temperature variation based on ear tag data. Comput. Electron. Agric. 2024, 219. [Google Scholar] [CrossRef]
- Costa, A.; Ismayilova, G.; Borgonovo, F.; Viazzi, S.; Berckmans, D.; Guarino, M. Image-processing technique to measure pig activity in response to climatic variation in a pig barn. Anim. Prod. Sci. 2014, 54, 1075–1083. [Google Scholar] [CrossRef]
- Council, D.A.E. and T.D.F. Agency. Animal Experiment Approval. 2024 [cited 2024 1/12]; Available from: https://dyreforsoegstilsynet.fvst.dk/Search/Pages/default.aspx#/.
Figure 1.
Visual representation of algorithm interactions. The YOLO V8n object detection (green) detects a laying (1) or standing (2) pig. The optical flow analysis (blue) distinguishes if a standing pig is walking (3).
Figure 1.
Visual representation of algorithm interactions. The YOLO V8n object detection (green) detects a laying (1) or standing (2) pig. The optical flow analysis (blue) distinguishes if a standing pig is walking (3).
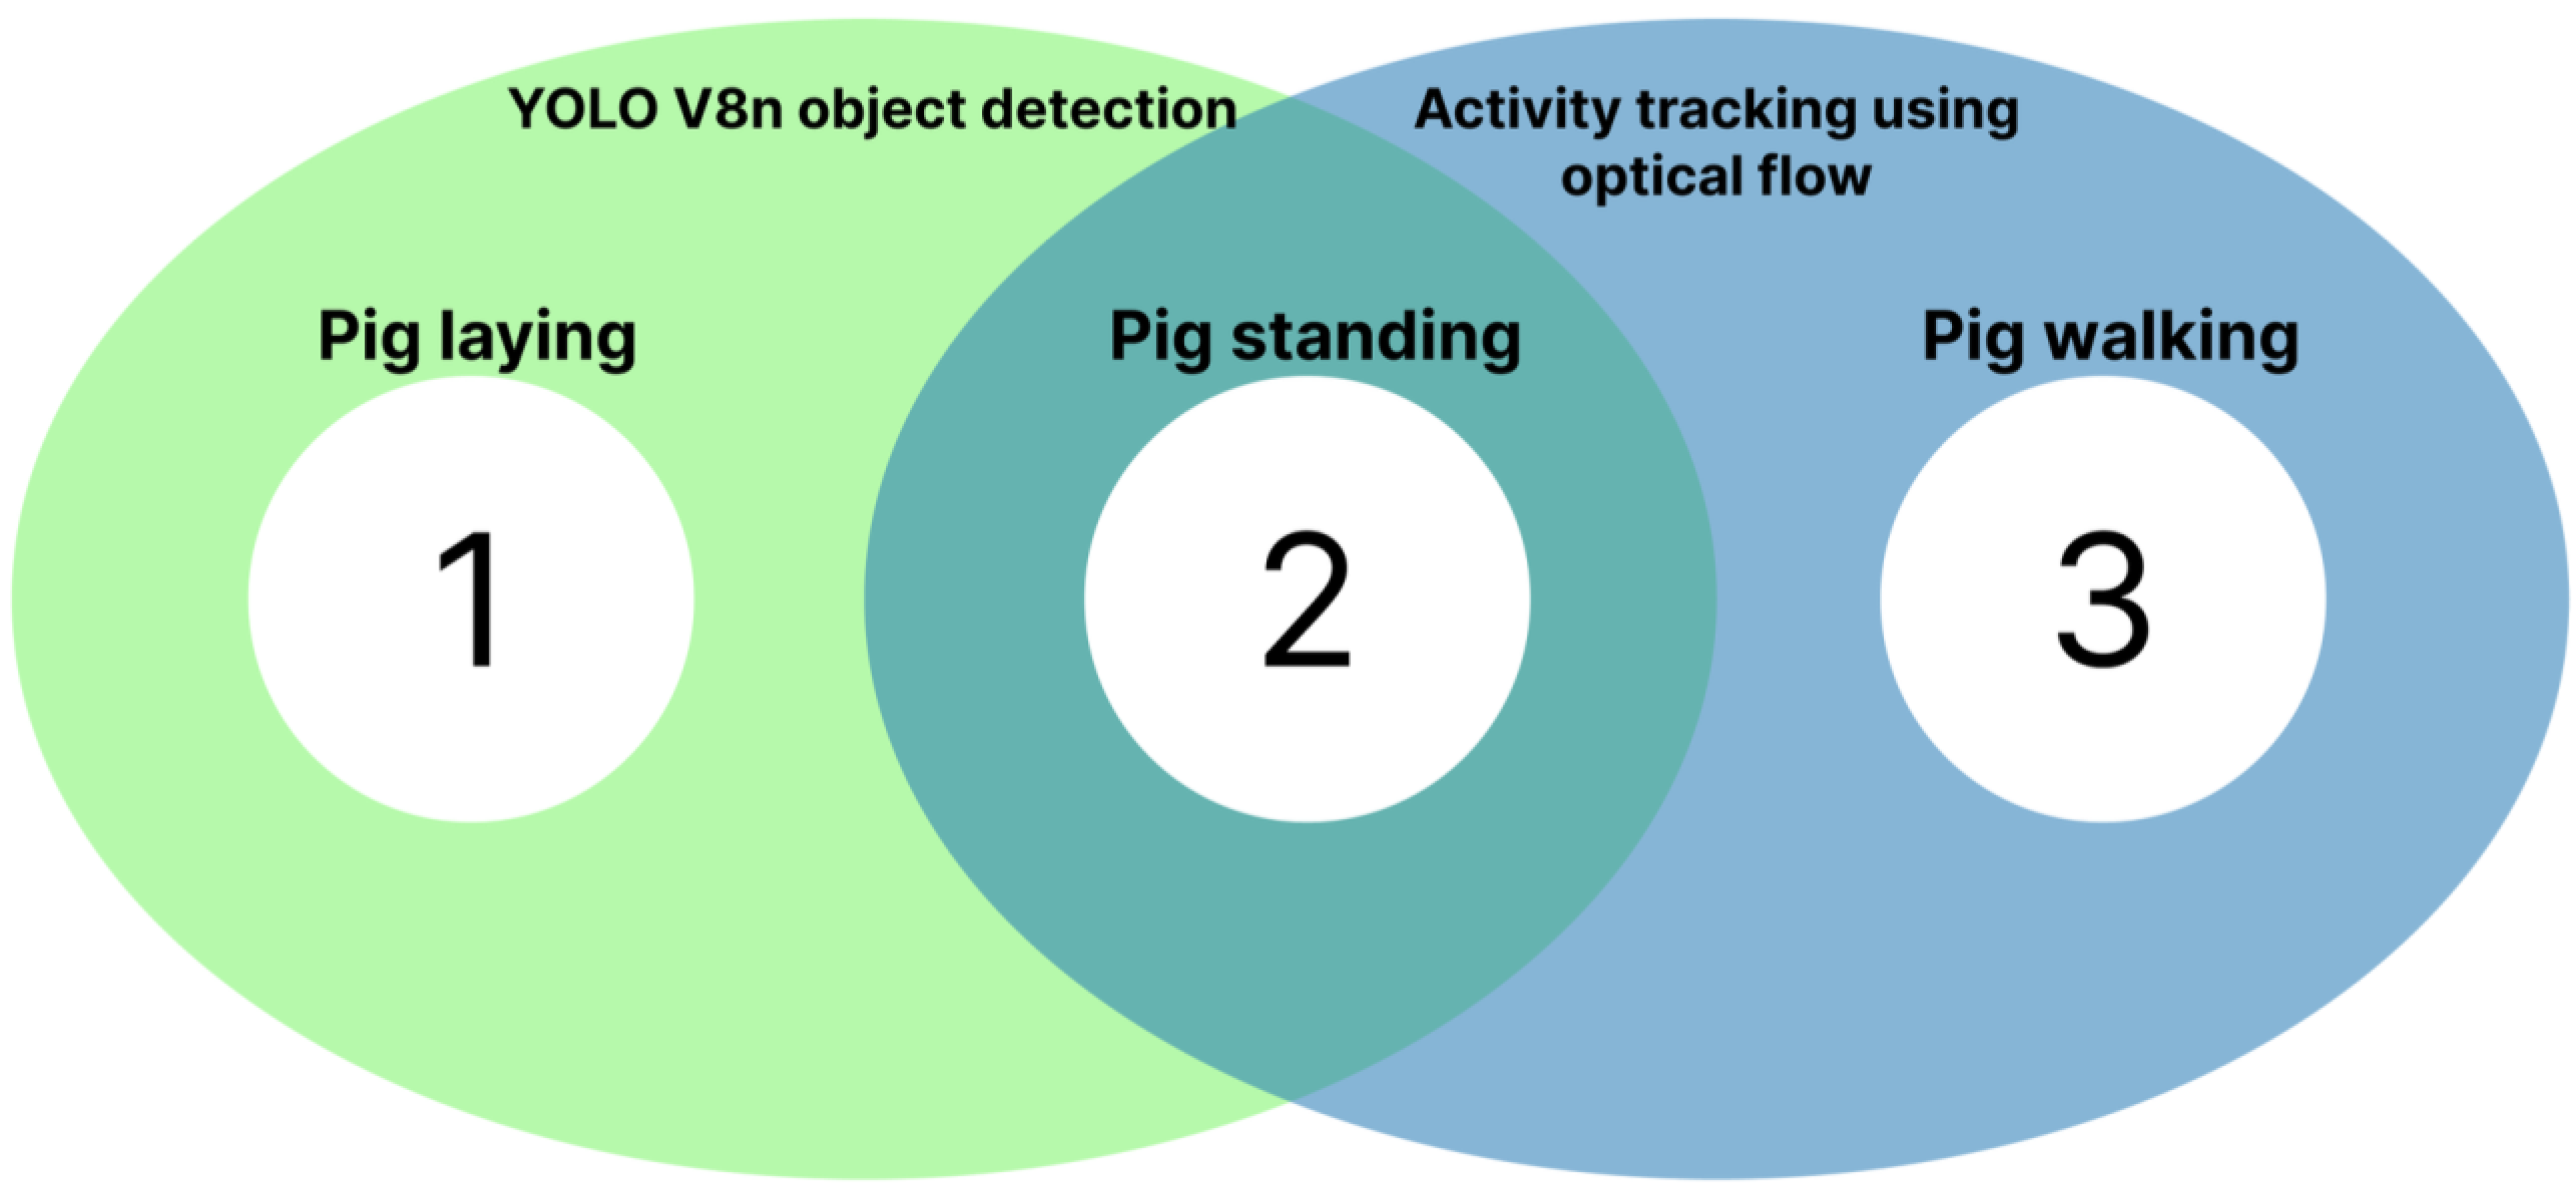
Figure 2.
Roboflow annotation tool interface, used for labeling images of a pig enclosure. The left panel lists annotation classes, including ”Pig-standing,” ”Water-faucets,” and ”feces,” along with their respective counts.
Figure 2.
Roboflow annotation tool interface, used for labeling images of a pig enclosure. The left panel lists annotation classes, including ”Pig-standing,” ”Water-faucets,” and ”feces,” along with their respective counts.
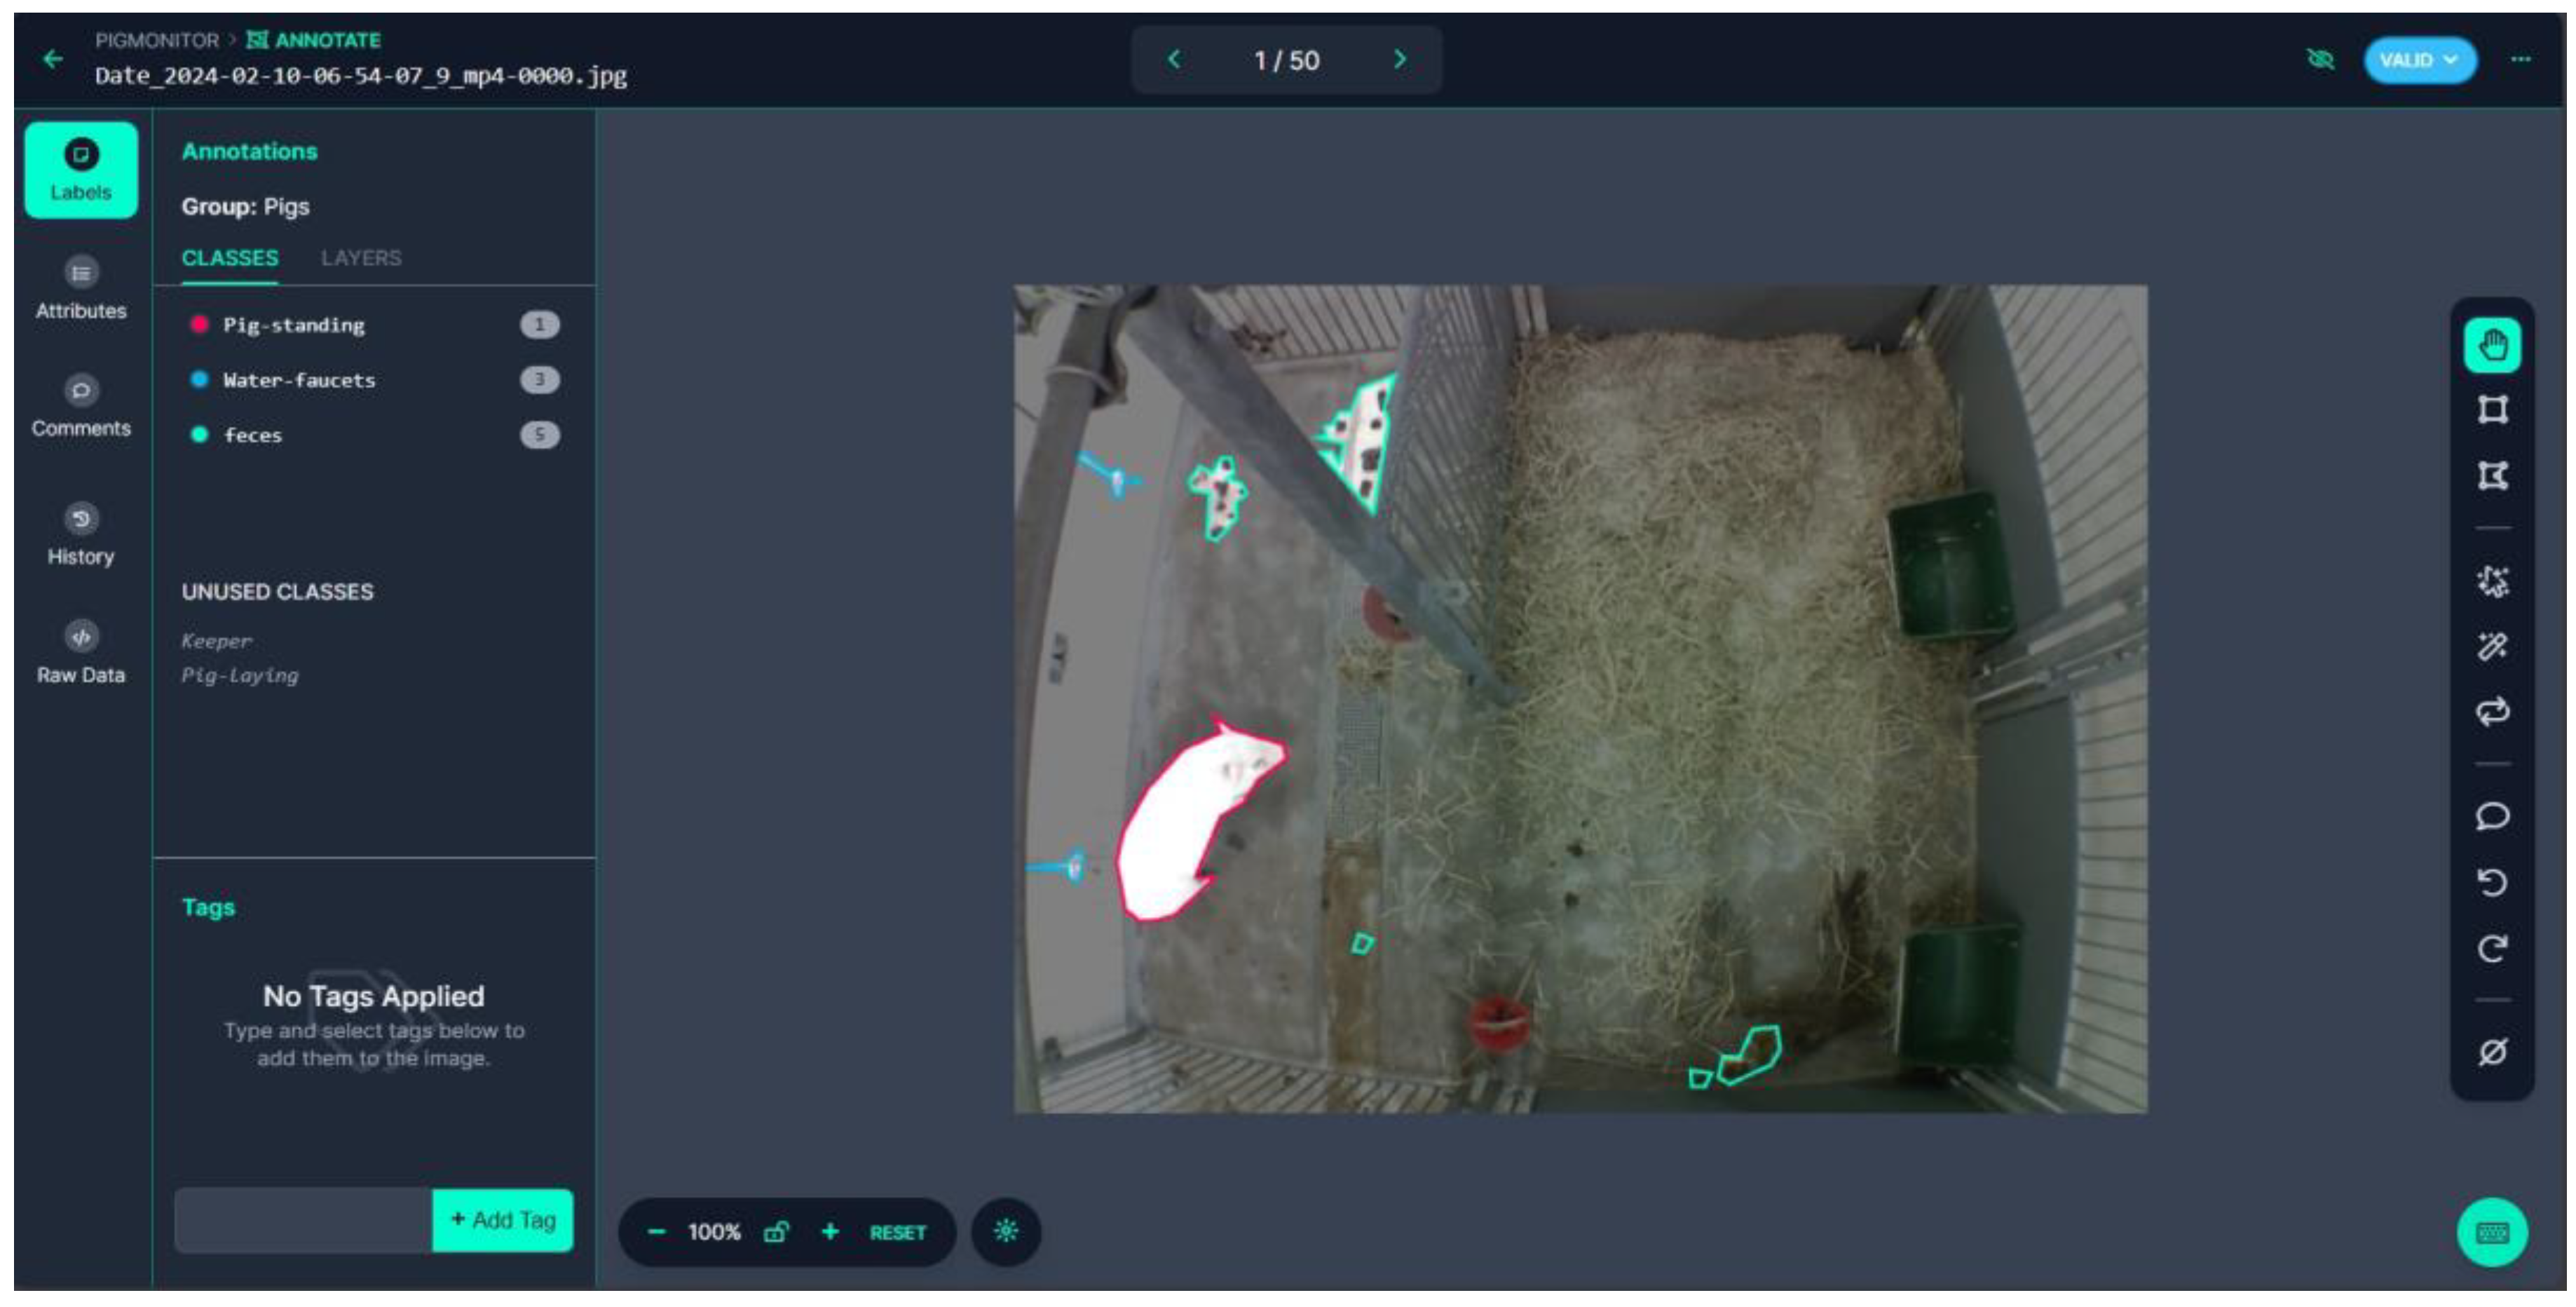
Figure 3.
Confusion matrix of the object detection model trained on pigs. The Y axis represents the predicted class, while the X axis represents the ground truth observed by the research facilitator.
Figure 3.
Confusion matrix of the object detection model trained on pigs. The Y axis represents the predicted class, while the X axis represents the ground truth observed by the research facilitator.
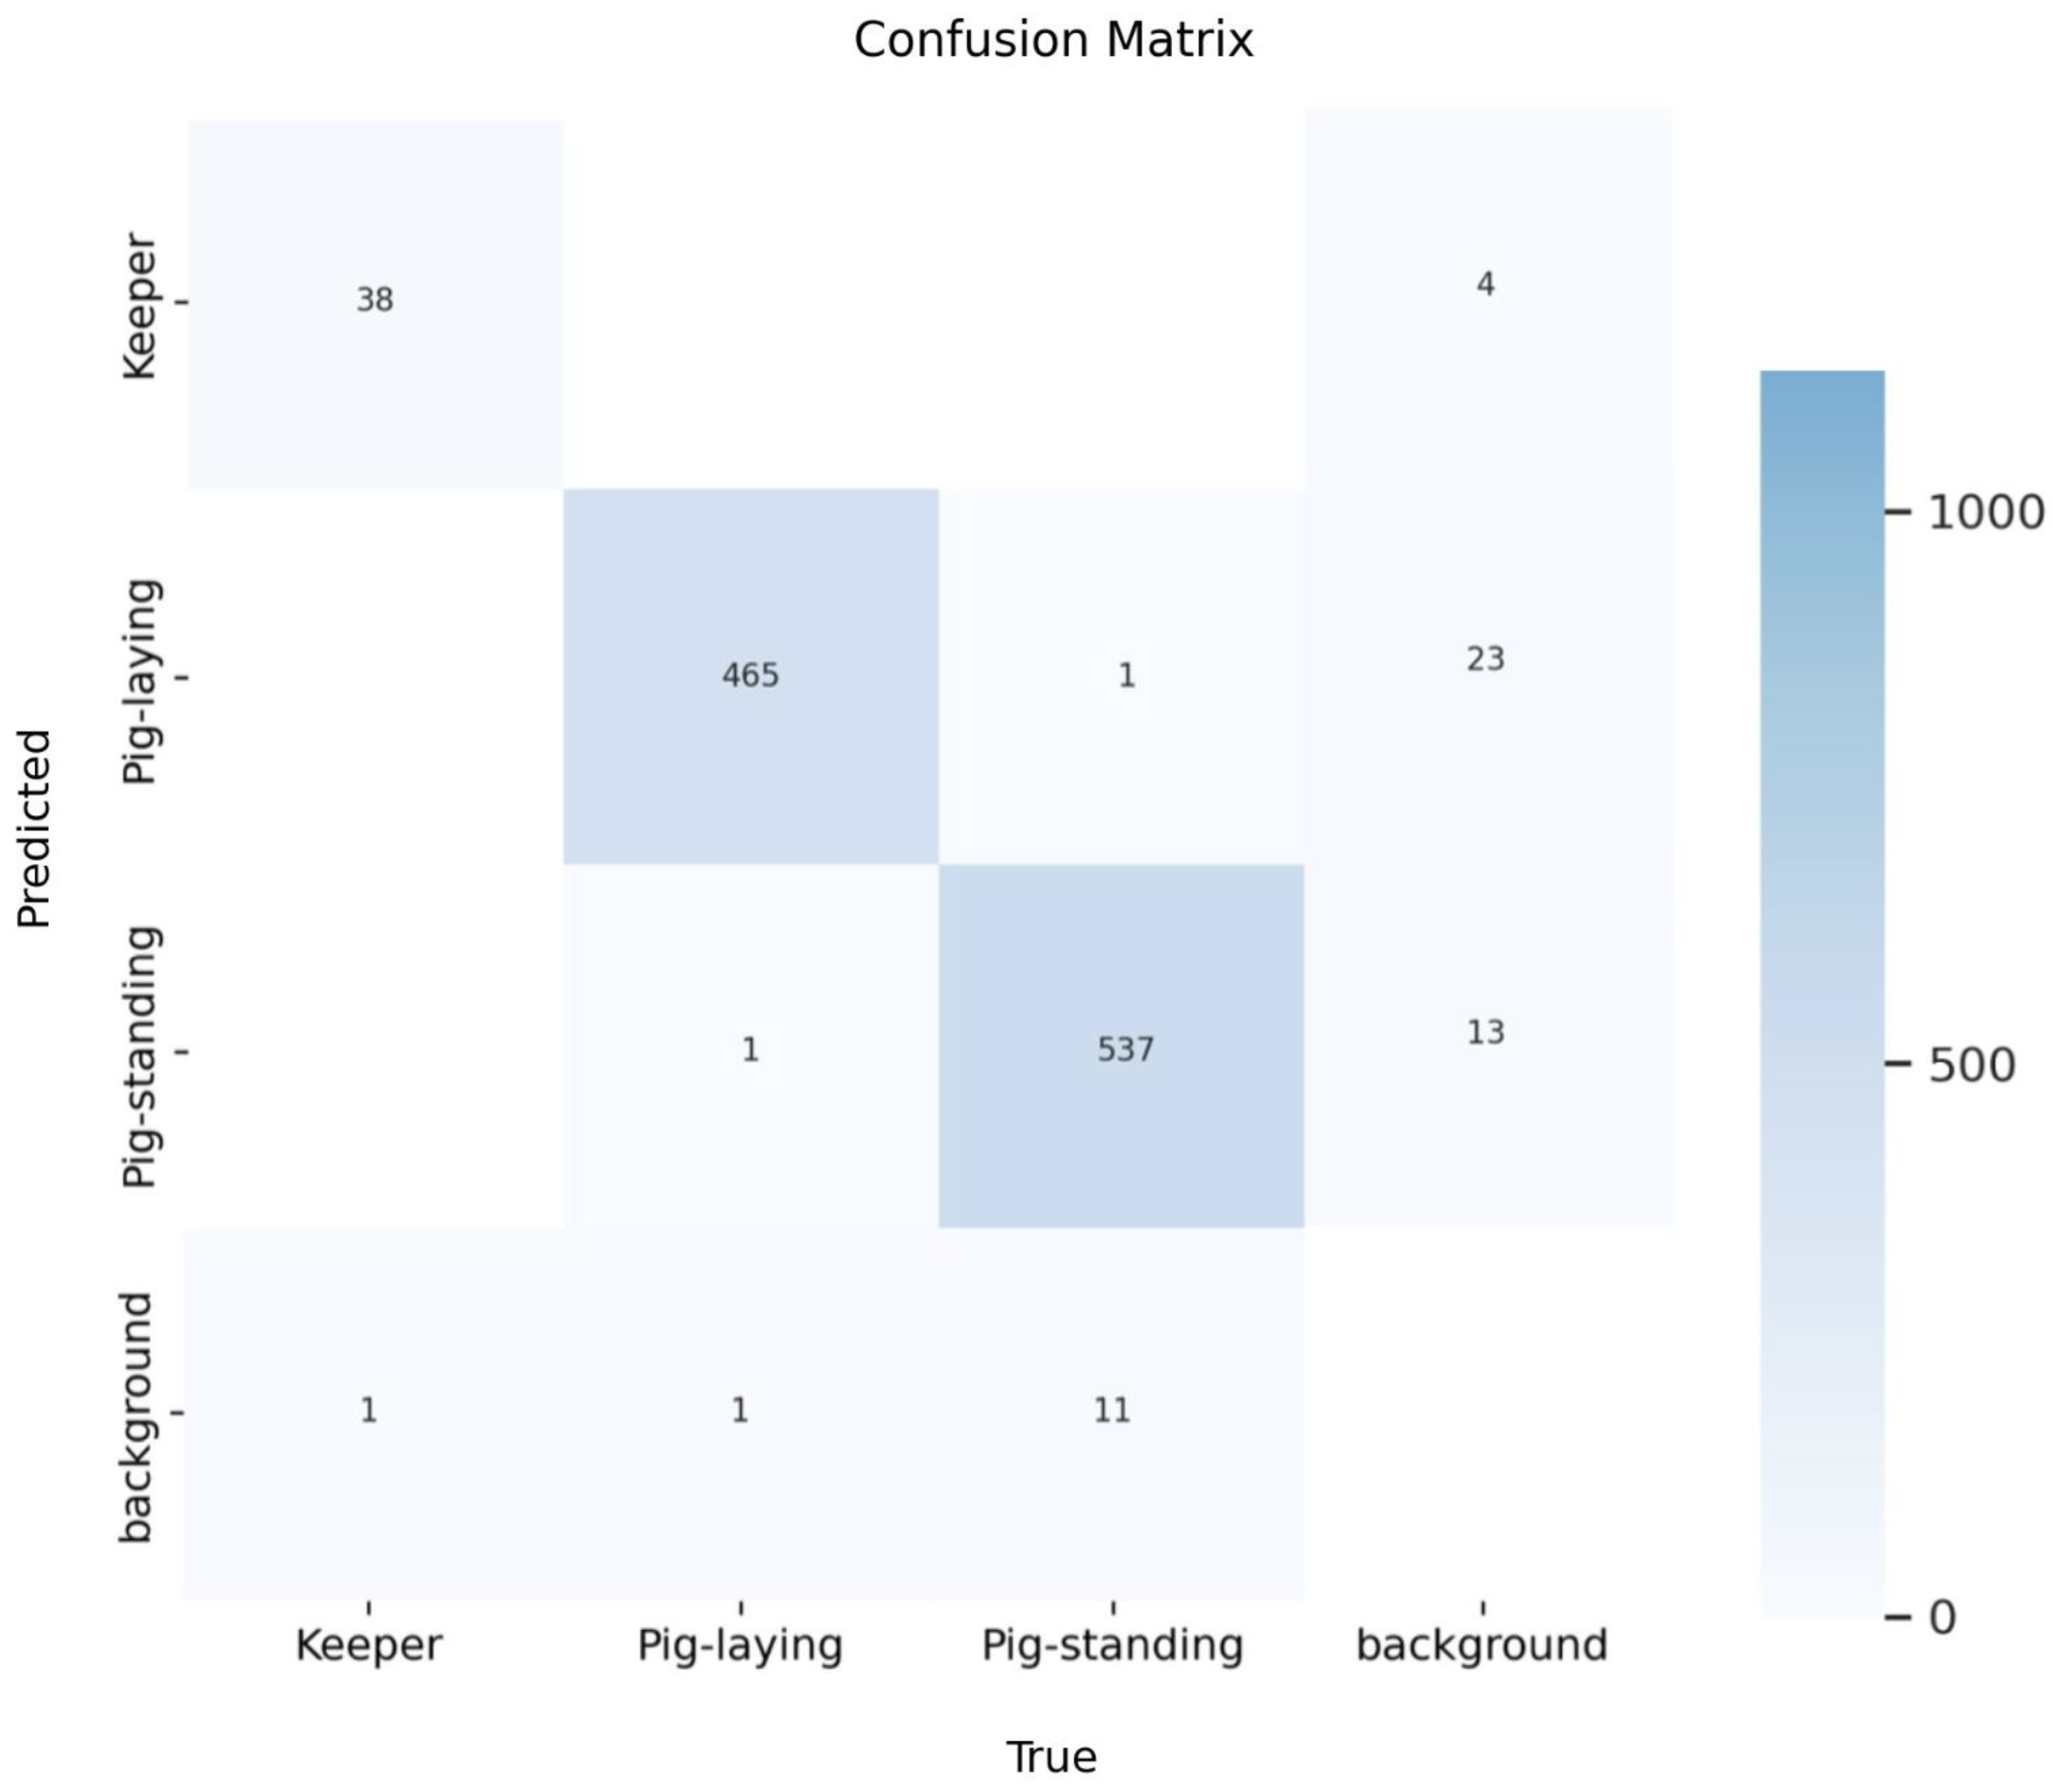
Figure 4.
Performance metrics across 40 epochs for the object detection model, illustrating the progression of training and validation losses (box, class, and distribution focal loss) and effectiveness metrics (precision, recall, mean average precision (mAP) at Intersection over Union (IoU) 50%, and mAP from IoU 50% to 95%). These graphs provide insights into the model’s ability to generalize and improve detection accuracy over time, critical for op-timizing its deployment in real-world scenarios.
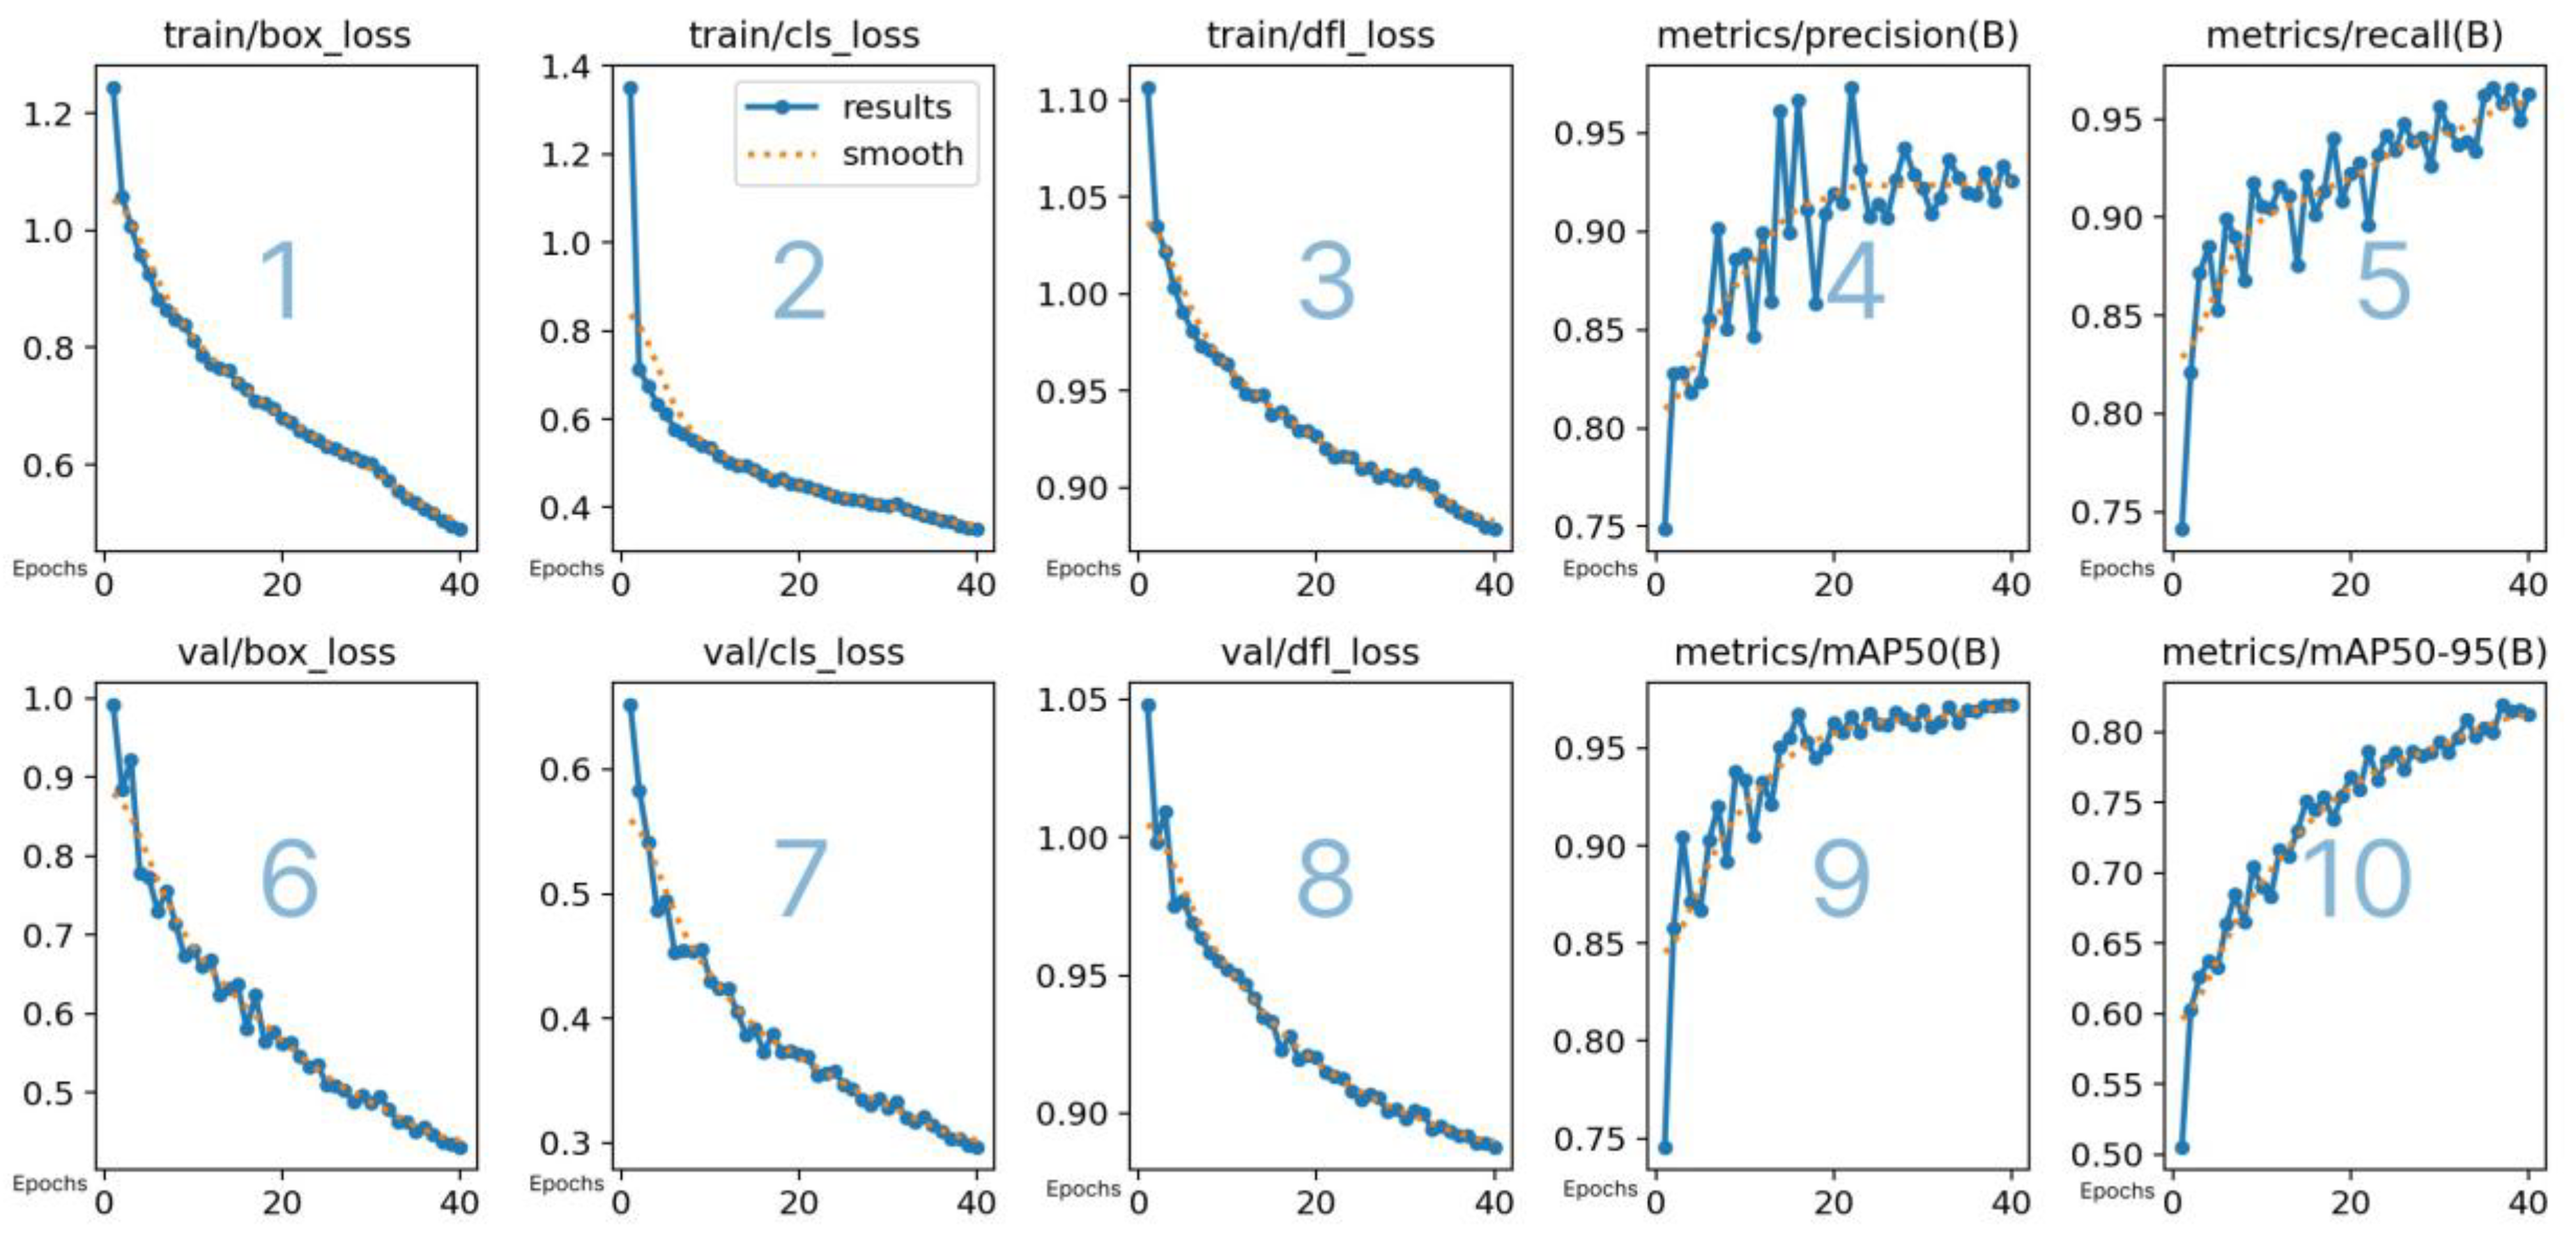
Figure 5.
The combined confusion matrix summarizes the results of this validation effort, visually representing the distribution of true and false predictions across three predefined categories.
Figure 5.
The combined confusion matrix summarizes the results of this validation effort, visually representing the distribution of true and false predictions across three predefined categories.
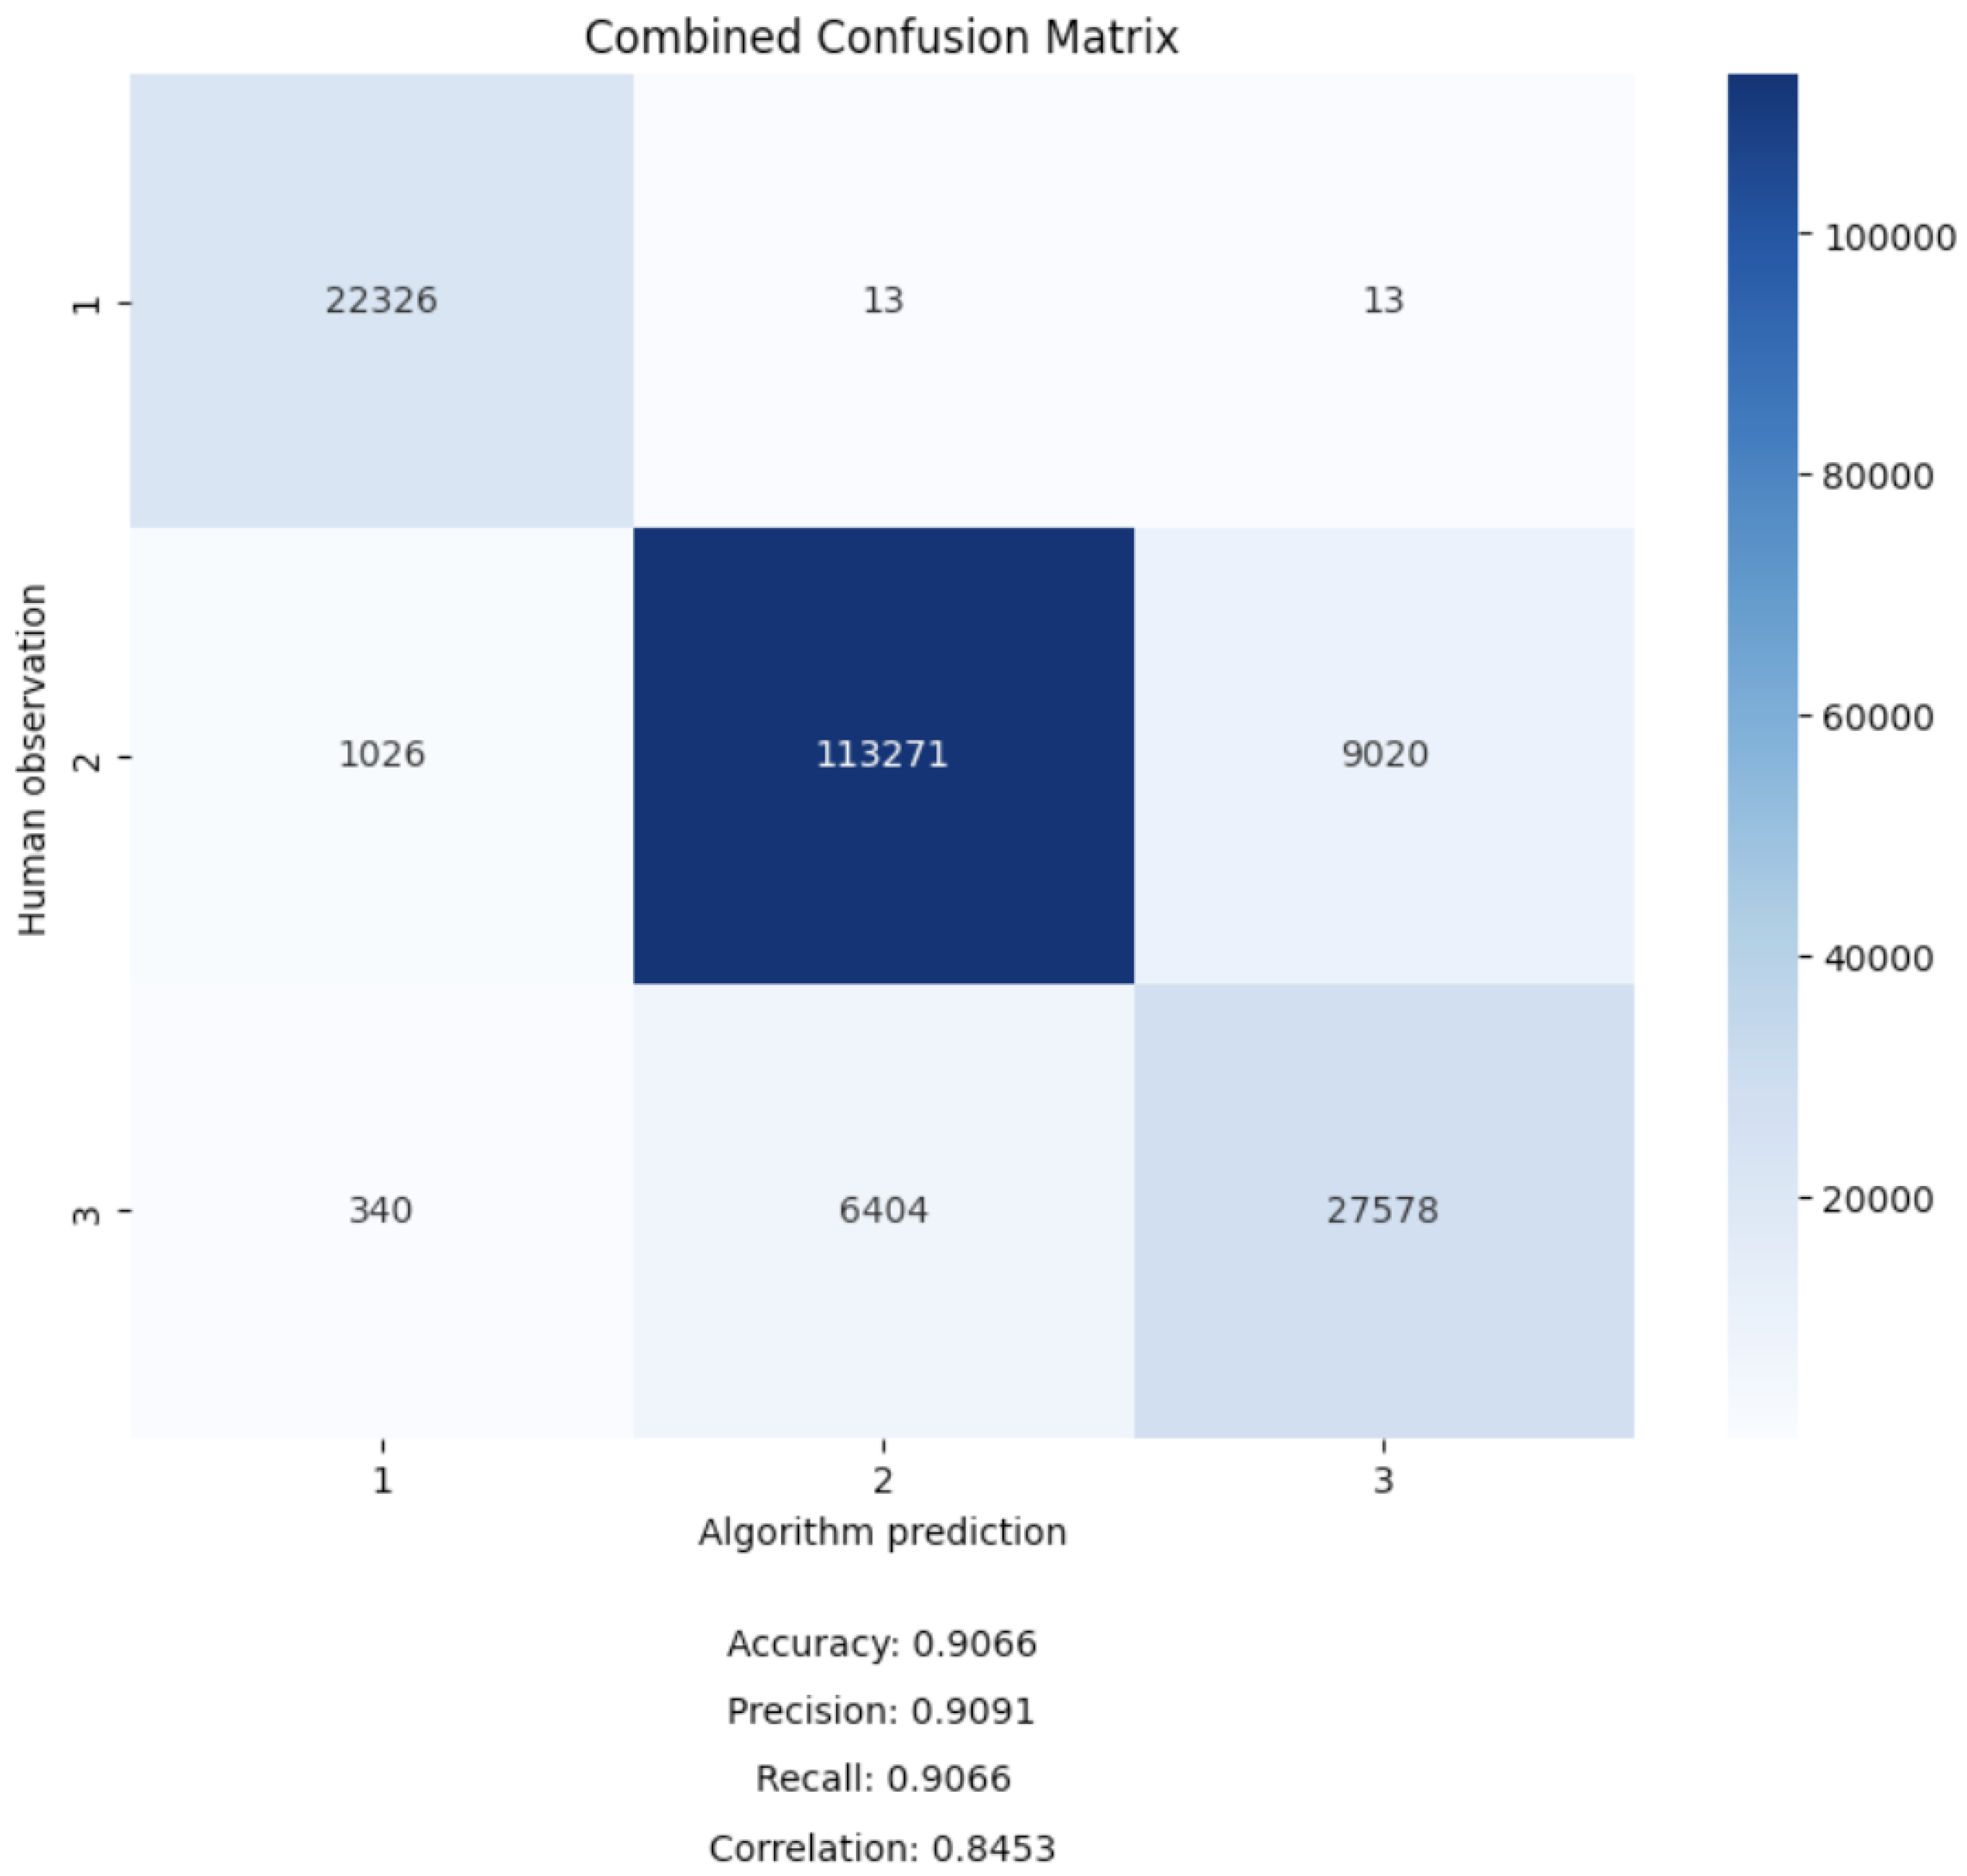
Figure 6.
Longitudinal average activity measurements of seven different pigs (colors) for each hour compared to the given pig’s own average activity level from all existing measurements. Green areas represent more active timeslot during the day. Data collection duration ranges from five to eighty days and all pigs shows similar activity patterns.
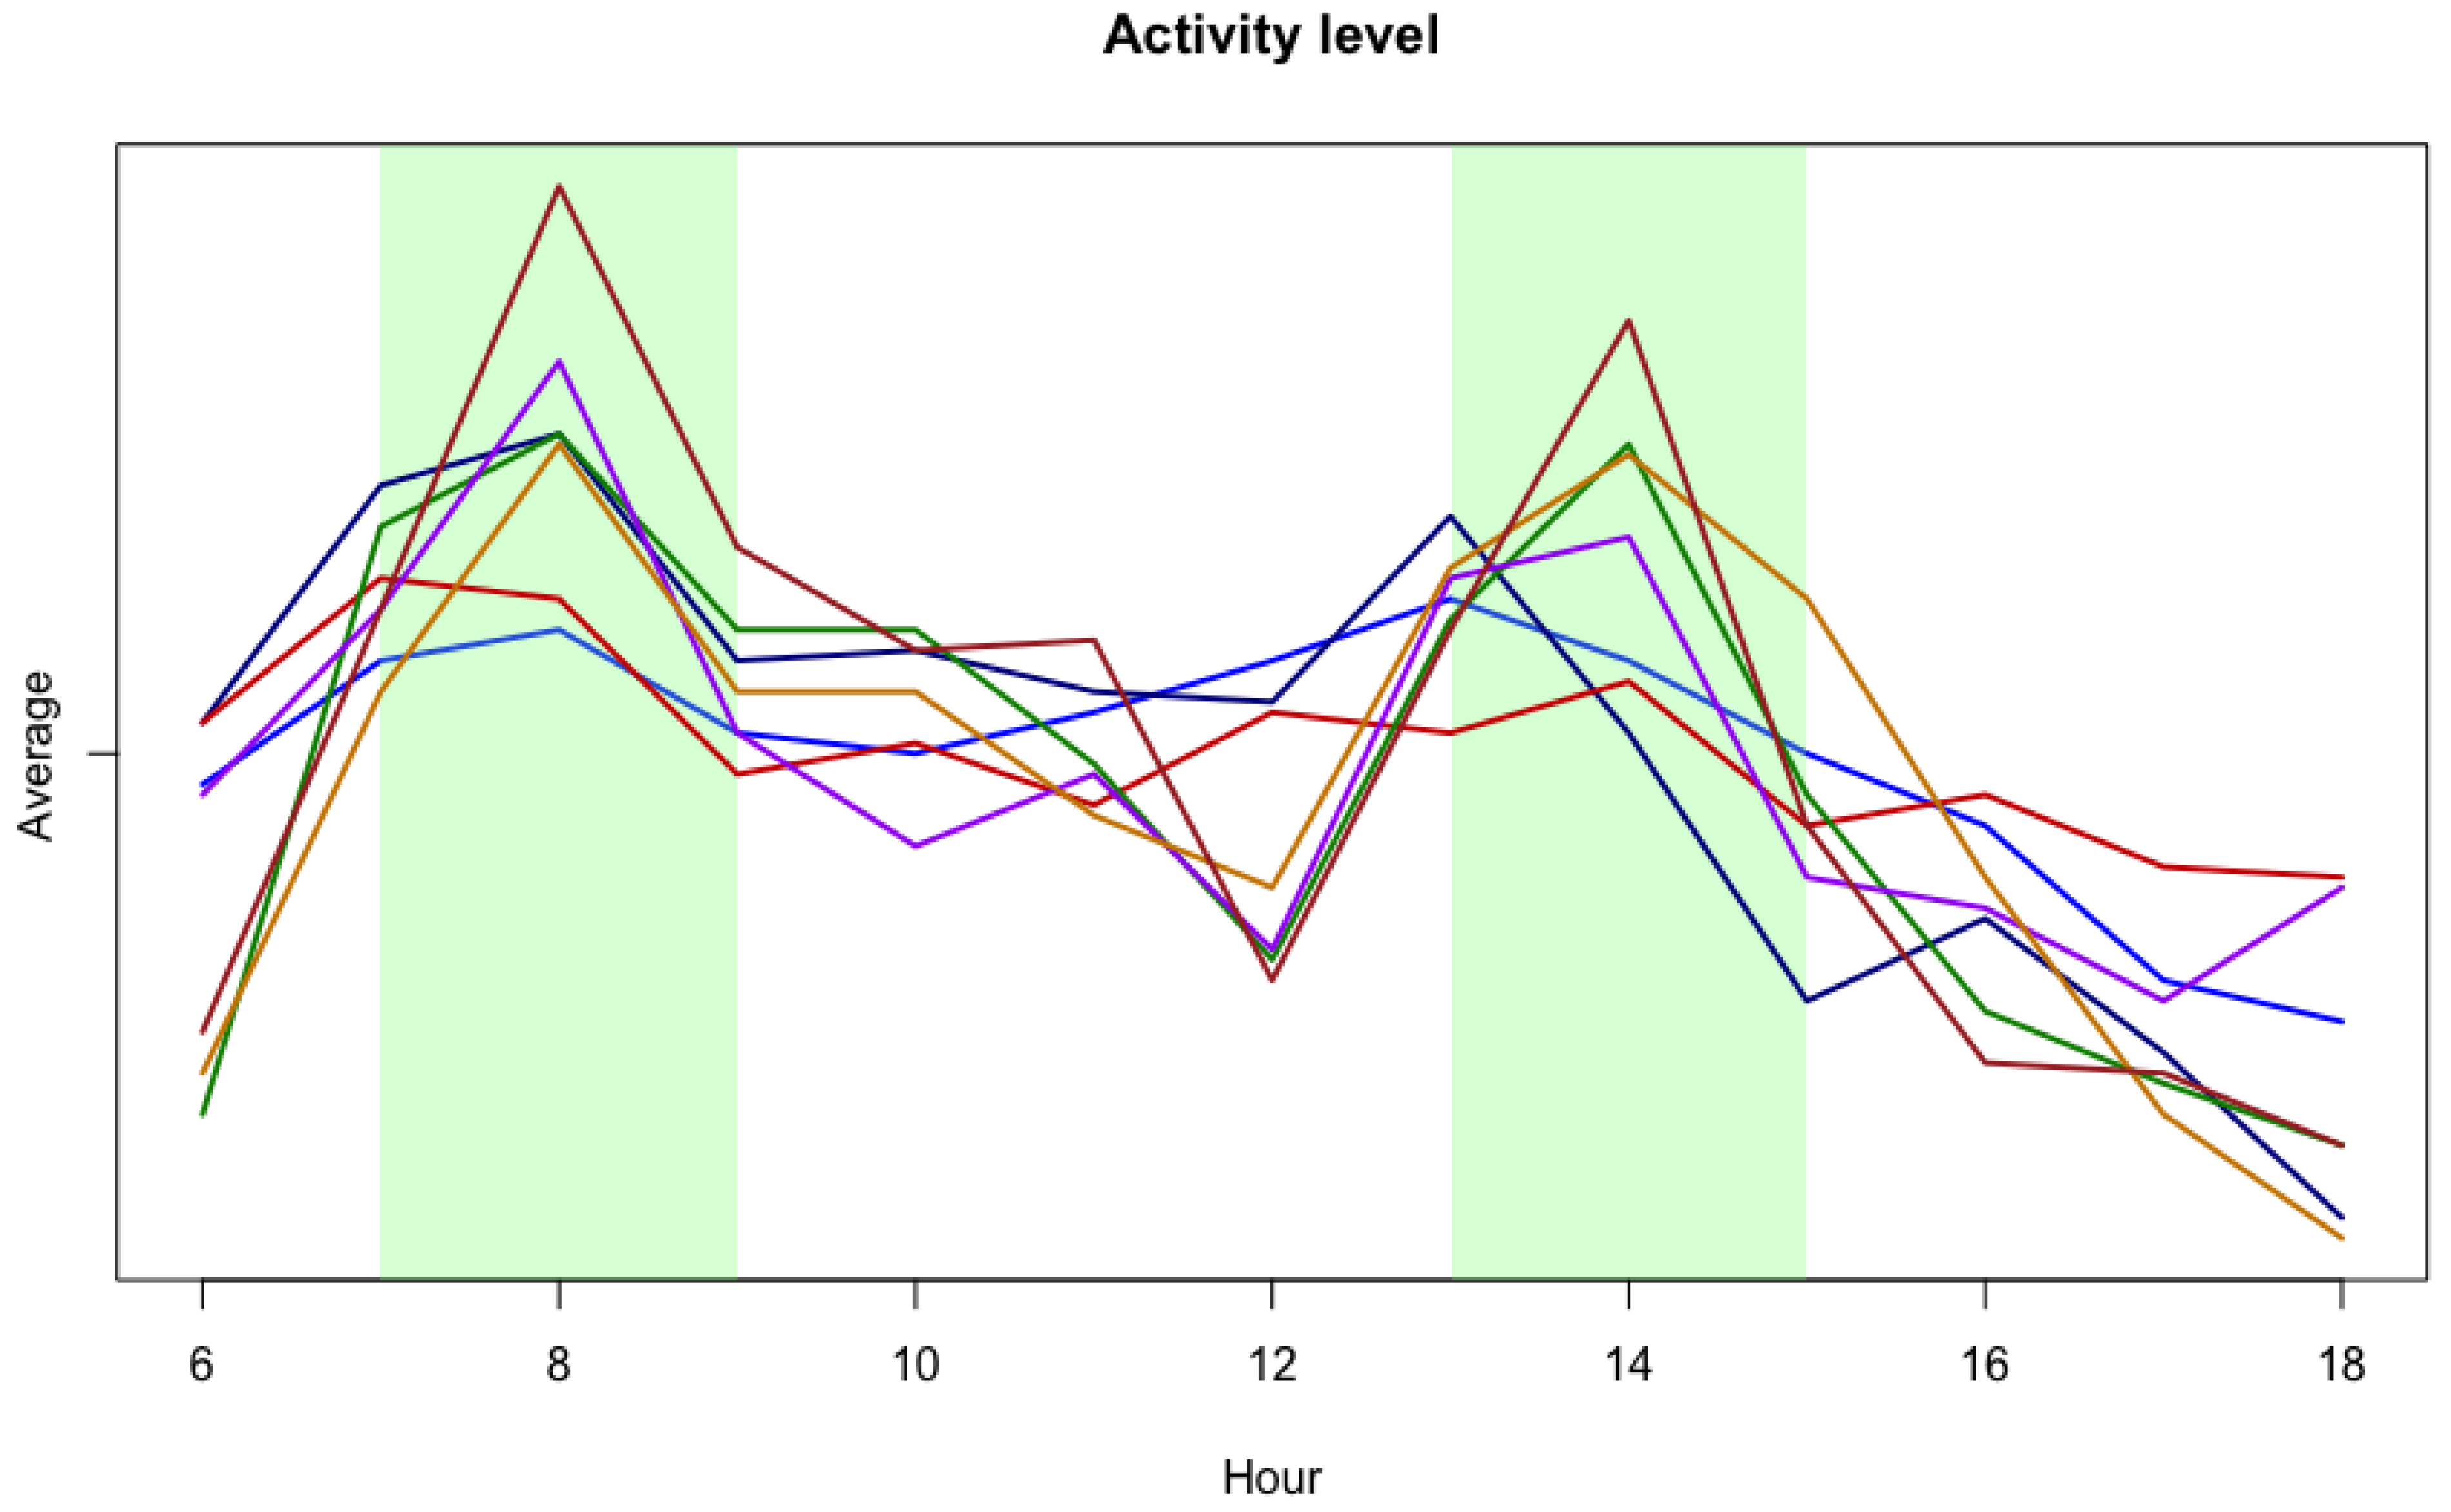
Figure 7.
Misclassification example: a ball mistakenly identified as a pig; the actual pig lays under the hay at the top left of the picture (red arrow).
Figure 7.
Misclassification example: a ball mistakenly identified as a pig; the actual pig lays under the hay at the top left of the picture (red arrow).
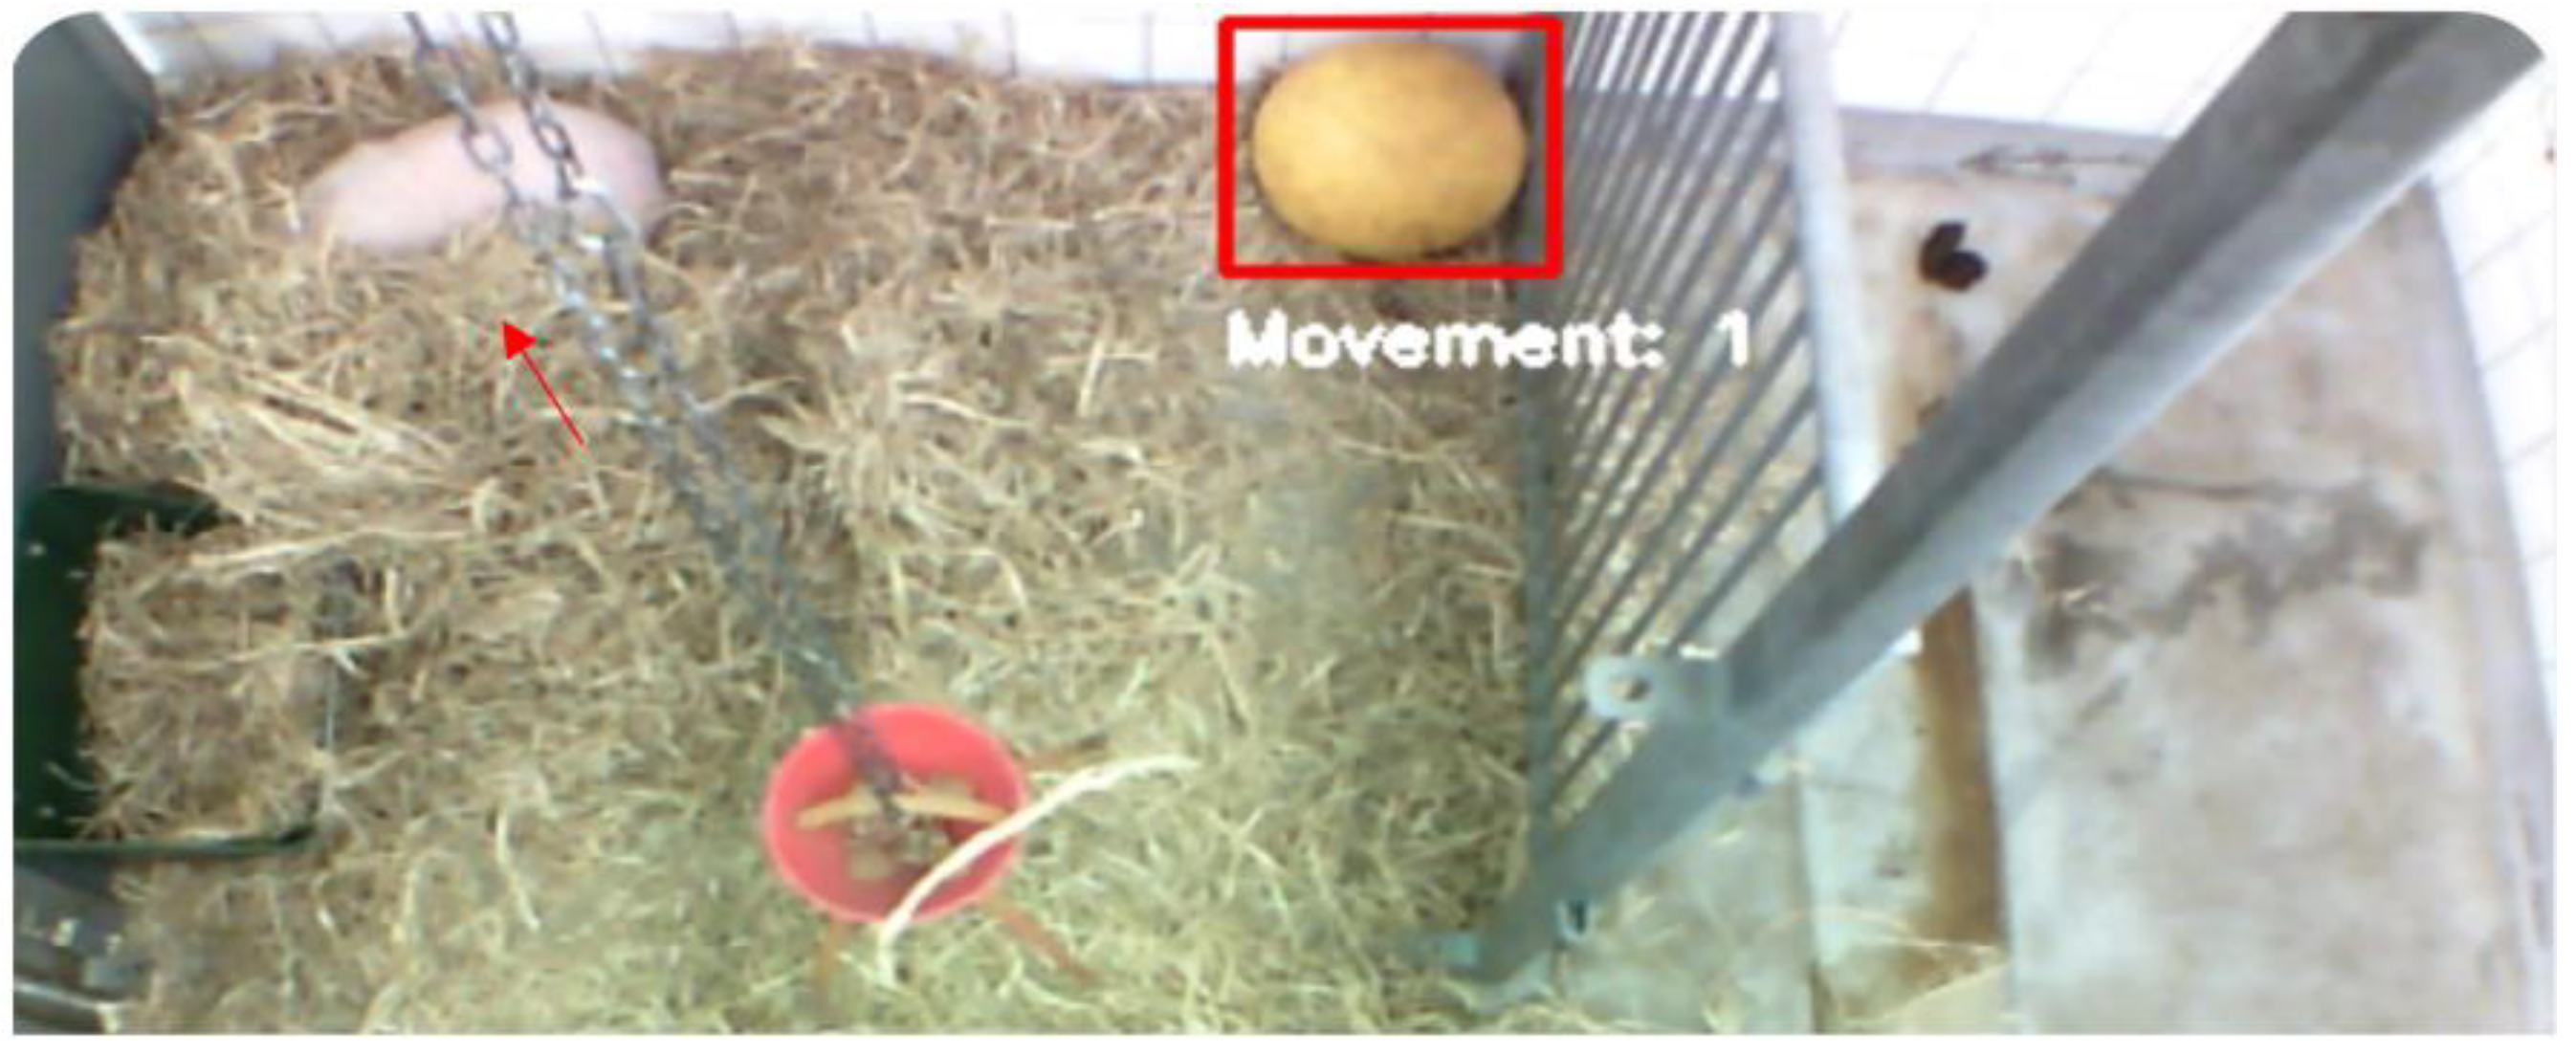
Figure 8.
Misclassification example: a section of the wall incorrectly recognized as a pig; no pigs are visible in the scene.
Figure 8.
Misclassification example: a section of the wall incorrectly recognized as a pig; no pigs are visible in the scene.
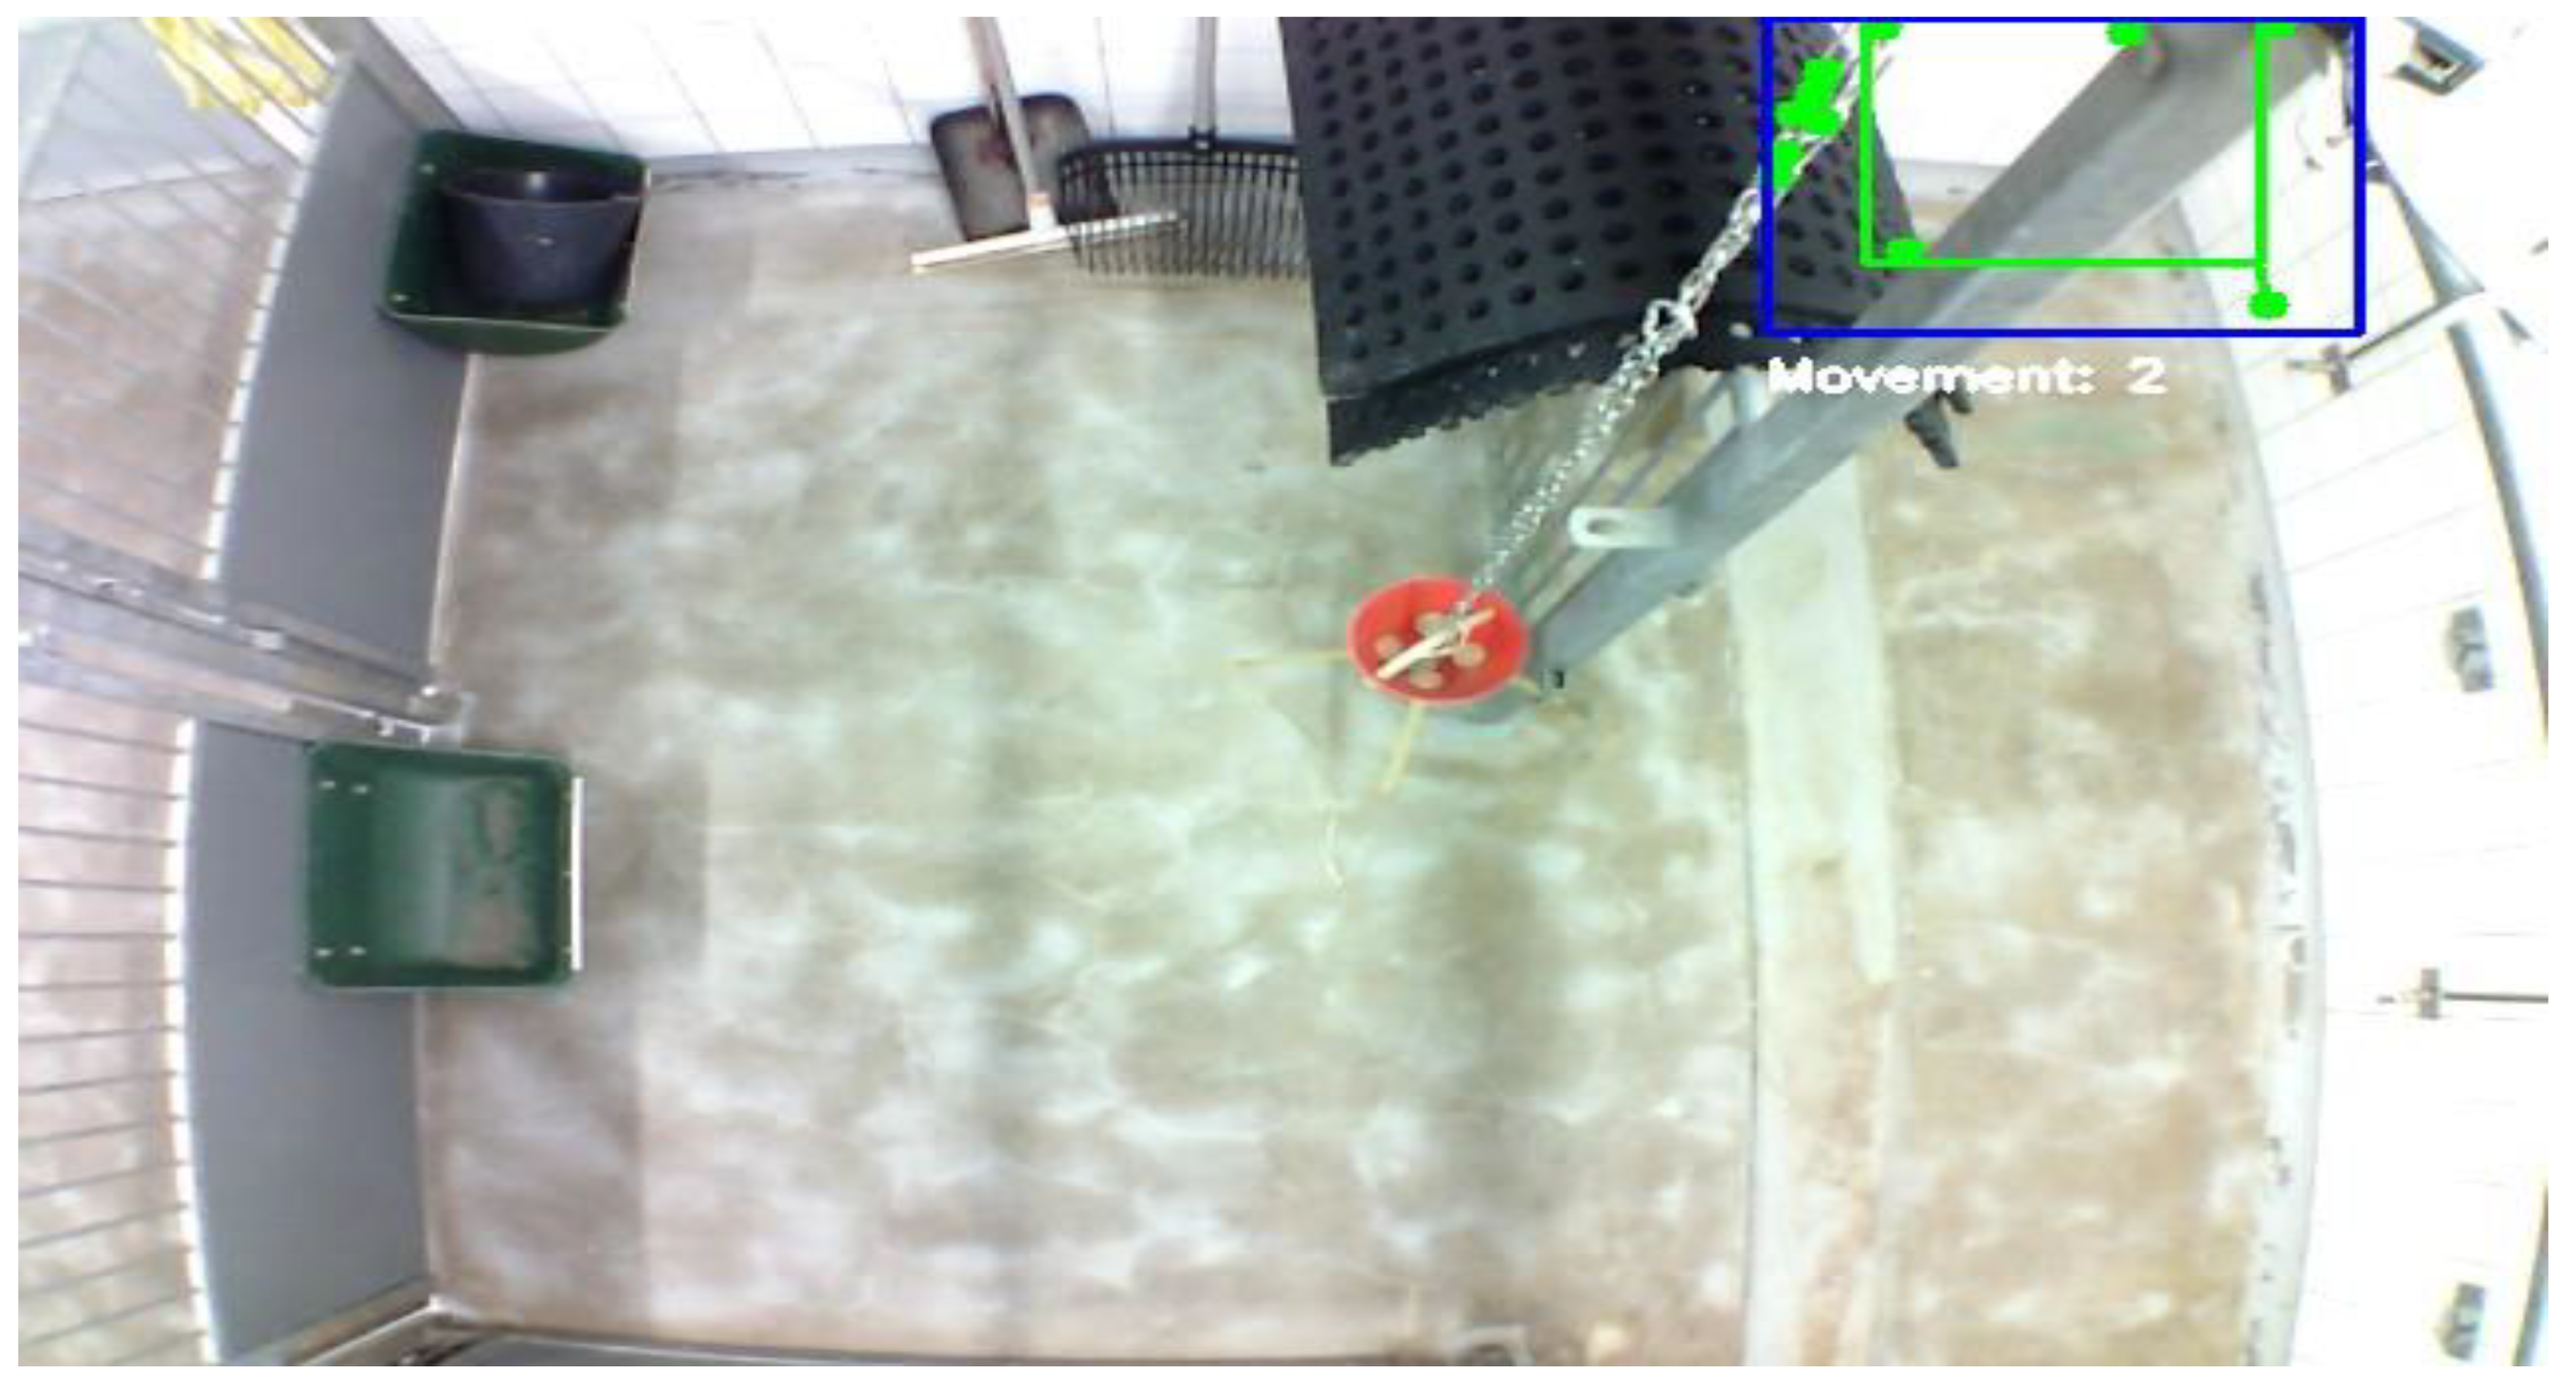
Figure 9.
The model successfully distinguishes (a) class 1, a laying pig, (b) from class 2, a standing pig, and (c) it registered movement of non-laying pig, class 3, with sufficient confidence levels above 85%.
Figure 9.
The model successfully distinguishes (a) class 1, a laying pig, (b) from class 2, a standing pig, and (c) it registered movement of non-laying pig, class 3, with sufficient confidence levels above 85%.
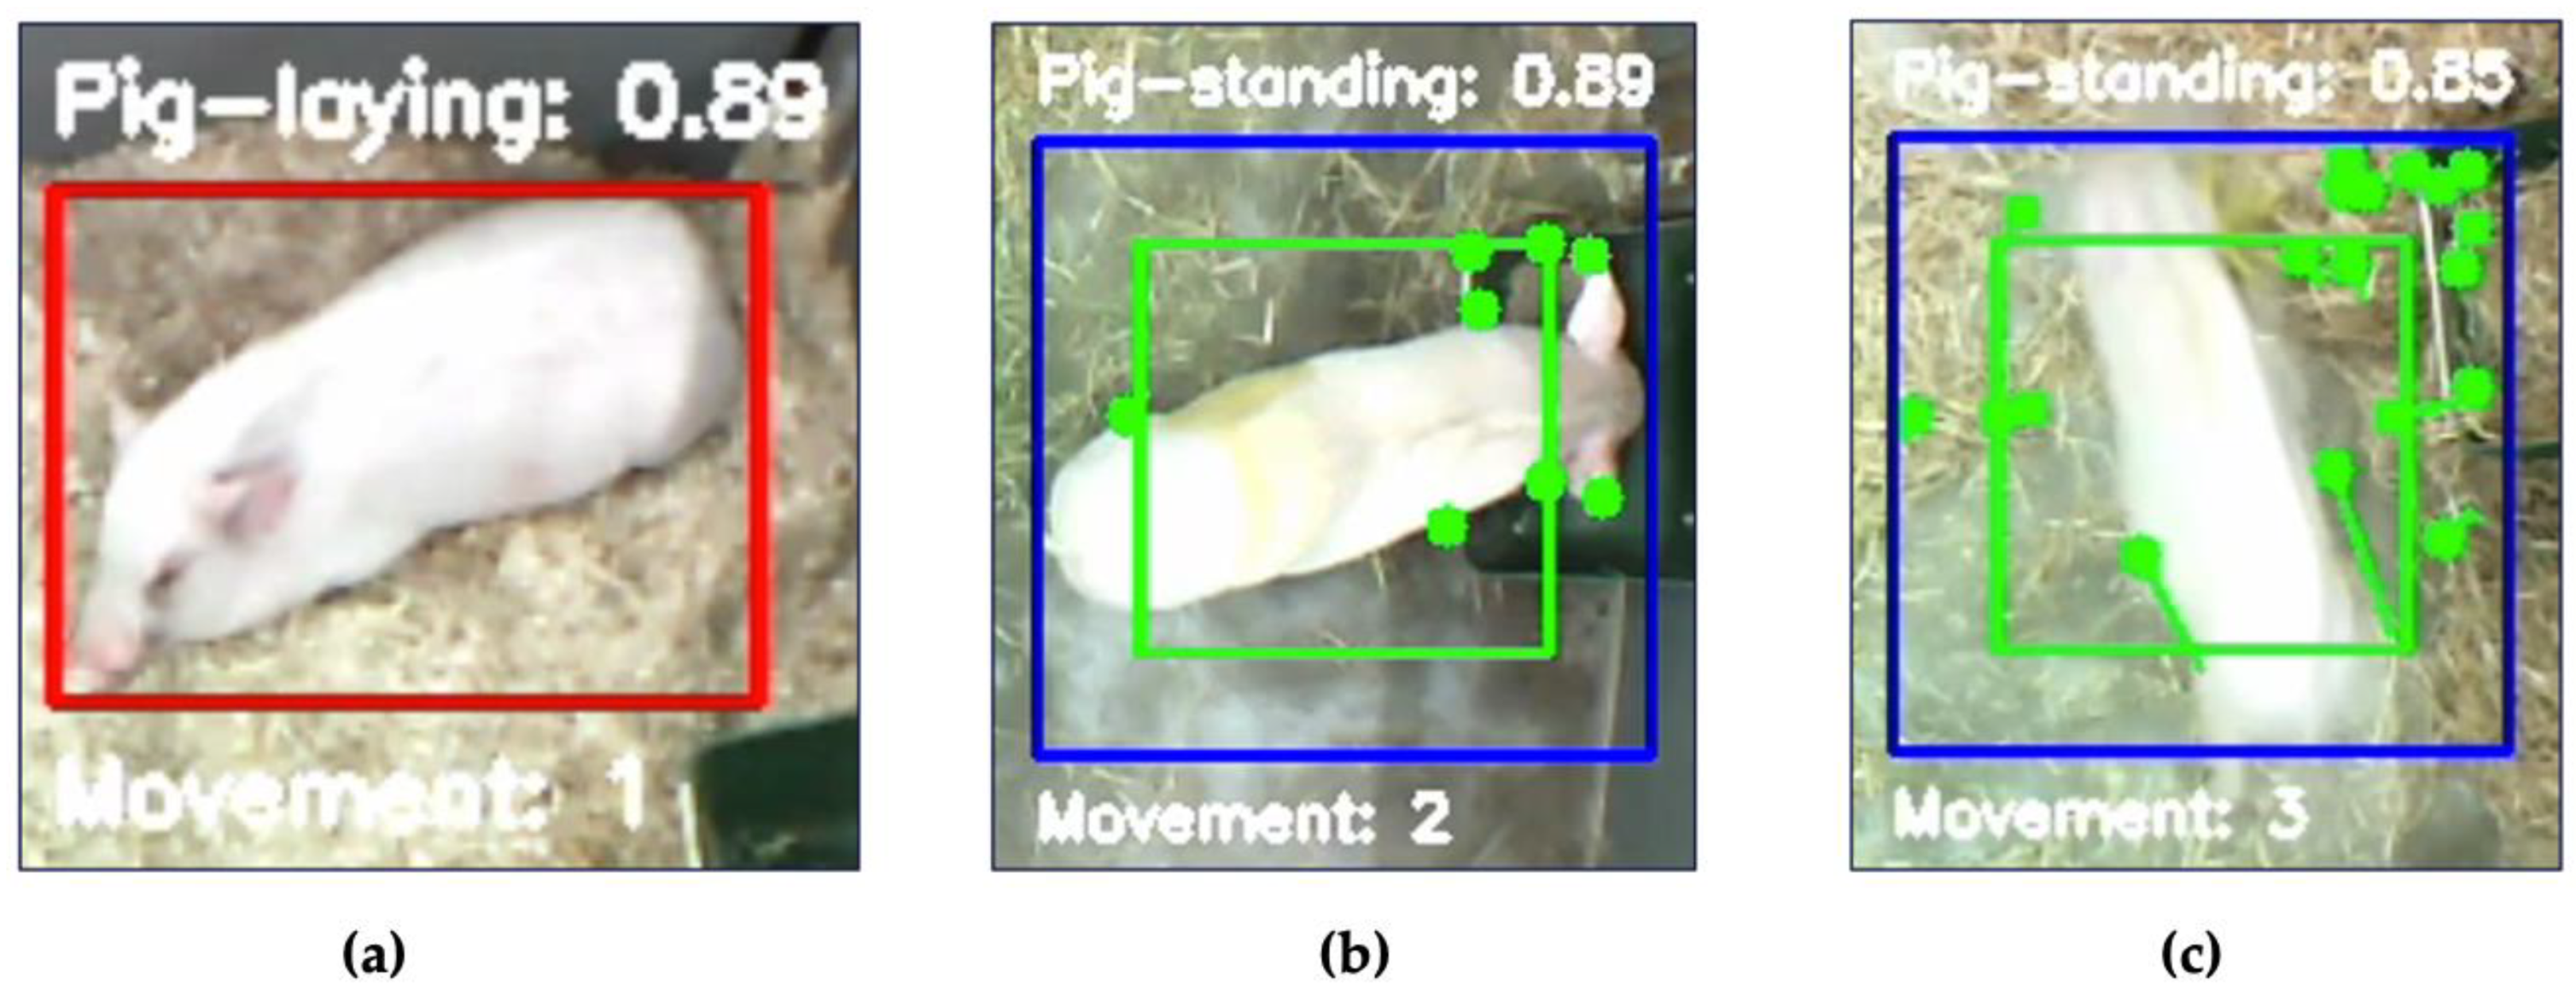

Table 1.
Metric descriptions.
| Metric | Description |
|---|---|
| Train/box loss | This graph shows the loss associated with the bounding box predictions during the training phase. The y-axis measures the loss magnitude, which ideally decreases over epochs (x-axis), indicating the model’s improving accuracy in locating objects. |
| Train/cls loss | Displays the classification loss during training, measuring how well the model identifies the correct class labels of the objects. The declining curve suggests improving classification accuracy. |
| Train/dfl loss | Shows the distribution focal loss during the training phase, which focuses on enhancing the model’s accuracy in localizing the exact position of objects. Lower values indicate better localization capabilities. |
| Metrics/precision(B) | This metric indicates the precision of the model during training, calculated as the ratio of true positive predictions to the total positive predictions made by the model. |
| Metrics/recall(B) | Reflects the recall rate during training, which measures the model’s ability to identify all actual positives. Higher recall values suggest that the model misses fewer actual positive cases. |
| Val/box loss | Like the train box loss but for the validation phase. It assesses the model’s ability to generalize bounding box predictions on unseen data. |
| Val/cls loss | Represents the classification loss during validation. A decreasing trend here is crucial as it signifies effective generalization in classifying new, unseen data. |
| Val/dfl loss | Mirrors the train distribution focal loss but evaluated on the validation dataset. It checks the model’s performance in object localization under validation conditions. |
| Metrics/mAP50(B) | Depicts the mean average precision at 50% Intersection over Union (IoU) threshold during training. This metric assesses the accuracy of the object detector by considering both precision and recall at a moderate IoU threshold. |
| Metrics/mAP50-95(B) | Shows the mean average precision across a range of IoU thresholds from 50% to 95% during training. This comprehensive metric evaluates the object detector’s performance across varying levels of detection difficulty, reflecting its effectiveness in various scenarios |
Table 2.
Validation comparison between running at 1 fps and 25 fps.
| Variable | Class | Counts | Total | Proportion | p |
|---|---|---|---|---|---|
| 25 fps | 1 | 2291225 | 5512255 | 0.416 | < .001 |
| 2 | 2867129 | 5512255 | 0.520 | < .001 | |
| 3 | 353901 | 5512255 | 0.064 | < .001 | |
| 1 fps | 1 | 94247 | 220055 | 0.428 | < .001 |
| 2 | 113756 | 220055 | 0.516 | < .001 | |
| 3 | 12252 | 220055 | 0.056 | < .001 |
Table 2: Results and proportion comparings of class 1, 2 and 3 between the two models showing significant difference in proportions of the classes with p-values all under 0.001.
Disclaimer/Publisher’s Note: The statements, opinions and data contained in all publications are solely those of the individual author(s) and contributor(s) and not of MDPI and/or the editor(s). MDPI and/or the editor(s) disclaim responsibility for any injury to people or property resulting from any ideas, methods, instructions or products referred to in the content. |
© 2024 by the authors. Licensee MDPI, Basel, Switzerland. This article is an open access article distributed under the terms and conditions of the Creative Commons Attribution (CC BY) license (http://creativecommons.org/licenses/by/4.0/).
Copyright: This open access article is published under a Creative Commons CC BY 4.0 license, which permit the free download, distribution, and reuse, provided that the author and preprint are cited in any reuse.


