
Submitted:
19 December 2024
Posted:
20 December 2024
Read the latest preprint version here
Abstract
Background: Geographic Information Systems, or GIS, play a pivotal role in the study of Per- and Polyfluoroalkyl Substances, or PFAS. By focusing on their environmental distribution and pathways, GIS significantly contributes to understanding the sources of PFAS exposure. This method is instrumental in environmental risk assessment and developing effective management strategies.Objective: To geolocate PFAS sites in a map and perform proximity analysis around these sites. Methods: This was a cross-sectional study. Each PFAS site address was geocoded. We measured proximity using the Kriging interpolation method with each census tract centroid. Additionally, each site had a 1-mile buffer (exposure risk). Results: We geocoded nineteen industrial sites, twenty-nine military sites, and one wastewater management site. By empirical Bayesian kriging, a smoothed map showing proximity ranges from 200 to 2000 meters around the PFAS sites. A one-mile proximity buffer map covered the entire study area. Conclusion: This study’s findings underscore the urgent need for action. Using GIS in decision-making, we can allocate resources and prioritize interventions based on risk and vulnerability. The study highlights potential contamination in residential areas, public water supplies, public parks, and high-density population areas.
Keywords:
PFAS
; Geographic Information Systems
; Public health
; Proximity risks
; Pollutants
Introduction
Per- and poly-fluoroalkyl substances (PFAS) are synthetic chemicals utilized in various industrial and consumer goods since the 1940s. PFAS have unique properties, such as heat, water, and oil resistance, making them suitable for many applications, including firefighting foam, nonstick cookware, and water-resistant clothing. Nevertheless, PFAS are persistent in the environment, do not break down or slowly decay, and can accumulate in the body, leading to potential adverse health effects [1]. A growing body of evidence from studies is the association between this chemical and health conditions such as high cholesterol, hepatic transaminitis, low birthweights, decreased vaccine responses, hypertension and pre-eclampsia, immune dysregulation, and malignancies of kidney or testis [2]. These health conditions can have long-term effects on individuals and communities, affecting quality of life and healthcare costs. An observational study of 1,503 children in Denmark showed an association between prenatal PFAS exposure and hospitalization [3]. The PFAS monitoring is strengthened by concerns about the bioaccumulation of PFAS by upstream food chain-eating animal-derived foods [4]. PFAS is ubiquitous and global in water, air, soil, and surrounding human environments.
PFAS contamination has also impacted the vicinity of the Potomac River, affecting Washington, District of Columbia (DC). The Potomac River is the primary drinking water source for roughly five million residents of the capital city. Military bases and firefighting training sites are a potential source of PFAS contamination in this area [5].
The environmental justice research continues to analyze the most established factors of disparity, income, and race from context to place. We understand the uncertainty surrounding the analytic methods and the spatial metrics to characterize exposures [6]. Previous studies had described an estimate of exposure using proximity to hazards [7,8]. Our mapping project aimed to visually demonstrate the proximity of potential PFAS contamination sites in DC using map buffers and smoothed surface maps. The main objective of this mapping initiative is to raise public awareness about the potential risks of PFAS exposure. These risks include a) the possibility of drinking water contamination due to industrial discharges and improper disposal of PFAS-contaminated soil; b) the ingestion of contaminated food, such as fish and crops; c) the inhalation of air released from consumer products containing PFAS, such as carpets, furniture, and food packaging, leading to the accumulation of these substances in indoor air; d) the inhalation of outdoor air, as PFAS can be transported through the atmosphere and deposited in soil and water [2]. DC Water has committed to quarterly monitoring to ensure compliance with the proposed Environmental Protection Agency (EPA) regulations [9]. Additionally, while awareness campaigns, resources, and testing infrastructures are still in development, an ongoing five-year study on children's health regarding PFAS exposure is taking place in Massachusetts and New Hampshire [10].
Data and Methods
The data for PFAS Sites were developed by Northeastern University's PFAS Project Lab, Silent Spring Institute, and PFAS-Reach team (https://bit.ly/48goDjD). The PFAS lab has published a detailed report and map about one confirmed and many presumptive contamination sites [10], and the website is current. The Presumptive Contamination map includes sites that are often sources of contamination, but where testing has not confirmed the presence of PFAS. We used ArcPro Desktop version 3.0 for the analysis. First, all the PFAS sites (individual addresses) were geocoded and assigned symbols. Second, after creating census tract centroids, we calculated the nearest distance from each centroid to the closest PFAS sites. Therefore, centroids are the proxy measure for residential proximity. Third, we used empirical Bayesian kriging, a robust interpolation method that accounts for errors through repeated simulations [11]. This step created a smoothed contour map demonstrating the distance (meters) from sites using color saturations. We chose kriging because it considers the nearby spatial data values' more accurate and non-linear variations. It uses a range of semi-variograms (rather than just one) estimated using maximum likelihood as weights. In the last step, the geocoded PFAS site map layer was overlaid. As a result, a visual representation of the PFAS sites within DC was generated, comprehensively highlighting their respective distances (in meters). A one-mile buffer was created on another map to understand the degree of exposure around each site.
Results
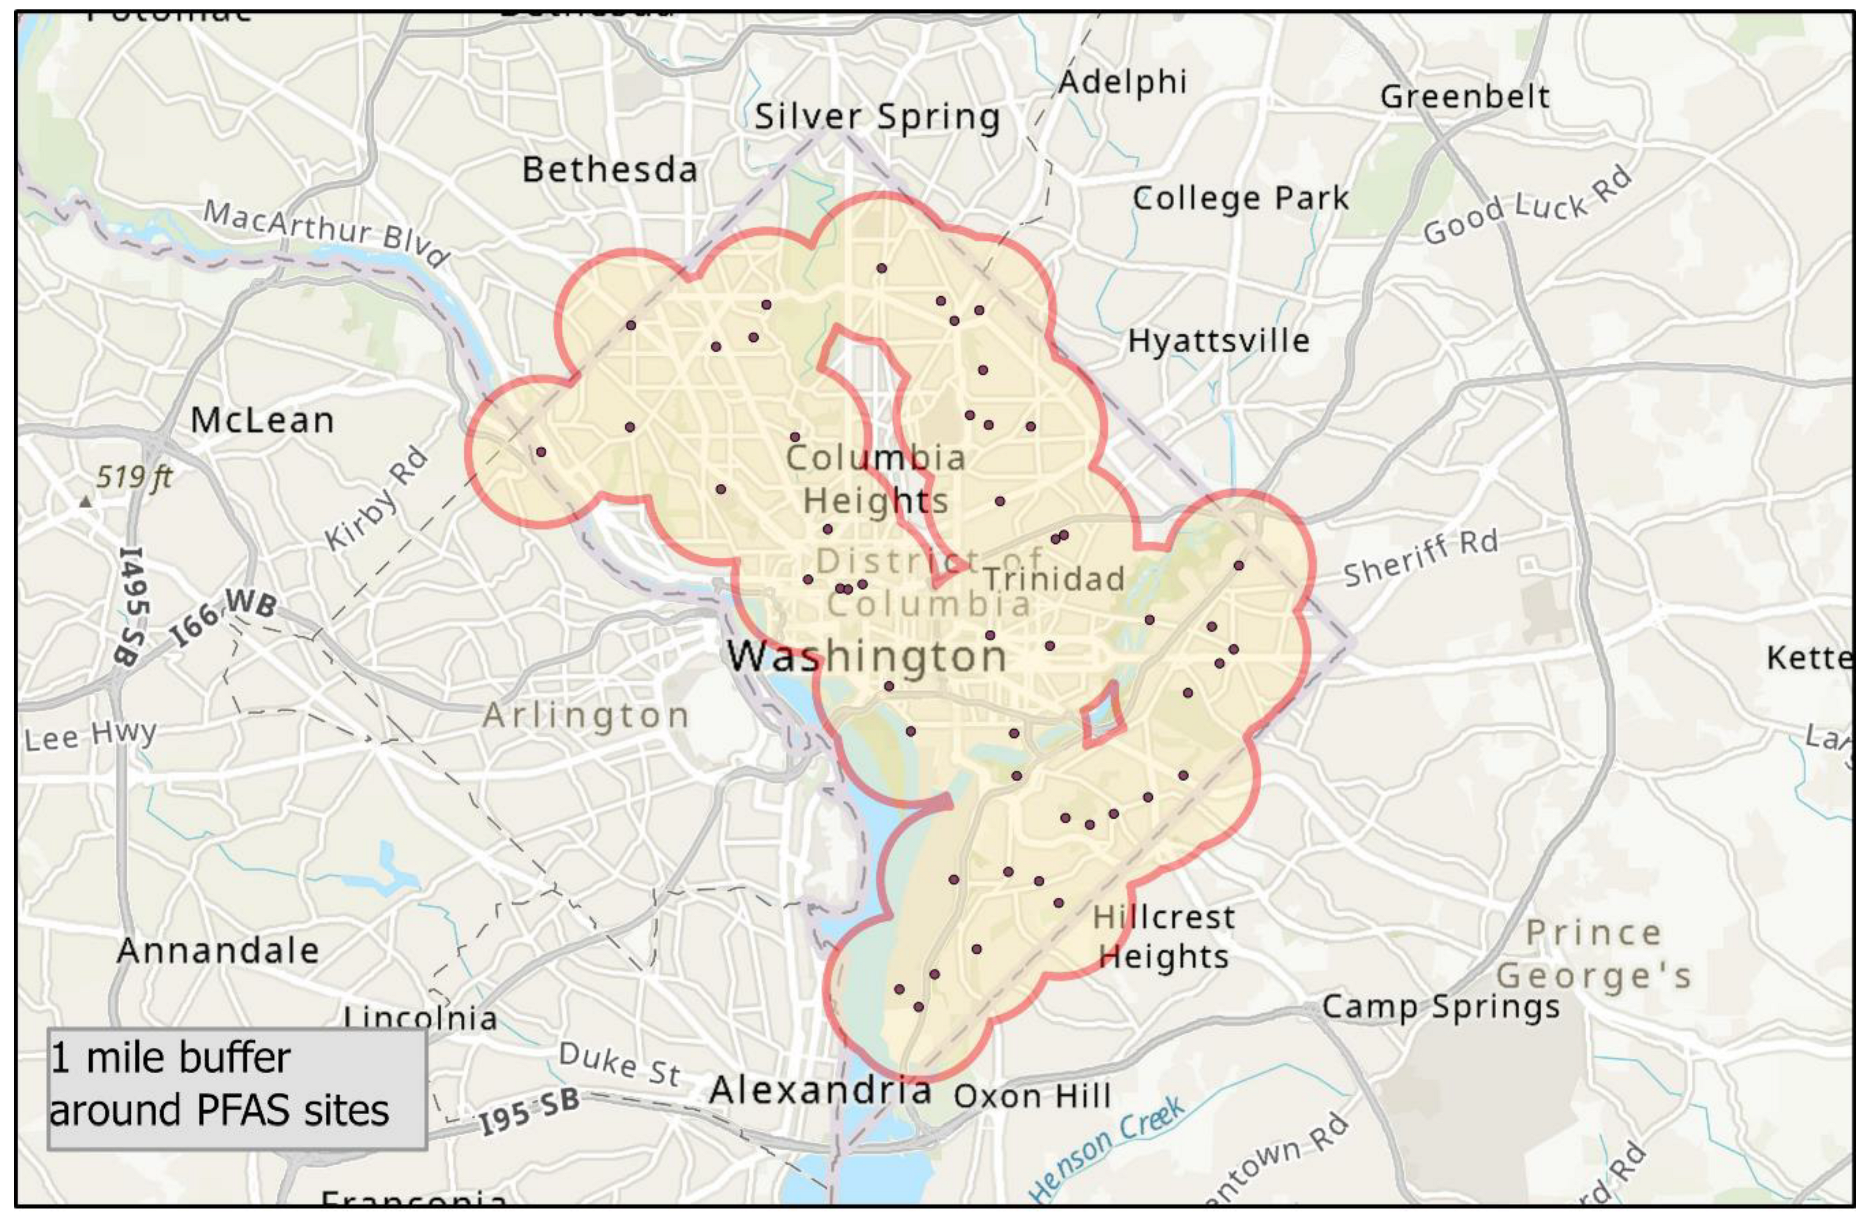
DC, with its 770 sq. Km. area and a population of 689,545, including 114,384 were under 18 years of age in 2020, is home to many potential contaminant sites. These include 19 industrial sites, 29 military sites, and one wastewater management site. Our maps, featuring a 1-mile buffer and various PFAS sites, reveal smoothed proximity distances ranging from 200 meters to 2000 meters. Notably, this district has areas surrounding various facilities that pose potential PFAS contamination risks, a key concern highlighted in Figure 1. Most of these sites fall within the designated red zones, further underscoring the issue’s urgency. A one-mile buffer zone from each site covers most of the DC, as depicted in Figure 2.
Discussion
The implications of PFAS contamination on public health and environmental justice are of urgent concern. The need to protect vulnerable populations from exposure to harmful PFAS chemicals is pressing. Our analyses reveal that PFAS sites are often located in close proximity to residential and occupational areas in DC, posing a significant risk. Those living in close proximity to these sites may potentially inhale dust particles [12], while other forms of exposure can arise from the contamination of water and soil [13].
The sources and transport of PFAS are industrial and consumer production. PFAS compounds from household production are food packaging materials, nonstick Cookware, paints, varnishes, sealants, and water-resistant clothing [14]. It is estimated that 18-80 million individuals in the United States are exposed to tap water containing a combined concentration of perfluorooctanoic acid (PFOA) and perfluorooctanesulfonate (PFOS). Additionally, more than 200 million people likely receive tap water with a PFOA and PFOS concentration at or above 1 ng/L [15].
Cost-prohibitive screening and testing, variations in legislation and regulations, resource constraints, and legality have undermined the exact quantification of PFAS sources [2]. Therefore, presumptive PFAS contamination sites are identified by identifying facilities related to PFAS, such as industrial produce or use, airports and military sites discharge, and wastewater treatment plants containing PFAS [5]. Twenty-nine military sites in DC may release PFAS, found in certain firefighting foams, potentially contaminate drinking water. Department of Defense works with Congress to address the commitment to assess and clean up [16]. Major airports are another concern for PFAS; DC is surrounded by three. We recorded 19 industrial sites in this study area. North American Industry Classification System (NAICS) codes may identify these industrial sites. The EPA uses Facility Registry Service by primary NAICS code, with geolocation accuracy <1,000 meters. Our study demonstrated all sites within <1,000 meters, which is concerning (Figure 1, color saturation red to yellow instead of blue). DeLuca et al. mapped a GIS case study in Queens County, New York, where old houses, income, and airports were associated with PFAS concentration [17]. In contrast to this county, our study area had more military sites, and we suspect income, demography, and blood level mirror similar findings. Studies using kriging methods like ours complemented spatial analysis [18]. This study's findings are proxies for further justice research [19]. We highlight the proximity concern, potentially contaminating air, water, and soil in residential areas, public water supplies, public parks, and high-density population areas. PFAS is integral to interdependent climate change and the environment. Therefore, it is a call for equity and environmental justice in communities. Lack of education, under-resources, and marginalized communities are especially vulnerable to PFAS exposure [20,21,22].
Local governments and agencies (e.g., EPA) are the linchpin in preventing PFAS exposure [23]. Their collaboration with local public health departments and community organizations is crucial, fostering information sharing and coordinated efforts. While our analyses contribute to raising awareness on this matter, it is important to continue to educate and inform others about the implications of PFAS contamination. Local governments can actively gather and maintain data regarding potential sources of contamination and vulnerable populations within their jurisdiction. This awareness entails collecting information on industrial sites, water treatment plants, schools, residential areas, and other relevant data layers. Additionally, they can leverage geographic information systems (GIS) technology to map areas affected by contamination, monitor PFAS concentrations in water sources, and track the dispersion patterns of these substances. The lack of precursors in standard analytical methods significantly contributes to PFAS at military sites. Moreover, multiple military fire training areas within a watershed are a reliable indicator of PFAS contamination in the community's drinking water supply [20,24]. Integrating GIS into decision-making processes is crucial, enabling informed choices regarding resource allocation and prioritizing interventions based on risk and vulnerability. The requirements for managing PFAS in drinking water encompass the provision of a comprehensive analysis of the impact of PFAS on human health when consumed through drinking water, a thorough evaluation of the ecological and human health risks associated with PFAS exposure, a strong emphasis on sustainable monitoring and management of PFAS as a crucial component of any successful management plan, and the establishment of PFAS regulations based on a thorough and all-encompassing understanding of the contaminants. Environmental protection agency has created benchmarks for certain PFAS, enforced national drinking water standards, and guidance on PFAS disposal. The results of this exploratory geographic analysis complements to potential exposure in a densely populated district, where PFAS exposure is a risk by various mechanism aided by proximity of its sources.
Limitations
We needed high-quality data on other potential PFAS contamination sites, such as firefighting training sites, railroads, airports, airplane crash sites, and bulk fuel storage facilities. We did not have resident’s PFAS blood levels to show association with the proximity to the sites. Like many publications in spatial literature, establishing a direct causal relationship between exposure and outcome is complex [6]. However, the mapping analysis was robust (Empirical Bayes Kriging) and statistically significant in showing a smoothed map illustrating the proximity issue.
Conclusion
The potential PFAS contaminant sites are noted in proximity to the district. Use of GIS and spatial analytical technics can improve the understanding PFAS exposure risks. This study’s findings underscore the urgent need for action. Using GIS in decision-making, we can effectively allocate resources and prioritize interventions based on risk and vulnerability. The study highlights potential contamination in residential areas, public water supplies, public parks, and high-density population areas.
References
- Fenton SE, Ducatman A, Boobis A, et al. Per- and Polyfluoroalkyl Substance Toxicity and Human Health Review: Current State of Knowledge and Strategies for Informing Future Research. Environ Toxicol Chem 2021, 40, 606–630. [Google Scholar]
- EPA. Environmental Protection Agency. Our Current Understanding of the Human Health and Environmental Risks of PFAS. 2023. Available online: https://www.epa.gov/pfas/our-current-understanding-human-health-and-environmental-risks-pfas (accessed on 31 May 2023).
- Dalsager L, Christensen N, Halekoh U, et al. Exposure to perfluoroalkyl substances during fetal life and hospitalization for infectious disease in childhood: A study among 1,503 children from the Odense Child Cohort. Environment International 2021, 149, 106395. [Google Scholar] [CrossRef] [PubMed]
- Xing Y, Zhou Y, Zhang X, et al. The sources and bioaccumulation of per- and polyfluoroalkyl substances in animal-derived foods and the potential risk of dietary intake. Sci Total Environ 2023, 905, 167313. [Google Scholar] [CrossRef]
- Salvatore D, Mok K, Garrett KK, et al. Presumptive Contamination: A New Approach to PFAS Contamination Based on Likely Sources. Environ Sci Technol Lett 2022, 9, 983–990. [Google Scholar] [CrossRef]
- Banzhaf HS, Ma L, Timmins C. Environmental Justice: Establishing Causal Relationships. Annual Review of Resource Economics 2019, 11, 377–398. [Google Scholar] [CrossRef]
- Perlin SA, Wong D, Sexton K. Residential proximity to industrial sources of air pollution: interrelationships among race, poverty, and age. J Air Waste Manag Assoc 2001, 51, 406–421. [Google Scholar] [CrossRef]
- Bolin B, Nelson A, Hackett EJ, et al. The Ecology of Technological Risk in a Sunbelt City. Environment and Planning A: Economy and Space 2002, 34, 317–339. [Google Scholar] [CrossRef]
- DC-water. PFAS and Drinking Water. Available online: https://www.dcwater.com/pfas-and-drinking-water (accessed on 31 May 2023).
- SSI. Silent Spring Institute. The PFAS Exchange. Available online: https://pfas-exchange.org/ (accessed on 31 May 2023).
- ESRI. Environmental Science Research Institute. Empirical Bayesian Kriging (Geostatistical Analyst). Available online: https://pro.arcgis.com/en/pro-app/latest/tool-reference/geostatistical-analyst/empirical-bayesian-kriging.htm (accessed on 6 February 2023).
- Zhou, J.; Baumann, K.; Surratt, J.D.; Turpin, B.J. Legacy and emerging airborne per- and polyfluoroalkyl substances (PFAS) collected on PM(2.5) filters in close proximity to a fluoropolymer manufacturing facility. Environ Sci Process Impacts 2022, 24, 2272–2283. [Google Scholar] [CrossRef]
- Martin KV, Hilbert TJ, Reilly M, et al. PFAS soil concentrations surrounding a hazardous waste incinerator in East Liverpool, Ohio, an environmental justice community. Environ Sci Pollut Res Int 2023, 30, 80643–80654. [Google Scholar] [CrossRef] [PubMed]
- Evich MG, Davis MJB, McCord JP, et al. Per- and polyfluoroalkyl substances in the environment. Science 2022, 375, eabg9065. [Google Scholar] [CrossRef] [PubMed]
- Andrews, D.Q.; Naidenko, O.V. Population-Wide Exposure to Per- and Polyfluoroalkyl Substances from Drinking Water in the United States. Environmental Science & Technology Letters 2020, 7, 931–936. [Google Scholar]
- USACE. U.S. Army Corps of Engineers. Formerly Used Defense Sites. "Environmental Program.". Available online: https://www.usace.army.mil/missions/environmental/formerly-useddefense-sites/ (accessed on 11 December 2023).
- DeLuca NM, Thomas K, Mullikin A, et al. Geographic and demographic variability in serum PFAS concentrations for pregnant women in the United States. Journal of Exposure Science & Environmental Epidemiology 2023, 33, 710–724. [Google Scholar]
- Lee, J.; Ramírez, I.J. Geography of Disparity: Connecting COVID-19 Vulnerability and Social Determinants of Health in Colorado. Behavioral Medicine 2022, 48, 72–84. [Google Scholar] [CrossRef] [PubMed]
- Buzzelli, M.; Jerrett, M. Comparing proximity measures of exposure to geostatistical estimates in environmental justice research. Global Environmental Change Part B: Environmental Hazards 2003, 5, 13–21. [Google Scholar] [CrossRef]
- Liddie, J.M.; Schaider, L.A.; Sunderland, E.M. Sociodemographic Factors Are Associated with the Abundance of PFAS Sources and Detection in U.S. Community Water Systems. Environmental Science & Technology 2023, 57, 7902–7912. [Google Scholar]
- Barton, K.E.; Starling, A.P.; Higgins, C.P.; McDonough, C.A.; Calafat, A.M.; Adgate, J.L. Sociodemographic and behavioral determinants of serum concentrations of per- and polyfluoroalkyl substances in a community highly exposed to aqueous film-forming foam contaminants in drinking water. Int J Hyg Environ Health 2020, 223, 256–266. [Google Scholar] [CrossRef]
- Nair, A.S.; Ma, Z.Q.; Watkins, S.M.; Wood, S.S. Demographic and exposure characteristics as predictors of serum per- and polyfluoroalkyl substances (PFASs) levels - A community-level biomonitoring project in Pennsylvania. Int J Hyg Environ Health 2021, 231, 113631. [Google Scholar] [CrossRef]
- Rogers, R.D.; Reh, C.M.; Breysse, P. Advancing per- and polyfluoroalkyl substances (PFAS) research: an overview of ATSDR and NCEH activities and recommendations. J Expo Sci Environ Epidemiol 2021, 31, 961–971. [Google Scholar] [CrossRef] [PubMed]
- Ruyle BJ, Thackray CP, Butt CM, et al. Centurial Persistence of Forever Chemicals at Military Fire Training Sites. Environmental Science & Technology 2023, 57, 8096–8106. [Google Scholar]
Figure 1.
Sites of potential PFAS contamination sites proximity heat map.
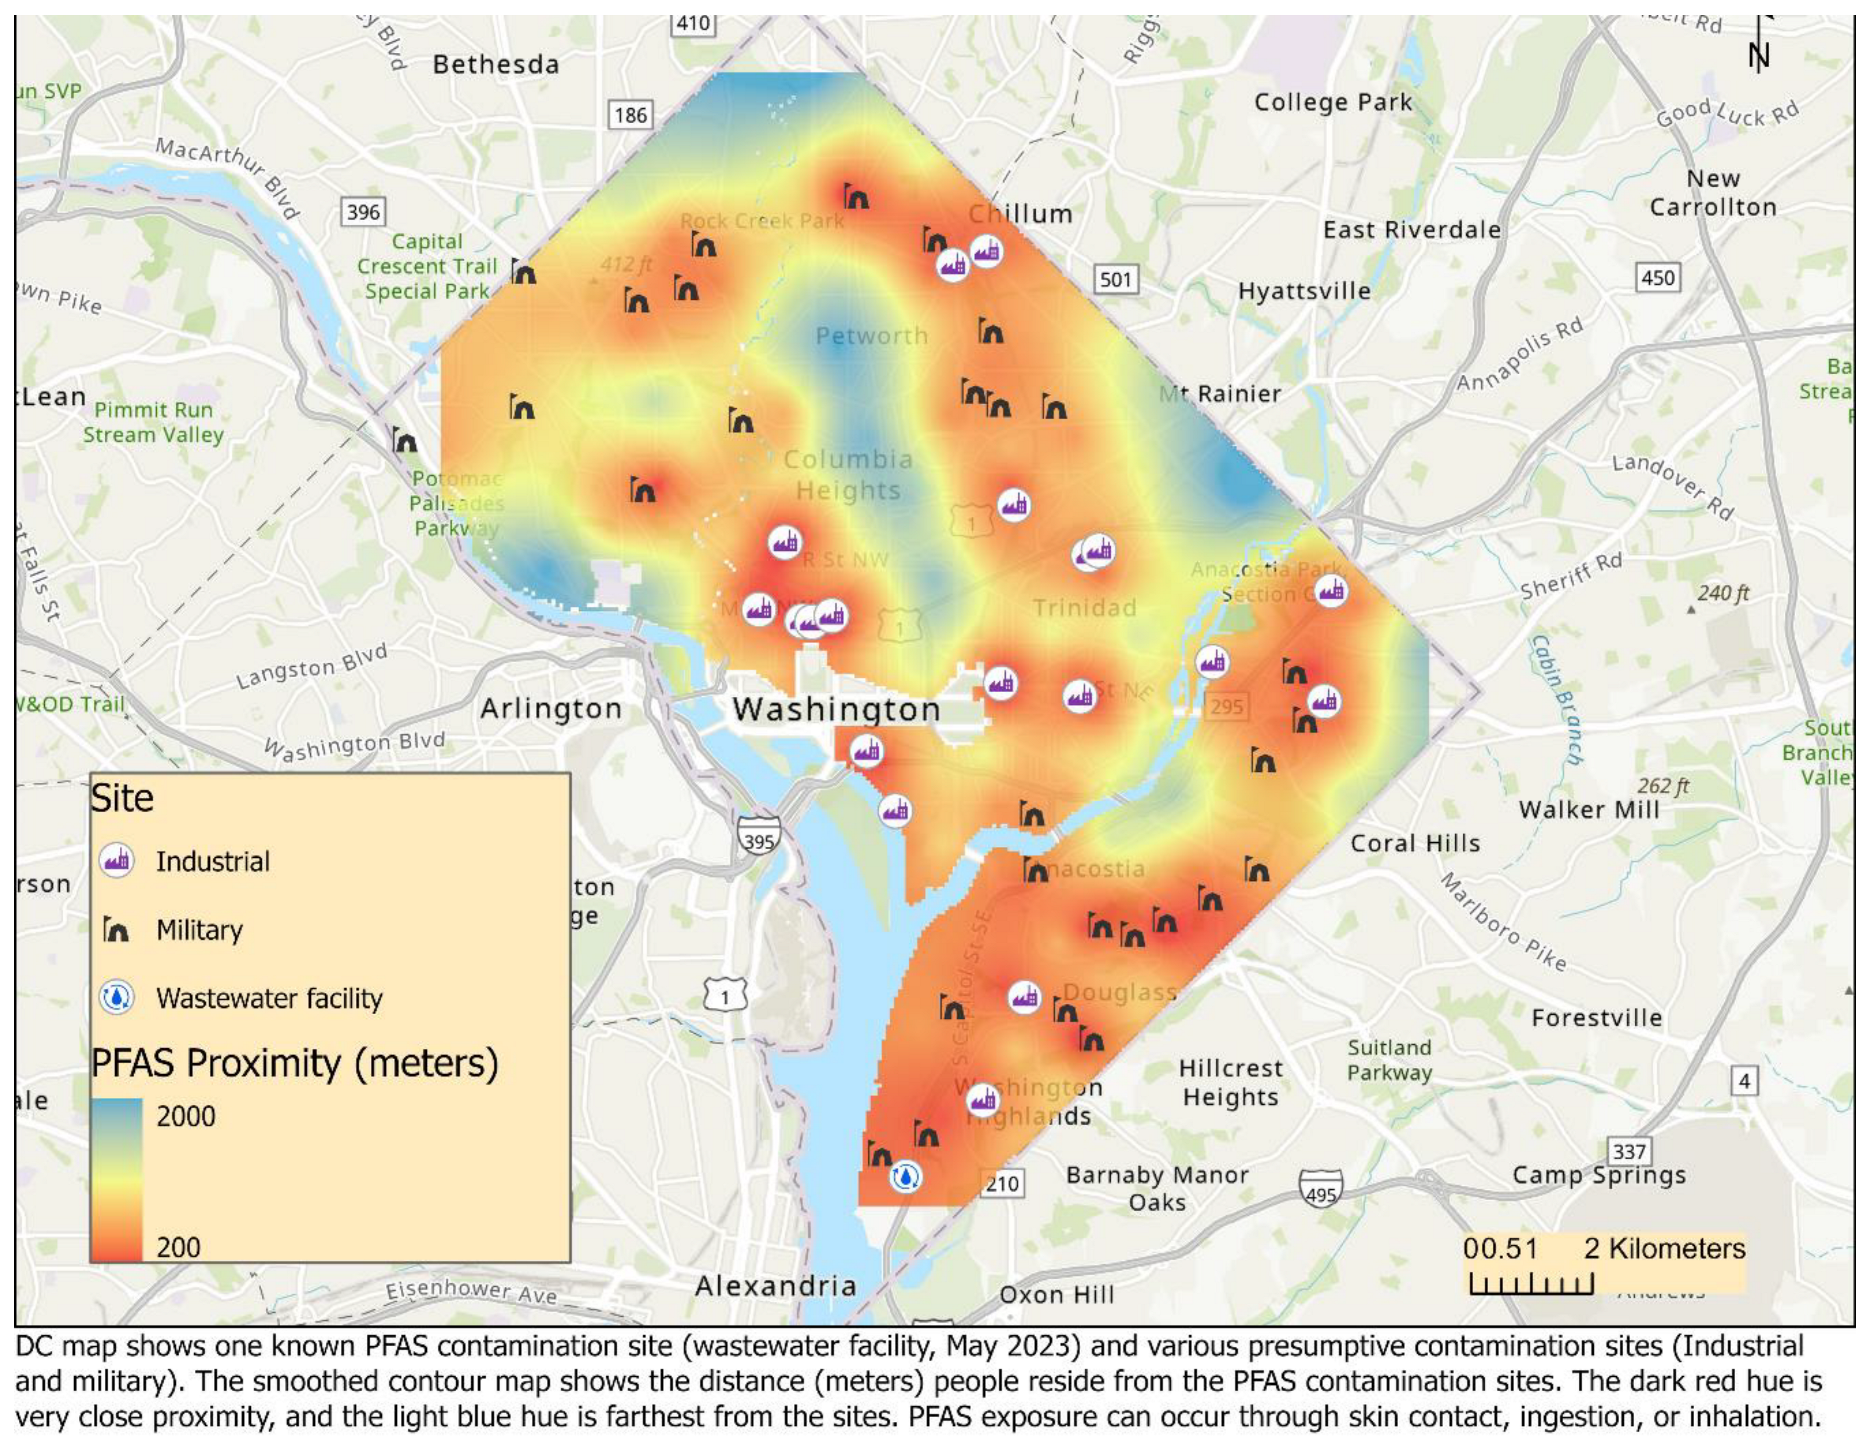
Figure 2.
Sites of potential PFAS contamination sites; 1 mile buffer.
Disclaimer/Publisher’s Note: The statements, opinions and data contained in all publications are solely those of the individual author(s) and contributor(s) and not of MDPI and/or the editor(s). MDPI and/or the editor(s) disclaim responsibility for any injury to people or property resulting from any ideas, methods, instructions or products referred to in the content. |
© 2024 by the authors. Licensee MDPI, Basel, Switzerland. This article is an open access article distributed under the terms and conditions of the Creative Commons Attribution (CC BY) license (http://creativecommons.org/licenses/by/4.0/).
Copyright: This open access article is published under a Creative Commons CC BY 4.0 license, which permit the free download, distribution, and reuse, provided that the author and preprint are cited in any reuse.


