Submitted:
18 December 2024
Posted:
19 December 2024
You are already at the latest version
Abstract
Background/Objectives: Activation of cannabinoid CB1 or CB2 receptors induces the death of glial progenitors from the chick retina in culture. Here, by using an enriched retinal glial cell culture, we characterized some mechanisms underlying glial death promoted by cannabinoids. Methods and Results: Retinal cultures obtained from chick embryos with 8 days (E8) and maintained for 12-15 days (C12-15) were used. MTT assays revealed that the CB1/CB2 agonist WIN-55,212-2 (WIN) decreased cell viability in the cultures in a time-dependent manner, with a concomitant increase in extracellular LDH activity, suggesting membrane integrity loss. Cell death was also dose-dependently induced by cannabidiol (CBD), Δ9-tetrahydrocannabinol (THC) and CP55940, another CB1/CB2 agonist. WIN-treated cultures showed glial cells with large vacuoles in cytoplasm that were absent in cultures incubated with WIN plus 4-phenyl-butyrate (PBA), a chemical chaperone. Since cannabinoids induced the phosphorylation of eukaryotic initiation factor 2-alfa (eIF2α), these results suggest a process of endoplasmic reticulum (ER) swelling and stress. Incubation of the cultures with WIN for 4 h induced a ~5-fold increase in the number of cells labeled with the ROS indicator CM-H2DCFDA. WIN induced the phosphorylation of JNK, but not of p38 in the cultures and also induced an increase in the number of glial cells expressing cleaved-caspase 3 (c-CASP3). The decrease in cell viability and the expression of c-CASP3 was blocked by salubrinal, an inhibitor of eIF2α dephosphorylation. Conclusion: These data suggest that cannabinoids induce the apoptosis of glial cells in culture by promoting ROS production, ER stress, JNK phosphorylation and caspase-3 processing.
Keywords:
cannabinoids
; retina
; Müller glia
; oxidative stress
; ER stress
; apoptosis
1. Introduction
The retina contains a major type of glia, the Müller cell, that extends the entire thickness of the tissue, with its cell body located in the inner nuclear layer and its lateral processes expanding in the synaptic plexiform layers. In the adult tissue, Müller cells are involved in the control of extracellular milieu by, for example, regulating levels of K+, H+ and neurotransmitters. While this cell type expresses a variety of channels and transporters, they release several mediators considered as gliotransmitters such as ATP, D-serine and glutamate. They also express many neurotransmitter receptors such as receptors for nucleotides, glutamate, dopamine and GABA, among others [1,2,3,4].
Müller glia is the last cell type generated in the developing retina and it is considered as a potential source of neurons since after a cytotoxic insult that induces the death of a substantial amount of retinal neurons, Müller cells dedifferentiate and generate proliferating progenitor-like cells [5].
The two major endogenous ligands N-arachidonoylethanolamide (anandamide, AEA) and 2-arachidonoylglycerol (2-AG), together with receptors and enzymes of synthesis and hydrolysis constitute the functional endocannabinoid system present in the neural tissue. In brief, while phospholipase D converts N-arachidonoyl phosphatidylethanolamine (NAPE) in AEA + phosphatidic acid, 2-AG synthesis occurs through the hydrolysis of diacyl glycerol by DAG lipases (DAGL). AEA and 2AG are metabolized by several enzymes, especially fatty acid amide hydrolase (FAAH) and monoacylglycerol lipase (MGL) [6]. Cannabinoids can activate at least two G-protein coupled receptors, namely CB1 and CB2 receptors, both negatively coupled to adenylate cyclase [7].
The presence of cannabinoid ligands, receptors and enzymes was demonstrated in the retina of several species including the chick retina. The cannabinoid degradation enzymes FAAH, MGL and COX-2, as well as the synthetic enzymes phospholipase D and DAGL are found in almost all retinal neurons and glia [8]. Similarly, both CB1 and CB2 receptors are expressed in several types of neurons of the vertebrate retina, as well as in glia Müller cells [8,9,10,11]. Expression of both receptors was also characterized in the chick embryo retina [12] and developing retinal neuronal and glial progenitors in culture [13,14]. In chick retinas, cannabinoids induce the de-differentiation of Muller cells and proliferation of glia-derived progenitors [15]. In chick embryo retinal cultures, the cannabinoid agonist WIN 55,212-2 (WIN) inhibits the formation of cyclic AMP and the release of GABA from retinal cells in culture [13].
Both neuroprotective and neurotoxic profile were described for cannabinoids in the retina. Consistent evidence showed the neuroprotective role of cannabinoids in several retinal disease models. For example, activation of CB1 receptor by the agonist HU210 afforded neuroprotection to cholinergic amacrine and rod bipolar cells submitted to chemical ischemia [16]. AMPA-induced excitotoxicity to horizontal cells and bNOS, ChAT and GABA expressing amacrine cells was attenuated when cannabinoids were intravitreally co-administered with the glutamatergic agonist [17]. Moreover, both tetrahydroxycannabinol (THC) and the non-CB1 agonist cannabidiol (CBD), as well as the synthetic cannabinoid WIN55,212-2, were shown to protect the retina from NMDA excitotoxicity [18,19]. However, no effect of CB2 receptor agonist was observed against AMPA-induced excitotoxicity, suggesting that the CB1 was the major receptor responsible for the neuroprotective effect of cannabinoids against AMPA excitotoxicity. In this excitotoxicity model, 2AG also protected retinal neurons via CB1 receptor and PI3K/Akt signaling pathway [17].
Neuroprotection by CB1 receptor activation was also highlighted in other retinal disease models. In an in vivo model of glaucoma, intravitreal injection of MethAEA rescued retinal ganglion cells (RGC) via activation of CB1 receptors and TRPV1 channels [20]. In streptozotocin model of diabetic retinopathy, CBD treatment provided neuroprotection to inner retinal neurons [21].
As opposed to the neuroprotective role in retinal disease models mentioned above, some previous data pointed to a cytotoxic effect of cannabinoids in retinal diseases. Treatment of streptozotocin-induced diabetic mice with the CB1 receptor antagonist SR141716A (rimonabant) or genetic ablation of CB1 receptors prevented cell death in the retina by attenuating oxidative stress and activation of the pro-apoptotic p38/Jun N-terminal kinase [22]. In retinal pigmented epithelium cells, CB2 receptor activation increases the production of IL-6 and IL8 pro-inflamatory cytokynes and photoreceptor degeneration [23]. CB1 receptor antagonist SR141716A also prevents photoreceptor cell death in a light-induced retinal degeneration model [24].
Cannabinoids can also be deleterious to retinal progenitors in the developing tissue. While the synthetic cannabinoid WIN55,212-2 decreases the incorporation of [3H]-thymidine and the population of cells expressing proliferating cell nuclear antigen (PCNA) in chick embryo retina cell cultures, it induces the death of 2M6-positive cells in culture, suggesting that cannabinoids are cytotoxic to glial progenitors [14] (Freitas et al., 2019). In the present work, we used an enriched chick retina glial cell monolayer culture to characterize the mechanisms underlying the deleterious effect of synthetic and the two phytocannabinoids CBD and THC in glial Müller cells. We show that cannabinoids increase intracellular levels of ROS, endoplasmic reticulum (ER) swelling, phosphorylation of eIF2α and JNK, activation of caspase-3 and retinal glia death.
2. Materials and Methods
2.1. Materials
Fertilized white Leghorn eggs (Gallus gallus domesticus) were purchased from a local hatchery. Monoclonal mouse anti-2M6 antisera specific for avian retinal Müller glial cells (Schlosshauer et al., 1991) was kindly provided by Dr. B. Schlosshauer (Max-Planck-Institute, Tübingen, Germany). WIN55,212-2 (WIN), Salubrinal, and mouse anti-α-tubulin were from Sigma-Aldrich (São Paulo, Brazil); 4-Phenyl-Butyrate (4-PBA), cannabidiol (CBD), Δ9-tetrahydrocannabinol (THC) and CP 55,940 were from Cayman Chemical Co. Rabbit anti-cleaved-caspase 3 (catalog # 9664) and anti-phospho-SAPK/JNK (catalog. # 4668) were from Cell Signaling Technology (MA, USA). Anti-phospho-P38 (catalog # sc-17852) was from St. Cruz Biotech. MEM, Fetal Bovine Serum, CM-H2DCFDA, Alexa Fluor 488 goat anti-mouse and Alexa Fluor 568 goat anti-rabbit were from Thermo Fisher Scientific (São Paulo, Brazil). All other reagents were of analytical grade.
2.2. Retinal Glial Cell Enriched Monolayer Cultures
Embryos were staged according to [25] and retinal cell monolayer cultures prepared essentially as described by [26] with minor modifications. In brief, chick embryos at embryonic day 8 (E8) were killed instantaneously by decapitation and the eyes removed and immediately transferred to Ca2+- and Mg2+-free balanced salt solution (CMF) where the retinas were dissected from other structures. Trypsin at a final concentration of 0.1% was then added to the tissues and the suspension incubated at 37oC for 20– 25 min. Trypsin solution was removed and the retinas suspended in MEM containing 5% fetal calf serum, 2 mM glutamine, 100 U/ml penicillin and 100 mg/mL streptomycin. Tissues were mechanically dissociated by successive aspirations of the medium before counting. For 3-(4, 5-dimethylthiazolyl-2)-2, 5-diphenyltetrazolium bromide (MTT) or extracellular Lactate Dehydrogenase (LDH) activity experiments, cells were seeded on 24-well dishes at a density of 1.5 x 10⁶ cells/well. For immunofluorescence, cells were seeded on coverslips inside culture dishes at a density of 5 x 10⁶ cells/dish (5.2 x 10³ cells/mm2). For western blotting experiments, 107 cells were seeded on 35 mm culture dishes (1.04 x 10⁴ cells/mm2). Cells were then incubated at 37oC for 10 -14 days (E8C10 - E8C14), in humidified atmosphere of 95% air / 5% CO2. Culture medium was changed every other day. Retinal cultures were treated with cannabinoids for 3 h (H2DCFDA for detection of ROS) or 24 h (viability, western blotting and immunofluorescence experiments).
2.3. MTT Viability Assay
Cell viability was determined by the MTT reduction method first described by [27] and reproduced in chick retinal cultures by [28]. Briefly, cultures were incubated at 37o C with 1 mg/mL of MTT in MEM buffered with 25 mM HEPES, pH 7.4, without serum. After 20 min, medium was removed and formazan product was dissolved with a mixture of HCl/isopropanol and estimated by the absorbance at 550 nm after subtracting absorbance at 650 nm.
2.4. Extracellular LDH Activity Assay
Extracellular LDH activity was determined by using the LDH Liquiform Kit according to the manufacturer instructions (Labtest, MG, Brazil). Briefly, samples of the culture medium (15 µL) were incubated in black 96-well dishes with 200 µL of a mixture of NADH and pyruvate. Oxydation of NADH in samples was measured by UV absorbance (340 nm) in a BioTek Synergy H1 plate reader (Agilent Tech., U.S.A.). Absorbance was measured at 1 min (A1), 3 min (A2) and 5 min (A3) after the addition of the reagents in order to verify linearity of the reaction. The decreases in absorbance (A1 – A2)/2 or (A1 – A3)/4 were calculated. LDH activity was expressed as arbitrary units/min/culture. Culture medium containing 5% serum was used as control (blank).
2.5. Immunocytochemistry
Coverslips with retinal cultures from 8-day-old embryos maintained for 12-14 days (E8C12-14) were washed with phosphate-buffered saline (PBS) and fixed for 15 min in 0.16 M phosphate buffer, pH 7.6 with 4 % paraformaldehyde. After three washes of 5 min with PBS, pH 7.6, cells were permeabilized with 0.25 % triton X-100 for 30min. Nonspecific sites were blocked by incubating cells for 60 min in PBS/Triton X-100 containing 0.1 % NGS and 5 % bovine serum albumin (BSA). Cells were incubated overnight at 4 °C with anti-2M6 (1:200), anti-cleaved caspase-3 (Asp175) (1:100) or anti-alfa-tubulin (1:2000) primary antibodies. Cultures were washed and incubated with Alexa secondary antibody (1:200) for 2 h at room temperature. Nuclei were counterstained with DAPI or Hoechst 34580 and cells examined and photographed with Leica SP5 confocal microscope.
2.6. Western Blotting
Sample buffer without bromophenol blue (62.5 mM Tris-HCl, pH 6.8, containing 10 % glycerol, 2 % sodium dodecyl sulfate (SDS), and 5% 2-mercaptoethanol) was added to control or treated retina cultures (E8C13) and cell extracts boiled for 10 min. Protein content in 2 μL samples of extracts was estimated by the Bradford protein assay (1976), using BSA solution plus 2 μL sample buffer as standard. After addition of bromophenol blue (0.02%), protein extracts (50 µg/ lane) were size-fractionated on 9% SDS polyacrylamide gel, transferred to PVDF membranes (Thermo Fisher), stained with Ponceau red and blocked in Tris-buffered saline (pH 7.6) with 0.1% Tween-20 and 5% non-fat milk. Membranes were incubated with anti-phospho-SAPK/JNK (1:1000) or anti-phospho-P38 (1:1000) overnight at 4° C. Membranes were rinsed and incubated with anti-rabbit peroxidase–conjugated secondary antibody (1:4000 in TTBS; Sigma- Aldrich) for 2 h at room temperature. Following 2 washes with TTBS and 1 wash with TBS, labeling was detected by enhanced chemiluminescence, according to the manufacturer’s protocol (ECL prime, Thermo Fisher). Blots were re-probed with anti-tubulin antiserum (1:100,000 in TTBS; Sigma-Aldrich) for 1 h at room temperature, rinsed in TTBS and incubated with anti-mouse peroxidase–conjugated secondary antibody for 45 min at room temperature. Following three washes (10 min each), the labeling was detected with the ECL kit. The intensities of labeled bands were quantified by using TotalLab TL120 1D software.
2.7. Detection of ROS by CM-H2DCFDA Fluorescence
Intracellular reactive oxygen species (ROS) accumulation was evaluated in live cells using using a chloromethyl derivative of H2DCFDA, CM-H2DCFDA (Thermo Fisher), which is useful as an indicator for ROS in cells, as indicated by the manufacturer. Cultured cells at E8C13 were incubated with cannabinoids for 3 h, washed 3 times with Hanks’ balanced salt solution (128 mM NaCl, 4 mM KCl, 1 mM Na2HPO4, 0.5 mM KH2PO4, 1 mM MgCl2, 3 mM CaCl2, 20 mM HEPES, 12 mM glucose, pH 7.4) and incubated with 10 μM CM-H2DCFDA in Hanks’ for 20 min at 37° C in the dark. In the last 5 min of incubation, cell nuclei were labeled with Hoechst 34580. Cells were washed three times with Hanks’ solution and coverslips were mounted in an imaging chamber (Warner Instruments). Glia fluorescent cells were observed and photographed with a confocal SP5 microscope using the 488 laser line and an emission bandwidth of 503-558 nm for H2DCFDA fluorescence. The 405 laser line was used to determine Hoechst positive nuclei. At least 10 fields were photographed for each coverslip. The proportion of ROS positive cells was obtained by dividing the number of green fluorescent cells/Hoechst nuclei in each field.
2.8. Data Analysis
The statistical analysis was performed by analysis of variance (ANOVA) and Bonferroni’s multiple comparison test using GraphPad Prism software. Significance was set at p< 0.05 and results are expressed as the mean ± S.E.M of 3 or more independent experiments performed in duplicate or triplicate.
3. Results
Recently, we have shown that the synthetic cannabinoid WIN55,212-2 is able to induce, in a dose-dependent manner, the death of glial progenitors in developing retinal cultures at E7C2 [14]. In order to verify if cannabinoids could also affect the viability of more differentiated Müller glia cells in culture, the effect of WIN on cell viability in cultures at E8C13 was investigated. The effect of the phytocannabinoids CBD and THC, as well as the synthetic compound CP 55,940 was also studied (Figure 1). Cultures were incubated with 1 µM WIN or increasing concentrations of CBD (Figure 1A), THC (Figure 1B) or CP 55940 (Figure 1C) for 24 h before MTT assay. A dose-dependent loss of cell viability was observed with the three compounds and significant decreases were observed using 10 µM or higher concentrations of the cannabinoids.
The decrease in cell viability induced by 1 µM WIN (Figure 2A) or 10 µM CBD (Figure 2B) was also time-dependent. Significant decreases of cell viability were observed after 20 h or 24 h of incubation with WIN (~24.4% and 35%) or CBD (~73% and 84%). The decrease in MTT reduction observed in cultures incubated with 1 µM WIN and 10 µM CBD was accompanied by an increase in LDH activity in culture medium. After incubations with WIN or CBD for 24 h, LDH activity increased approximately 6- and 9.5-fold in the medium, respectively.
WIN-treated cultures at E8C13 showed the majority of glial cells with large vacuoles in their cytoplasm (Figure 3) that could not be labeled with 5 µM quinacrine (data not shown), discarding that they were acidic vesicles or lysosomes. CBD-treated cultures also presented cytoplasmic vesicles (data not shown). However, both the number and size of these vacuoles were smaller than those observed in WIN-treated cultures.
Cannabinoids can induce the stress of endoplasmic reticulum (ER) followed by the unfolded protein response (UPR) in several cell types such as breast and non-melanoma skin cancer cells [29,30] as well as endometrial stromal and choriocarcinoma cells [31,32], among others. In order to characterize if the cytoplasmic vacuoles observed in WIN-treated glial cells were due to endoplasmic reticulum (ER) stress induced by the cannabinoid, coverslips with cultures at E8C12 were treated with 1 µM WIN in the presence or absence of 50 µM 4-phenyl-butyrate (4-PBA), a chemical chaperone. After 24 h, cultures were fixed and labeled for 2M6, an avian glial specific marker (Figure 4). As can be noticed, glial cells from cultures treated with 1 µM WIN showed large vesicles mainly at the periphery of the cytoplasm and with the intracellular 2M6 labeling accumulated near the cell nucleus. No visible structures inside vacuoles were noticed. In contrast, treatment of the cultures with WIN in the presence of 50 µM 4-PBA decreased substantially the amount and size of vacuoles inside glial cells. Also, 2M6 labeling was much more uniform in glial cytoplasm. Cultures treated only with 4-PBA showed 2M6 labeling similar to the control cultures.
ER homeostasis can be disrupted by several conditions such as nutrient depletion, viral infections, fluctuations in calcium, inflammatory cytokines, oxidative stress, among others [33,34]. Since some cannabinoids such as CBD induce reactive oxygen species [35], the effect of WIN, CBD and THC on intracellular ROS content was investigated. Cells cultivated on coverslips (E8C10-12) were incubated with 1µM WIN or 10 µM CBD or 10 µM THC for 3 h, washed 3 x with 1 mL Hanks solution and incubated with 10 µM of the CM-H2DCFDA probe for 20 min, at 37o C. Cells were quickly photographed for H2DCFDA and Hoechst fluorescence on a confocal microscope and counted. Treatment of the cultures with WIN induced a significant increase in the percentage of ROS positive glial cells (Figure 5). While 11.3 ± 1.2% of glial cells were labeled for H2DCFDA in control cultures, 60.8 ± 6.1% of glial cells were labeled in the WIN-treated cultures. Increases of 25.1 ± 5.6% and 21.8 ± 5.6% in the percentage of H2DCFDA-labeled cells were also observed in CBD- and THC-treated cultures, respectively. However, these increases were not statistically significant.
UPR involves activation of three main ER resident membrane proteins, including Protein kinase RNA-like ER kinase (PERK) that phosphorylates the eukaryotic initiation factor 2-alfa (eIF2α), causing inhibition of the general cap-dependent protein translation [36]. In order to verify if cannabinoids induced UPR in the cells, retinal cultures ate E8C13 were treated with WIN, CBD or THC for 24 h and the amount of phospho-eIF2α determined by western blotting (Figure 6). While WIN induced a ~2.3-fold stimulation, CBD and THC also significantly increased eIF2α phosphorylation by 2.1- and 1.8-fold, respectively.
Under UPR, ER resident protein IRE1α dimerizes and auto-phosphorylates, leading to several events such as activation of c-Jun N terminal kinase (JNK) [37]. In order to verify if the detected ER stress induced by cannabinoids activated JNK, cultures at E8C13 were incubated with 1µM WIN or 10 µM CBD and THC for 24 h and the amount of phospho-JNK and phospho-p38 (another stress-activated kinase) was determined by western blotting. As shown in Figure 7A, an increase of almost 5-fold in the phosphorylation of JNK, but not in p-38 phosphorylation, was observed in WIN-treated cultures. Both CBD and THC also increased JNK phosphorylation (Figure 7B).
ER stress and JNK activation can influence cell death machinery to process caspase and execute apoptosis [36]. In order to verify if cannabinoid-dependent ER stress induced glial cell apoptosis, cultures at E8C13 were treated with 1 µM WIN for 24 h, fixed and processed for detection of cleaved-caspase 3 (c-CASP3) by immunocytochemistry (Figure 8). While in control cultures, c-CASP3 labeled cells were rarely noticed, ER stressed glial cells presenting c-CASP3 labeling were quite frequently noticed in WIN-treated cultures.
GADD34 is a protein that interacts with protein phosphatase 1(PPL1) that dephosphorylates eIF2α and causes the release of the translational block. GADD34 expression correlates with apoptosis by yet unknown mechanisms and inhibition of eIF2α dephosphorylation by salubrinal reduces ER-stress-mediated apoptosis [38]. The effect of salubrinal on the decrease of cell viability induced by WIN is shown in Figure 9. Cultures at E8C13 were incubated with 1 µM WIN in the presence or not of 50 µM salubrinal for 24 h. Both the decrease in cell viability (Figure 9A) and increase in extracellular LDH activity (Figure 9B) were significantly attenuated by salubrinal. Moreover, the expression of c-CASP3 in 2M6+ positive glial cells observed in cultures at E8C14 that were treated with WIN for 24 h was also attenuated (Figure 10). Very few glial cells labeled for c-CASP3 were detected in the cultures treated with 1 µM WIN plus 50 µM salubrinal.
4. Discussion
Both protective and detrimental effects of cannabinoids were described so far, depending on the type of cell in which they are acting. For example, while in glioblastoma cells, cannabinoids induce toxic effects [39], cannabinoids seem to be neuroprotective in neuronal populations of the retina [16]. Previously, in developing retinal cell cultures, we also detected a decrease in glia progenitors viability promoted by the cannabinoid agonist WIN55,212-2 [14]. In the present work, we characterized the effect of synthetic and phytocannabinoids on cell viability in a glia enriched retinal cell culture model. Our data show that cannabinoids at concentrations higher than 10 µM induce a significant decrease in the viability of cultured cells. Moreover, the cytotoxic effect of WIN and CBD is also time-dependent and 6-8 h after the addition of the cannabinoid, an increase in LDH activity is observed in the culture medium, suggesting that the decrease in cell viability in the cultures is accompanied by a late loss of cellular plasma membrane integrity.
The endoplasmic reticulum is an organelle with abundant chaperones that bind to newly synthetized proteins, ensuring their proper folding and/or maturation and preventing them from aggregation [40]. In tumor cells, accumulation of misfolded proteins in the ER lumen due to perturbations in cellular Ca2+ and/or ROS homeostasis can result in ER expansion and appearance of cytoplasmic vacuoles due to driving osmotic pressure bringing water from the cytoplasm [41]. The present results reveal that cultures treated with WIN for 24 h show glial cells with their cytoplasm containing large vesicles or vacuoles inside that are not clearly detected in CBD or THC-treated cultures. CBD or THC treatment promotes the appearance of only small vacuoles inside these cells. Since the compound 4-PBA which is a well-known chemical chaperone [42] decreases substantially the amount and size of vacuoles inside glial cells in cultures treated with WIN, our results strongly suggest that this cannabinoid induces the swelling of glial endoplasmic reticulum. This hypothesis is also supported by the observation that cannabinoids induce the phosphorylation of eIF2α, a protein that is phosphorylated by PERK after ER stress. Similar to our results are the observations that cannabinoids including WIN55,212-2 induce ER dilation and cytoplasm vacuolization in several tumor cells [43].
ER stress can be induced by different conditions, including elevated ROS production [33,34]. Our data show that treating retinal glia enriched cultures with cannabinoids induces an increase in the number of glial cells expressing high levels of ROS-sensitive dye fluorescence. Moreover, the percentage of cells with increased levels of ROS is higher in WIN-treated cultures than those stimulated with CBD or THC, suggesting that the oxidative stress induced by WIN was higher or faster than the one promoted by CBD or THC. Based on these observations, it seems reasonable to suppose that at least the WIN-mediated decrease in glia viability is related to the increase in oxidative and ER stress in the cultured glia cells. However, the underlying molecular mechanisms activated by cannabinoids that generate these stress responses deserve to be further explored. A strong interplay between ROS and ER stress in cannabinoid-induced cell apoptosis in many experimental tumor models was detected [33].
Three distinct pathways to apoptosis are known: receptor-mediated pathway, mitochondrial pathway and ER stress induced pathway [44]. Our present results show that WIN promotes the phosphorylation of JNK, but not of P38. Both CBD and THC also induce the phosphorylation of JNK, suggesting that cannabinoids activate this MAP kinase in the retinal glial cell cultures. Our data also show that WIN induces the expression of cleaved-CASP-3 in glial cells in the cultures, suggesting that cannabinoids decrease the viability of cultured glia cells by inducing apoptosis. Since our data show that cannabinoids induce ER stress in cultured glial cells, it is reasonable to propose that cannabinoids activate ER stress induced pathway of apoptosis that may involve the activation of JNK pathway. UPR that follows ER stress involves activation of IRE1α [34] that dimerizes and auto-phosphorylates, leading to events such as activation of tumor necrosis factor receptor associated factor 2 (TRAF2) that can stimulate the apoptosis signal-regulating kinase 1 (ASK1)/JNK pathway [37]. Accordingly, previous data showed that activation of JNK can activate pro-apoptotic proteins BAX and BAK as well as inhibit the protective protein Bcl-2 in tumor cells [45,46,47]. In the retina, activation of JNK is involved in retinal cell excitotoxicity and inhibition of this enzyme attenuates cell death in this tissue [48,49,50,51]. Recently, it was shown that all-trans-retinal causes ER stress and JNK activation, facilitating photoreceptor cell apoptosis via caspase-3 activation and DNA damage [52]. In human epithelial pigment cells, silver nanoparticles induce apoptosis through endoplasmic reticulum stress response and IRE1-mediated ASK1/JNK/Mcl-1 pathway activation [53].
Cannabinoids induce cell death associated with JNK phosphorylation in several cell types, including PC12 cells and colorectal cancer cells [54,55]. Here, we performed experiments with pharmacological inhibitors of JNK activity to prevent cannabinoid-dependent decrease in cell viability but no consistent attenuation in the decreased cell viability was obtained (data not shown). Thus, the role of JNK in cannabinoid-induced decrease in glial viability is a point that requires clarification. RNAi and similar techniques could be helpful to define this point.
Phosphorylation of eIF2α promotes blockade of cap-dependent translation in cells under ER stress. It has a major role in the cytoprotective gene expression program known as the integrated stress response (ISR), responsible for the ability of cells to adapt to ER stress [56,57,58,59]. Interaction of GADD34 with protein phosphatase 1 (PPL1) dephosphorylates p-eIF2α, causing the release of the translational block and cell death. Salubrinal is a small molecule that inhibits p-eIF2α dephosphorylation and protects cells against ER-stress mediated apoptosis [38]. The present results show that salubrinal is capable of blocking the decrease in cell viability as well as the increase in cleaved-CASP3 expression in cultured glial cells exposed to WIN55,212-2, suggesting that phosphorylation of eIF2α increases the survival of glial cells under cannabinoid-dependent ER stress. In good agreement with this idea is the observation that salubrinal improves photoreceptor survival in the P23H-1 transgenic rat model of retinitis pigmentosa where mutated rhodopsin misfolding and aggregation causes ER stress and UPR activation [60]. Also, our data is also similar to previous results showing that salubrinal inhibits apoptosis of ARPE-19 cells treated with all-trans-retinoic acid, a compound that promotes oxidative and ER stress in this cell line [61].
5. Conclusions
The data presented here shows that cannabinoids have a deleterious effect on cultured retinal Müller cells. They suggest that cannabinoids induce the apoptosis of glial cells in culture by promoting ROS production, ER stress, JNK phosphorylation and caspase-3 processing.
Funding
This work was supported by grants from Fundação Carlos Chagas Filho de Amparo à Pesquisa do Estado do Rio de Janeiro (FAPERJ- E26-210.977/2019), Conselho Nacional de Desenvolvimento Científico e Tecnológico (CNPq-303018/2016–0) and Pró-reitoria de Pesquisa, Pós-graduação e Inovação (Proppi-UFF) to A.L.M.V.. During this work, T.M.S. was recipient of post-doctoral fellowship from FAPERJ.
Author’s contributions
Conceived and designed the experiments: ALMV, TMS, GRF; Performed experiments: TMS, GRF, ALMV. Analyzed the data: GRF, TMS, ALMV; Manuscript writing: ALMV. All authors contributed to the article and approved the submitted version.
Institutional Review Board
Experiments were carried out according to the rules issued by the National Council for Control of Animal Experimentation (CONCEA) and approved by the Ethics Committee for Animal Research of the Federal Fluminense University (CEUA, protocol number 806141221).
Data Availability Statement
All data and materials used are available from the corresponding author upon reasonable request.
Acknowledgments
We would like to thank Sarah A. Rodrigues for technical assistance.
Conflicts of Interest
Authors declare no conflict of interest.
References
- Bringmann, A.; Wiedemann, P. Müller Glial Cells in Retinal Disease. Ophthalmologica 2011, 227. [Google Scholar] [CrossRef]
- Kubrusly, R.C.C.; Da Cunha, M.C.C.; De Melo Reis, R.A.; Soares, H.; Ventura, A.L.M.; Kurtenbach, E.; De Mello, M.C.F.; De Mello, F.G. Expression of Functional Receptors and Transmitter Enzymes in Cultured Muller Cells. Brain Res 2005, 1038. [Google Scholar] [CrossRef]
- De Melo Reis, R.A.; Ventura, A.L.M.; Schitine, C.S.; De Mello, M.C.F.; De Mello, F.G. Müller Glia as an Active Compartment Modulating Nervous Activity in the Vertebrate Retina: Neurotransmitters and Trophic Factors. Neurochem Res 2008, 33. [Google Scholar] [CrossRef]
- Ventura, A.L.M.; dos Santos-Rodrigues, A.; Mitchell, C.H.; Faillace, M.P. Purinergic Signaling in the Retina: From Development to Disease. Brain Res Bull 2019, 151. [Google Scholar] [CrossRef] [PubMed]
- Fischer, A.J.; Reh, T.A. Müller Glia Are a Potential Source of Neural Regeneration in the Postnatal Chicken Retina. Nat Neurosci 2001, 4. [Google Scholar] [CrossRef] [PubMed]
- Bisogno, T.; Ligresti, A.; Di Marzo, V. The Endocannabinoid Signalling System: Biochemical Aspects. In Proceedings of the Pharmacology Biochemistry and Behavior; 2005; Vol. 81. [Google Scholar]
- Vogel, Z.; Barg, J.; Levy, R.; Saya, D.; Heldman, E.; Mechoulam, R. Anandamide, a Brain Endogenous Compound, Interacts Specifically with Cannabinoid Receptors and Inhibits Adenylate Cyclase. J Neurochem 1993, 61. [Google Scholar] [CrossRef]
- Schwitzer, T.; Schwan, R.; Angioi-Duprez, K.; Giersch, A.; Laprevote, V. The Endocannabinoid System in the Retina: From Physiology to Practical and Therapeutic Applications. Neural Plast 2016, 2016. [Google Scholar] [CrossRef] [PubMed]
- Yazulla, S.; Studholme, K.M.; McIntosh, H.H.; Fan, S.F. Cannabinoid Receptors on Goldfish Retinal Bipolar Cells: Electron- Microscope Immunocytochemistry and Whole-Cell Recordings. Vis Neurosci 2000, 17. [Google Scholar] [CrossRef]
- Cécyre, B.; Zabouri, N.; Huppé-Gourgues, F.; Bouchard, J.F.; Casanova, C. Roles of Cannabinoid Receptors Type 1 and 2 on the Retinal Function of Adult Mice. Invest Ophthalmol Vis Sci 2013, 54. [Google Scholar] [CrossRef] [PubMed]
- Straiker, A.; Stella, N.; Piomelli, D.; Mackie, K.; Karten, H.J.; Maguire, G. Cannabinoid CB1 Receptors and Ligands in Vertebrate Retina: Localization and Function of an Endogenous Signaling System. Proc Natl Acad Sci U S A 1999, 96. [Google Scholar] [CrossRef] [PubMed]
- da Silva Sampaio, L.; Kubrusly, R.C.C.; Colli, Y.P.; Trindade, P.P.; Ribeiro-Resende, V.T.; Einicker-Lamas, M.; Paes-de-Carvalho, R.; Gardino, P.F.; de Mello, F.G.; De Melo Reis, R.A. Cannabinoid Receptor Type 1 Expression in the Developing Avian Retina: Morphological and Functional Correlation with the Dopaminergic System. Front Cell Neurosci 2018, 12. [Google Scholar] [CrossRef]
- Kubrusly, R.C.C.; Günter, A.; Sampaio, L.; Martins, R.S.; Schitine, C.S.; Trindade, P.; Fernandes, A.; Borelli-Torres, R.; Miya-Coreixas, V.S.; Rego Costa, A.C.; et al. Neuro-Glial Cannabinoid Receptors Modulate Signaling in the Embryonic Avian Retina. Neurochem Int 2018, 112. [Google Scholar] [CrossRef] [PubMed]
- Freitas, H.R.; Isaac, A.R.; Silva, T.M.; Diniz, G.O.F.; dos Santos Dabdab, Y.; Bockmann, E.C.; Guimarães, M.Z.P.; da Costa Calaza, K.; de Mello, F.G.; Ventura, A.L.M.; et al. Cannabinoids Induce Cell Death and Promote P2X7 Receptor Signaling in Retinal Glial Progenitors in Culture. Mol Neurobiol 2019, 56. [Google Scholar] [CrossRef] [PubMed]
- Campbell, W.A.; Blum, S.; Reske, A.; Hoang, T.; Blackshaw, S.; Fischer, A.J. Cannabinoid Signaling Promotes the De-Differentiation and Proliferation of Müller Glia-Derived Progenitor Cells. Glia 2021, 69. [Google Scholar] [CrossRef]
- Kokona, D.; Georgiou, P.C.; Kounenidakis, M.; Kiagiadaki, F.; Thermos, K. Endogenous and Synthetic Cannabinoids as Therapeutics in Retinal Disease. Neural Plast 2016, 2016. [Google Scholar] [CrossRef]
- Kokona, D.; Thermos, K. Synthetic and Endogenous Cannabinoids Protect Retinal Neurons from AMPA Excitotoxicity Invivo, via Activation of CB1 Receptors: Involvement of PI3K/Akt and MEK/ERK Signaling Pathways. Exp Eye Res 2015, 136. [Google Scholar] [CrossRef] [PubMed]
- El-Remessy, A.B.; Khalil, I.E.; Matragoon, S.; Abou-Mohamed, G.; Tsai, N.J.; Roon, P.; Caldwell, R.B.; Caldwell, R.W.; Green, K.; Liou, G.I. Neuroprotective Effect of(-)Δ9-Tetrahydrocannabinol and Cannabidiol in N-Methyl-D-Aspartate-Induced Retinal Neurotoxicity: Involvement of Peroxynitrite. American Journal of Pathology 2003, 163. [Google Scholar] [CrossRef] [PubMed]
- Maguire, G.; Eubanks, C.; Ayoub, G. Neuroprotection of Retinal Ganglion Cells in Vivo Using the Activation of the Endogenous Cannabinoid Signaling System in Mammalian Eyes. Neuronal Signal 2022, 6. [Google Scholar] [CrossRef] [PubMed]
- Nucci, C.; Gasperi, V.; Tartaglione, R.; Cerulli, A.; Terrinoni, A.; Bari, M.; De Simone, C.; Agrò, A.F.; Morrone, L.A.; Corasaniti, M.T.; et al. Involvement of the Endocannabinoid System in Retinal Damage after High Intraocular Pressure-Induced Ischemia in Rats. Invest Ophthalmol Vis Sci 2007, 48. [Google Scholar] [CrossRef]
- El-Remessy, A.B.; Al-Shabrawey, M.; Khalifa, Y.; Tsai, N.T.; Caldwell, R.B.; Liou, G.I. Neuroprotective and Blood-Retinal Barrier-Preserving Effects of Cannabidiol in Experimental Diabetes. American Journal of Pathology 2006, 168. [Google Scholar] [CrossRef]
- El-Remessy, A.B.; Rajesh, M.; Mukhopadhyay, P.; Horváth, B.; Patel, V.; Al-Gayyar, M.M.H.; Pillai, B.A.; Pacher, P. Cannabinoid 1 Receptor Activation Contributes to Vascular Inflammation and Cell Death in a Mouse Model of Diabetic Retinopathy and a Human Retinal Cell Line. Diabetologia 2011, 54. [Google Scholar] [CrossRef] [PubMed]
- Hytti, M.; Andjelic, S.; Josifovska, N.; Piippo, N.; Korhonen, E.; Hawlina, M.; Kaarniranta, K.; Nevalainen, T.J.; Petrovski, G.; Parkkari, T.; et al. CB2 Receptor Activation Causes an ERK1/2-Dependent Inflammatory Response in Human RPE Cells. Sci Rep 2017, 7. [Google Scholar] [CrossRef] [PubMed]
- Imamura, T.; Tsuruma, K.; Inoue, Y.; Otsuka, T.; Ohno, Y.; Ogami, S.; Yamane, S.; Shimazawa, M.; Hara, H. Rimonabant, a Selective Cannabinoid1 Receptor Antagonist, Protects against Light-Induced Retinal Degeneration in Vitro and in Vivo. Eur J Pharmacol 2017, 803. [Google Scholar] [CrossRef]
- Hamburger, V.; Hamilton, H.L. A Series of Normal Stages in the Development of the Chick Embryo. J Morphol 1951, 88. [Google Scholar] [CrossRef]
- Freitas, H.R.; Ferraz, G.; Ferreira, G.C.; Ribeiro-Resende, V.T.; Chiarini, L.B.; Nascimento, J.L.M.D.; Oliveira, K.R.H.M.; De Pereira, T.L.; Ferreira, L.G.B.; Kubrusly, R.C.; et al. Glutathione-Induced Calcium Shifts in Chick Retinal Glial Cells. PLoS One 2016, 11. [Google Scholar] [CrossRef] [PubMed]
- Mosmann, T. Rapid Colorimetric Assay for Cellular Growth and Survival: Application to Proliferation and Cytotoxicity Assays. J Immunol Methods 1983, 65. [Google Scholar] [CrossRef] [PubMed]
- Anccasi, R.M.; Ornelas, I.M.; Cossenza, M.; Persechini, P.M.; Ventura, A.L.M. ATP Induces the Death of Developing Avian Retinal Neurons in Culture via Activation of P2X7 and Glutamate Receptors. Purinergic Signal 2013, 9. [Google Scholar] [CrossRef]
- de la Harpe, A.; Beukes, N.; Frost, C.L. CBD Activation of TRPV1 Induces Oxidative Signaling and Subsequent ER Stress in Breast Cancer Cell Lines. Biotechnol Appl Biochem 2022, 69. [Google Scholar] [CrossRef]
- Soliman, E.; Henderson, K.L.; Danell, A.S.; Van Dross, R. Arachidonoyl-Ethanolamide Activates Endoplasmic Reticulum Stress-Apoptosis in Tumorigenic Keratinocytes: Role of Cyclooxygenase-2 and Novel J-Series Prostamides. Mol Carcinog 2016, 55. [Google Scholar] [CrossRef]
- Almada, M.; Costa, L.; Fonseca, B.M.; Amaral, C.; Teixeira, N.; Correia-da-Silva, G. The Synthetic Cannabinoid WIN-55,212 Induced-Apoptosis in Cytotrophoblasts Cells by a Mechanism Dependent on CB1 Receptor. Toxicology 2017, 385. [Google Scholar] [CrossRef]
- Almada, M.; Costa, L.; Fonseca, B.; Alves, P.; Braga, J.; Gonçalves, D.; Teixeira, N.; Correia-Da-Silva, G. The Endocannabinoid 2-Arachidonoylglycerol Promotes Endoplasmic Reticulum Stress in Placental Cells. Reproduction 2020, 160. [Google Scholar] [CrossRef]
- Calvaruso, G.; Pellerito, O.; Notaro, A.; Giuliano, M. Cannabinoid-Associated Cell Death Mechanisms in Tumor Models (Review). Int J Oncol 2012, 41. [Google Scholar] [CrossRef] [PubMed]
- Fazlul Kabir, M.; Kim, H.-R.; Chae, H.-J. Endoplasmic Reticulum Stress and Autophagy. In Endoplasmic Reticulum; 2019. [Google Scholar]
- Massi, P.; Vaccani, A.; Bianchessi, S.; Costa, B.; Macchi, P.; Parolaro, D. The Non-Psychoactive Cannabidiol Triggers Caspase Activation and Oxidative Stress in Human Glioma Cells. Cellular and Molecular Life Sciences 2006, 63. [Google Scholar] [CrossRef] [PubMed]
- Szegezdi, E.; Logue, S.E.; Gorman, A.M.; Samali, A. Mediators of Endoplasmic Reticulum Stress-Induced Apoptosis. EMBO Rep 2006, 7. [Google Scholar] [CrossRef] [PubMed]
- Urano, F.; Wang, X.Z.; Bertolotti, A.; Zhang, Y.; Chung, P.; Harding, H.P.; Ron, D. Coupling of Stress in the ER to Activation of JNK Protein Kinases by Transmembrane Protein Kinase IRE1. Science (1979) 2000, 287. [Google Scholar] [CrossRef] [PubMed]
- Boyce, M.; Bryant, K.F.; Jousse, C.; Long, K.; Harding, H.P.; Scheuner, D.; Kaufman, R.J.; Ma, D.; Coen, D.M.; Ron, D.; et al. A Selective Inhibitor of ElF2α Dephosphorylation Protects Cells from ER Stress. Science (1979) 2005, 307. [Google Scholar] [CrossRef]
- Buchalska, B.; Kamińska, K.; Owe-Larsson, M.; Cudnoch-Jędrzejewska, A. Cannabinoids in the Treatment of Glioblastoma. Pharmacological Reports 2024, 76. [Google Scholar] [CrossRef]
- Braakman, I.; Bulleid, N.J. Protein Folding and Modification in the Mammalian Endoplasmic Reticulum. Annu Rev Biochem 2011, 80. [Google Scholar] [CrossRef]
- Jeong, S.A.; Kim, I.Y.; Lee, A.R.; Yoon, M.J.; Cho, H.; Lee, J.S.; Choi, K.S. Ca2+ Influx-Mediated Dilation of the Endoplasmic Reticulum and c-FLIPL Downregulation Trigger CDDO-Me-Induced Apoptosis in Breast Cancer Cells. Oncotarget 2015, 6. [Google Scholar] [CrossRef] [PubMed]
- Sarvani, C.; Sireesh, D.; Ramkumar, K.M. Unraveling the Role of ER Stress Inhibitors in the Context of Metabolic Diseases. Pharmacol Res 2017, 119. [Google Scholar] [CrossRef]
- Wasik, A.M.; Almestrand, S.; Wang, X.; Hultenby, K.; Dackland, A.L.; Andersson, P.; Kimby, E.; Christensson, B.; Sander, B. WIN55,212-2 Induces Cytoplasmic Vacuolation in Apoptosis-Resistant MCL Cells. Cell Death Dis 2011, 2. [Google Scholar] [CrossRef] [PubMed]
- Wójcik, P.; Žarković, N.; Gęgotek, A.; Skrzydlewska, E. Involvement of Metabolic Lipid Mediators in the Regulation of Apoptosis. Biomolecules 2020, 10. [Google Scholar] [CrossRef] [PubMed]
- Kim, B.J.; Ryu, S.W.; Song, B.J. JNK- and P38 Kinase-Mediated Phosphorylation of Bax Leads to Its Activation and Mitochondrial Translocation and to Apoptosis of Human Hepatoma HepG2 Cells. Journal of Biological Chemistry 2006, 281. [Google Scholar] [CrossRef]
- Cheng, E.H.Y.; Wei, M.C.; Weiler, S.; Flavell, R.A.; Mak, T.W.; Lindsten, T.; Korsmeyer, S.J. BCL-2, BCL-XL Sequester BH3 Domain-Only Molecules Preventing BAX- and BAK-Mediated Mitochondrial Apoptosis. Mol Cell 2001, 8. [Google Scholar] [CrossRef]
- Sano, R.; Reed, J.C. ER Stress-Induced Cell Death Mechanisms. Biochim Biophys Acta Mol Cell Res 2013, 1833. [Google Scholar] [CrossRef] [PubMed]
- Schuster, N.; Dünker, N.; Krieglstein, K. Transforming Growth Factor-β Induced Cell Death in the Developing Chick Retina Is Mediated via Activation of c-Jun N-Terminal Kinase and Downregulation of the Anti-Apoptotic Protein Bcl-XL. Neurosci Lett 2002, 330. [Google Scholar] [CrossRef] [PubMed]
- Bessero, A.C.; Chiodini, F.; Rungger-Brändle, E.; Bonny, C.; Clarke, P.G.H. Role of the C-Jun N-Terminal Kinase Pathway in Retinal Excitotoxicity, and Neuroprotection by Its Inhibition. J Neurochem 2010, 113. [Google Scholar] [CrossRef]
- Produit-Zengaffinen, N.; Favez, T.; Pournaras, C.J.; Schorderet, D.F. JNK Inhibition Reduced Retinal Ganglion Cell Death after Ischemia/Reperfusion In Vivo and after Hypoxia In Vitro. In Advances in Experimental Medicine and Biology; 2016; Vol. 854. [Google Scholar]
- Lin, C.; Wu, F.; Zheng, T.; Wang, X.; Chen, Y.; Wu, X. Kaempferol Attenuates Retinal Ganglion Cell Death by Suppressing NLRP1/NLRP3 Inflammasomes and Caspase-8 via JNK and NF-ΚB Pathways in Acute Glaucoma. Eye (Basingstoke) 2019, 33. [Google Scholar] [CrossRef]
- He, D.; Tao, L.; Cai, B.; Chen, X.; Wang, Y.; Li, S.; Liao, C.; Chen, Y.; Chen, J.; Liu, Z.; et al. EIF2α Incites Photoreceptor Cell and Retina Damage by All-Trans-Retinal. Journal of Biological Chemistry 2023, 299. [Google Scholar] [CrossRef] [PubMed]
- Quan, J.H.; Gao, F.F.; Lee, M.; Yuk, J.M.; Cha, G.H.; Chu, J.Q.; Wang, H.; Lee, Y.H. Involvement of Endoplasmic Reticulum Stress Response and IRE1-Mediated ASK1/JNK/Mcl-1 Pathways in Silver Nanoparticle-Induced Apoptosis of Human Retinal Pigment Epithelial Cells. Toxicology 2020, 442. [Google Scholar] [CrossRef]
- Sarker, K.P.; Biswas, K.K.; Yamakuchi, M.; Lee, K.Y.; Hahiguchi, T.; Kracht, M.; Kitajima, I.; Maruyama, I. ASK1-P38 MAPK/JNK Signaling Cascade Mediates Anandamide-Induced PC12 Cell Death. J Neurochem 2003, 85. [Google Scholar] [CrossRef]
- Kim, N.Y.; Mohan, C.D.; Sethi, G.; Ahn, K.S. Cannabidiol Activates MAPK Pathway to Induce Apoptosis, Paraptosis, and Autophagy in Colorectal Cancer Cells. J Cell Biochem 2024, 125. [Google Scholar] [CrossRef]
- Scheuner, D.; Song, B.; McEwen, E.; Liu, C.; Laybutt, R.; Gillespie, P.; Saunders, T.; Bonner-Weir, S.; Kaufman, R.J. Translational Control Is Required for the Unfolded Protein Response and in Vivo Glucose Homeostasis. Mol Cell 2001, 7. [Google Scholar] [CrossRef] [PubMed]
- Harding, H.P.; Zhang, Y.; Bertolotti, A.; Zeng, H.; Ron, D. Perk Is Essential for Translational Regulation and Cell Survival during the Unfolded Protein Response. Mol Cell 2000, 5. [Google Scholar] [CrossRef]
- Jousse, C.; Oyadomari, S.; Novoa, I.; Lu, P.; Zhang, Y.; Harding, H.P.; Ron, D. Inhibition of a Constitutive Translation Initiation Factor 2α Phosphatase, CReP, Promotes Survival of Stressed Cells. Journal of Cell Biology 2003, 163. [Google Scholar] [CrossRef] [PubMed]
- Iurlaro, R.; Muñoz-Pinedo, C. Cell Death Induced by Endoplasmic Reticulum Stress. FEBS Journal 2016. [Google Scholar] [CrossRef] [PubMed]
- Athanasiou, D.; Aguila, M.; Bellingham, J.; Kanuga, N.; Adamson, P.; Cheethamc, M.E. The Role of the ER Stress-Response Protein PERK in Rhodopsin Retinitis Pigmentosa. Hum Mol Genet 2017, 26. [Google Scholar] [CrossRef] [PubMed]
- Wu, J.; Cui, D.; Li, H.; Zeng, J. Protective Effects of NAC and Salubrinal on Apoptosis of Retinal Pigment Epithelial Cells Induced by All-Trans Retinoic Acid. Eur J Ophthalmol 2022, 32. [Google Scholar] [CrossRef]
Figure 1.
Cell viability of retinal cells in cultures treated with cannabinoids. Glia-enriched cultures at E8C13 were treated with µM concentrations of cannabidiol (A), THC (B), CP55940 (C) or 1 µM WIN 55,212-2 (open circles). After 24 h, cultures were processed for MTT viability assays as described in methods section. Data represent the mean ± S.E.M. of 2-10 experiments performed in triplicate. ***p<0.001, **p<0.01 and *p< 0.05 as compared to control cultures. a.u. = arbitrary units.
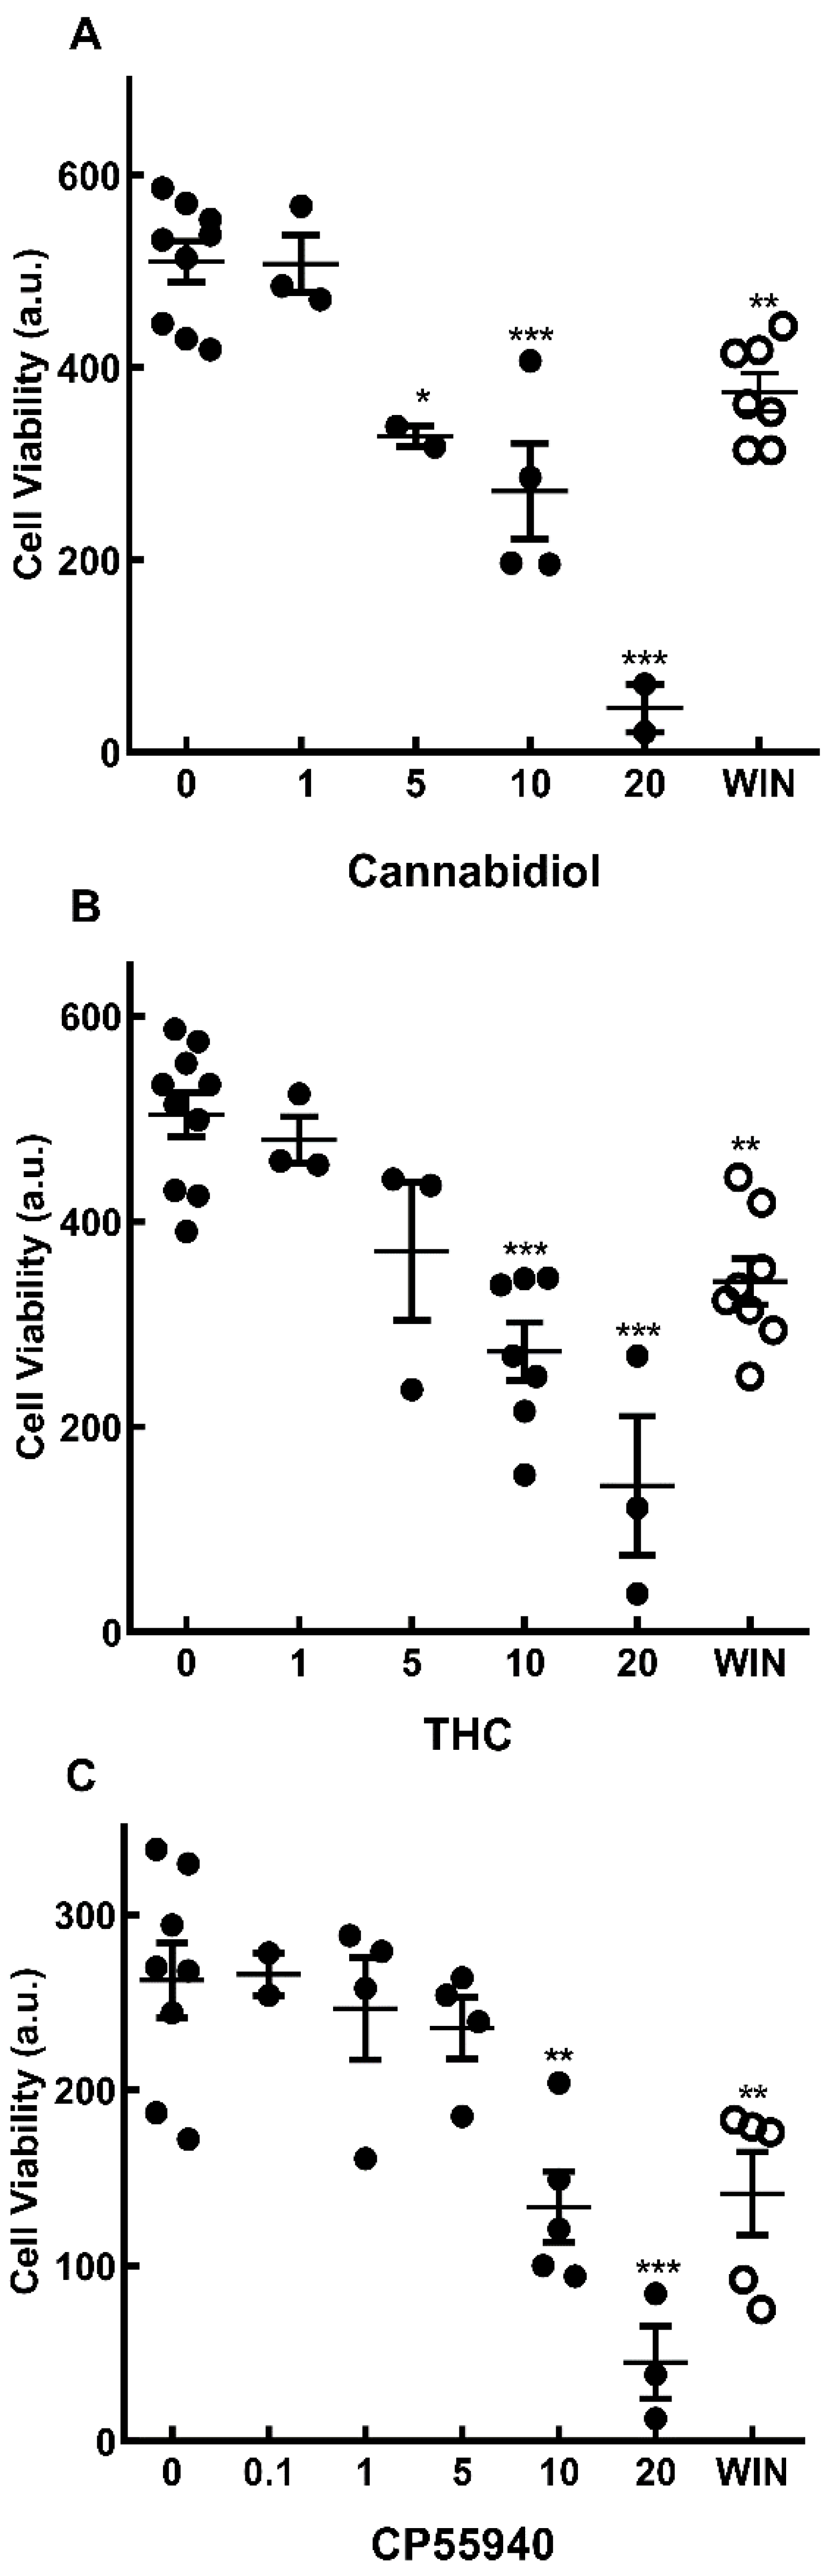
Figure 2.
Time-course of the cell viability decrease and increase in extracellular LDH activity in cultures treated with cannabidiol (A) and WIN55,212-2 (B). Glia-enriched cultures at E8C13 were incubated with 1 µM WIN or 10 µM CBD and after 24 h processed for MTT viability assays (open symbols) or LDH activity (filled symbols) as described in methods section. Data represent the mean ± S.E.M. of 3 separate experiments performed in triplicate or quadruplicate. a.u. = arbitrary units.
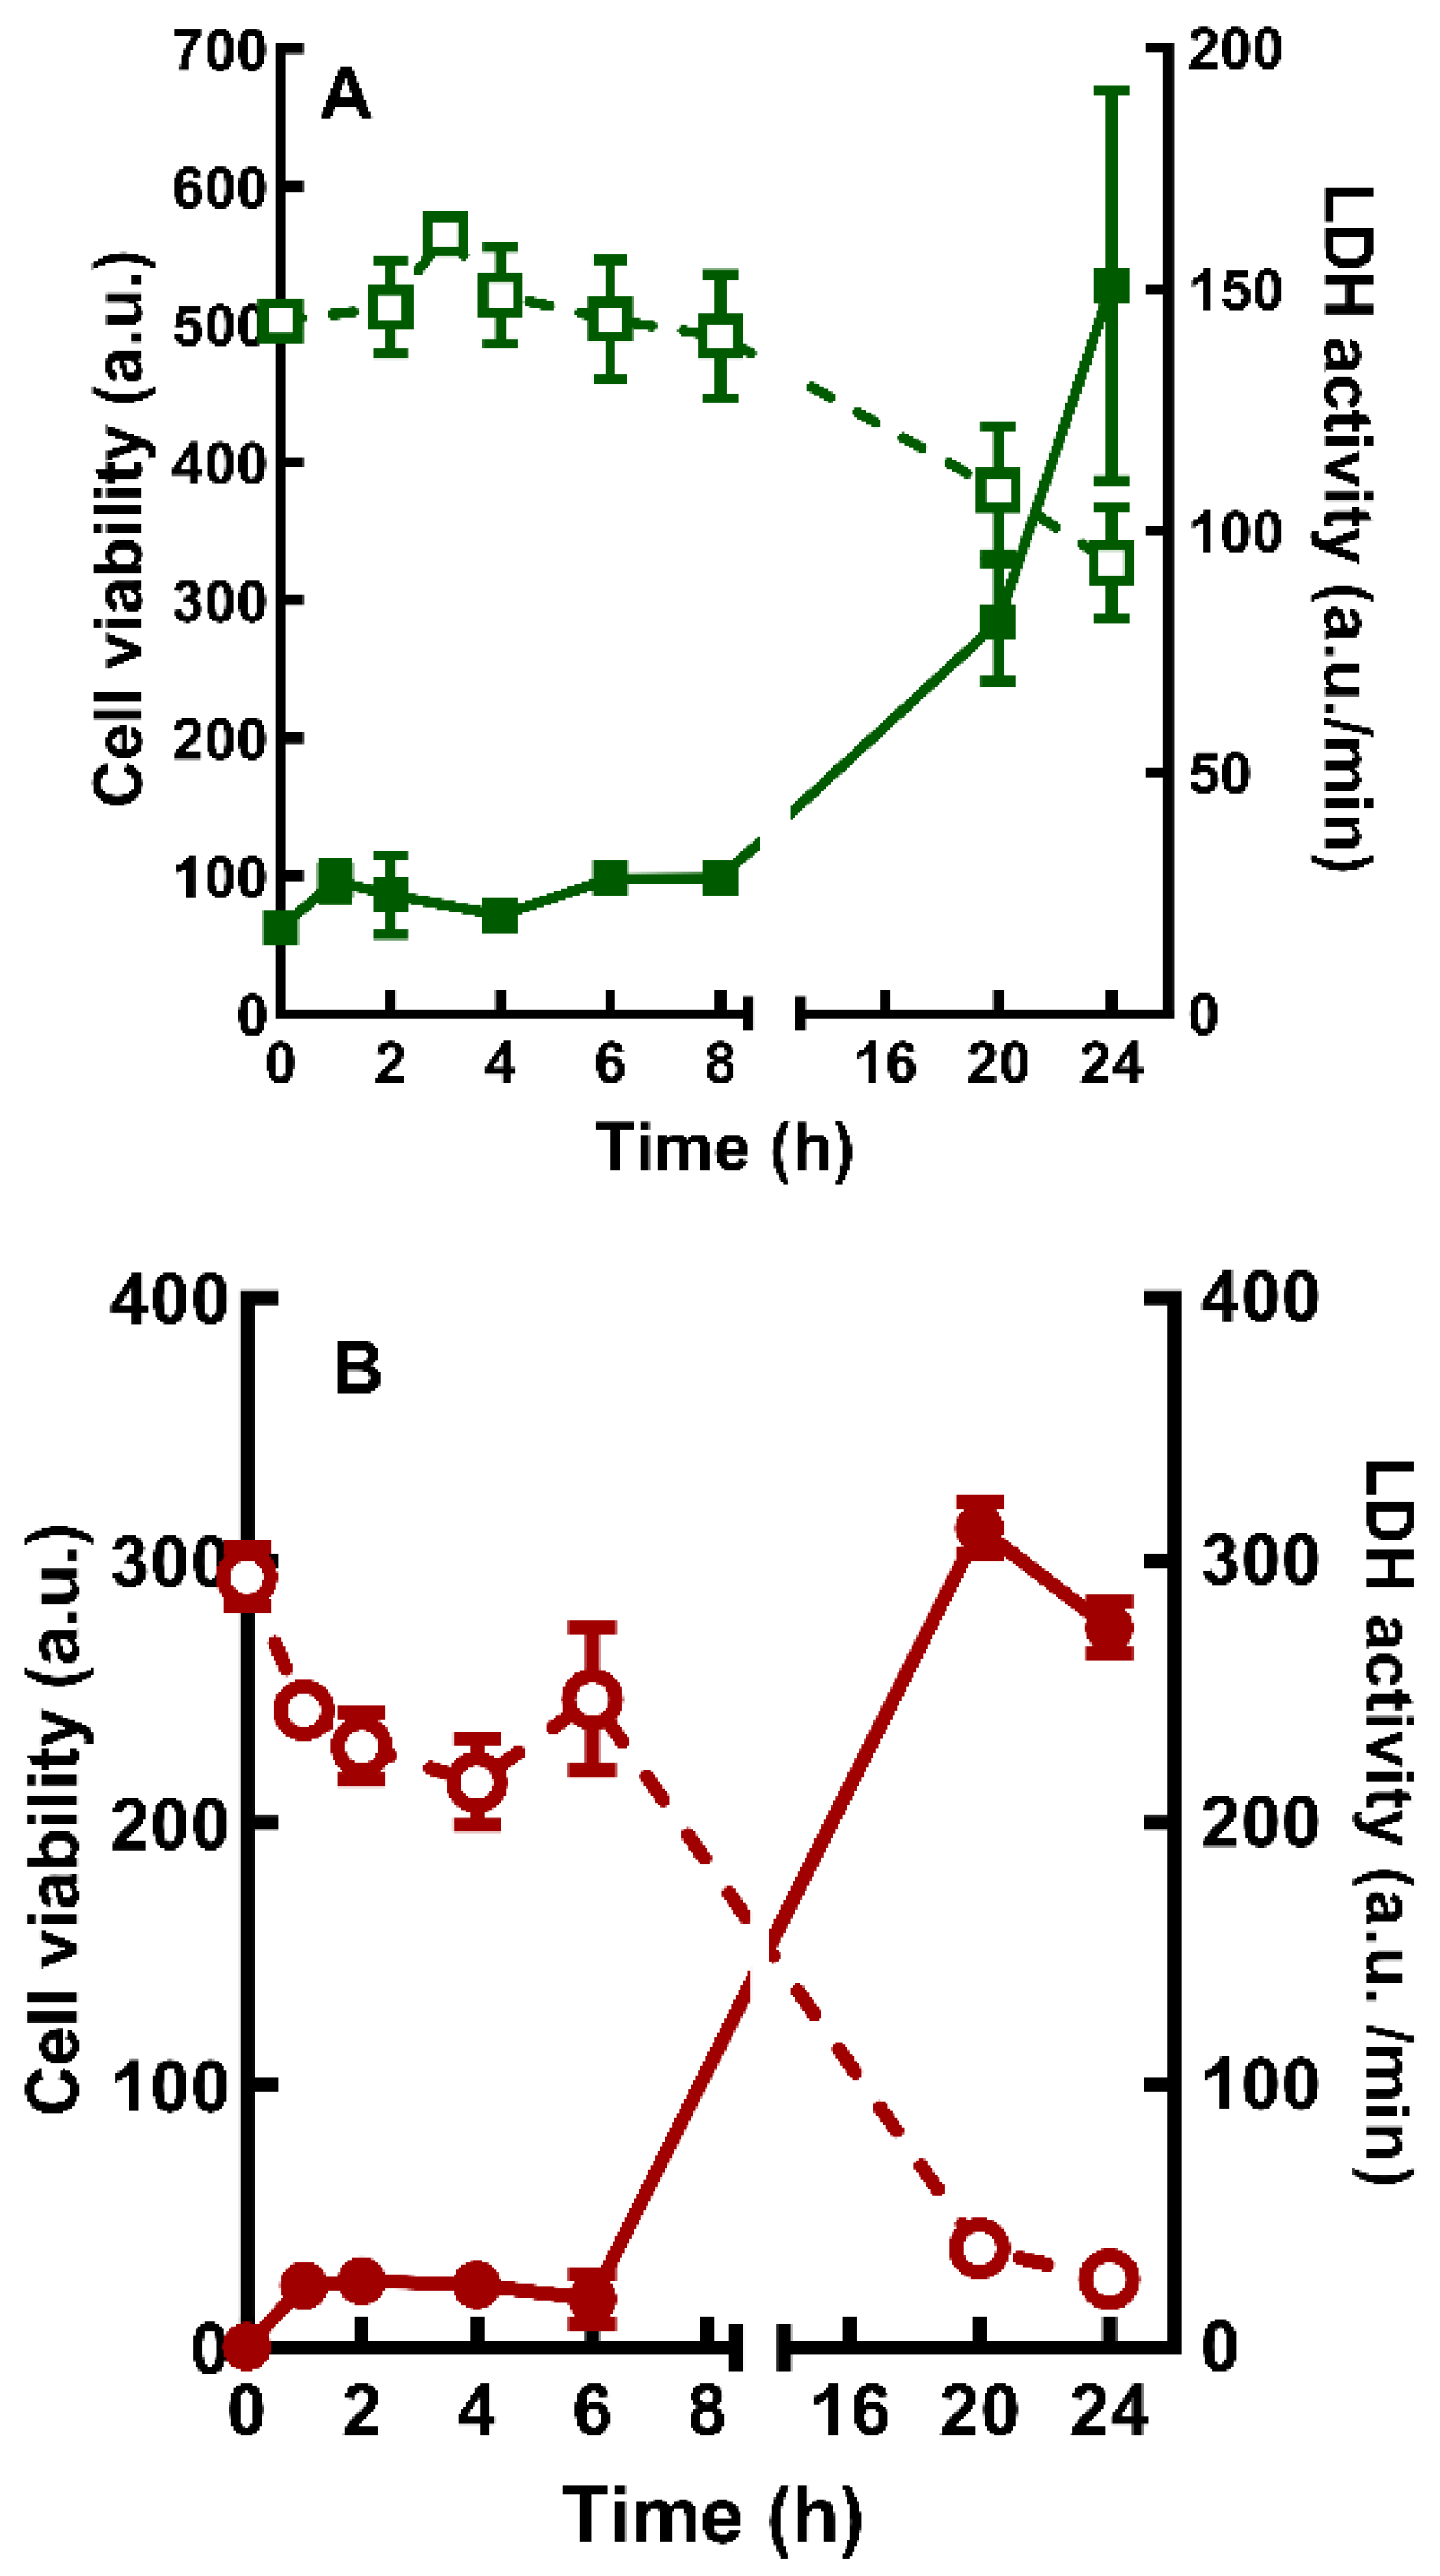
Figure 3.
WIN induces cytoplasmic vacuolization in retinal glial cells in culture. Glia enriched cultures at E8C13 were treated with 1 µM WIN for 24 h, fixed and photographed under phase contrast illumination. Note the big cytoplasmic vacuoles in WIN-treated cultures. Bar = 20 µm.
Figure 3.
WIN induces cytoplasmic vacuolization in retinal glial cells in culture. Glia enriched cultures at E8C13 were treated with 1 µM WIN for 24 h, fixed and photographed under phase contrast illumination. Note the big cytoplasmic vacuoles in WIN-treated cultures. Bar = 20 µm.
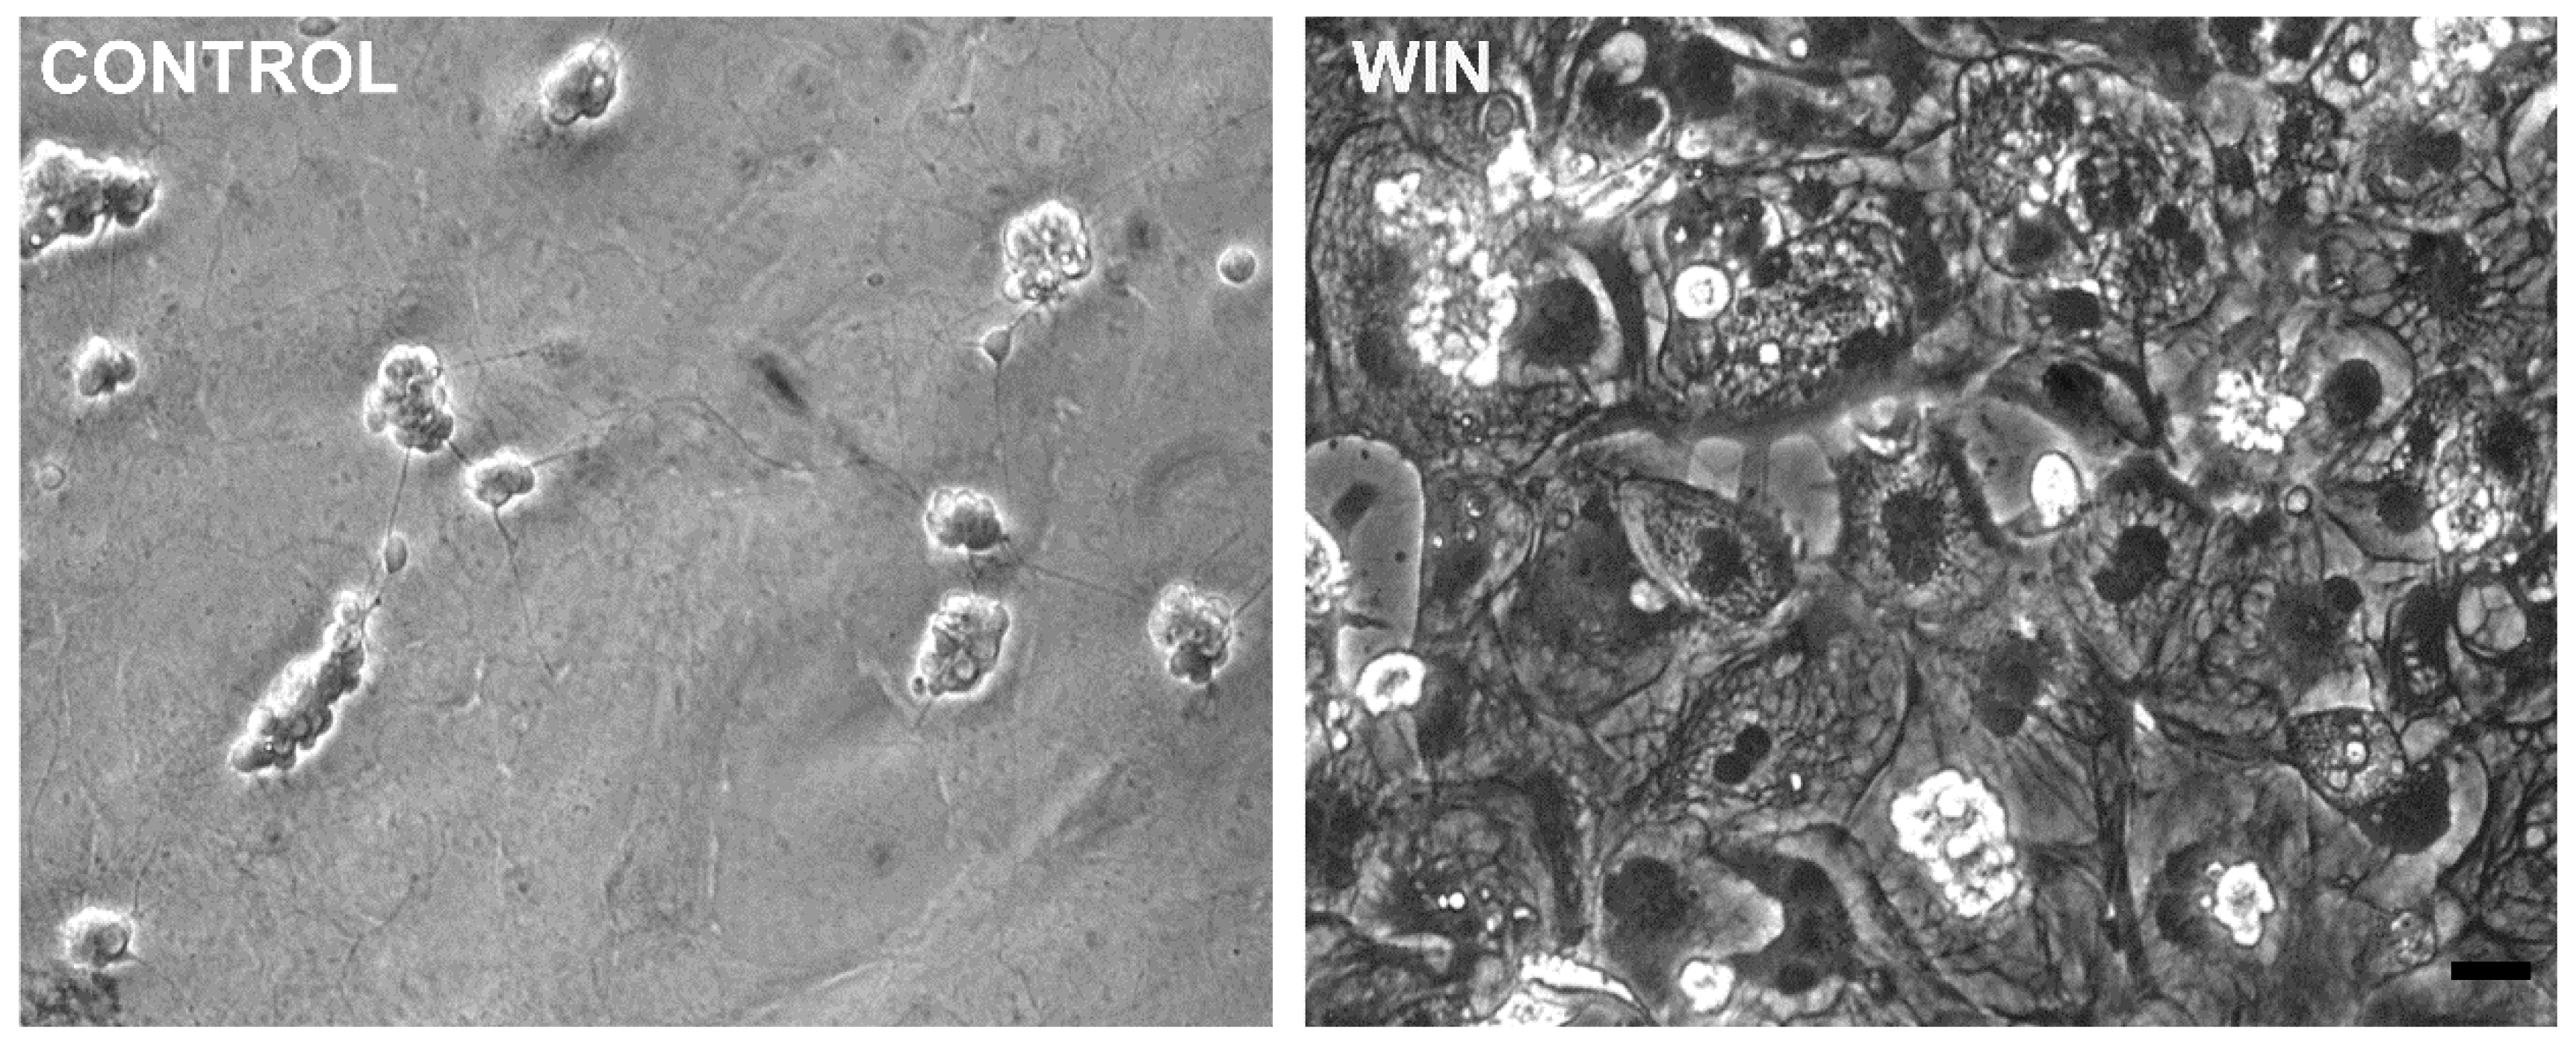
Figure 4.
4-Pheny-Butyrate inhibits intracellular vacuolization in cultures treated with WIN 4-phenyl-butyrate. Glia-enriched cultures on coverslips at E8C13 were incubated with 1µM WIN or with WIN plus 50 µM 4-PBA for 24 h, fixed and processed by imunnocytochemistry for the avian glial specific antigen 2M6. Hoechst was used to stain cell nuclei. Cultures were visualized and photographed on a Leica SP5 confocal microscope. Imunnofluorescence assays were performed 3-times with similar results. Scale bar = 10 µm.
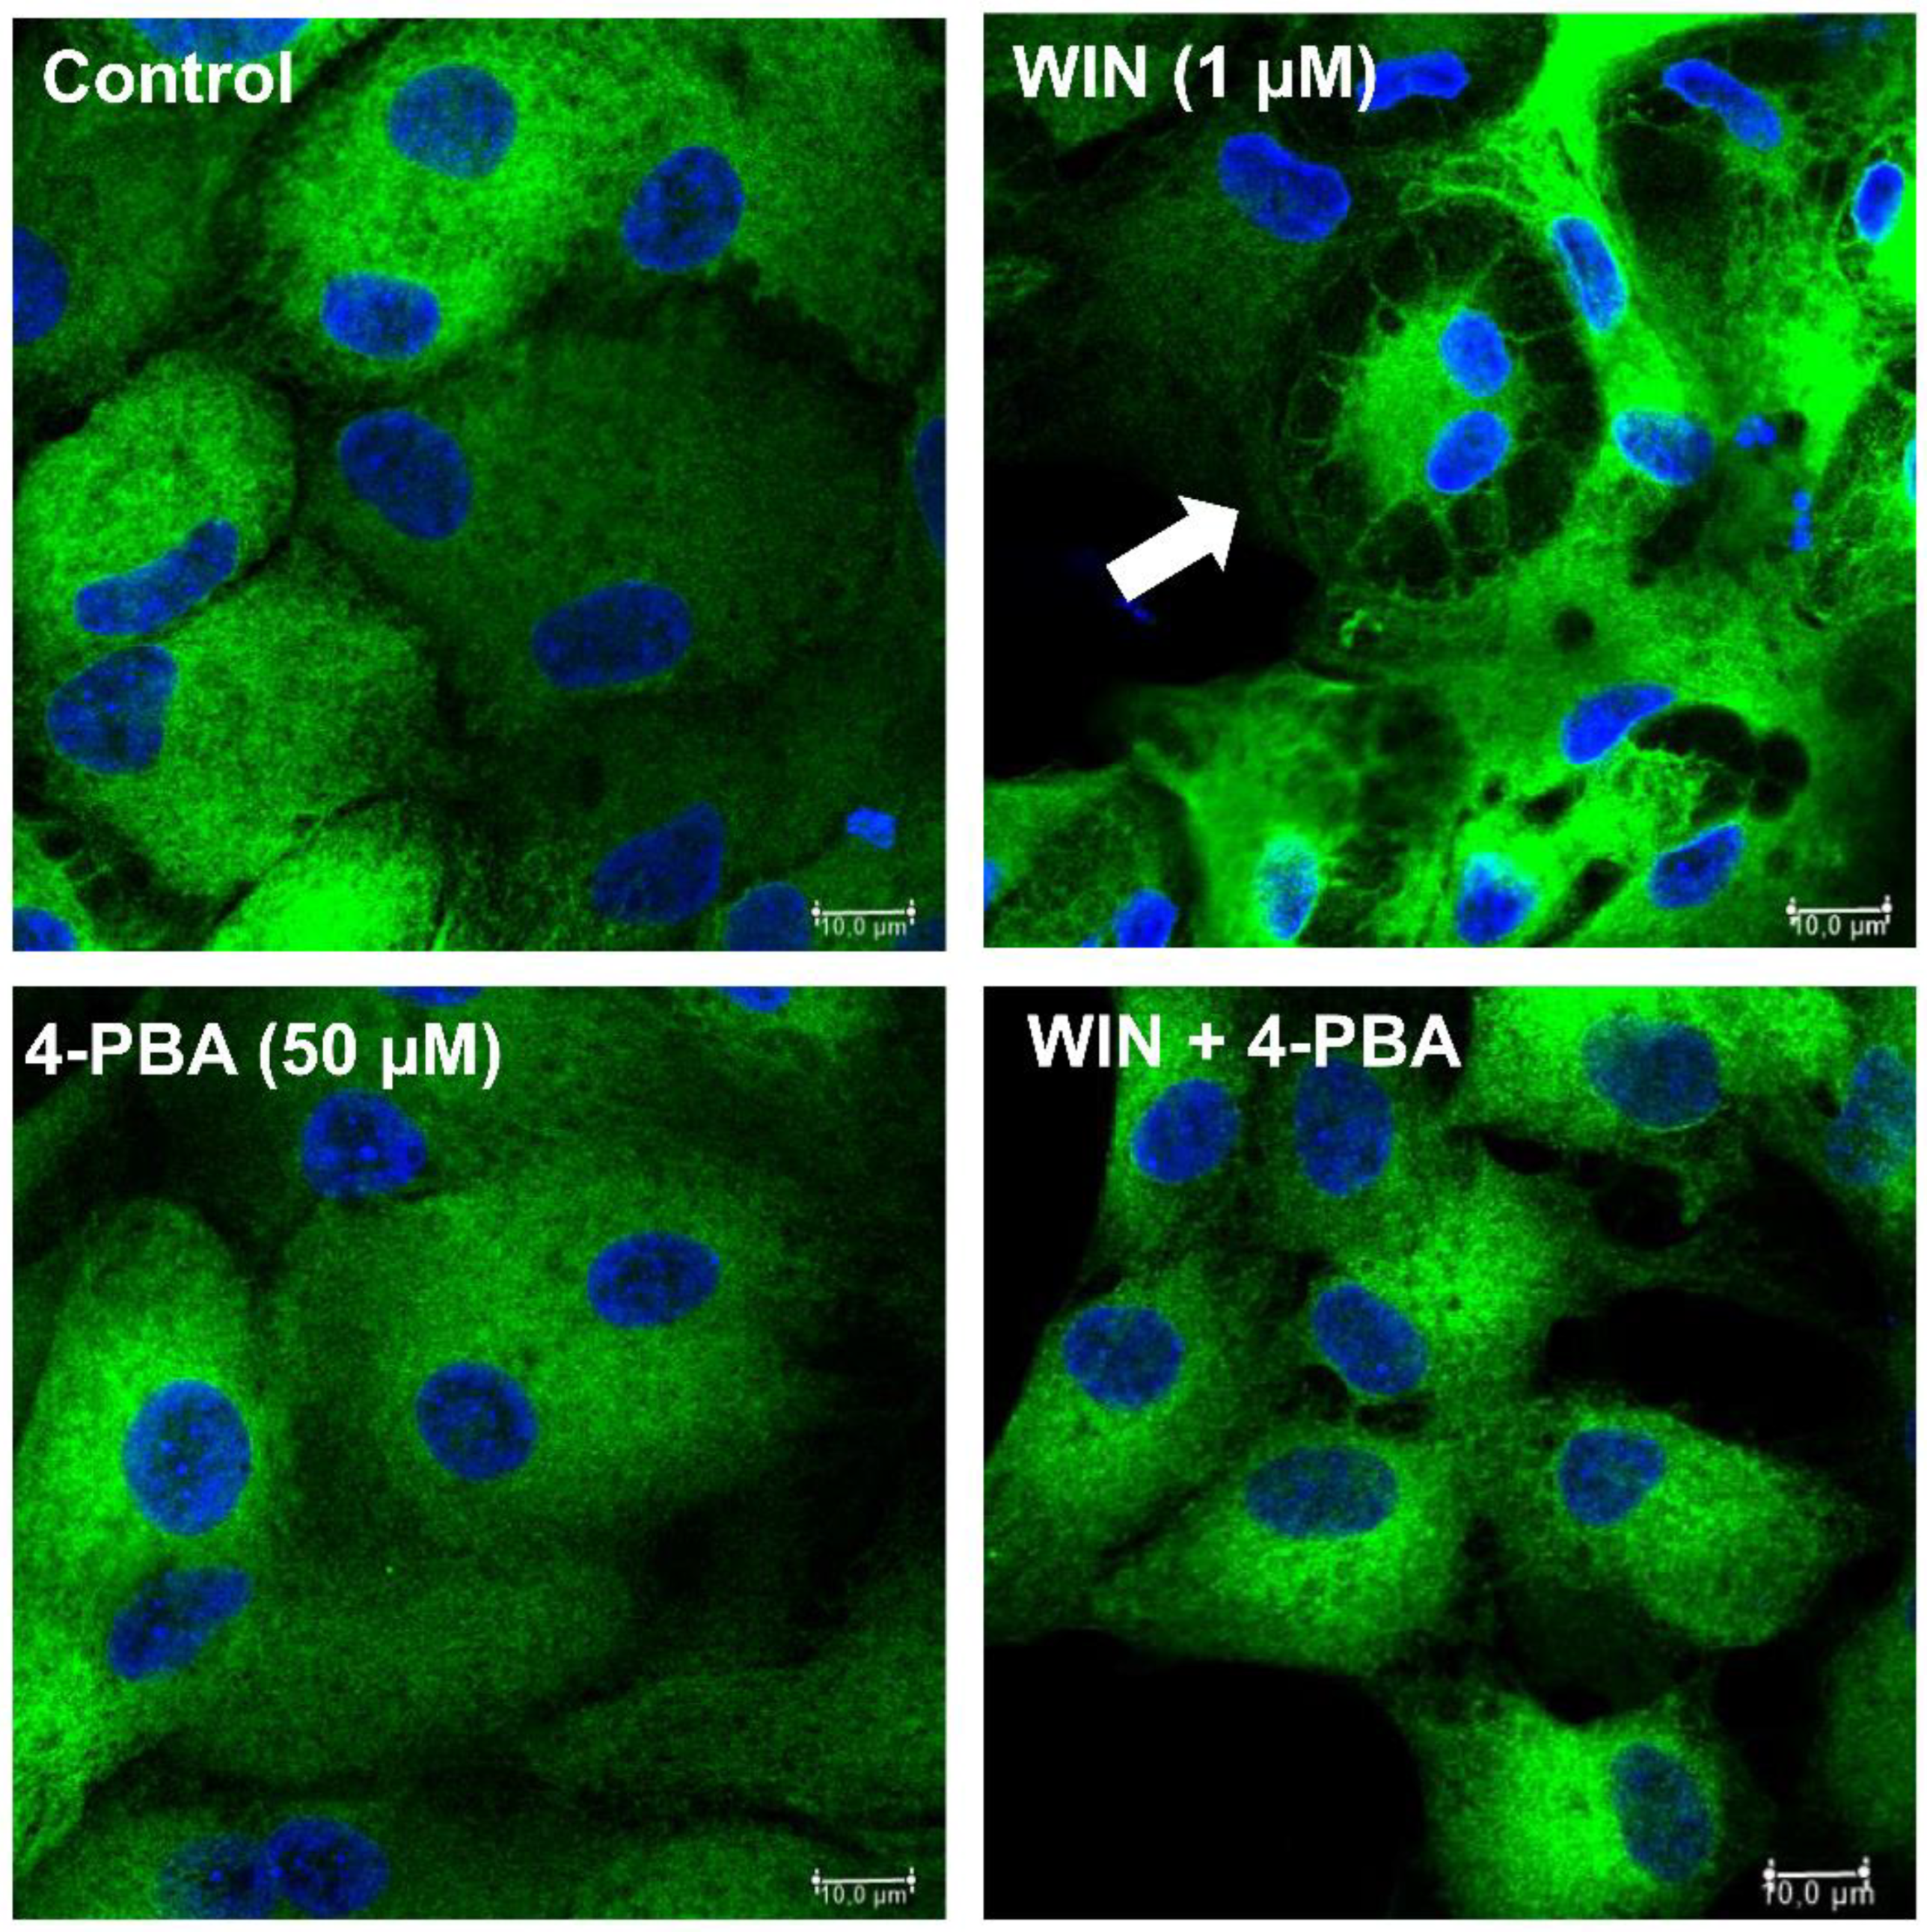
Figure 5.
CM-H2DCFDA oxidation assays in retinal cultures. Glia-enriched cell cultures on coverslips at E8C10-E8C12 were treated with 1µM WIN, 10 µM CBD or 10 µM THC for 3 h, washed and incubated with the CM-H2DCFDA probe. Ten fields along the diameter of the coverslip were immediately photographed on a Leica SP5 microscope using a 40x objective and 405 and 488 laser lines following the manufacturer’s instructions. Hoechst was used to label cell nuclei and estimate the total number of cells in each field. The number of CM-H2DCFDA labeled cells was divided by the number of cell nuclei in each field and expressed as the percent of labeled cells. Data represents the mean ± S.E.M. of 3 separate experiments performed in duplicate. ***p< 0.001 versus control.
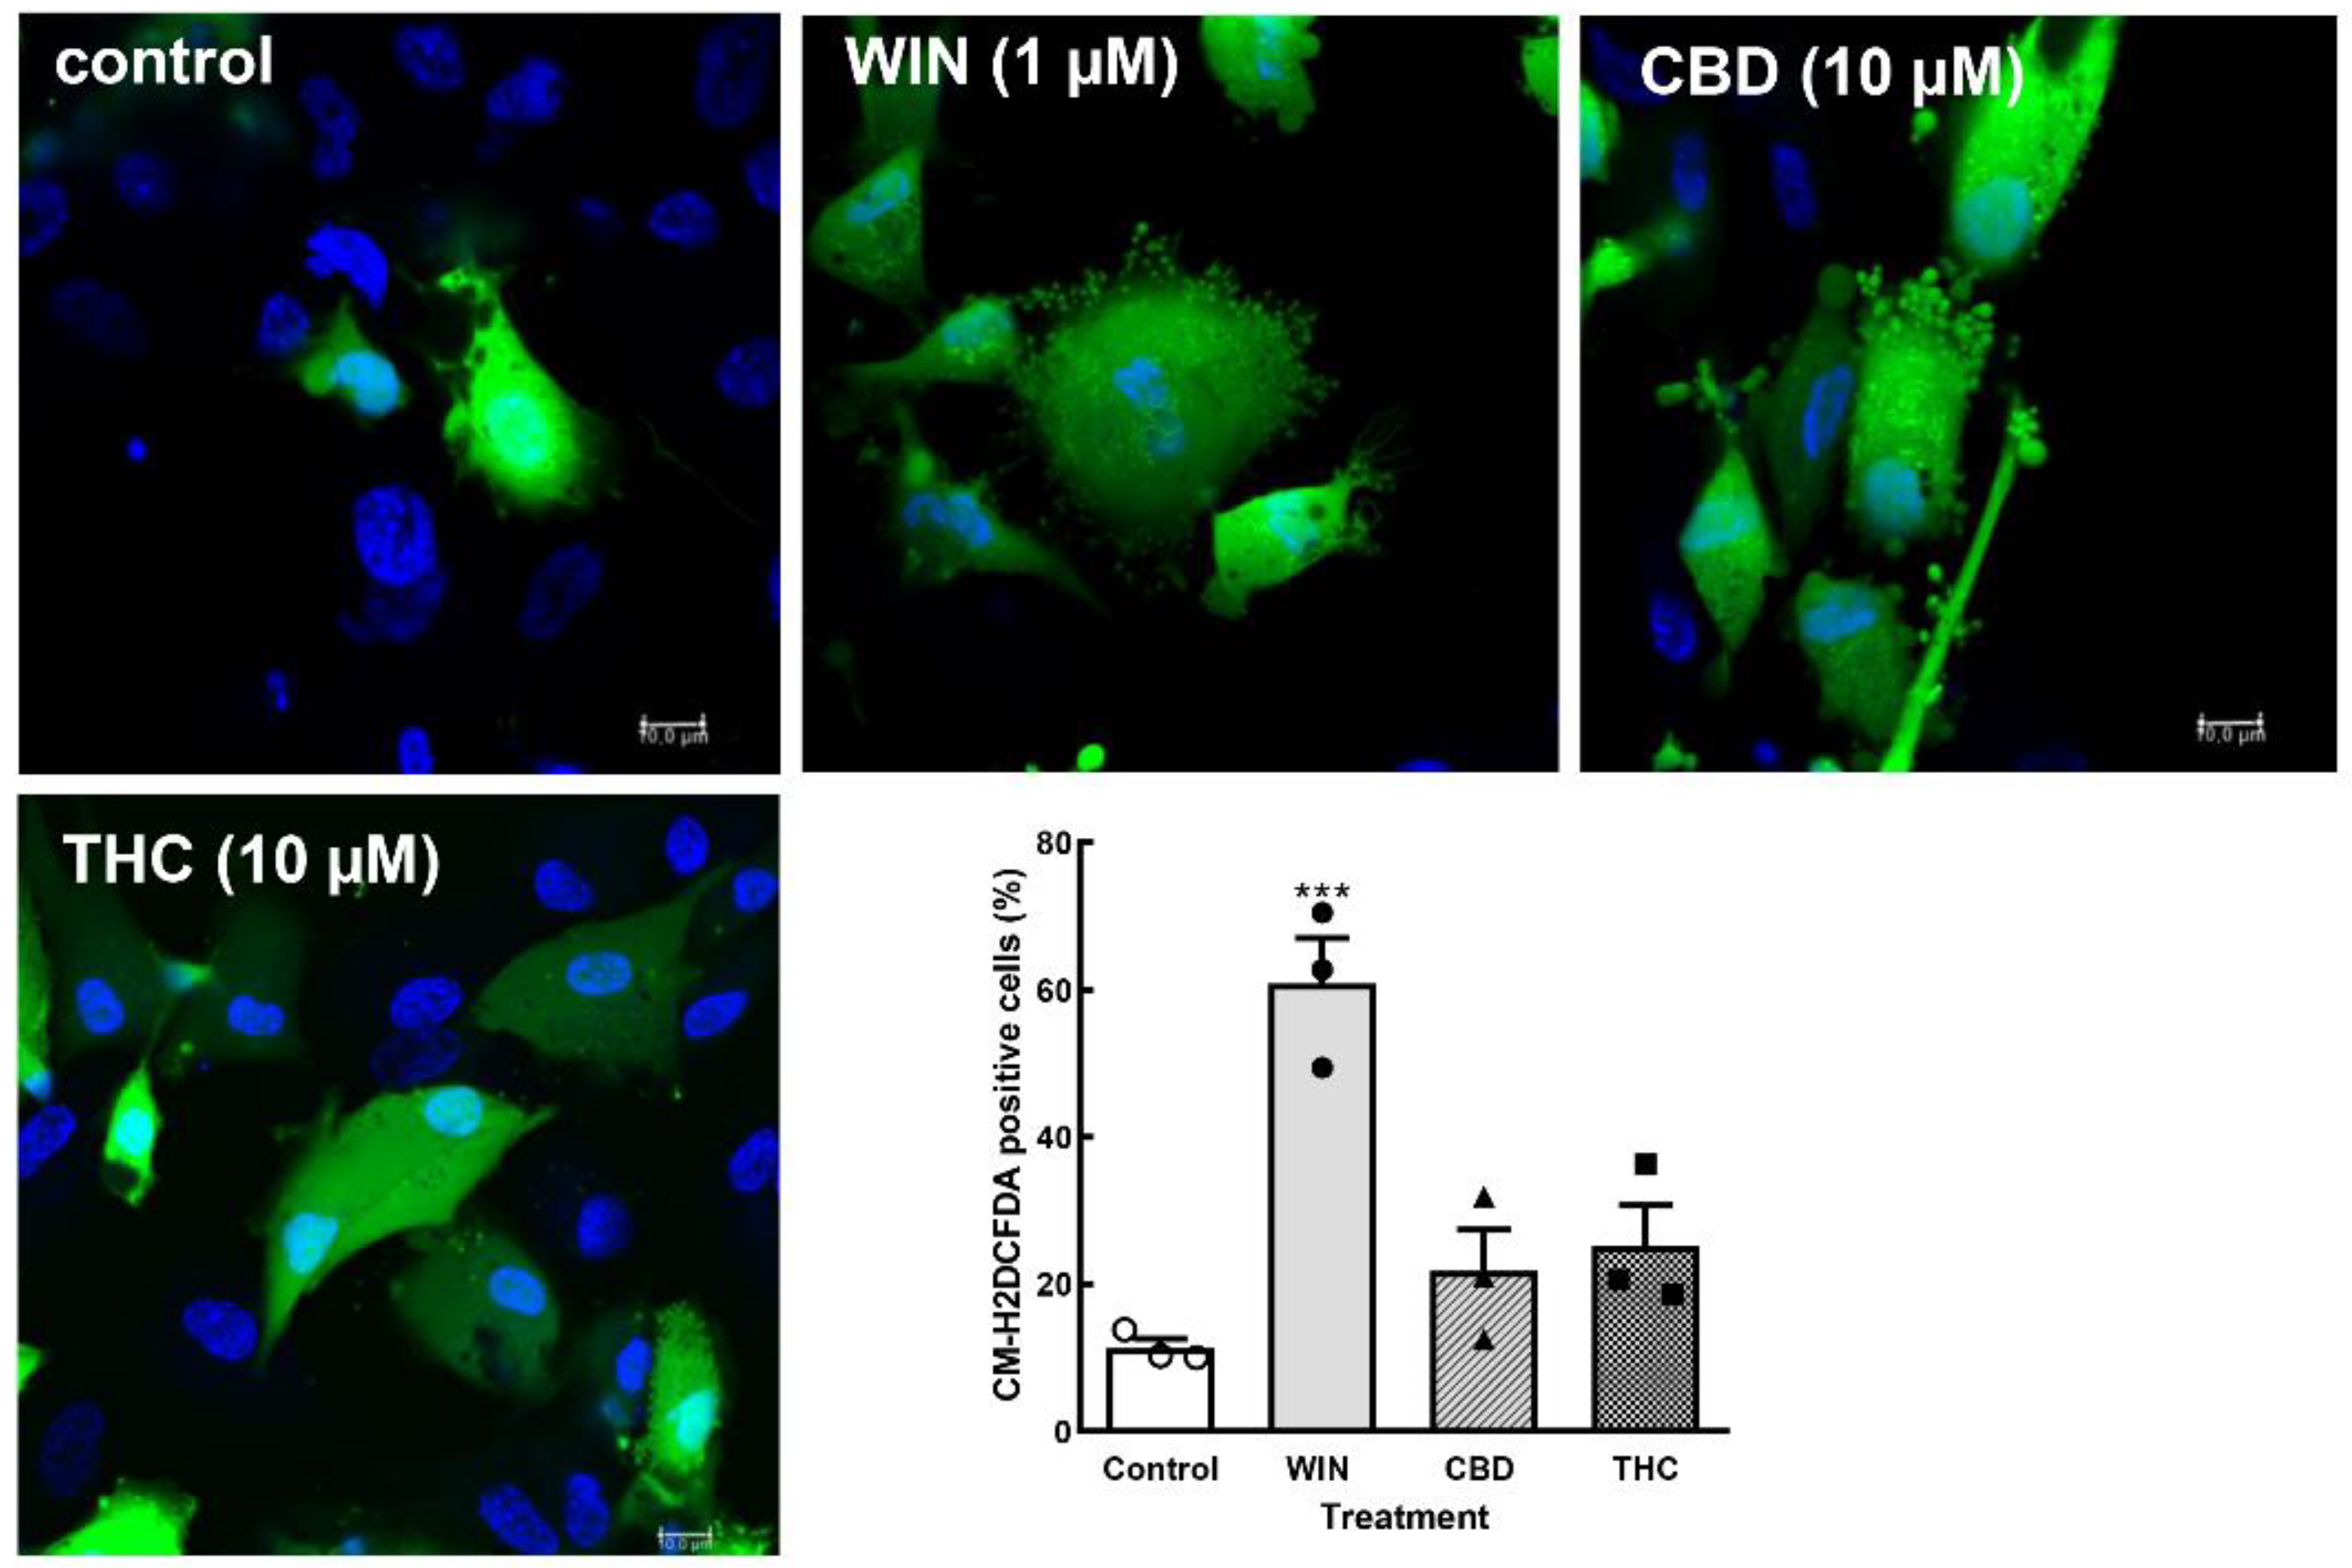
Figure 6.
Phosphorylation of eIF2α induced by cannabinoids in retinal glia cultures. Glia-enriched cultures at E8C13 were incubated with 1µM WIN, 10 µM CBD or 10 µM THC for 24 h. (A) Representative blot of 4 independent experiments performed in duplicate. (B) Blots were quantified by densitometry and expressed as the mean fraction p-eIF2α / tubulin ± S.E.M.. **p< 0.01 and *p< 0.05 as compared to control values.
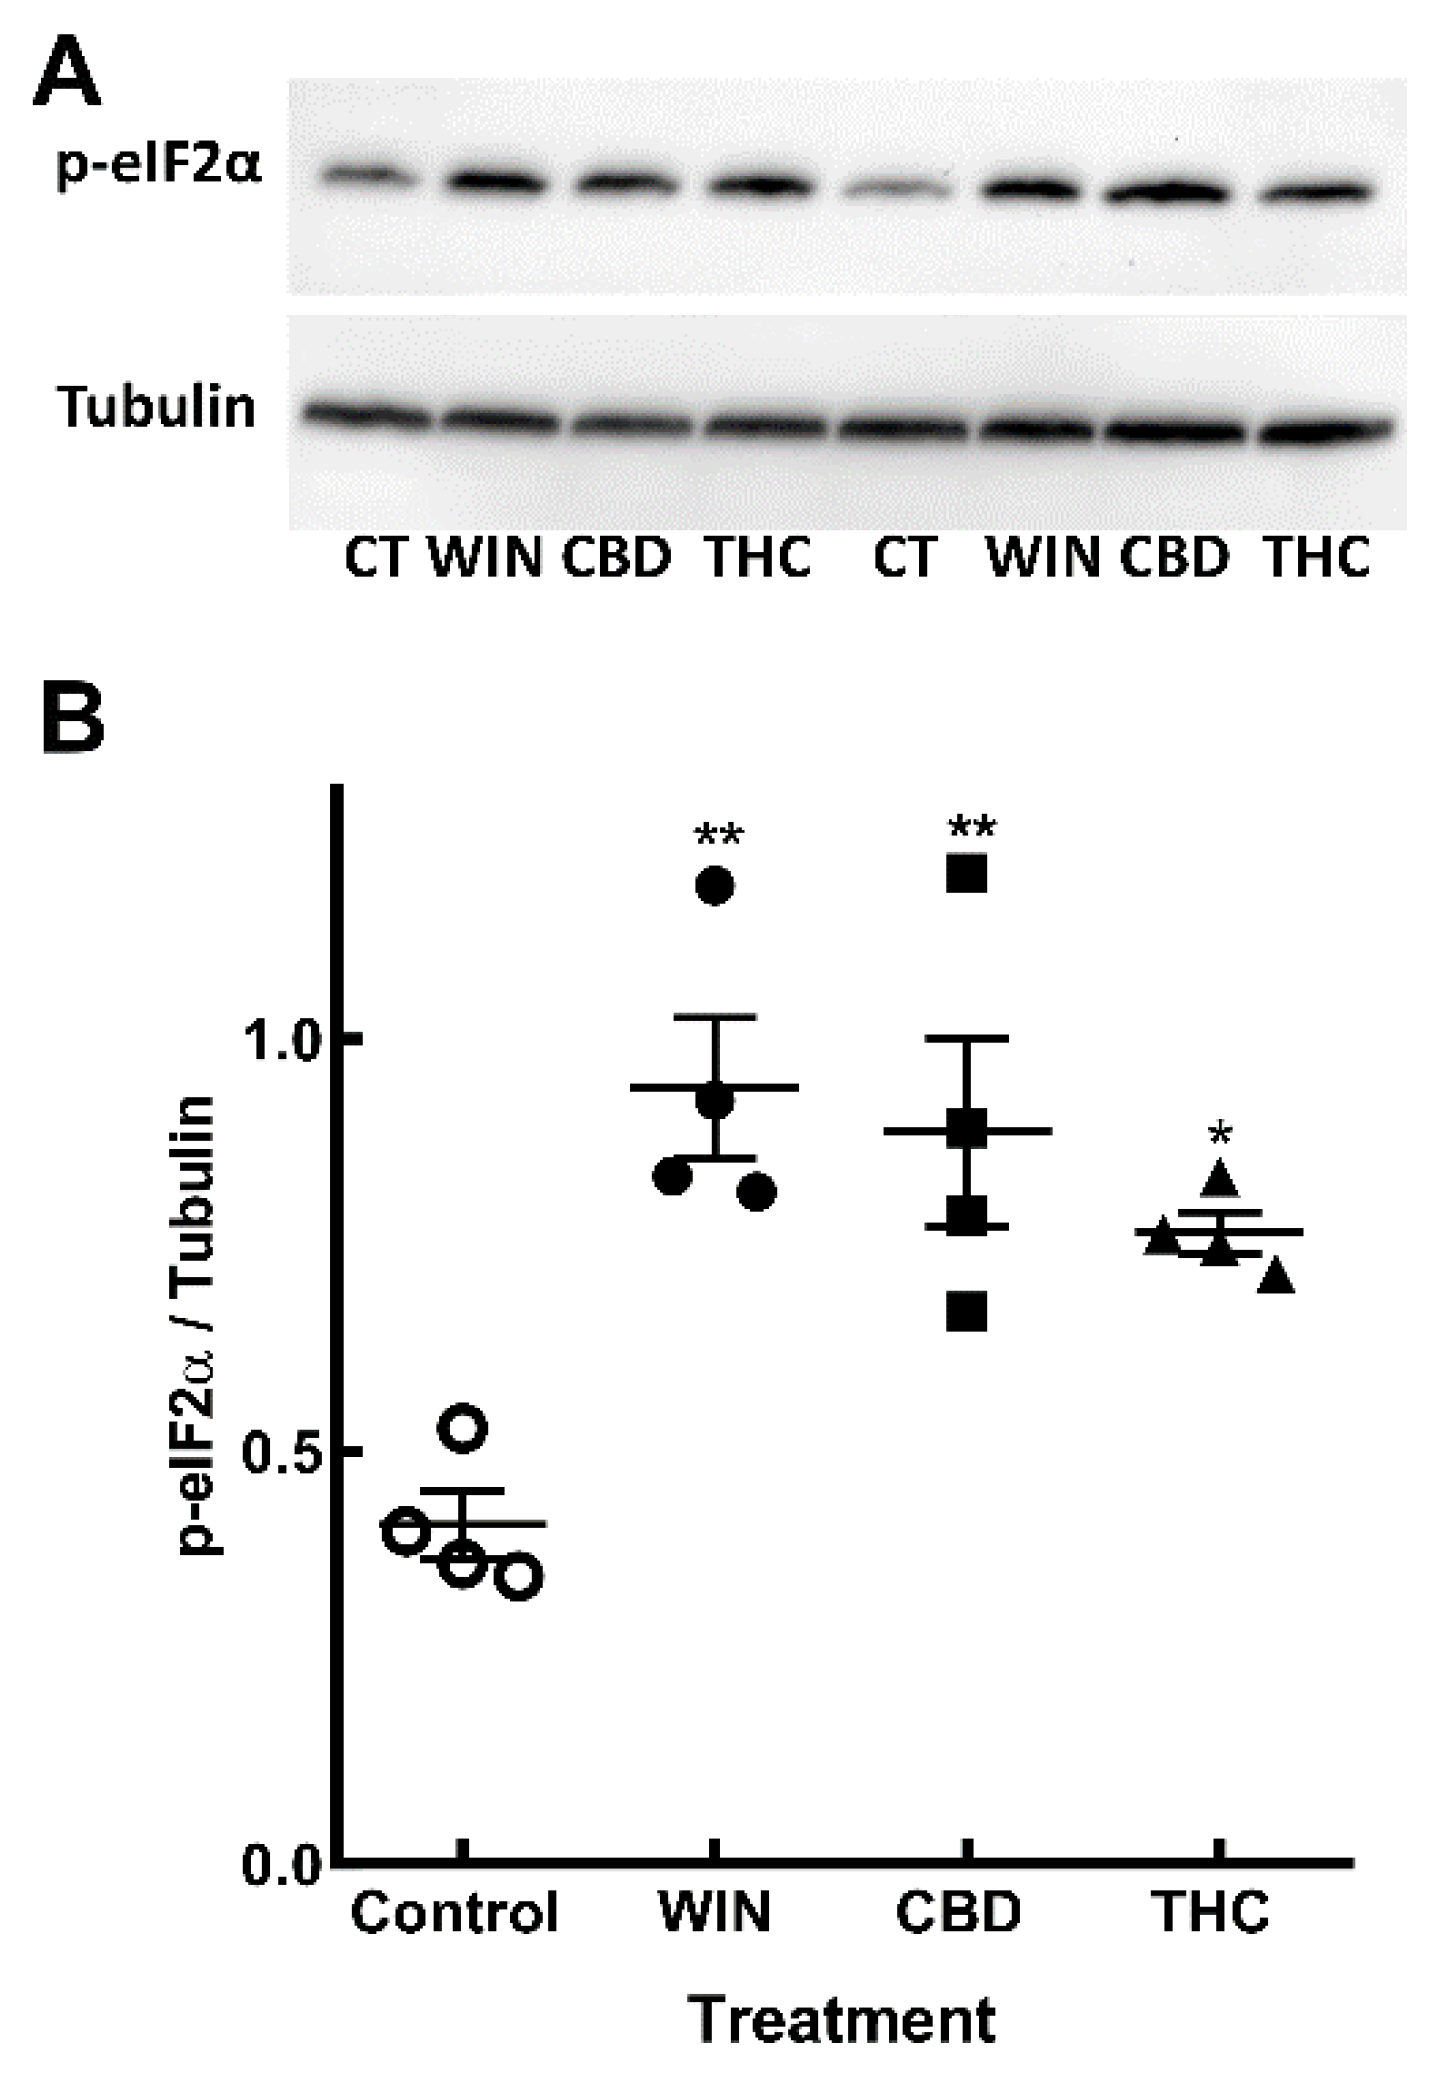
Figure 7.
Cannabinoids induce the phosphorylation of JNK, but not P38 MAP kinase in glia-enriched retinal cultures. Cultures at E8C13 were incubated with 1 µM WIN, 10 µM CBD or 10 µM THC for 24 h. (A) Representative blot of the experiments quantified in (B) and (C) and performed in duplicate. (B) P-JNK. (C) P-P38. (D) Representative blot of p-JNK and p-P38 content in cultures incubated with the 3 cannabinoids. (E) P-JNK expression was quantified and expressed as the mean % ± S.EM. relative to the control values.
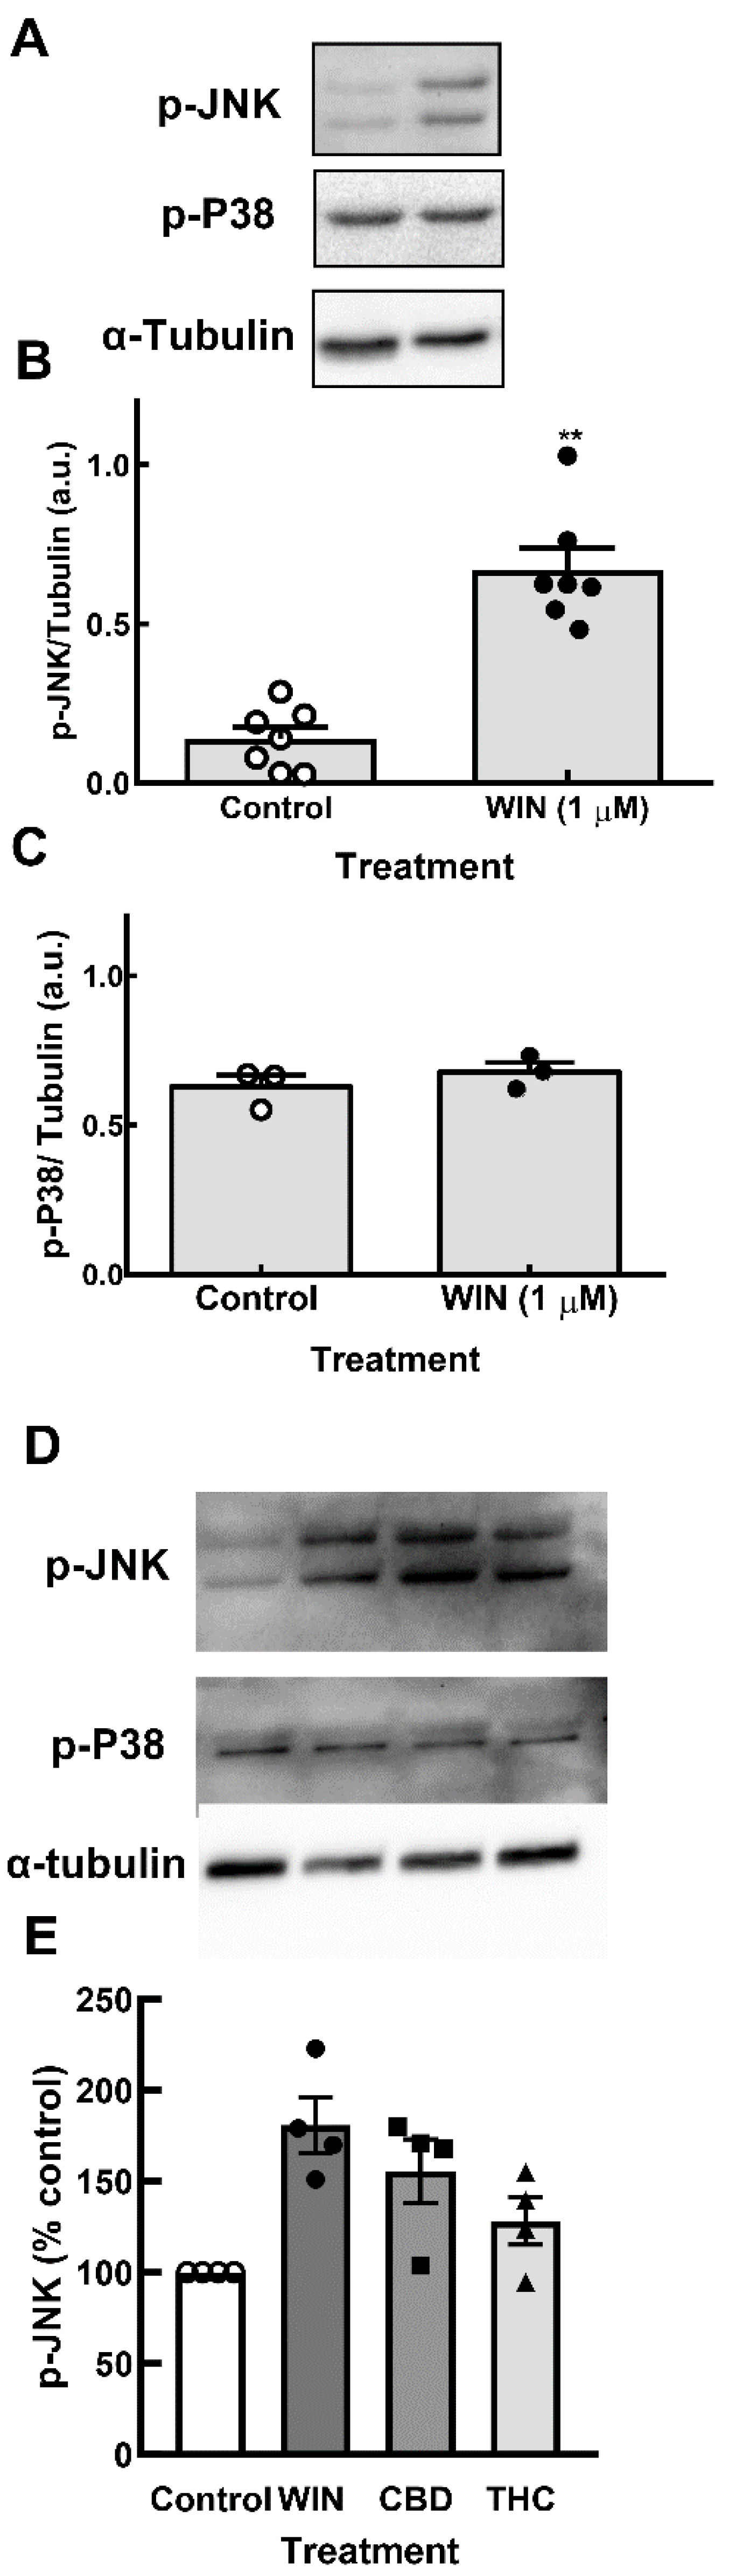
Figure 8.
Immunofluorescence assay for cleaved-caspase 3 in glia-enriched retinal cultures. Cultures at E8C13 on coverslips were treated for 24 h with 1µM WIN fixed and immunolabeled for c-CASP 3 (red) and α-Tubulin (green). Cultures were photographed on a Leica SP5 confocal microscope and experiment replicated 3 times with similar results. Scale bar: 10 µm.
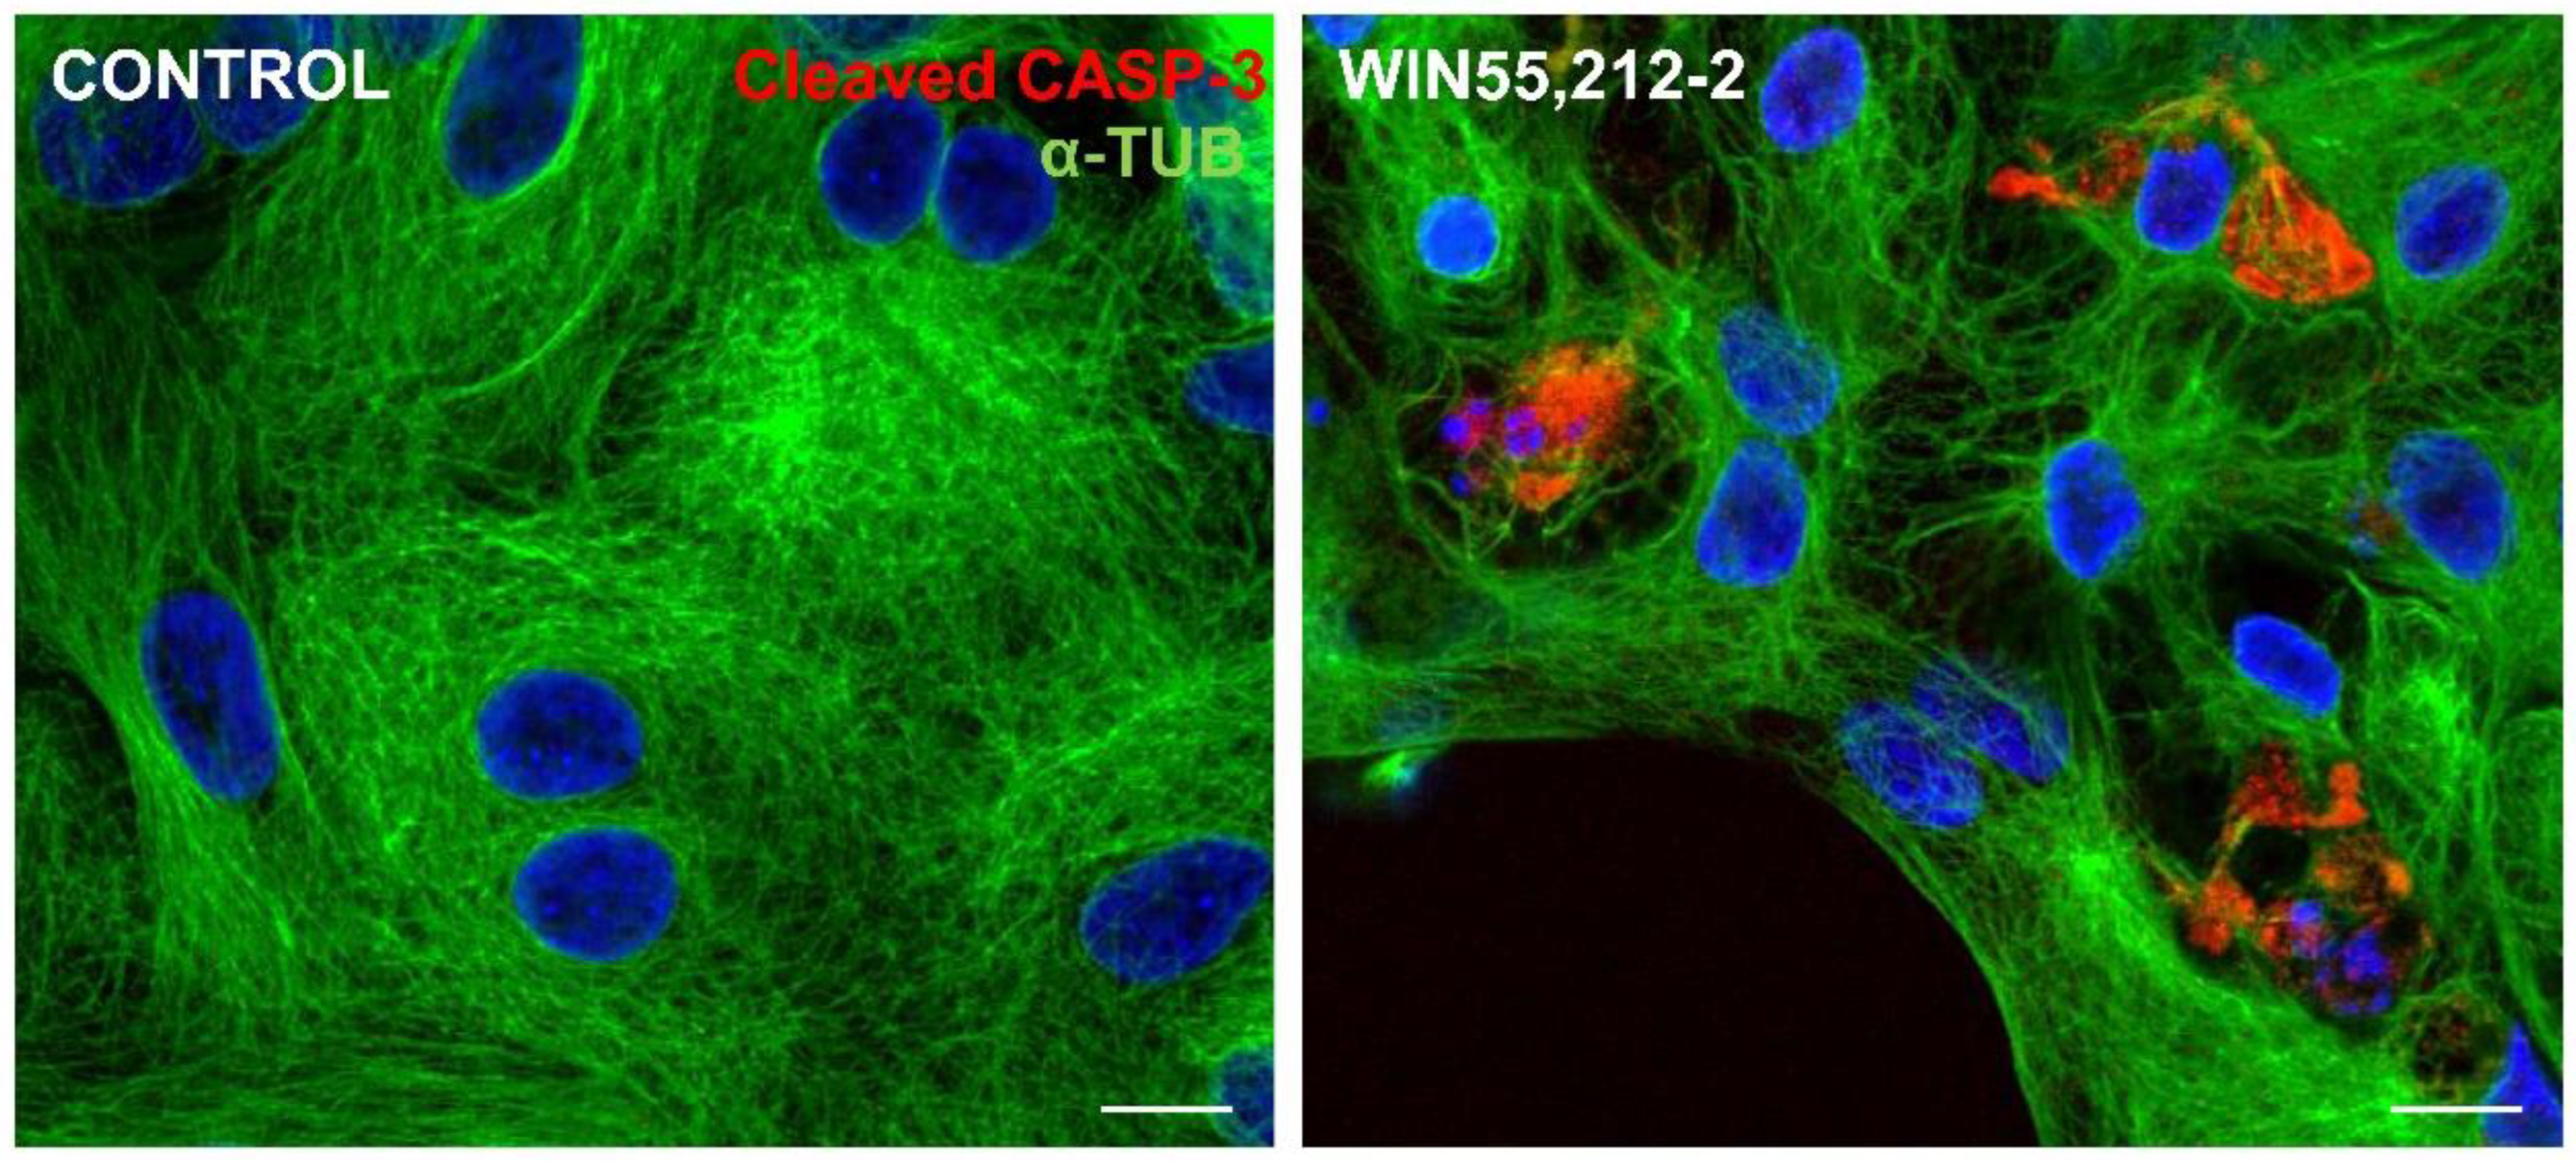
Figure 9.
Salubrinal inhibits the decrease in cell viability induced by WIN in glia-enriched retinal cultures. Cultures at E8C13 were treated with 1µM WIN in the absence or presence of 50 µM salubrinal. After 24 h, cultures were processed for MTT viability assays (A) or LDH activity (B). Data represent the mean ± S.E.M. of 4 experiments performed in triplicate. *p< 0.05 and **p< 0.01 as compared to control. #p< 0.05 as compared to WIN-treated cultures.
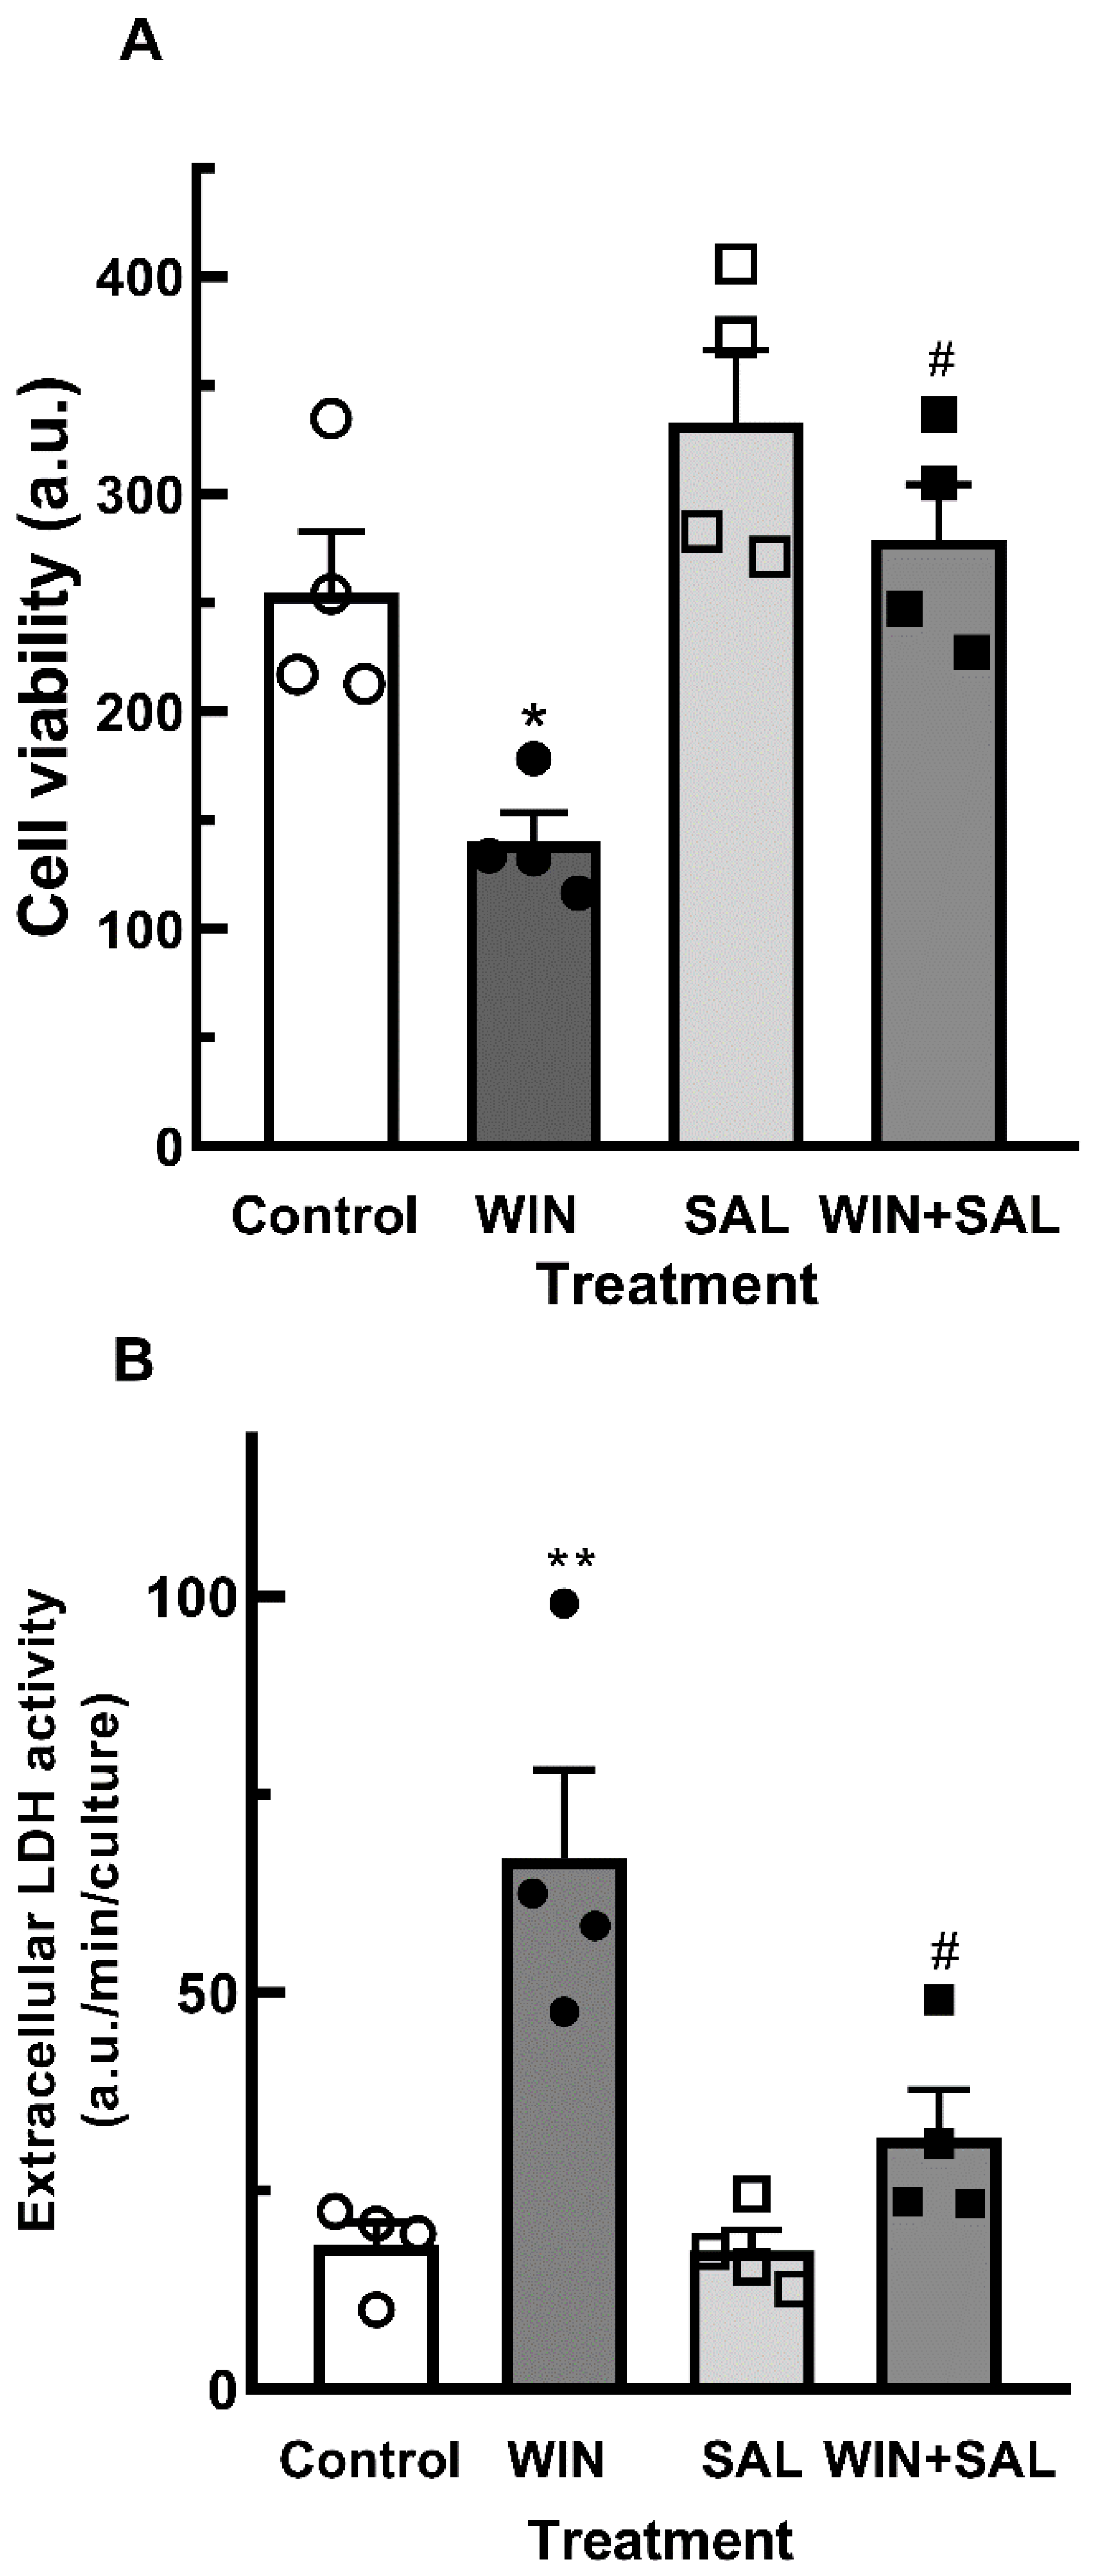
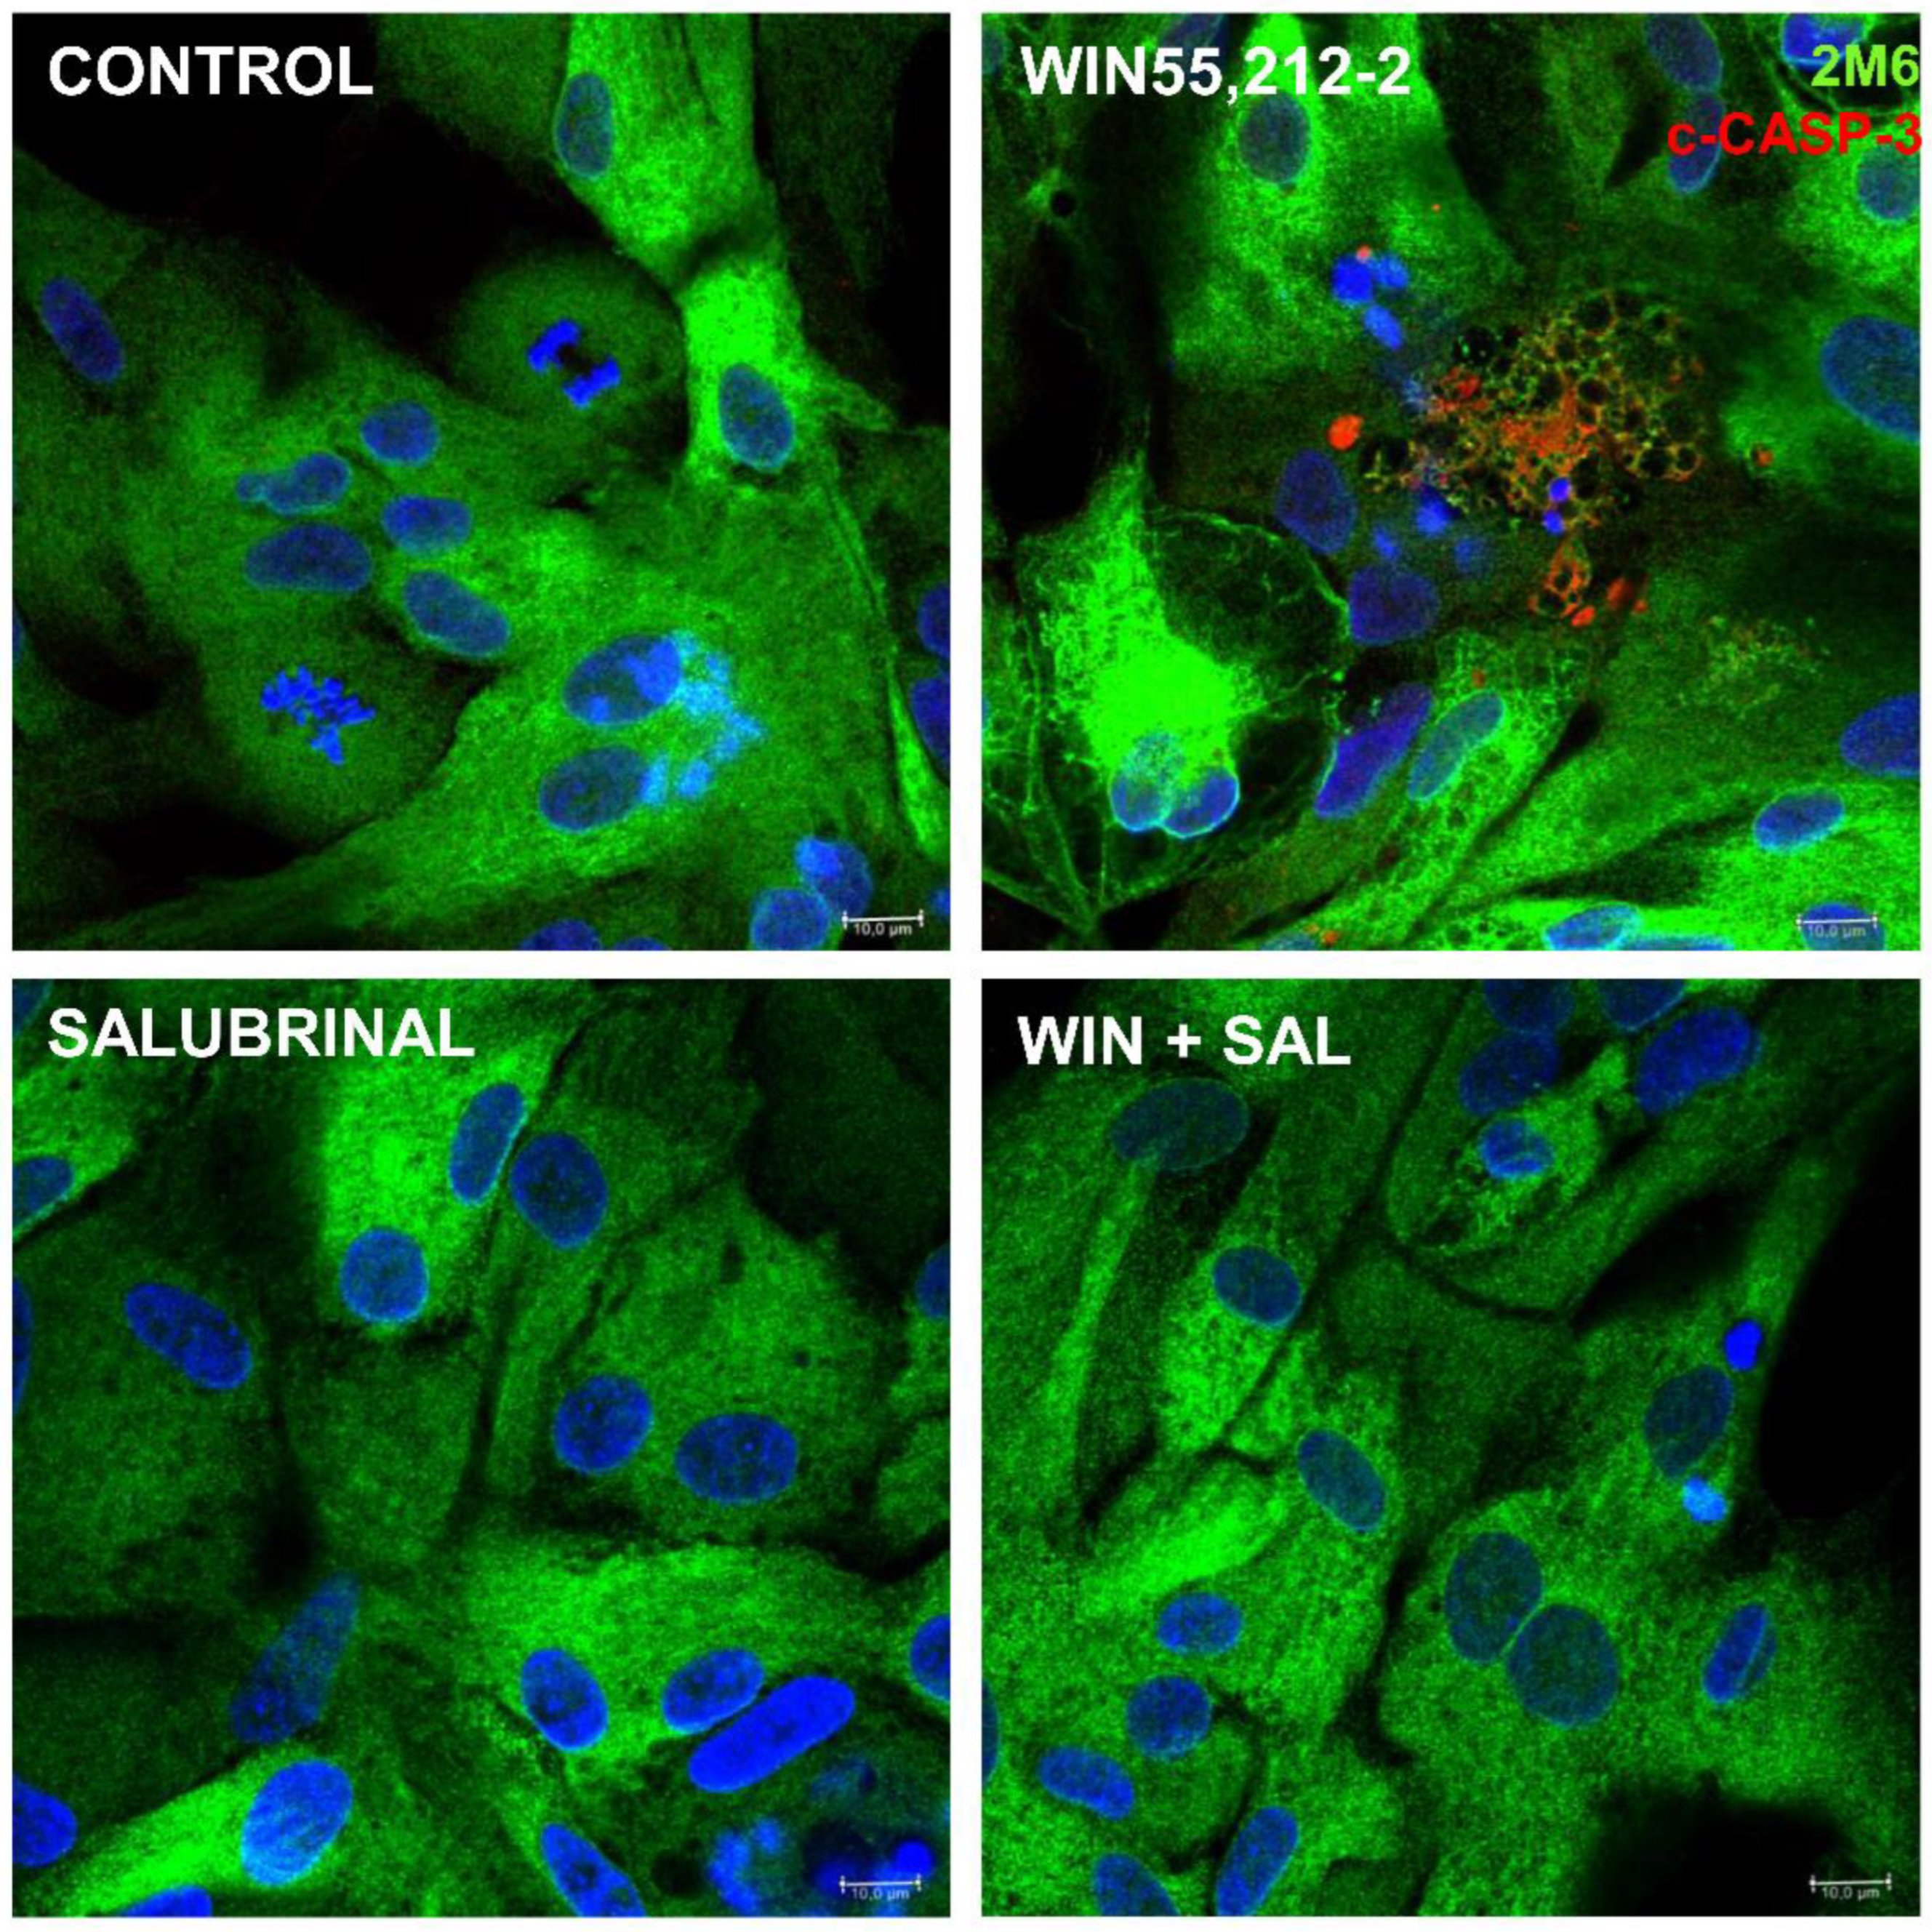
Figure 10.
Immunofluorescence assay for c-CASP 3 in glia-enriched cultures treated with salubrinal. Cultures at E8C13 were treated with 1µM WIN in the absence or presence of 50 µM salubrinal. After 24 h, cells were fixed and immunolabeled for c-CASP 3 (red) or 2M6 (green). Cultures were photographed on a confocal microscope and experiment replicated 3 times with similar results. Representative micrographs are shown. Scale bar = 10 µm.
Disclaimer/Publisher’s Note: The statements, opinions and data contained in all publications are solely those of the individual author(s) and contributor(s) and not of MDPI and/or the editor(s). MDPI and/or the editor(s) disclaim responsibility for any injury to people or property resulting from any ideas, methods, instructions or products referred to in the content. |
© 2024 by the authors. Licensee MDPI, Basel, Switzerland. This article is an open access article distributed under the terms and conditions of the Creative Commons Attribution (CC BY) license (http://creativecommons.org/licenses/by/4.0/).
Copyright: This open access article is published under a Creative Commons CC BY 4.0 license, which permit the free download, distribution, and reuse, provided that the author and preprint are cited in any reuse.


