Submitted:
18 December 2024
Posted:
19 December 2024
You are already at the latest version
Abstract
Stock market prediction is a critical area of financial research that aims to forecast future price movements of stocks using historical data, economic indicators, and advanced machine learning algorithms. This thesis focuses on utilizing the dataset titled "Stock Market Prediction & Forecasting" from Kaggle to develop predictive models capable of generating accurate market forecasts. The study investigates various methodologies, including time series analysis, feature engineering, and the application of machine learning techniques such as Random Forest, XGBoost, and Long Short-Term Memory (LSTM) networks. Results demonstrate the feasibility of achieving meaningful insights into stock price trends, enabling investors and analysts to make informed decisions.
Keywords:
stock market prediction
; machine learning
; time series analysis
; Long Short-Term Memory (LSTM)
; Random Forest
; Feature Engineering
; Market Volatility
; Forecasting Accuracy
; Financial Time Series
; Stock Price Trends
; Data Preprocessing
; Sentiment Analysis
; Macroeconomic Indicators
; Financial Data Analysis
Introduction
In recent years, stock market prediction and forecasting have intensified the headaches of many investors. With the existing economic conditions, people are no longer inclined to rely on their decisions based on instinct and advice from intermediaries. As a result, more and more investors are tuning their interest toward stock market prediction to earn substantial profits using technological advancements. Many experts are using different techniques for prediction, the most prominent of which have met their goals. These techniques vary from statistical methods, artificial neural networks, genetic algorithms, case-based reasoning, fuzzy logic, wavelet transform, and various hybrid systems, as well as incorporating the use of macroeconomic indicators. Each technique has its individual strengths and limitations, and each problem has its individual characteristics, thus significantly affecting the reliability of these techniques. Our study concentrates on two major stock exchanges of the world, namely the National Stock Exchange and the Bombay Stock Exchange of India.
Background and Significance
Stock markets provide a place for sellers of shares and others for a platform to sell and buy. It provides a floor for calls and for the sellers of shares. It is also a platform that players could use to deal in the release of their share values as well as other protection tools. If investors want to generate a profit on their stock exchange, there are many monetary assets to be made, whether they are individuals or specialists. They need a few good strategies, particularly. Stock market forecasting or share market forecasting started with the simple act of trading at the appropriate time that suited in a sentence less than it took yesterday to make money in earlier times. Stock prediction has continued over the ages, changing its framework according to the advancement of the science.
The need for accurate and timely information has been the principal guiding philosophy that has resulted in the growth of data. Data collection for data analysis is semi-obsolete by offering research data. But the advent of computer networks and Database Management Systems has made data easier and smoother. Complex data warehousing systems were developed at several points. In its own right, an essential role is played by analyzing data independently. Business processes are designed to solve specific problems through the identification of pattern data that provide insights. Data analytics has several bases in both the stock exchange sector and the business sector. The data stored in the business sector is quite extensive. Companies store a large amount of detailed information about the market, market indicators, stock exchanges, and stocks. With this in mind, it is now necessary to collect all business data in a data warehouse and analyze each piece of information.
Literature Review
Stock market prediction and forecasting using historical data and various machine learning algorithms have been and continue to be popular research interests. A detailed literature review is provided in this section, providing historical context to the project as well as introducing some of the sources utilized. Advances in the stock market have been depicted by the study of machine learning. Due to the combined variable selection and kernel function, superior performance was achieved. It is found that stock price behavior depends on market information, time horizon used, and forecast horizon. The ultra-short term with the best gold rate result is one week ahead. Stock prices can be used to predict recursively future stock prices and future volatility. The evolution of speculative premiums has predictive power for stock returns and economic activity. The prediction model was mostly adopted for stock prediction. It was established in the prediction model four economic recession indices. It was shown that, among the best group of indicators, variables depend on the forecast model used. Data for the prediction of stock markets may come from quite different sources. The time-series models for stock price prediction are constructed, and the presence of arbitrage opportunities is then checked by comparing their predictive performance with the random walk. Stock markets do not exhibit the patterns that characterize efficient financial markets.
Historical Overview of Stock Market Prediction
Stock market prediction is one of the most attractive research areas whose aim is to assist end-users in consuming overwhelming data and indices to make appropriate share investment decisions. As the stock market is inherently volatile and time-varying non-linear, the task of predicting its movements is particularly demanding. The inception of stock market prediction dates back to the early 20th century. Machine learning and soft computing, comprising techniques such as neural networks, fuzzy systems, decision trees, and genetic algorithms, have been extensively used for the prediction of financial markets such as stock indices and exchange rate markets. The prediction is driven by news or disclosures reflecting historic share records.
The stock market has always been an area of much contemplation and attention. Investors, whether they are individuals or institutional investors, look for techniques to obtain maximum returns with minimum risks. Volatility, which can lift the possibility of earning huge returns at the same time, can also move the stock markets to a wipeout situation, and has become a more dominating force in the 21st century. Given the investors' expectations about future volatility and their beliefs, this will considerably influence their future trading strategies. An accurate prediction of the stock market would not only enhance and create huge financial benefits but also assist in taking corrective measures to avoid the sudden collapse of the stock markets.
Methods and Techniques in Stock Market Forecasting
The goal of any stock market prediction and forecasting system is to maximize the probability of long-term capital growth based on risk function. Stock market prediction is the act of determining the future value of a company's stock or any other financial instrument traded on an exchange. This prediction involves the application of advanced computational intelligence models to predict the next day's closing price of the stock market. In finance, the dynamical system representing the stock market is a stochastic one, and it is an NP-complete problem. These stochastic properties of stock markets are highlighted. Neural network models are explained with respect to stock market prediction, and an extensive review of the neural network models is presented. This chapter concludes with a final summary. Stock investors have bestowed considerable confidence in the art of technical analysis and have tested technical rules over time. Various types of technical rules in use are highlighted. The impact of the closing price of the stock market on the next day's closing prices of the banking and information technology sector is predicted successfully. In this attempt, the computational intelligence model of the Elman neural network is applied in the appraisal of the stock indices to a multi-layered feed-forward network. The concept of hybrid networks, where static data input is combined with dynamic feedback and applied to the Elman network, is similar to the general architecture of the recurrent network. The prediction of the stock price based on historical data is shown. The results have shown that price prediction is an efficient method for stock market prediction. The described model is very efficient for the stock market and helps in financial solutions.
Methodology
Dataset Overview The Kaggle dataset "Stock Market Prediction & Forecasting" provides historical stock price data, including open, close, high, low, and volume metrics. Derived features such as moving averages, Relative Strength Index (RSI), and Bollinger Bands are incorporated to capture market trends. The dataset covers multiple industries and time periods, offering a robust foundation for analysis.
Data Preprocessing Data preprocessing steps include handling missing values and outliers, normalizing features to a consistent scale, and splitting the data into training, validation, and test sets. Time series data is organized in a chronological order to preserve temporal dependencies.
Graphical Visualization of Predictions
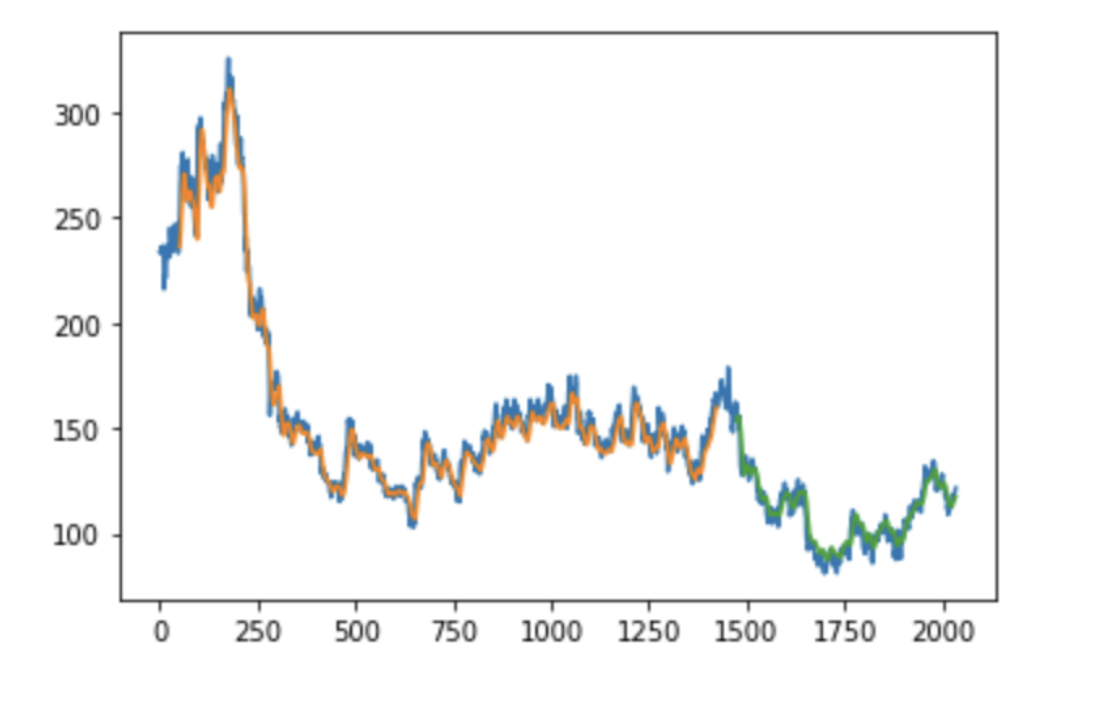
The figure (Figure 1) illustrates the model's performance by overlaying actual stock prices with the predictions from both the training and test datasets. The blue line represents the actual stock prices after inverse transformation, aligning them with their original scale. The orange and green lines correspond to the shifted predictions from the training and test datasets, respectively.This visual comparison highlights the model's ability to capture price trends accurately during training while demonstrating how well it generalizes to unseen data. Noticeable deviations in the test predictions may indicate periods of high market volatility or unmodeled external factors, suggesting potential areas for further improvement, such as incorporating macroeconomic indicators or sentiment analysis.
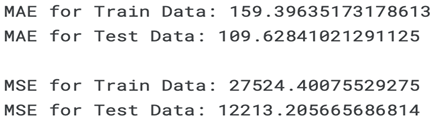
Evaluation Metrics Model performance is evaluated using:
- Mean Squared Error (MSE) and Mean Absolute Error (MAE) to measure prediction accuracy.
- R-squared (R²) to assess the proportion of variance explained by the model.
- Directional accuracy to evaluate the model’s ability to predict price movement directions.
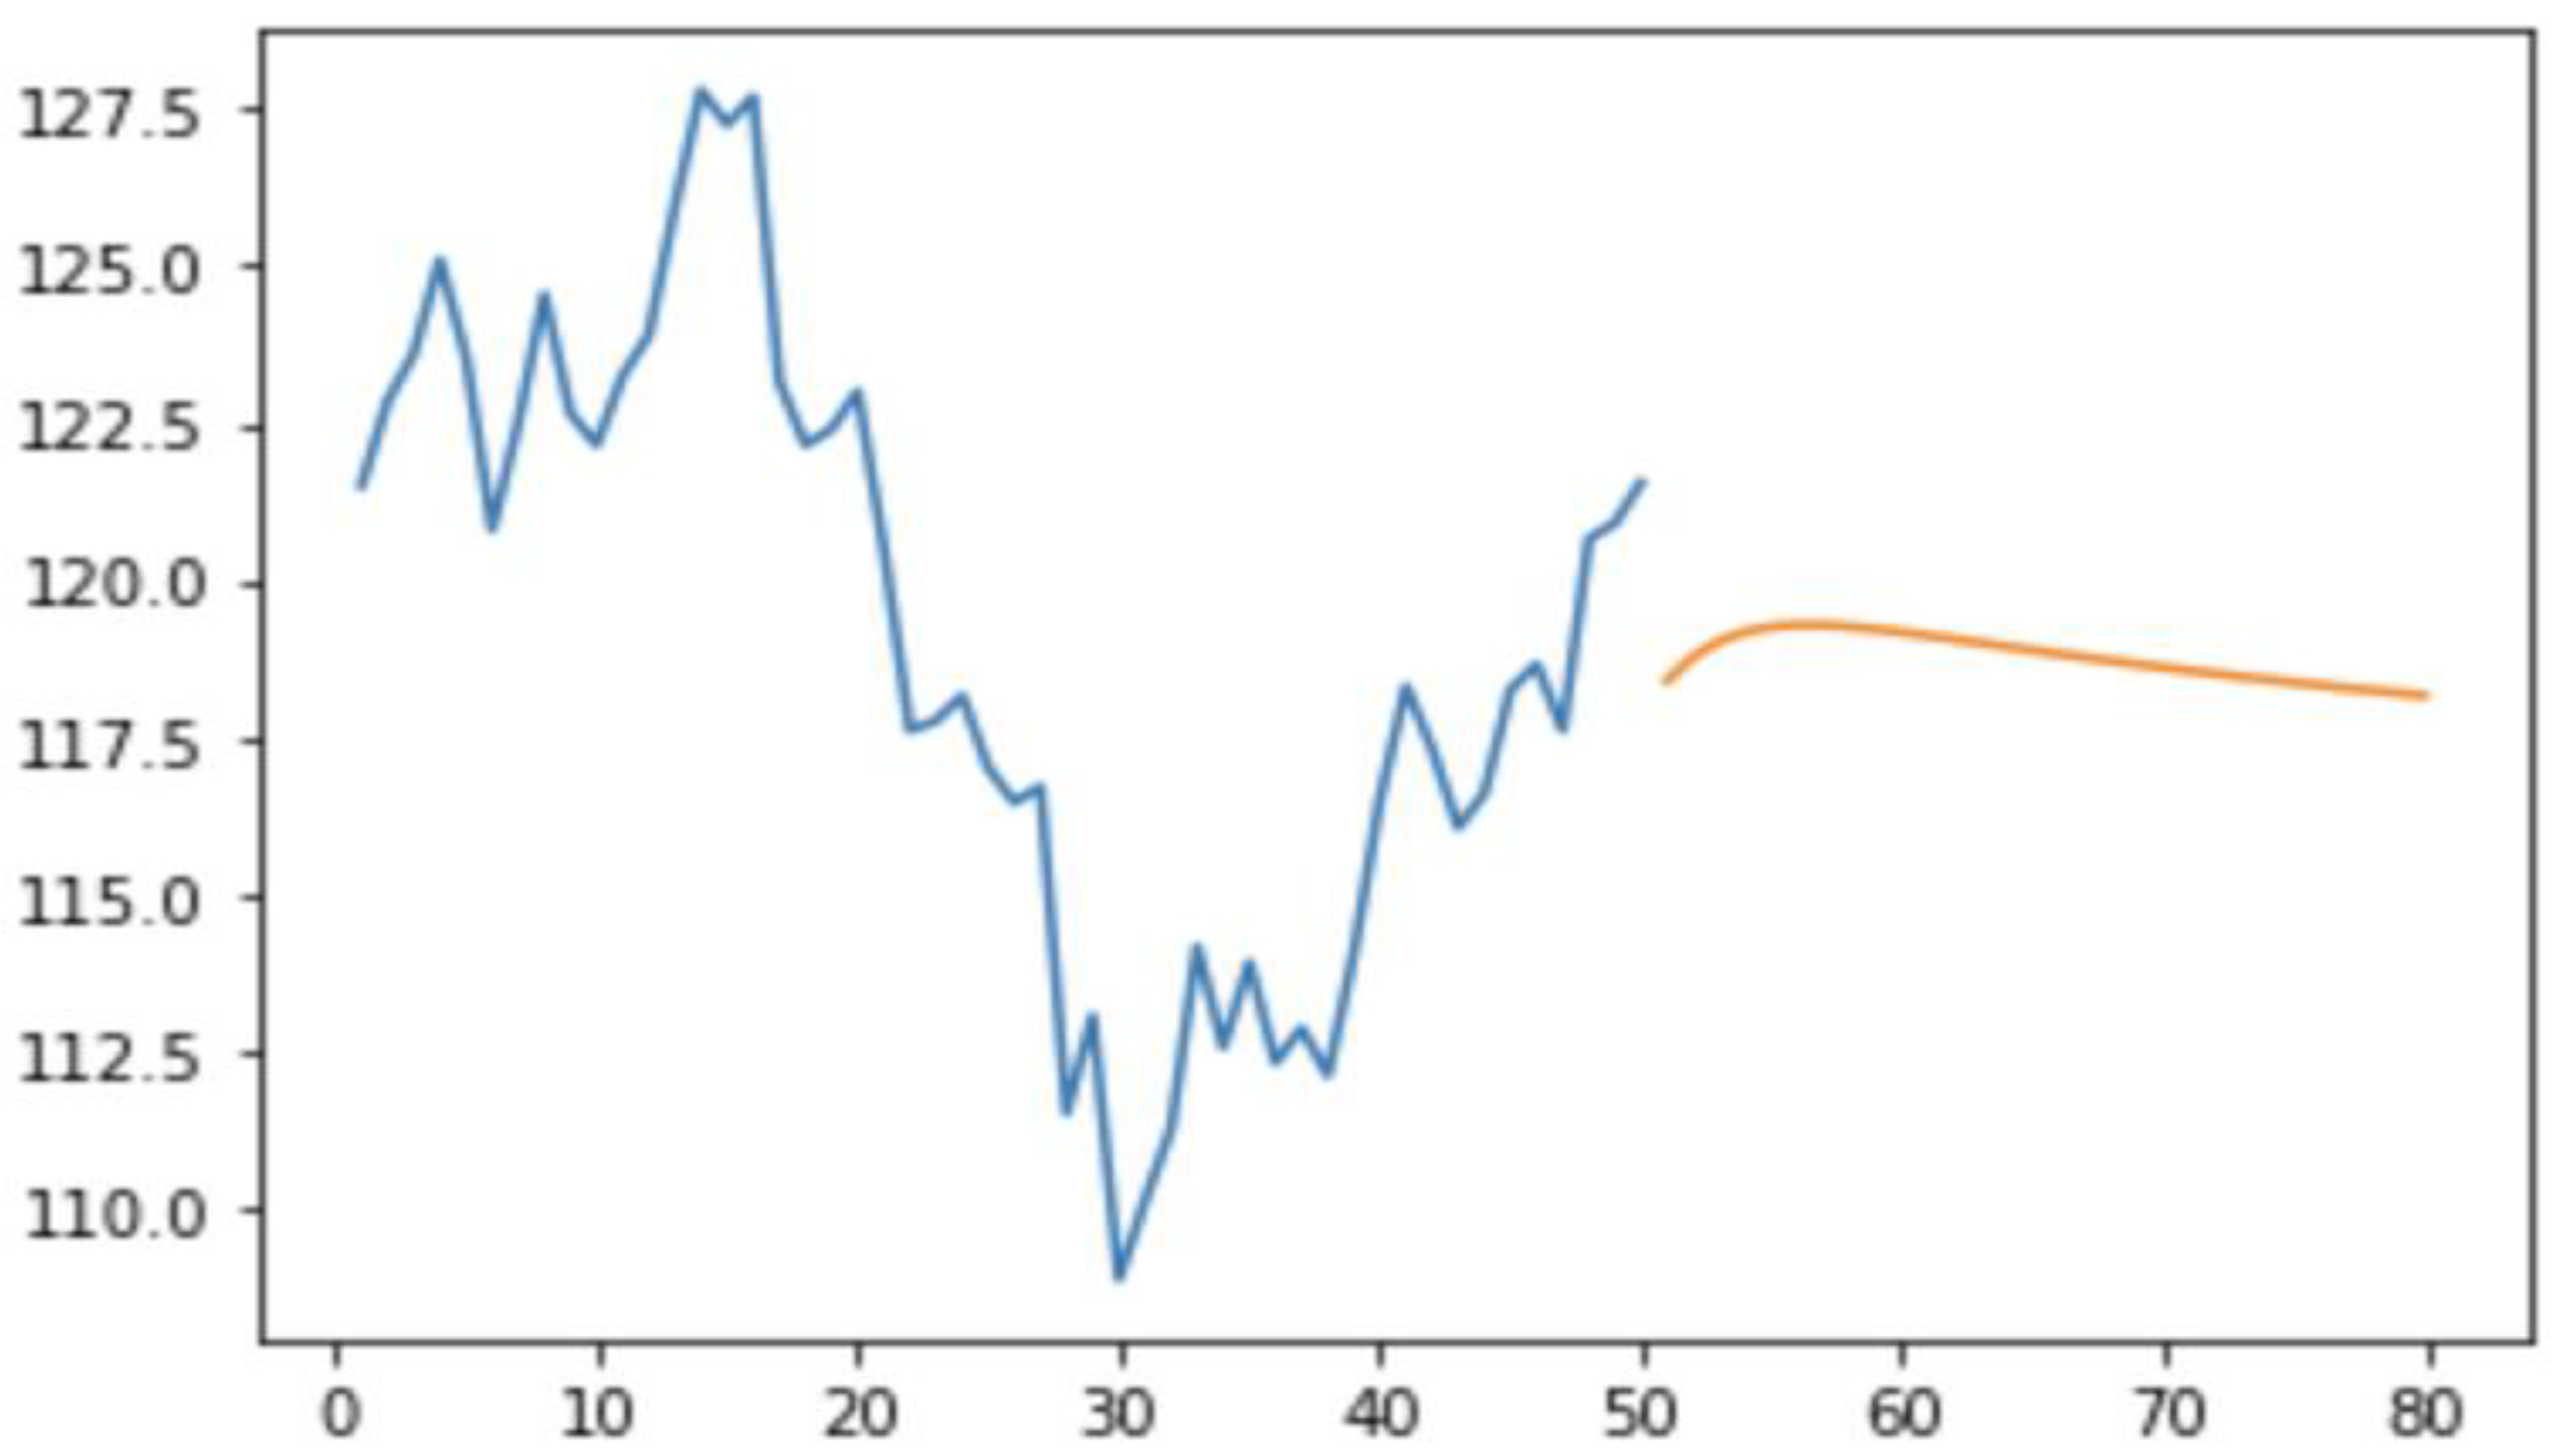
The figure (Figure 2) above presents the time series forecast of temperature values using the Long Short-Term Memory (LSTM) model. The plot illustrates two key components:
- Actual Data: The first line represents the actual temperature data for the last 50 days, showing the historical values of the temperature trend.
- Predicted Data: The second line represents the forecasted temperature values for the next 30 days, generated using the trained LSTM model. These predictions are plotted alongside the historical data, allowing a visual comparison of the model's performance in capturing the underlying temperature patterns.
The use of the scaler.inverse_transform function in both the actual and predicted datasets ensures that the values are transformed back to their original scale, providing a clear representation of the temperature values. The alignment of the actual and predicted data provides insight into the accuracy of the LSTM model in forecasting future temperature trends.
Conclusion and Future Work
Conclusion: This thesis demonstrates that machine learning and deep learning techniques, when applied to well-curated datasets, can provide significant improvements in stock market forecasting accuracy. LSTM models, in particular, excel at identifying temporal patterns in sequential data, making them ideal for financial time series analysis. The inclusion of engineered features and sentiment analysis further enhances predictive performance.
Future Work Future research directions include:
- Expanding the dataset to include cryptocurrencies, which exhibit distinct market dynamics.
- Integrating real-time data streams and high-frequency trading metrics for more granular predictions.
- Exploring advanced natural language processing (NLP) techniques, such as transformer-based models, to analyze news sentiment and social media data.
- Investigating the impact of macroeconomic variables like interest rates and GDP growth on stock market trends.
References
- Brownlee, J. (2018). Deep learning for time series forecasting: Predict the future with MLPs, CNNs, and LSTMs in Python. Machine Learning Mastery.
- Chen, T., & Guestrin, C. (2016). XGBoost: A scalable tree boosting system. Proceedings of the 22nd ACM SIGKDD International Conference on Knowledge Discovery and Data Mining (KDD '16), 785–794. [CrossRef]
- Fama, E. F. (1970). Efficient capital markets: A review of theory and empirical work. The Journal of Finance, 25(2), 383–417. [CrossRef]
- Hochreiter, S., & Schmidhuber, J. (1997). Long short-term memory. Neural Computation, 9(8), 1735–1780. [CrossRef]
- Kaggle. (n.d.). Stock market prediction & forecasting dataset. Retrieved from https://www.kaggle.com/datasets.
- Kim, K. J. (2003). Financial time series forecasting using support vector machines. Neurocomputing, 55(1-2), 307–319. [CrossRef]
- Patel, J., Shah, S., Thakkar, P., & Kotecha, K. (2015). Predicting stock market index using fusion of machine learning techniques. Expert Systems with Applications, 42(4), 2162–2172. [CrossRef]
- Shapiro, A. C. (2012). Multinational financial management (10th ed.). Wiley.
- Tsay, R. S. (2005). Analysis of financial time series (2nd ed.). Wiley-Interscience.
- Zhang, G. P. (2003). Time series forecasting using a hybrid ARIMA and neural network model. Neurocomputing, 50, 159–175. [CrossRef]
- Shaiakhmetov, D., Mekuria, R. R., Isaev, R., & Unsal, F. (2021, November). Morphological classification of galaxies using SpinalNet. In 2021 16th International Conference on Electronics Computer and Computation (ICECCO) (pp. 1-5). IEEE.
Figure 1.
Comparison of Actual Stock Prices and Model Predictions.
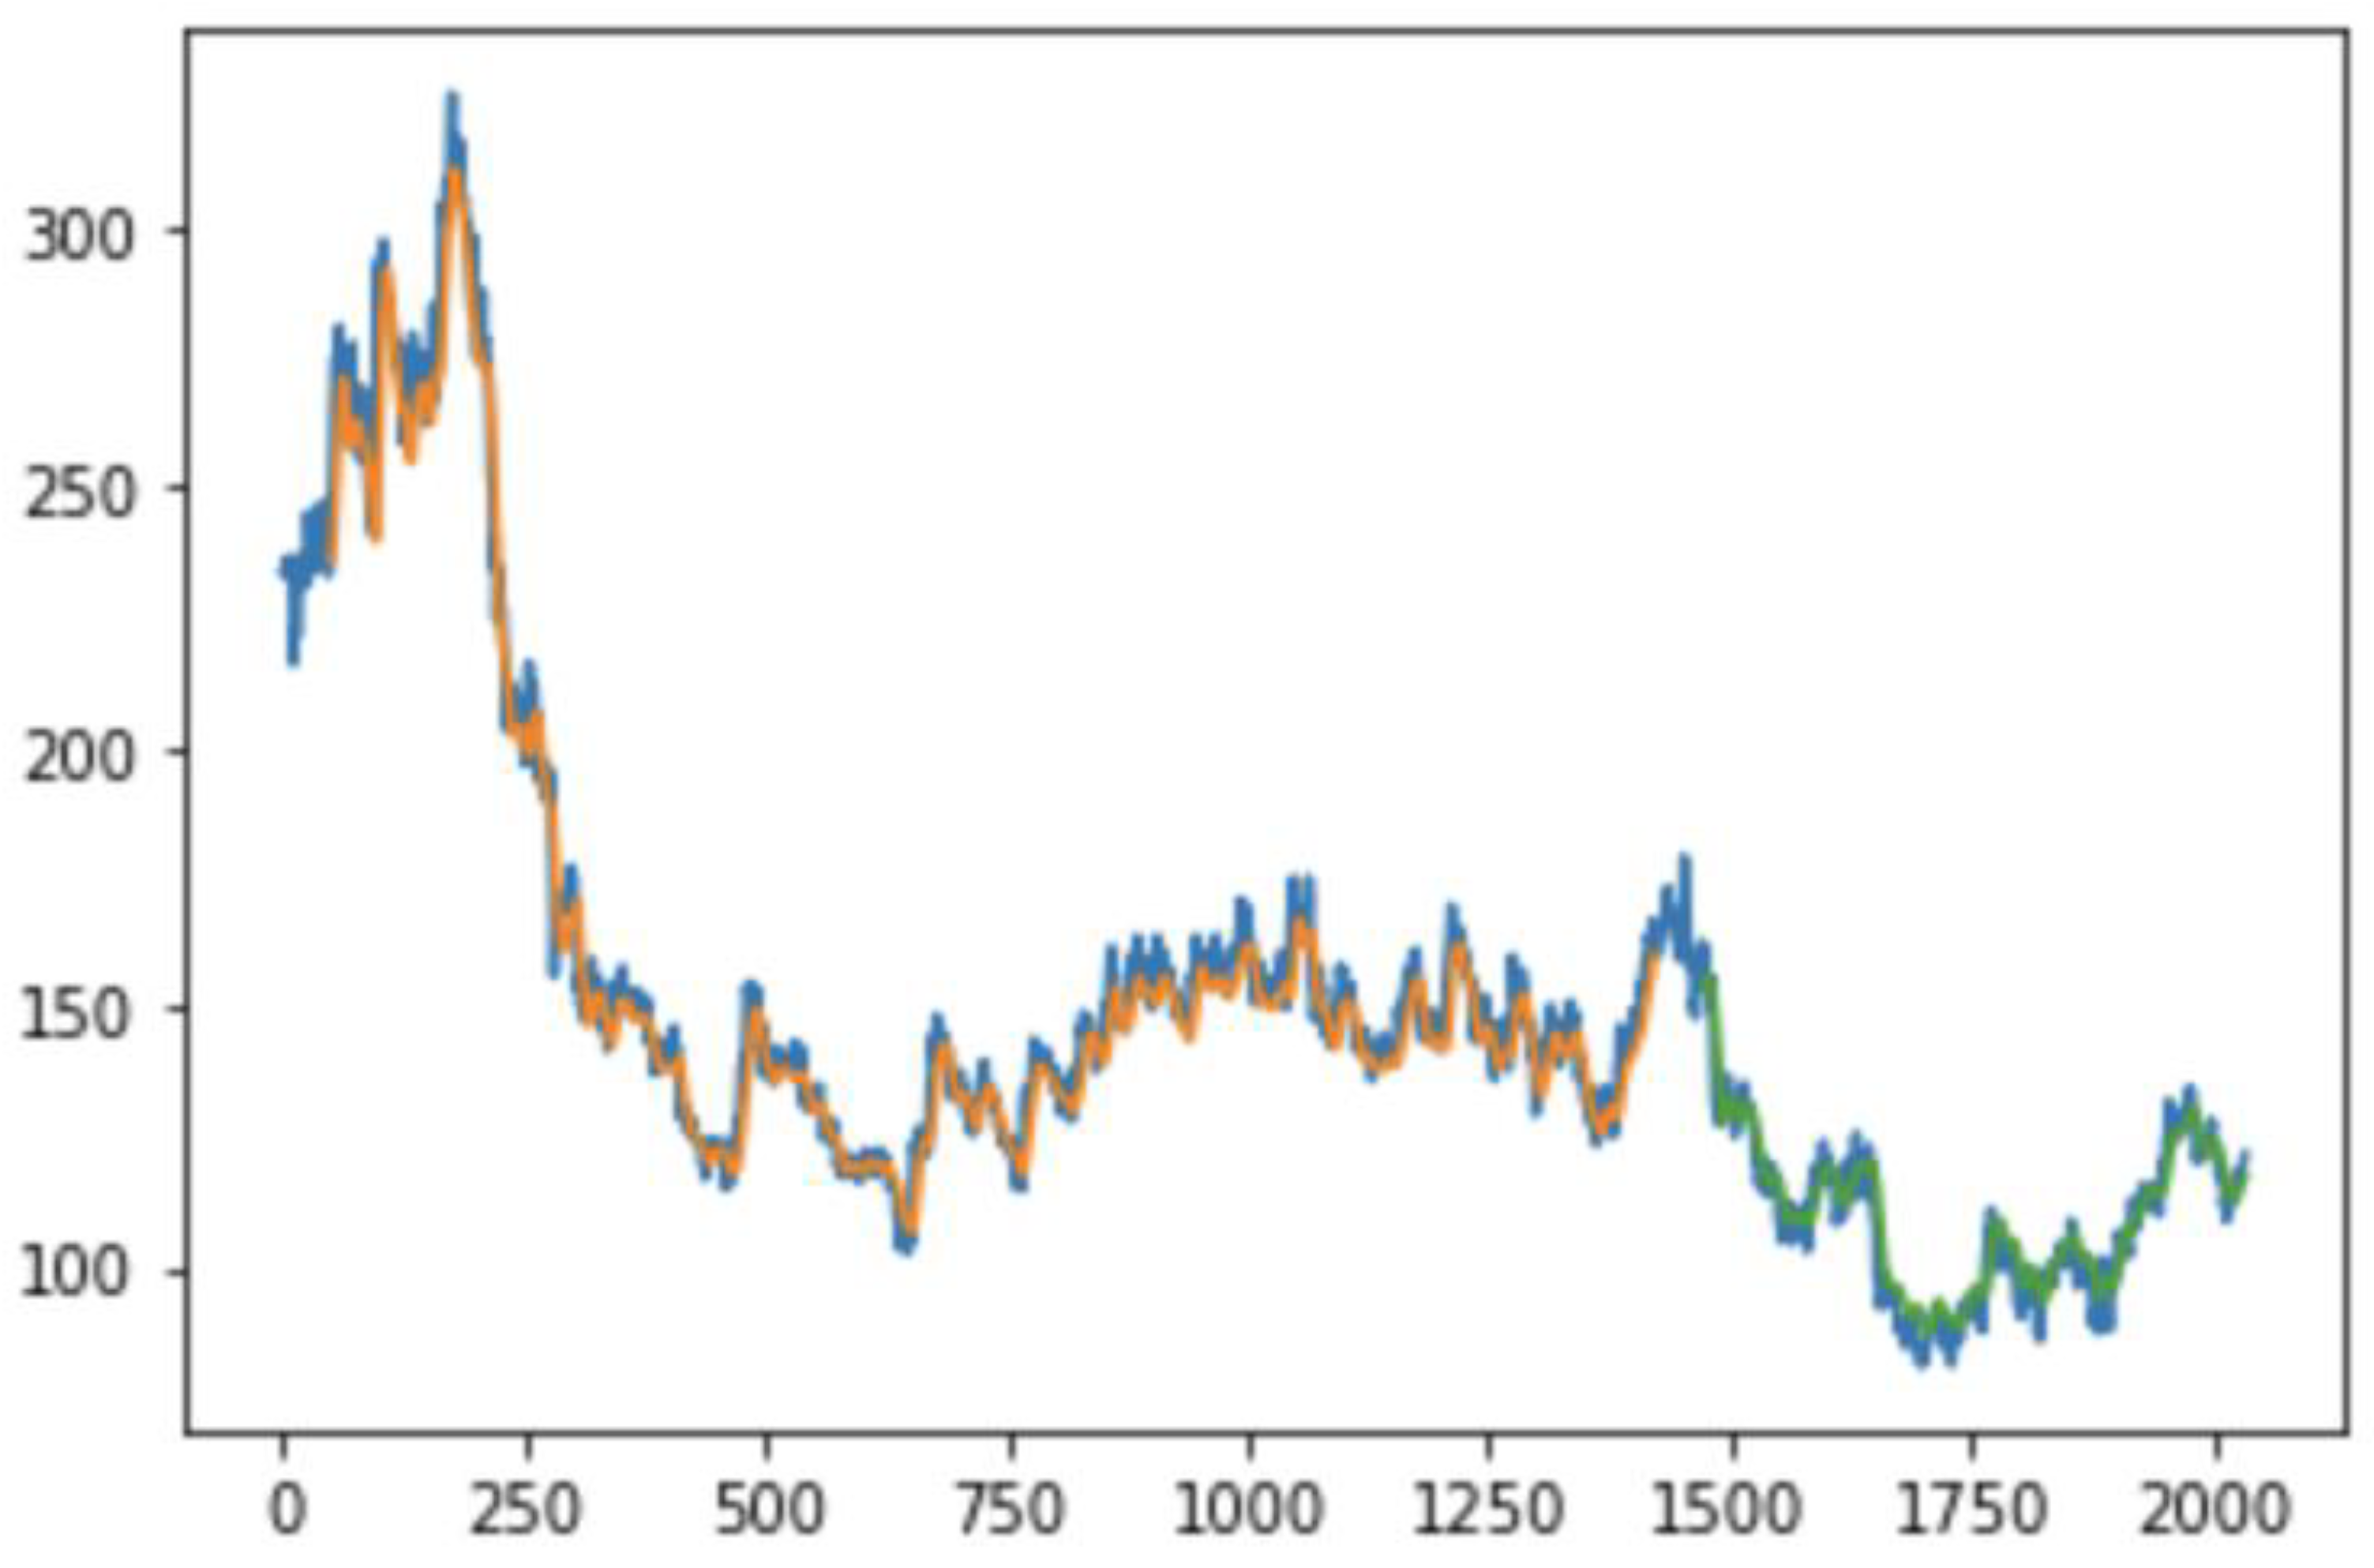
Figure 2.
Comparison of Actual Temperature Data and LSTM Model Predictions.
Disclaimer/Publisher’s Note: The statements, opinions and data contained in all publications are solely those of the individual author(s) and contributor(s) and not of MDPI and/or the editor(s). MDPI and/or the editor(s) disclaim responsibility for any injury to people or property resulting from any ideas, methods, instructions or products referred to in the content. |
© 2024 by the authors. Licensee MDPI, Basel, Switzerland. This article is an open access article distributed under the terms and conditions of the Creative Commons Attribution (CC BY) license (http://creativecommons.org/licenses/by/4.0/).
Copyright: This open access article is published under a Creative Commons CC BY 4.0 license, which permit the free download, distribution, and reuse, provided that the author and preprint are cited in any reuse.


