
Submitted:
12 December 2024
Posted:
13 December 2024
You are already at the latest version
Abstract
Natural weathering of carbonate building surfaces exposed to outdoor conditions can be effectively tackled by appropriate products. The aim of this experimental study was to evaluate the effectiveness of nano-zirconia (n-ZrO2) as a consolidant for calcite surfaces. Sorption kinetics were investigated in batch experiments by applying aqueous dispersions of n-ZrO2 onto model, crushed Apuan marble samples of different bead sizes. Adsorption, and desorption by the action of simulated rainwater as an environmentally relevant leaching solution, were investigated. Adsorption studies revealed a good chemical affinity between n-ZrO2 and calcite while desorption resulted in < 6% release of n-ZrO2 and 100-fold lower solubility for 1 mm-sized beads compared to controls. These results suggest that n-ZrO2 may adsorb efficiently to calcite and protect the surface from dissolution. The results of further tests performed on artificially aged and consolidated samples of Apuan marble indicate that the application of n-ZrO2 only moderately affects water vapor permeability, water absorption coefficient and drying behavior. Therefore, no harmful effects are expected from the treatment. Micromechanical tests showed slightly increased mechanical strength after treatment. The obtained results highlight the effectiveness of n-ZrO2 as a surface consolidant and protective agent for calcite.
Keywords:
Nanoparticles
; Sorption Kinetics
; Inductively Coupled Plasma Mass Spectrometry
; Zeta-Potential
; Built Heritage
; Natural Stone
; Treatment Performance
1. Introduction
White crystalline marble is one of the widespread materials used for sculptural work and built heritage. Environmental exposure is responsible for chemical and petrophysical changes occurring on this stone. The decay patterns observed on marble, particularly in highly polluted urban areas, can reach forms of degradation classified as sugaring or powdering [1], which implies severe loss of mechanical strength and accelerated surface erosion. For such reasons, it is not surprising that facades and sculptural work made out of marble need restoration and conservation care. To revert the loss of cohesion between grains, application of a stone consolidant may be necessary. Products in use for this purpose range from inorganic materials (e.g. hydroxyapatite, calcium hydroxides, ammonium oxalate, etc.) to synthetic polymers (e.g. acrylics) or hybrid systems such as organosilica or its precursors alkoxy- and alkylalkoxy-silanes. Among them, the low molecular weight silane-based systems undergo polycondensation reaction to produce a silica or organosilica gel and eventually a strongly adhesive layer; therefore, they are commonly used to consolidate stone [2]. However, because of the volume shrinking and embrittlement occurring upon sol-gel type polycondensation, alkoxysilanes present some limitations, like cracking or poor chemical bonding to carbonate substrates. Such limitations contributed to the development of particle modified and multifunctional consolidants [3,4,5]. Unfortunately, much of the current research is limited to the laboratory, and the developed products rarely reach the market that would make them more easily available for the application onto the monument’s surfaces, or of other artifacts where they are needed. The European Union (EU) has made efforts in the last decades to support industry-based research on conservation of the built heritage and promote the development of innovative materials. This is exemplified by past EU-funded projects such as Stonecore, Nanomatch, Nanorestart or Nano-Cathedral. As some of the names imply many of the newly engineered products are nanometric-based systems.
Nanotechnology is commonly applied in paints, coatings and sealants for protecting different building surfaces from stain, scratch or water adsorption, amongst others [6]. The most frequently engineered nanoparticles (ENPs) used as facade protective agents are silver (AgO2), titanium dioxide (TiO2), alumina (Al2O3), zinc oxide (ZnO) and silicon dioxide (SiO2) due to capabilities in UV shielding, water and dirt repellence, and antimicrobial properties [7,8,9]. In addition, some ENPs are studied and used as effective consolidants, like calcium hydroxide (Ca(OH)2), silicon dioxide, calcium carbonate (CaCO3) polymorphs and zirconia (ZrO2) [10,11,12]. The advantage of consolidating with ENPs should lie in a more reactive surface and thus possibly better bonding to the substrate, their abilities to penetrate smaller pores, and even to prevent environmental degradation processes due to their functionality [13].
To assess the efficiency of a newly developed consolidant, different methods can be employed. The primary focus of consolidants is to restore the loss of cohesion and re-establish the physical properties of the weathered substrate. Therefore, mechanical tests are used to determine the effectiveness of treatments, often in combination with scanning electron microscopy (SEM) to analyze the microstructural features of the consolidated substrate. Furthermore, chemical compatibility with the substrate should be considered. Among the main properties of the treated stone that need to be pursued are a smooth mechanical depth profile, no drastic reduction of vapor permeability and mild visual changes. Only few studies provide insight into the surface-consolidant chemical compatibility, related to the interfacial bonding interaction. This information is relevant to better understand the effectiveness of the consolidants. For well-known systems like alkoxysilane and siliceous sandstone, there seems to be a wide acceptance that Si-O-Si bonds are formed between the substrate and the silica gel [14]. However, for many stone consolidating materials, knowledge and studies that deal with sorption or chemical bonding are still missing. In fact, while adsorption and interfacial interaction at the microscopic level impact macroscopic properties such as cohesivity and chemical compatibility, desorption can play a critical role when considering durability and environmental aspects of newly developed materials intended for such long-term applications.
Once in the built environment, ENPs may be released from the surfaces and transported via surface leaching/runoff (e.g., by rainwater) to surface waters, soil and groundwater, where they may present their original properties or undergo chemical and/or physical transformations (i.e., according to the individual ENPs reactivity [15,16]). Both direct release of ENPs and the potential dissolution of the contained metal ions are of environmental concern in aquatic systems, especially in the case of biocidal ENPs and the potentially bioavailable Au, Zn, Ag, Cu and Ti forms [9,17]. Studies concerning leaching of TiO2 and AgO2 from paints in outdoor surfaces [18,19,20] and modelling of ENPs mobility with rainwater runoff from building facades or within aquatic systems [21,22] have increased in the last years, prompted by growing concern about emerging environmental pollutants [23] and resulting in the release of new regulations [24]. Even though several studies have documented the presence of ENPs in industrial and municipal solid waste leachates, including landfills [25,26], ENPs are not systematically monitored in the environment [27]. Thus, there is still little knowledge on the release rates of ENPs under natural conditions [28] and their environmental risk assessment [24].
This environmental knowledge is even scarcer for zirconium-based nanoparticles [9], appropriate ENP candidates for consolidating stone materials in building facades given its general inert/biocompatible chemical properties and its high mechanical strength. Nano-ZrO2 is mostly used in dentistry and ceramic powders, for which studies on their surface properties have generally shown higher absolute values of zeta-potentials (e.g., [29,30]) compared to those encountered in leachate suspensions from commonly used ENPs in paints (i.e., generally within ± 30 mV indicating flocculation [31]). Nevertheless, the effective toxicity of n-ZrO2 remains unclear given that ecotoxicological studies have shown both no-effect (e.g., no impact in plant growth promoting rhizobacteria in soils [32]) and significant effects for both nanoparticles and dissolved Zr-based complexes (e.g., impact in bacterial growth [33]).
The aim of this work was to analyse the reactivity of n-ZrO2 on calcite (i.e., Apuan marble) in simulated natural conditions in order to understand the interaction between the newly engineered consolidants with crystalline marble for purposes of built-heritage preservation. The study was performed via adsorption and desorption batch experiments in two contrasting conditions (i.e., simulating onsite consolidant application with diluted solutions during adsorption and simulated rainwater for desorption) with two different particle sizes of marble (i.e., 0.25 mm and 1 mm) and two solid-liquid ratios (i.e., between the marble and the exposed solution, of 100 and 200 g/L). Three different consolidant dilutions (d100, d1000 and d10000) were tested (i) to explore the chemical compatibility between the surface area and the amount of consolidants, and (ii) to obtain insights on the leaching capability of the applied ZrO2 nanoparticles into water systems (environmental risk assessment). As the n-ZrO2 studied is a newly engineered product, additional aspects of the work involved the determination of treatment performance, including the analysis of mechanical strength gain, changes in water-based behaviour and colloidal phase, and electrokinetical characterisations of the systems.
2. Materials and Methods
2.1. Characterization and Preparation of The substrate
Apuan marble is a white crystalline lithotype quarried from the Apuan Alps in Italy, often referred to as Carrara marble from the province where most of this metamorphic rock is extracted [34]. It mainly consists of calcite (approx. 99 wt.%), with traces of quartz and dolomite (< 1 wt.%), and it is known for its high strength (uniaxial compressive strength from 123 to 172 MPa) and durability related to its low Hg-porosity (approx. 0.6 %). Thermal effects play an important role in Apuan marble degradation due to the highly anisotropic thermal expansion coefficient of calcite [35]. When severe degradation occurs, granular disintegration is commonly observed. As Apuan marble is a fine grained lithotype, its surface to volume ratio increases significantly when inter- and intragranular cracks occur, often propagating into sheet-like intergranular spaces [2] that need to be restored in terms of their cohesion.
In the present study, two forms of Apuan marble were employed as test materials, that is, as granular aggregates for sorption studies and in solid form to assess treatment performance through various physical tests. For sorption studies, it was desired to increase the surface area of the material for better resolution in kinetic experiments, which is why the marble was crushed into chunks and then grinded for 30 seconds in a planetary ball mill. Afterwards it was wet sieved with the help of a mechanical shaker, using a set of sieves with 2.0 mm, 1.0 mm, 0.5 mm, and 0.25 mm mesh. Two sieve fractions were selected for the subsequent experiments: the fraction from 0.25 to 0.5 mm (hereafter labeled “0.25 mm sample”) and the one from 1 to 2 mm (hereafter labeled “1 mm sample”). The obtained fractions were dried at 60 °C, allowed to equilibrate under laboratory conditions, and then stored in sealed high-density polyethylene containers.
Surface area measurements (Brunauer-Emmett-Teller, or BET, method) were performed using the model Sync 200 3p-Instruments Analyzer (from 3P Instruments GmbH & Co. KG, Odelzhausen, Germany) using N2. The measured specific surface area of the two selected fractions was 0.440 m2 g-1 and 0.149 m2 g-1 for the 0.25 mm sample and the 1 mm sample, respectively.
In addition to the batch sorption experiments, visual, physical and water-related tests were also performed on artificially aged and consolidated samples of Apuan marble in order to test treatment performance. The main reason for artificial ageing of tests specimens prior to consolidation is that Apuan marble in its pristine condition can be classified as a water hindering material, which limits a laboratory-based study of treatment performance as no consolidant is able to penetrate the substrate. Therefore, a very common way to decrease the soundness of the material is by inducing micro cracks into its fabric by heat-stresses [36]. For this purpose, the specimens were placed in an electrical heated chamber furnace model Heraeus K 114 (3.5 L in volume, by Thermo Scientific). The experimental setup for the heat-treatment, as defined after an experimental pre-screening [37], involved three heat treatment cycles at a static peak temperature of 600 °C (heating from room to the peak temperature at 40 °C min-1, followed by an isothermal step of one hour. Subsequent cooling to approx. 35 °C with an open front door of the chamber was done before the next heating cycle was adopted.). These samples were used for micromechanical tests as described in section 2.6 and 3.5.
2.2. Experimental Solutions: Nano-ZrO2 and Simulated Rainwater
The water dispersion of n-ZrO2 used in this study is a commercial product developed as a stone consolidant by Tecnan – Technologia Navarra de Nanoproductos, S.L. (Navarra, Spain). The specific formulation, under the tradename ZR110 (NC-29C), had been developed within the ‘Nano-Cathedral’ project, funded by the European program Horizon 2020 Call NMP21-AC 646178. As an industrially developed product, details of its preparation are protected by a non-disclosure agreement. According to the manufacturer’s data sheet, ZR110 is a 11±0.5 wt. % aqueous colloidal dispersion of ZrO2 NPs about 120 nm in size. The dispersion has a density of 1.09 g/mL, viscosity of 7 cP and conductivity of 5.84 mS/cm. The strengthening effect is achieved upon drying of the treated substrate, when the nanoparticles within the porous stone build bridging structures between detached stone grains. For the adsorption experiments, the original ZrO2 NPs solution was diluted in deionized water (Milli-Q® water 18.2 MΩ cm-1) as described in section 2.3.
Simulated rainwater was prepared following the characteristic average annual rainfall in northern Europe [38]. Briefly, a mixture of 1 mM potassium sulphate (Normapur, VWR Chemicals), 7 mM sodium sulphate (Normapur, VWR Chemicals), 4 mM sodium nitrate (99.5%, Merck), 14 mM anhydrous calcium chloride (ACS Chemicals) and 4 mM magnesium chloride anhydrous (99%, Alfa Aesar) was prepared in Milli-Q® water, resulting in a working solution with ionic strength of 0.03 mM and a pH of 5.9.
2.3. Experimental Design: Adsorption/Desorption Batch Kinetics
Sorption experiments were conducted at 100 and 200 g/L solid/liquid ratios by mixing 5 g and 10 g of marble in 50 mL final volumes, respectively. For the adsorption experiments, different dilutions (i.e., 100, 1000 and 10000 times) from the original consolidant concentration of 11±0.5 wt.% ZR110 were tested. Experimental controls during adsorption included marble dispersions in 1 mM KCl (i.e., no consolidant, to account for calcite dissolution kinetics) and the diluted consolidant solutions (i.e., no marble, to account for potential nanoparticle precipitation during sampling).
All dispersions were prepared in BluCAPP 50 mL, polypropylene (PP) tubes. The dispersions were shaken over time in an overhead shaker (IKA® Trayster basic) and sampled at 0 min, 5 min, 15 min, 30 min, 1 h, 4 h and 24 h after mixing the marble with the consolidant at different dilutions. Given the relatively high concentration of nanoparticles, solid-liquid separation was not possible neither by filtering, due to filter clogging resulting in high-pressure resistance, nor by centrifugation, because of the risk of decanting nanoparticles, biasing the results. Therefore, the sampling strategy consisted of a systematic procedure of manual shaking (i.e., three shakes), then a settling/standing period of 5 seconds (i.e., enough time for the marble beads to visibly sediment to the bottom of the tube), followed by pipette collection of the upper 5 mL and acidification with to 2% HNO3 before analysis (15M Rotipuran® Ultra). With this sampling procedure the solid/liquid ratio was found to increase up to four-fold over time as the total volume is reduced while the marble bead mass remains nearly the same. This effect may result in enhanced adsorption behavior over time. Nevertheless, it is possible that these are representative conditions, potentially mimicking in-situ effects, e.g., evaporation of consolidant dispersion on building facades. At the end of the experiments, the supernatant was collected, and the remaining solids were covered (to avoid possible contamination) and oven-dried 60 h at 60 °C to mimic real on-site conditions (i.e., dry marble facades after treatment with commercial consolidant solutions) before subsequent batch desorption experiments.
Desorption experiments were carried out by flooding with 50 mL of simulated rainwater (see section 2.2) the oven-dried solids. Controls of marble aggregates (marble without consolidant) and rainwater (rainwater without marble) were also included. Sampling at 0 min, 15 min, 30 min, 45 min, 4 h and 24 h after mixing followed the same procedure adopted in the aforementioned adsorption experiments.
2.4. Quantification of ZrO2 Nanoparticles
Samples collected from sorption experiments were digested with 50 µL of HF (42% ULTREX II, J.T. Baker) for two days. As there are no certified reference materials for ZrO2 NPs, we used the experimental control samples as proxies for the digestion procedure. Both dissolved Ca and Zr concentrations were analyzed after dilution in 2% HNO3 (J.T. Baker ultrapure) via external calibration with a triple quadrupole inductively coupled plasma mass spectrometry (ICP-MS; iCAP-TQ, Thermo Scientific) in kinetic energy discrimination (KED)-mode (He). Potential interferences were checked for 91Zr and 44Ca (e.g., polyatomic influences of V and Si) but no corrections were required as the experimental concentrations were in the ppm range. Detection limits (LOD) for dissolved Zr and Ca concentrations were 6.8 ± 4.3 ng/L and 5.6 ± 1.5 µg/L, respectively, for several analyses of 3 blanks involving 2% HNO3 (J.T. Baker ultrapure). Recoveries of analytical performance were 109 ± 1% for Ca (SPS-SW2) with an RSD (relative standard deviation) of 11% for the non-certified Zr. Digestion blanks (n=2), used to control potential contaminations from the digestion processes, were max. 0.59 µg/L on Zr and of 49 µg/L on Ca, i.e., at least 1 and 3 orders of magnitude below sample concentrations, respectively. The composition of the simulated rainwater had also little influence on the batch samples (i.e., 18.0 ± 8.0 ng/L for Zr and 480 ± 13 µg/L for Ca).
2.5. Surface Characterization: Nanoparticle Size, Solution pH and Zeta-Potential
The size and size distribution of ZrO2 nanoparticles were measured by dynamic light scattering (DLS) using a Brookhaven ZetaPlus Zeta Potential Analyzer (Brookhaven Instruments Corporation®). Zeta (ζ) potentials were determined in two ways: (1) via DLS for the n-ZrO2 properties and (2) via streaming current for Apuan marble surfaces.
Single point ζ-potentials were measured via electrophoretic mobility () with a NanoBrook 90Plus PALS (Brookhaven®) instrument and calculated into potentials by using Hückel’s approximation (Eq. 2):
where V0 is the terminal velocity, E0 is the electrical field applied, is the measured electrophoretic mobility in (μ/s)/(V/cm), is the viscosity of the medium (cP) and is the permittivity of the solution. These single points of ζ-potential measurements were used to characterize the electrostatic properties of the colloidal solution and account for its stability when diluted for purposes of sorption analysis.
Measurements of ζ-potential on flat macroscopic Apuan marble surfaces were performed on solid fresh test specimens with the SurPASSTM Electrokinetic Analizer (Anton Paar GmbH, Austria). The streaming current measurements were performed using the adjustable gap cell configuration. In this cell, the two flat walls of the slit through which the probing electrolyte solution flows consist of the surfaces of Apuan marble under investigation. The streaming channel amounts to 20 mm length, 10 mm width and with a gap height that can be adjusted to assure proper flow conditions. The experimental conditions were as follows: (i) a 0.03 mM simulated rainwater as probing electrolyte, (ii) the simulated rainwater with titrated addition of up to 10 mM CaCl2 to introduce potential determining ions (PDI) of calcite and, (iii) subsequent pH titration with HCl to evaluate for pH and salinity dependence. As a comparison, the ζ-potential of the Apuan marble was also determined in a 1 mM aqueous KCl solution. The pH titration was done in the range from 7.5 to 4.5 with a 0.05 M HCl solution using the automatic titrator module of the apparatus. All probing electrolytes were purchased from Sigma-Aldrich Chemie GmbH and were diluted to the target concentrations from a stock solution. The probing electrolyte solution was not purged with N2 (a common procedure in conventional measurements aimed at removing any dissolved CO2) to better simulate the batch experimental conditions.
The ζ-potential obtained from solid surfaces of Apuan marble, was calculated from streaming current data according to Eq. 3:
where η [Pa s] is the dynamic viscosity of the electrolyte, ε and εo are the dielectric constant of the electrolyte solution and the vacuum permittivity [8.854 x 10⁻¹² F·m-1], respectively, ζ-(Istr) represents the ζ-potential derived from streaming current measurements and the streaming current coupling coefficient. The latter is experimentally obtained from the slope of the linear fit of streaming current [A] to pressure difference ramp [Pa].
2.6. Treatment Application and Treatment Performance
The consolidant in its original concentration was applied twice, with a pause of 24 hours between each application, by means of rising capillary absorption for one hour. After treatment application, the specimens were placed in a loosely opened container to avoid quick drying and possible back migration of the ENPs. Table 1 displays the testing methods used to assess the efficiency of the treatment and its compatibility. All samples have been tested in their pristine, artificially aged and subsequently consolidated conditions approx. one month after application.
Scanning Electron Microscopy
A QUANTA FEG 450 (FEI) scanning electron microscope was used to analyze polished cross sections and broken fragments of the consolidated stone specimens. In the cross sections, the bonding, spatial distribution, and bridging capacity of the cured consolidants was analysed, while on the fragments the top layer of the consolidant was investigated in terms of microstructure and topology. The samples were mounted on aluminum sample holders, coated with a 5 nm thick gold film prior to analysis, and observed at 20 kV accelerating voltage in backscatter and secondary electron mode. The analysed depth of the polished cross sections was up to 0.5 cm because the studied consolidant is intended to strengthen the surface and subsurface layers.
Mercury Intrusion Porosimetry
The porosimetric features of the substrate in all its conditions were determined by a Porosimeter Porotec Pascal 140/440 (Thermo Fisher Scientific Inc., Waltham, MA, USA). All measures were performed in duplicate to account for the uniformity of the same sample state. The size of the analysed sample amounted to 1 x 1 x 1 cm.
Dynamic Elastic Modulus (Ultrasound)
The analysis of the longitudinal dynamic modulus of elasticity by means of the longitudinal resonance frequency was determined on prismatic specimens with dimensions of 1 x 1 x 4 cm. As Young’s modulus is determined on the same specimens before and after treatment, an average of three specimens is sufficient to assess whether any improvement after consolidation is achieved. The device developed by Geotron-Elektronik (Pirna, Germany) consisted of an ultrasonic pulse generator (CONOSONIC C2-GS), a pair of transducers (UP-DW) and a notebook running the Light House Touch software. The Young’s modulus [GPa] is obtained by Eq. 4:
where the calculated dynamic modulus of elasticity EdL is obtained through the longitudinal fundamental resonance frequency FL, the specimen’s length l, and the apparent density of the lithotype .
Drilling Resistance Measurements
The resistance to a penetration force (reported in Newton) was assessed with the DRMS Cordless device from Sint Technology (Calenzano, Florence, Italy). A 3 mm in diameter polycrystalline diamond bit drill was used to penetrate the sample up to 15 mm and analyse the state before and after treatment application. The speed of rotation was set at 600 rpm and the penetration speed at 10 mm/min.
Water Related Tests (Water Vapour Permeability, Water Absorption Coefficient, Drying Behaviour and Contact Angle)
According to the standard EN 15803, the water vapour permeability was assessed with the wet-cup-system (cup type 1), filled with water. Three specimens were tested before and after the treatment. The cups, mounted with the specimens, were filled with water and placed in a climatic chamber (Heraeus Vötsch mod. VC3 4034, by Vötsch Industrietechnik GmbH Balingen, Germany) set at 23 °C and 50 % RH to equilibrate. Every 24 hours the weight was recorded for at least one week. The results were plotted as the mass change versus time, to obtain the slope of the linear section of the curve G [kg·s–1]. The water vapour permeance Wp [kg·m–2·s–1·Pa–1] was calculated according to Eq. 5:
where A is the test surface area in m2 and Δpv [Pa] stands for the water vapour pressure difference across the specimen. Subsequently, Wp was used to obtain the water vapour permeability [kg·m–1·s–1·Pa–1] according to Eq. 6:
where D [m] is the mean specimen thickness.
The determination of the water absorption coefficient after one hour is reported in kg·m–2·h–0.5 and defined therefore as the amount of water in kg absorbed per square meter as a function of the square root of one hour. The test was carried out on three specimens with a dimension of 3 x 3 x 3 cm.
The determination of the drying behaviour allowed calculating the water loss of a saturated sample over time, i.e., one week for the present case. Prior to the test, samples were placed in a desiccator with silica gel to maintain constant humidity conditions at 23±1 °C. The lateral sides of the samples were not sealed. Thus, the drying occurred from the entire surface. Three specimens with a dimension of 3 x 3 x 3 cm were used to obtain the drying rate determined according to Eq. 7:
The residual amount of water present in the specimen (mi – mf) per unit area (A, calculated from the entire surface) is expressed in kg·m–2 for a given time (ti, in hours). According to this curve the first and second drying phases can be plotted. Finally, the drying index IA is calculated from Eq. 8:
where Mi corresponds to water loss at ti, Mmax is the water at t0, and tf is the time taken as the end of the test (24h). To evaluate the integral of the area below the curves the software OriginPro2019 was used.
The water contact angle was determined with the Mobile Surface Analyzer from Krüss (Hamburg, Germany). An average of three sampling points was obtained on the surface of the marble specimens for the respective conditions.
Visual Inspection
The colour measurements have been performed on Apuan marble before and after treatment with a ColorLite sph850 spectrophotometer. A D65 illuminant at 10° standard observer with a reflectance spectrum in the range of 400 to 700 nm was used. Three tests obtained at the same spot are reported as average values according to the International Commission on Illumination CIE L*, a*, b* colour parameters. The total colour difference (ΔE*) between artificially aged (a) and treated (t) samples is obtained from Eq. 9:
where ΔL* is the lightness difference, Δa* the red/green difference and Δb* the yellow/blue difference.
3. Results and Discussion
3.1. Nano-ZrO2 Dispersion Properties
The characterization of the colloidal phase is important as it may support interpretations of sorption kinetics. Nanoparticle characterization confirmed that the properties of the commercial consolidant product persisted in the diluted formulations used in this study. Nanoparticle sizes, characterized by DLS, ranged between 70 nm and 130 nm (with a polydispersity from 0.1 to 0.2) for the original and diluted dispersions, respectively. The pH of the original consolidant was 9.8 and that of the diluted solutions decreased with increasing dilution from 9.4 (d100), to 6.7 (d1000) and to values equivalent to pure water, that is ~5 (d10000, from atmospheric CO2). Despite this dramatic decrease in pH for d10000 samples, all pH values during the adsorption experiments were buffered at pH ~8 via calcite dissolution from the marble beads. This means that only the control samples of consolidant for d10000 (i.e., only consolidant, no marble beads) may show different stability compared to the less diluted controls. In fact, the measured ζ-potentials of diluted consolidant solutions showed averages of -70.5 ± 2.6 mV (d100), -89.6 ± 2.5 mV (d1000) and -33.6 ± 1.5 mV (d10000). Note that the ζ-potential of the original consolidant concentration was not quantified because the solution was not transparent enough for the measurement.
3.2. Electrokinetic Potential and Solubility of Apuan Marble in Selected Conditions
The value of ζ-potential for stones in different conditions and exposed to different electrolytes depends on both the stone and the testing solution. The multifactorial dependence of the ζ-potential (e.g., instrument type, stone porosity, use of aggregates vs. solid samples, surface conductivity, presence of soluble salts, etc., to name a few) can make the interpretation of the results quite complex. Moreover, the behaviour of a stone in equilibrium with an electrolyte solution will differ from the same under non-equilibrium condition. Likewise, stone resistance towards different acidic and basic conditions, the buffering capacity of carbonate as well as the presence of potential determining ions (PDI) will yield different results. The ζ values obtained within the present study are better interpreted as relative (trends) and not via absolute values, especially since the entire analyzed system is in non-equilibrium. While a direct comparison of ζ obtained by means of electrophoretic mobility (for the colloidal suspension) and streaming current (for solid surfaces) measurements cannot be made, trends can indicate possible processes and explanations.
The testing conditions adopted in this study were defined based on their expected relevance for on-site situations to which the construction material is located and exposed to environmental conditions. As stone surfaces are cyclically exposed to rainwater, ζ alterations of the Apuan marble surface in simulated rainwater were studied (Figure 1a). The results reveal a time-dependent ζ change, starting from -10 mV at the beginning of the experiment and increasing in magnitude to -20 mV after ~14h of exposure. After approx. 6h of exposure, only minor further change of ζ and of the corresponding pH cooccurred, indicating a more stable condition. It should be noted that in order to reach equilibrium, the testing conditions (e.g., exposed surface area, amount of testing solution, open CO2 system) need to be considered.
When the Ca2+ ions are added to the rainwater solution, Ca2+ ions are PDI for the calcite surface, ζ decreases in absolute value (i.e., it becomes less negative) and shifts towards -10 mV after the addition of 10 mM CaCl2 to the background solution. By comparing the first single-point measurements of ζ in simulated rainwater (-10 mV) with ζ in a 1 mM KCl solution (-20 mV), it is evident how much different aqueous solutions may affect the measured value of ζ (compare Figure 1a with inset of Figure 1b). The addition of PDI is insofar relevant as a naturally aged substrate might have more surface area exposed to rainwater due to partially lost cohesion of the substrate, corresponding of partial loss of adhesive contact between grains (e.g., formation of microcracks), which directly influences the surface reactivity and the release of these ions from the mineral surface. Moreover, building construction sites are known to be contaminated by different salts in different concentrations, which makes the use of different electrolytes in varying concentrations relevant to real case exposure under environmental conditions.
After the addition of 10 mM CaCl2 to the rainwater background electrolyte, a titration with HCl was done to obtain the pH and salinity dependent isoelectric point (IEPpH), see Figure 1c. The IEPpH is the pH at which the ζ-potential is zero, that is, where an equal amount of positive and negative charges is present in the vicinity of the surface. The magnitude of ζ indicates the degree of electrostatic repulsion for similarly charged surfaces. The closer the measured system to the IEPpH the more likely it is that two adjacent surfaces will attract each other. The titration of the system is important because the pH of water-based ENPs used in building heritage may span from highly alkaline (e.g. calcium hydroxide) to acidic (as in several sol-gel based inorganic colloidal materials).
3.3. Sorption Kinetics of Nano-ZrO2 onto Calcite Control Conditions
Consolidant controls during adsorption experiments over time showed reproducibility among the tested Zr concentrations and dilution factors. This means that (i) for a given dilution factor, dissolved concentrations of Zr were constant over time (i.e., there was no loss of n-ZrO2 due to precipitation), and (ii), Zr concentration increased proportionally between dilution factors (e.g., Zr at d1000 is 10 times smaller than that of d100), as expected. The remaining diluted consolidant in the control samples was emptied and the samples were reused during desorption studies to monitor n-ZrO2 sorption onto the tube walls and potential redissolution onto the rainwater in 24h. For the three tested dilutions results show dissolved Zr concentrations of two to three orders of magnitude below the Zr concentrations obtained from desorption samples with calcite.
Corresponding controls of calcite beads in 1 mM KCl during adsorption experiments and in simulated rainwater during desorption experiments showed an overall dissolution in 24h sorption experiments between 42 - 137 %. However, there was no clear/specific dissolution pattern/trend related to the tested batch conditions: solid/liquid ratio (100 vs 200 g/L) and bead size (1 mm vs 0.25 mm). Noteworthy, based on the initial ionic strength of the calcite control samples at 1 mM KCl and those resulting from the dilution of the original consolidant dispersion (see section 2.3), these controls are representative only of the calcite beads present in condition n-ZrO2 d100. This is the experimental condition closest to in-situ/real applications, where (given our results) calcite dissolution in absence of consolidant is expected. This also implies that experimental conditions with n-ZrO2 d1000 and d10000 could/should potentially show higher dissolution of calcite compared to the control. For this reason, in the following discussion, results of dissolved Ca pertaining to each experimental condition are reported in relative percentages, that is, comparing the concentrations obtained at time 0 and that at the end of the experiment (24h) for each experimental condition, and not relative to the concentrations obtained in the control samples.
3.4. Sorption Affinity of Nano-ZrO2 and Effect on the Dissolution of Calcite
Overall, sorption studies showed consistent adsorption of n-ZrO2 and little desorption in rainwater conditions. Illustrative results for the case of d10000 are shown in Figure 2. Given the wide range of experimental conditions tried in this work, we can report with confidence that adsorption studies revealed a good chemical affinity between n-ZrO2 and calcite, adsorbing 50 – 75 % of the added n-ZrO2 in d10000 (Figure 2a), 80 – 90 % in d1000 and 14 – 90 % in d100. Specifically, we obtained 14% sorption for the 1 mm beads at 100 g/L solid/liquid ratio and 90% at the 0.25 mm beads and 200 g/L solid/liquid ratio. This was expected because smaller bead sizes imply larger surface area, and higher concentration of beads provide more surface for the n-ZrO2 to adsorb. However, for the other cases, the trend was consistent for the bead sizes but not for the solid/liquid ratio. As an example, for d10000, we obtain around 50% adsorption with 1 mm beads and around 75% adsorption with 0.25 mm beads for both solid/liquid ratios. This can be related to incomplete digestions of n-ZrO2 (unknown due to lack of certified reference materials) or experimental variability during sampling.
Overall desorption of n-ZrO2 in rainwater conditions was maximum 6% for calcite exposed to d10000 (Figure 2b), 12% for calcite exposed to d1000, and 5% for calcite exposed to d100 n-ZrO2. In all cases the release of n-ZrO2 doubled proportionally for the bead’s concentration. As an example, for d1000, the conditions with 5g of marble aggregates released 6% whereas the one with 10g released 12%. The % desorbed corresponds to the concentration of Zr in the solution during desorption, divided by the amount of Zr lost from the solution to the surface during adsorption.
Regarding calcite solubility, for comparative purposes, Figure 3 shows the concentrations of dissolved Ca grouped for the cases of 0.25 mm beads (Figure 3a) and 1 mm beads (Figure 3b) over time for both adsorption (from minute 0 until minute 240) and desorption experiments (after minute 240). As a reference guideline, the corresponding dissolved Ca concentration of the controls of calcite (only truly comparable to d100 conditions), are also represented in both graphs. For better comparability, the timeline of adsorption/desorption experiments is represented one after the other, meaning that the plotted times respect the timeframes of the experiments but not a real temporal succession (i.e., desorption experiments did not start at 260 min after the beginning of adsorption experiments). These results suggest that, as expected, calcium dissolution from 0.25mm beads was always higher than from 1 mm beads, for both controls and experimental conditions. The solid/liquid ratio also influences consistently the outcome, with higher dissolution of calcite for 200 g/L compared to 100 g/L. These results suggest that, despite the seemingly high uptake of n-ZrO2 onto calcite (e.g., Figure 2), the resulting effective calcite solubility is contrasting. During adsorption conditions, calcite solubility was generally reduced compared to the controls, with a consistent trend regarding n-ZrO2 dilutions. However, the reduced solubility of calcite during desorption experiments seems to be an effect of the oven-drying performed between sorption experiments, as the control samples also showed less dissolved Ca compared to adsorption experiments. Nevertheless, there is an effective reduction in calcite dissolution with decreased dilution factor, especially for 0.25 mm bead sizes. This means that applied n-ZrO2 in high concentrations not only remains within the calcite surface during exposure to simulated rainwater but also reduces significantly (e.g., up to 100-fold lower solubility) calcite dissolution. This effectiveness is higher with smaller calcite grain sizes. These results suggest that n-ZrO2 may adsorb efficiently to calcite and protect the surface from dissolution.
These sorption studies can be viewed as a first approach towards an overview of what happens with n-ZrO2 and calcite. It acts as a basis for developing future sorption/desorption studies regarding n-ZrO2 and calcite interactions. Future studies can continue investigating different bead sizes and amounts as well as NP concentrations, with different colloidal dispersions and mineral substrates. Solid samples instead of calcite beads could be used as a more realistic approach, representative of facade conditions (e.g., no batch experiments). Additionally, longer desorption experiments (e.g., weeks, months) should be pursued in order to verify the sustainable effect of our observations on low n-ZrO2 desorption. All in all, these approaches would help to establish better guidelines or protocols for future studies regarding general leaching of NPs used as consolidants and protectives from building surfaces.
3.5. Efficiency and Compatibility of Nano-ZrO2 for Purposes of Surface Consolidation
Scanning Electron Microscopy
SEM studies on polished cross sections indicate good bonding between calcite and zirconia (see Figure 4a). In fact, cohesive cracks were much more frequently observed within the consolidant layer than as adhesive detachment at the substrate-zirconia interface. Besides, the generated micro cracks were filled with n-ZrO2 without pore clogging effects (i.e., complete filling of the cracks) as shown in Figure 4b. The surface micrographs taken from broken chips show the presence of some efflorescence over the texture of the cured consolidant (see Figure 4c); however, that feature may be related to microcrystals of a stabilizing agent that was added to the colloidal dispersion during the manufacturing processes (see EDX analysis in Figure S1). Recent studies have reported on sols in alcohol and water dispersions to contain sodium chloride as a by-product of the preparation [45]. In general, such by-products might compromise the durability of the treatment and the substrate. The topography of the cured and hardened zirconia displays a crackled surface, whereby it follows the roughness of the substrate (see Figure 4d). Drying stresses are known to cause cracking of inorganic consolidants [46]. The crackled consolidant on top of the marble surface displays a higher roughness and a higher surface area than the pristine marble surface, which probably contributes to desorption and enhanced leaching. Such undesirable effect might also have positive aspects, as in the case of photocatalytic TiO2 nanoparticles with self-cleaning and depolluting properties [45]. The authors describe that a higher surface roughness and porosity makes n-TiO2 more easily available, therefore the target pollutant NOx was degraded to a greater extent.
The bridging capacities of the n-ZrO2 product cannot be evaluated properly as the cracks generated by heat-treatment are very small and exhibit sheet-like intergranular openings. Equally challenging is the evaluation of the depth distribution of the NPs due to the typically very small pore size of this marble substrate, which prevents effective penetration of the aqueous n-ZrO2 and results in rapid formation of a cured NPs surface layer of including only a thin sub-surface region. Thus, this product, depending on the pore structure of the substrate, should be considered as a surface strengthener (e.g., for the fine sheet-like openings of marble) rather than a bulk consolidant, as the latter should be capable of penetrating deeply and of increasing the bulk mechanical strength of the stone material.
Mercury Intrusion Porosimetry
The measurement of pore size distribution (PSD) by mercury intrusion porosimetry allows to assess the changes in the pore network caused by ageing or by a treatment. The graphs in Figure 5a and 5b highlight the significant difference in the PSD, with a marked shift of the smaller sub-micrometer pores towards 1+ micrometer sized pores, along with an increase in total Hg-porosity (from 0.7 % to 3.6 %) upon artificial ageing of the Apuan marble [47]. The treatment with n-ZrO2 causes only moderate changes, as the comparison of Figure 5b and 5c clearly shows. The treatment appears to mostly affect the pores in the range below 0.1 µm, where deposition of the consolidant is more effective in occluding the pore and thus decrease the total open porosity from 3.6 % to 2.9 %. The results indicate that there is no severe change in the pore structure as a result of the application of n-ZrO2, which can be viewed as a surface strengthening and protection agent even if chemically heterogeneous with respect to the calcite, as a result of its effective adsorption on such substrate.
Mechanical Tests
Apuan marble is considered a very robust building stone in its freshly quarried state. The reason for this lies in its metamorphic nature, which involves calcite recrystallization under high pressure resulting in the formation of strongly interlocking crystals. Therefore, it has almost no water absorption capabilities and a high mechanical strength, as shown by, e.g., the longitudinal dynamic modulus of elasticity obtained from ultrasound probe longitudinal resonance frequency measurements (see Figure 6a, pristine condition). Only after natural or artificial ageing, porosity in form of sheet-like openings is generated in the microstructure (see Figure 6a, aged condition). Restoring the mechanical strength to the marble in such deteriorated state is very demanding because of the micro-filtering action of the small sized cracks, inhibiting in-depth penetration of the consolidant and causing its accumulation on the surface and sub-surface regions. The modest increase of dynamic modulus of elasticity upon application of the consolidant onto the aged marble, as determined with a bulk measurement, is clearly shown in Figure 6a. The results indicate two important findings: (i) a bulk strengthening of a marble structure cannot be achieved with this consolidant and, (ii) macroscopic mechanical tests like bending- and splitting tensile strength are less reliable as the penetration of the entire test specimen with this consolidant cannot be assured.
Since n-ZrO2 applied on the aged marble should be mainly considered a surface treatment, micro mechanical tests like the drilling resistance can provide quantitative data about the treatment performance in terms of mechanical gain. Drilling resistance measurements record the force that is required to drill a hole into a material. This can be correlated with mechanical properties of the material such as the compressive strength [48]. The drilling resistance of the non-treated artificially aged stone displays a steadily increasing resistance with depth. The reason for such a profile is most probably due to the marble powder resulting from drilling that has been carried along the drilling depth, which increases the resistance progressively. Such a phenomenon has been described previously in other studies concerning drilling resistance of natural stones [49]. After the treatment with n-ZrO2, an increase in resistance can be recorded and it amounts to approx. 13±5% (calculated for the force recorded between 3- and 10-mm depth). The increase in resistance of ~13% on average can be considered appropriate as the n-ZrO2 is not a structural strengthener but focused on the surface and sub-surface region. It should be noted that the amount of the nanomaterials applied, or the size of nanoparticles used, among other properties, have a substantial effect on the strengthening capacity when used as consolidants [50].
Water Related Tests and Colour Measurements
The colour measurement is described through dE*, the metric difference or distance between two colours according to the rules of the International Commission on Illumination (CIE). In this study, it is used to quantify the colour change between untreated and treated artificially aged samples; acceptable treatments are considered those resulting in dE* < 5 [51]. The axis in the diagram for dE* is set to the highest value obtained, which is 7.25 for the treatment with n-ZrO2 (see Figure 7). Among the different measured parameters, the one showing the largest variation of dL* are those for which some whitening of the surface could be observed. However, the change in colour might be tackled with appropriate aftercare (e.g., dabbing of excess consolidant from the surface, foil coverage to prevent quick evaporation and back migration to the surface, cleaning of cured consolidant, etc.), which was not considered in the present research.
Although the colour alterations were above the commonly considered acceptable threshold for built heritage, the moisture related properties of the marble treated with n-ZrO2 were satisfactory. For clarification on how to read the radar diagram in Figure 7 for the water related properties, on the example of Pt/Pnt, which stands for the ratio of water vapour permeability between treated (t) and not treated (nt) conditions: a value of 1 means unchanged permeability before and after the treatment, which is a favourable condition. A ratio below 1 indicates reduced water vapour permeability after the treatment. A value of 0.8 corresponds to a reduction by 20% in water vapour permeability. The latter is the maximum desired threshold (see Table 1 for success criterion on treatment performance). A value of 0.5 indicates a reduction by 50%, and a value of 0.3 stands for a reduction by 70%, etc. Values greater than 1 have better water vapour properties after the treatment. A value greater than 1 needs further clarifications as it is rather counterintuitive. However, some studies have reported on better water vapour properties after the treatment (e.g.,[52]). IDt/IDnt represents the ratio of the drying index after a period of 24h. With an average value of 0.9 it can be classified as compatible as no drastic reduction was recorded. However, it should be noted that the obtained ratios are rather widespread, which might be the result of either stone textural features and/or the treatment. On the contrary, the values of ACt/ACnt, which represent the ratio of the water absorption coefficient by capillarity after 60 min, exhibit narrow distributions. With an average value of 0.94 it can be classified as very good in terms of compatibility. The value for Pt/Pnt of 0.7, is reducing the water vapour permeability to an extent below the desired threshold of 20 % [53] (p. 540). C.A. is the contact angle after the treatment, which amounts to 41°, a value that is more hydrophilic than before the treatment (see Table 2). The higher hydrophilicity after the treatment might influence the leaching properties of the ENPs but more studies are necessary to confirm such a conclusion. In both cases, the C.A. before and after the treatment, describes a partially wetting surface condition and this result indicates no negative effects in terms of compatibility or delayed harmfulness.
5. Conclusions
The present study analyzed the use of a water-based n-ZrO2 dispersion for the purpose of strengthening and protecting calcite surfaces. Chemical compatibility was studied by means of batch adsorption and desorption experiments while mechanical and physical tests served to describe the treatment effectiveness.
Sorption studies showed a consistent adsorption of n-ZrO2 and little desorption in rainwater conditions for the studied timeframe without a systematic trend related to the experimental conditions. There is an impact of the bead sizes but not for the solid/liquid ratio for all dilutions of the consolidant. The adsorption studies revealed good chemical affinity between n-ZrO2 and calcite, adsorbing 50 – 75 % of the added n-ZrO2 in d10000 (i.e., 11 wt.% n-ZrO2 colloidal dispersion diluted 10000 times), 80 – 90 % in d1000 and 14 – 90 % in d100. Likewise, the overall desorption of n-ZrO2 in rainwater conditions was <6% for calcite exposed to d10000, <12% for calcite exposed to d1000, and <5% for calcite exposed to d100 n-ZrO2. The applied n-ZrO2 not only remains within the calcite surface during exposure to simulated rainwater but it also reduces significantly (e.g., up to 100-fold lower solubility) calcite dissolution.
Concerning the compatibility assessment, water vapor permeability, water absorption coefficient and the drying behavior imply the absence of a potential harmful effect of the treatment as no severe reduction of these properties was observed after treatment application, suggesting good compatibility and relatively uniform distribution of thin layer of adsorbed n-ZrO2 that does not significantly reduce the volume of the pores. The mechanical strength was slightly increased, as determined by measurement of the dynamic elastic modulus and the drilling resistance. On the other hand, penetration of n-ZrO2 deep into the specimen body cannot be achieved for Apuan marble due to its narrow pore size structure. The resulting adsorption limited to a thin surface layer was confirmed by the results of SEM analysis, showing evidences of deposited n-ZrO2 limited to the surface and a thin sub-surface layer. Nevertheless, the obtained results highlight the effectiveness of n-ZrO2 as a surface consolidant and protective coating for calcite, providing additional protection by increasing surface resistance towards dissolution.
Supplementary Materials
The following supporting information can be downloaded at the website of this paper posted on Preprints.org, Figure S1: EXD of the efflorescence.
Author Contributions
Conceptualization, M.U. and T.GD.; methodology, M.U. and T.GD.; formal analysis, M.U. and T.GD.; investigation, M.U. and T.GD.; resources, J.L. and V.C.; data curation, M.U. and T. GD.; writing—original draft preparation, M.U. and T. GD.; writing—review and editing, J.L. and V.C.; visualization, M.U.; supervision, J.L. and V.C. All authors have read and agreed to the published version of the manuscript.
Funding
This research received no external funding.
Data Availability Statement
The datasets used and/or analyzed during the current study are available from the corresponding author on reasonable request. The data are not publicly available as they form part of an ongoing study. Additional electronic supplementary material is accompanied by this paper.
Acknowledgments
We gratefully acknowledge the Institute for Nuclear Waste Disposal from Karlsruhe Institute of Technology for hosting this research project and the unrestricted access to various analysis. The authors further thank the Opera della Primaziale Pisana team from Pisa, Italy for the supply of the freshly quarried Apuan marble and Technologia Navarra de Nanoproductos, S.L. - Tecnan (Spain) for the supplied consolidant ZR110 (also known under the abbreviation NC-29C). Alberto Viani from the Institute of Theoretical and Applied Mechanics of the Czech Academy of Sciences is gratefully acknowledged for hosting the SEM analyses. We thank Thomas Kasel for the BET analysis and Frank Geyer for the help with ICP-MS.
Conflicts of Interest
The authors declare no conflict of interest and no competing financial interest. The funders had no role in the design of the study; in the collection, analyses, or interpretation of data; in the writing of the manuscript; or in the decision to publish the results.
References
- Vergès-Belmin, Véronique. Illustrated glossary on stone deterioration patterns. Icomos, 2008.
- Wheeler, G. Alkoxysilanes and the Consolidation of Stone. Research in conservation/The Getty Conservation Institute, 1, 2005.
- Miliani, C., Velo-Simpson, M. L., & Scherer, G. W. Particle-modified consolidants: A study on the effect of particles on sol-gel properties and consolidation effectiveness. J. Cult. Herit., 2007, 8(1), 1-6. [CrossRef]
- da Fonseca, B. S., Pinto, A. P. F., Piçarra, S., & Montemor, M. F. Alkoxysilane-based sols for consolidation of carbonate stones: Proposal of methodology to support the design and development of new consolidants. J. Cult. Herit., 2020, 43, 51-63. [CrossRef]
- Gherardi F, Goidanich S, Dal Santo V, Toniolo L. Layered Nano-TiO2 Based Treatments for the Maintenance of Natural Stones in Historical Architecture. Angew. Chem. Int. Ed., 2018, 57 (25):7360-7363. [CrossRef]
- Li, L., & Yang, Q. (Eds.). Advanced coating materials. John Wiley & Sons, 2018.
- Becerra, J., Zaderenko, A. P., Gómez-Morón, M. A., & Ortiz, P. Nanoparticles Applied to Stone Buildings. Int. J. Archit. Herit., 2021, 15(9), 1320-1335. [CrossRef]
- Hincapié, I., Caballero-Guzman, A., Hiltbrunner, D., & Nowack, B. Use of engineered nanomaterials in the construction industry with specific emphasis on paints and their flows in construction and demolition waste in Switzerland. Waste Manag., 2015 43, 398-406. [CrossRef]
- Reyes-Estebanez, M., Ortega-Morales, B. O., Chan-Bacab, M., Granados-Echegoyen, C., Camacho-Chab, J. C., Pereañez-Sacarias, J. E., & Gaylarde, C. Antimicrobial engineered nanoparticles in the built cultural heritage context and their ecotoxicological impact on animals and plants: a brief review. Herit. Sci., 2018, 6, 1-11. [CrossRef]
- Lazzeri, A., Bianchi, S., Castelvetro, V., Chiantore, O., Coltelli, M. B., Gherardi, F., ... & Toniolo, L. New polymer architectures for architectural stone preservation. In: Science and Art: A Future for Stone-Proceedings of the 13th International Congress on the Deterioration and Conservation of Stone (Vol. 2, pp. 855-862). University of the West of Scotland, 2016.
- Ziegenbalg, G., Drdácký, M., Dietze, C., & Schuch, D. (Eds.). Nanomaterials in architecture and art conservation, 2018. CRC Press.
- Ševčík, R., Viani, A., Machová, D., Lanzafame, G., Mancini, L., & Appavou, M. S. Synthetic calcium carbonate improves the effectiveness of treatments with nanolime to contrast decay in highly porous limestone. Sci. Rep., 2019, 9(1), 15278. [CrossRef]
- Sierra-Fernández, A., Gómez Villalba, L. S., Rabanal, M. E., & Fort González, R. (2017) New nanomaterials for applications in conservation and restoration of stony materials: A review. Materiales De Construccion, 2017, 67 (325). [CrossRef]
- Scherer, G.W., Wheeler, G.S. Silicate consolidants for stone. Key Engineering Materials, 2009, 391, 1-25. [CrossRef]
- Cross, R. K., Tyler, C., & Galloway, T. S. Transformations that affect fate, form and bioavailability of inorganic nanoparticles in aquatic sediments. Environ. Chem., 2015, 12(6), 627-642. [CrossRef]
- Arslan Selçuk, S., & Ayçam, İ. Nanotechnology in Built Environment: Pros and Cons of Nanomaterial Usage in Architecture. In: Proceedings of 3rd International Sustainable Buildings Symposium (ISBS 2017), 2018, Volume 1 3 (pp. 269-281). Springer International Publishing.
- Ilvonen, O. Assessing release of hazardous substances from construction products - Review of 10 years of experience with a horizontal approach in the European Union. Build. Environ., 2013, 69, 194-205. [CrossRef]
- Shandilya, N., Le Bihan, O., Bressot, C., & Morgeneyer, M. Emission of titanium dioxide nanoparticles from building materials to the environment by wear and weather. Environ. Sci. Technol., 2015, 49 (4):2163-2170. [CrossRef]
- Fiorentino, B., Golanski, L., Guiot, A., Damlencourt, J. F., & Boutry, D. Influence of paints formulations on nanoparticles release during their life cycle. J. Nanoparticle Res., 2015, 17, 1-13. [CrossRef]
- Kaegi, R., Sinnet, B., Zuleeg, S., Hagendorfer, H., Mueller, E., Vonbank, R., ... & Burkhardt, M. Release of silver nanoparticles from outdoor facades. Environ. Pollut., 2010, 158(9), 2900-2905. [CrossRef]
- Blocken, B., & Carmeliet, J. A simplified numerical model for rainwater runoff on building facades: Possibilities and limitations. Build. Environ., 2012, 53, 59-73. [CrossRef]
- Domercq, P., Praetorius, A., & Boxall, A. B. Emission and fate modelling framework for engineered nanoparticles in urban aquatic systems at high spatial and temporal resolution. Environ. Sci. Nano., 2018, 5(2), 533-543. [CrossRef]
- Kurwadkar, S., Pugh, K., Gupta, A., & Ingole, S. Nanoparticles in the environment: Occurrence, distribution, and risks. J. Hazard. Toxic Radioact. Waste, 2015, 19(3), 04014039. [CrossRef]
- Bottero, J. Y., Auffan, M., Borschnek, D., Chaurand, P., Labille, J., Levard, C., ... & Wiesner, M. R. Nanotechnology, global development in the frame of environmental risk forecasting. A necessity of interdisciplinary researches. Comptes Rendus. Géoscience, 2015, 347(1), 35-42. [CrossRef]
- Hennebert, P., Avellan, A., Yan, J., & Aguerre-Chariol, O. Experimental evidence of colloids and nanoparticles presence from 25 waste leachates. Waste Manag., 2013, 33 (9):1870-1881. [CrossRef]
- Keller, Arturo A., Suzanne McFerran, Anastasiya Lazareva, and Sangwon Suh. Global life cycle releases of engineered nanomater als. J. Nanoparticle Res., 2013, 15, 1-17.
- Geissen, V., Mol, H., Klumpp, E., Umlauf, G., Nadal, M., van der Ploeg, M., ... & Ritsema, C. J. Emerging pollutants in the environment: a challenge for water resource management. Int. Soil Water Conserv. Res., 2015, 3(1), 57-65. [CrossRef]
- Azimzada, A., Farner, J. M., Hadioui, M., Liu-Kang, C., Jreije, I., Tufenkji, N., & Wilkinson, K. J. Release of TiO2 nanoparticles from painted surfaces in cold climates: characterization using a high sensitivity single-particle ICP-MS. Environ. Sci. Nano, 2020, 7(1), 139-148. [CrossRef]
- Danelska, A., Ulkowska, U., Socha, R. P., & Szafran, M. Surface properties of nanozirconia and their effect on its rheological behaviour and sinterability. J. Eur. Ceram. Soc., 2013, 33(10), 1875-1883. [CrossRef]
- Xie, Z., Ma, J., Xu, Q., Huang, Y., & Cheng, Y. B. Effects of dispersants and soluble counter-ions on aqueous dispersibility of nano-sized zirconia powder. Ceram. Int., 2004, 30(2), 219-224. doi.org/10.1016/S0272-8842(03)00092-0.
- Hennebert, P., Anderson, A., & Merdy, P. Mineral nanoparticles in waste: potential sources, occurrence in some engineered nanomaterials leachates, municipal sewage sludges and municipal landfill sludges. J. Biotechnol. Biomater., 2017, 7(02). [CrossRef]
- Karunakaran, G., Suriyaprabha, R., Manivasakan, P., Yuvakkumar, R., Rajendran, V., & Kannan, N. Impact of nano and bulk ZrO2, TiO2 particles on soil nutrient contents and PGPR. J. Nanosci. Nanotechnol., 2013, 13 (1):678-685. [CrossRef]
- Jangra, S. L., Stalin, K., Dilbaghi, N., Kumar, S., Tawale, J., Singh, S. P., & Pasricha, R. Antimicrobial activity of zirconia (ZrO2) nanoparticles and zirconium complexes. J. Nanosci. Nanotechnol., 2012, 12 (9):7105-7112. [CrossRef]
- Herz, N. & Dean, N.E. Stable isotopes and archaeological geology: the Carrara marble, northern Italy. Appl. Geochem., 1986, 1 (1):139-151. [CrossRef]
- Cantisani, E., Pecchioni, E., Fratini, F., Garzonio, C. A., Malesani, P., & Molli, G. Thermal stress in the Apuan marbles: relationship between microstructure and petrophysical characteristics. Int. J. Rock Mech. Min., 2009, 46 (1), 128-137. [CrossRef]
- Franzoni, E., Sassoni, E., Scherer, G. W., & Naidu, S. Artificial weathering of stone by heating. J. Cult. Herit., 2013, 14(3), e85-e93. [CrossRef]
- Ban, M., Baragona, A., Ghaffari, E., Weber, J., & Rohatsch, A. Artificial aging techniques on various lithotypes for testing of stone consolidants. In: Science and Art: A Future for Stone-Proceedings of the 13th International Congress on the Deterioration and Conservation of Stone (Vol. 1, pp. 253-260). University of the West of Scotland, 2016.
- Carrol, D. Rainwater as a chemical agent of geologic processes -a review, US Geol. Survey water supply paper, 1962.
- CEN (2004) Standard EN 14146, Determination of dynamic elastic modulus by measuring the fundamental resonant frequency.
- CEN (2010) Standard EN 15803, Conservation of cultural property-test methods-Determination of water vapour permeability.
- CEN (2010) Standard EN 15801, Conservation of cultural property. Determination of water absorption by capillarity.
- CEN (2013) Standard EN 16322, Conservation of cultural heritage. Determination of drying properties.
- CEN (2010) Standard EN 15802 Conservation of cultural property. Determination of static contact angle. UNI, Ente Nazionale Italiano di Unificazione.,.
- CEN (2010) Standard EN 15886, Conservation of cultural property. Colour measurement of surfaces.
- Calia, A., Lettieri, M., Masieri, M., Pal, S., Licciulli, A., & Arima, V. Limestones coated with photocatalytic TiO2 to enhance building surface with self-cleaning and depolluting abilities. J. Clean. Prod., 2017, 165, 1036-1047. [CrossRef]
- Mosquera, M. J., Pozo, J., & Esquivias, L. Stress during drying of two stone consolidants applied in monumental conservation. J. Sol-Gel Sci. Technol., 2003, 26, 1227-1231. [CrossRef]
- Ban, M., Luxbacher, T., Lützenkirchen, J., Viani, A., Bianchi, S., Hradil, K., ... & Castelvetro, V. Evolution of calcite surfaces upon thermal decomposition, characterized by electrokinetics, in-situ XRD, and SEM. Colloids Surf. A: Physicochem. Eng., 2021, 624, 126761. [CrossRef]
- Pamplona, M., Kocher, M., Snethlage, R., & Aires Barros, L. Drilling resistance: overview and outlook. Zeitschrift-Deutschen Gesellschaft fur Geowissenschaften, 2007, 158(3), 665. [CrossRef]
- da Fonseca, B. S., Pinto, A. F., Rodrigues, A., Picarra, S., Fonseca, D., & Montemor, M. F. On the estimation of marbles weathering by thermal action using drilling resistance. J. Build. Eng., 2021, 42, 102494. [CrossRef]
- Dziadkowiec, J., Cheng, H. W., Ludwig, M., Ban, M., Tausendpfund, T. P., von Klitzing, R., ... & Valtiner, M. Cohesion gain induced by nanosilica consolidants for monumental stone restoration. Langmuir, 2022, 38(22), 6949-6958. [CrossRef]
- Sassoni, E., Graziani, G., & Franzoni, E. An innovative phosphate-based consolidant for limestone. Part 1: Effectiveness and compatibility in comparison with ethyl silicate. Constr. Build. Mater., 2016, 102, 918-930. [CrossRef]
- Gherardi, F.; Roveri, M.; Goidanich, S.; Toniolo, L. Photocatalytic nanocomposites for the protection of European architectural heritage. Materials, 2018, 11, 65. [CrossRef]
- Snethlage, R. Stone Conservation. In: Stone in Architecture; Siegesmund, S., Snethlage, R., Eds.; Springer: Berlin, Heidelberg, Germnay, 2014; pp. 517–520.
Figure 1.
Electrokinetic potential alterations of Apuan marble in different conditions relevant for the present study. (a) Long term ζ evolution for Apuan marble in simulated rainwater, with the corresponding change of pH. (b) Same conditions as before, but with a stepwise addition of CaCl2 until 10 mM in reached. For comparison, the inset shows the ζ of an Apuan marble in a 1 mM KCl solution. (c) HCl-titration from pH 7.5 to 4.5 in 10 mM CaCl2-doped simulated rainwater solution until the pH and salinity dependent isoelectric point was reached (ζ≈ zero). Note that the green and blue marked rectangles display the end of one testing condition and the beginning of the subsequent testing conditions.
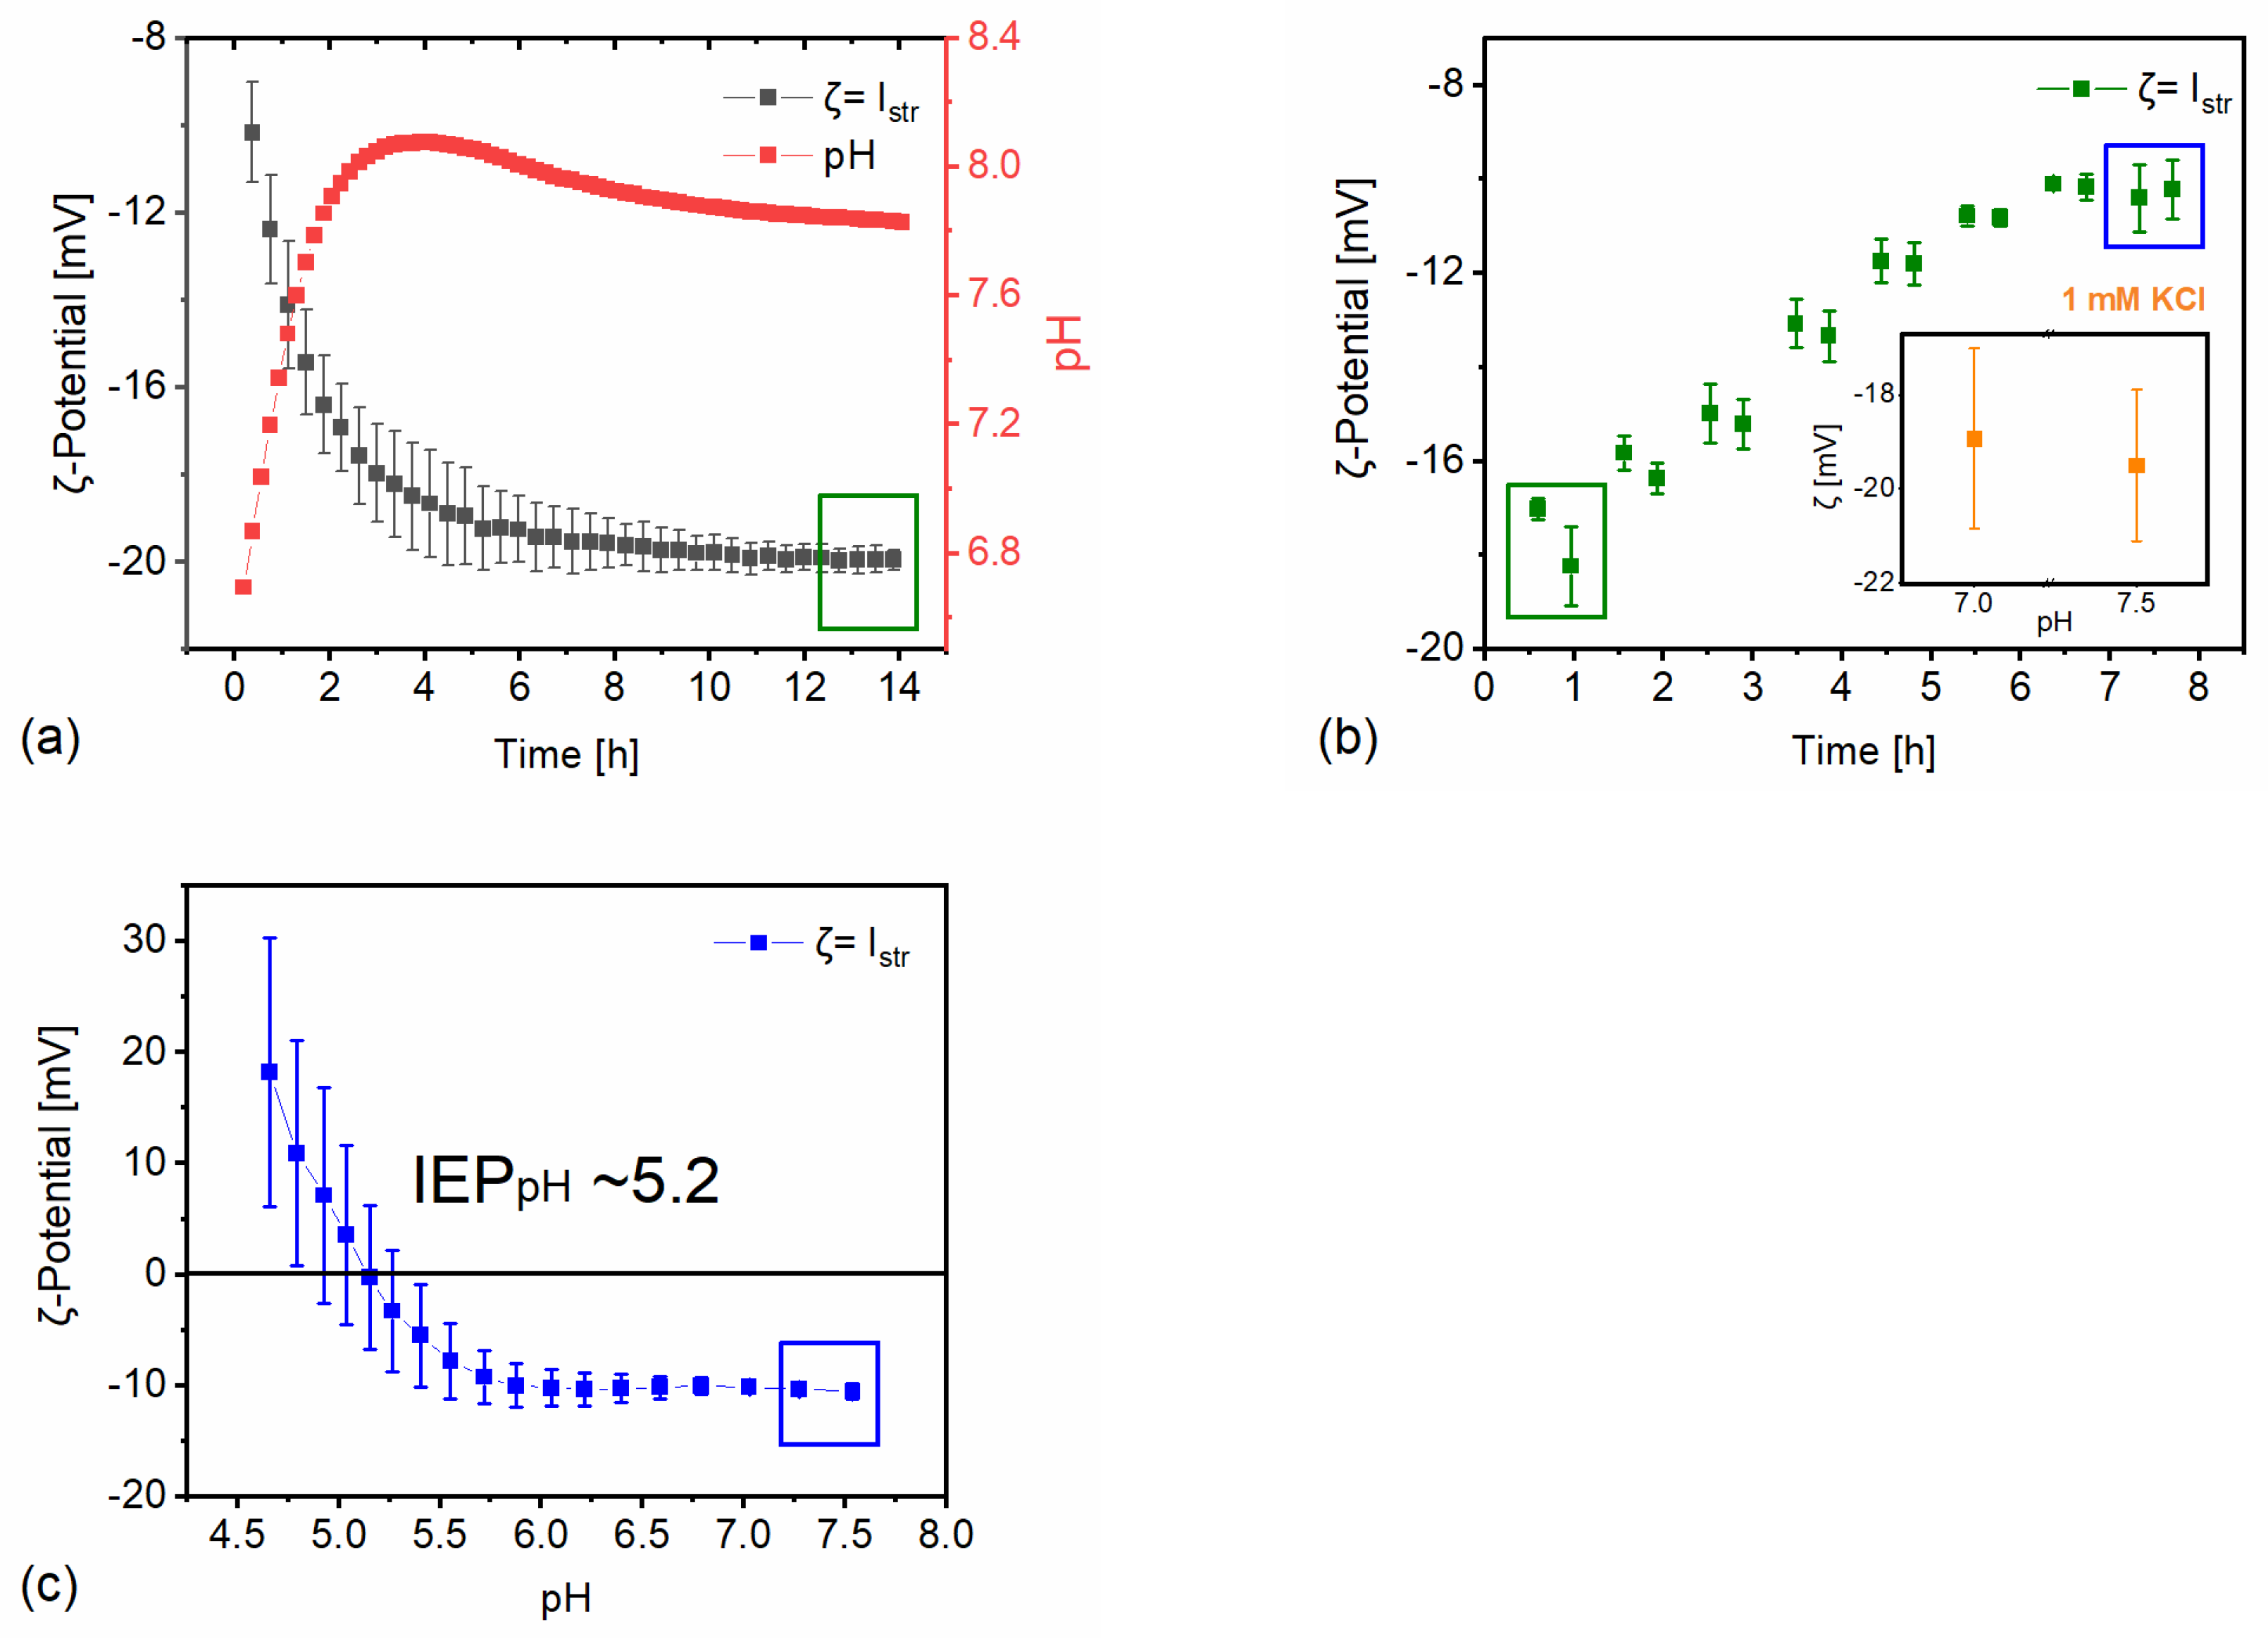
Figure 2.
Adsorption for d10000 (a) and desorption in simulated rainwater (b) for n-ZrO2 on Apuan marble at two different bead sizes (i.e., 1 mm and 0.25 mm) and two different solid/liquid ratios (0.1 kg/L and 0.2 kg/L).
Figure 2.
Adsorption for d10000 (a) and desorption in simulated rainwater (b) for n-ZrO2 on Apuan marble at two different bead sizes (i.e., 1 mm and 0.25 mm) and two different solid/liquid ratios (0.1 kg/L and 0.2 kg/L).
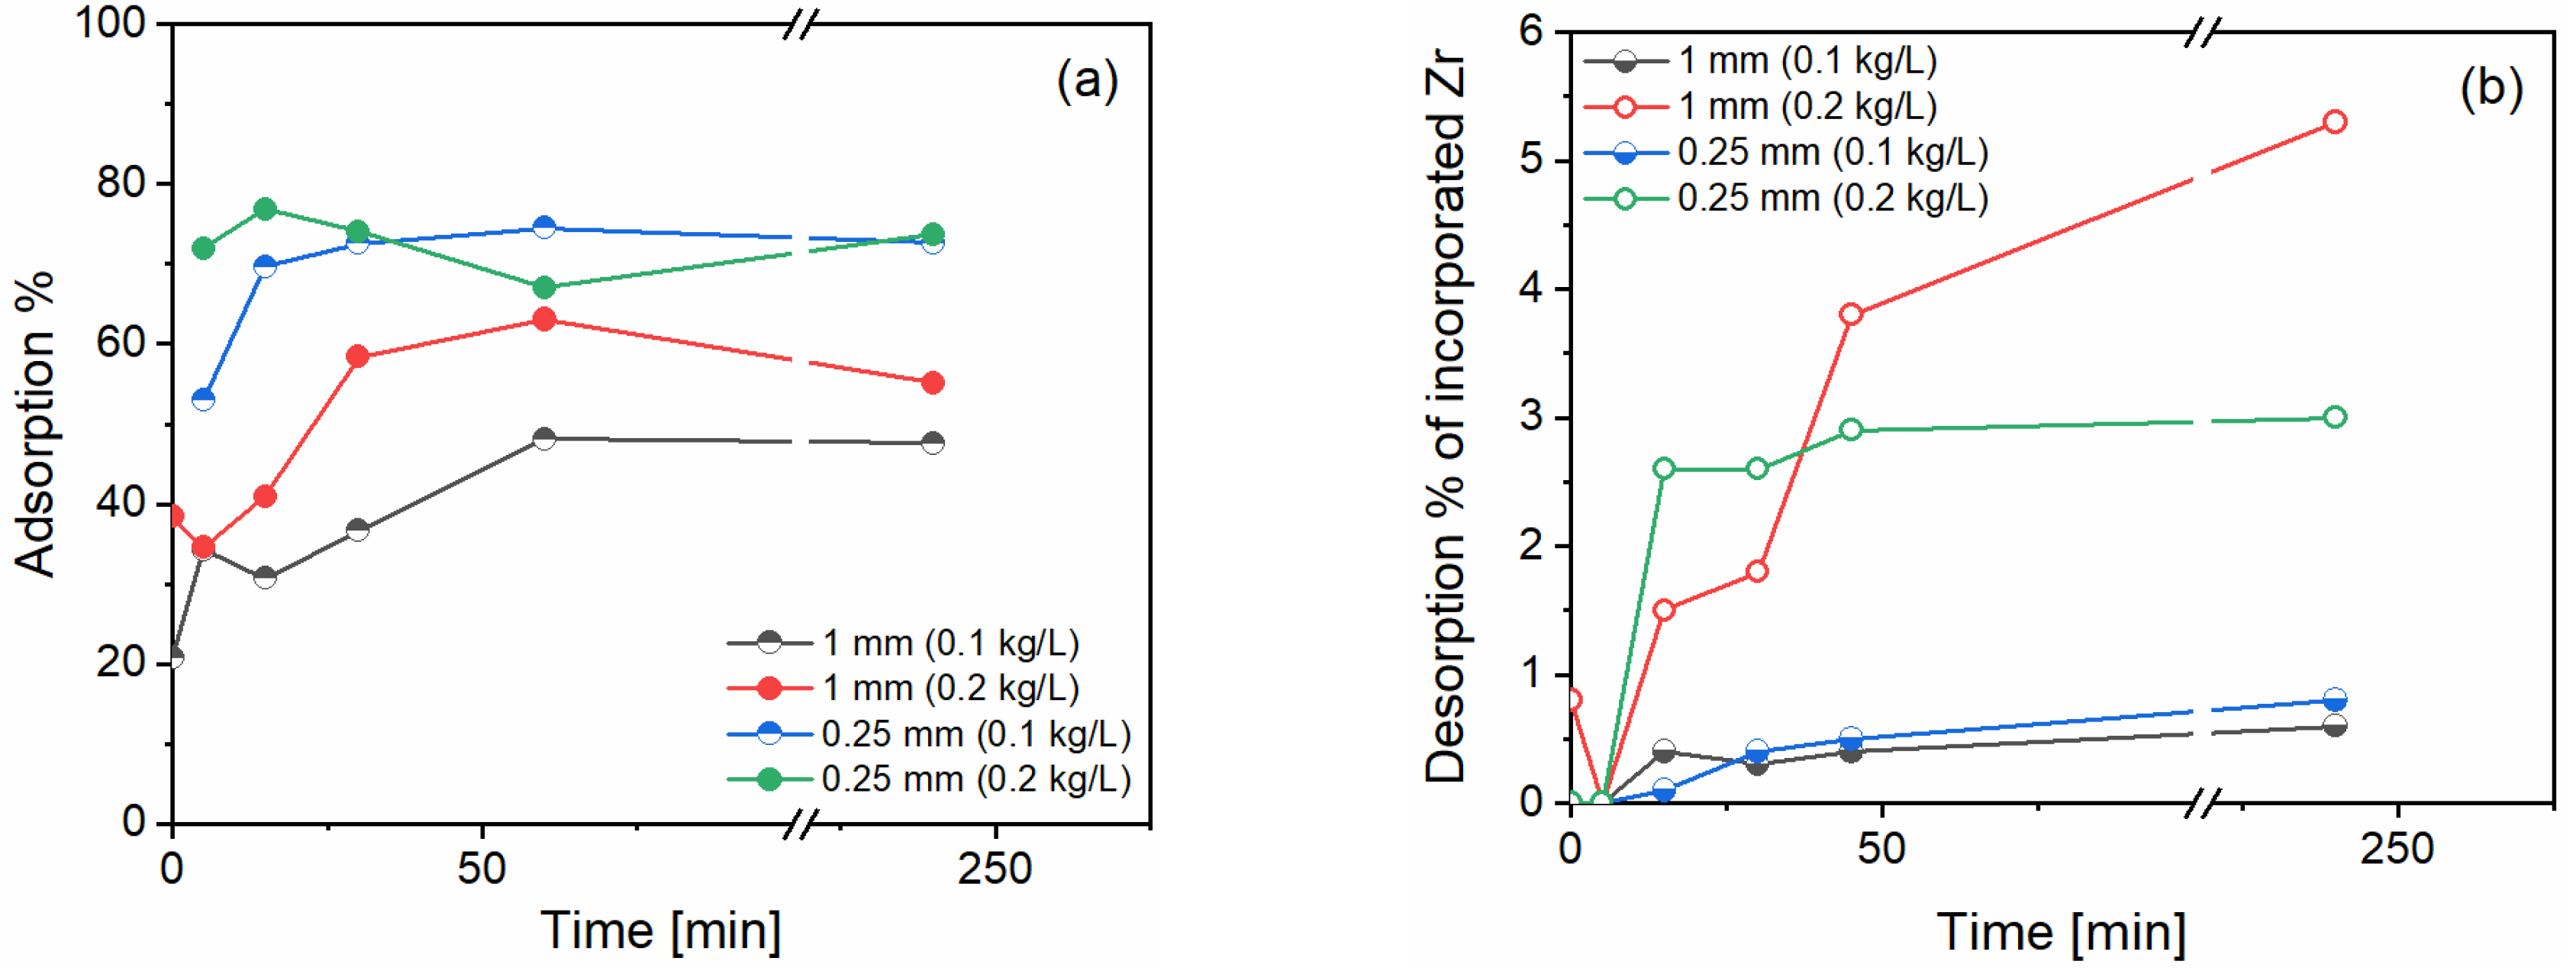
Figure 3.
Concentrations of dissolved calcium as relative percentages (comparing the concentrations obtained at minute 0 and after 24 hours) for each experimental condition. Results are displayed for 0.25 mm beads (left) and 1 mm beads (right) over time for both adsorption (from minute 0 until minute 240) and desorption experiments (i.e., after minute 240). The specified marble mass corresponds to the solid-liquid ratio of 100g/L (5g) and 200g/L (10g).
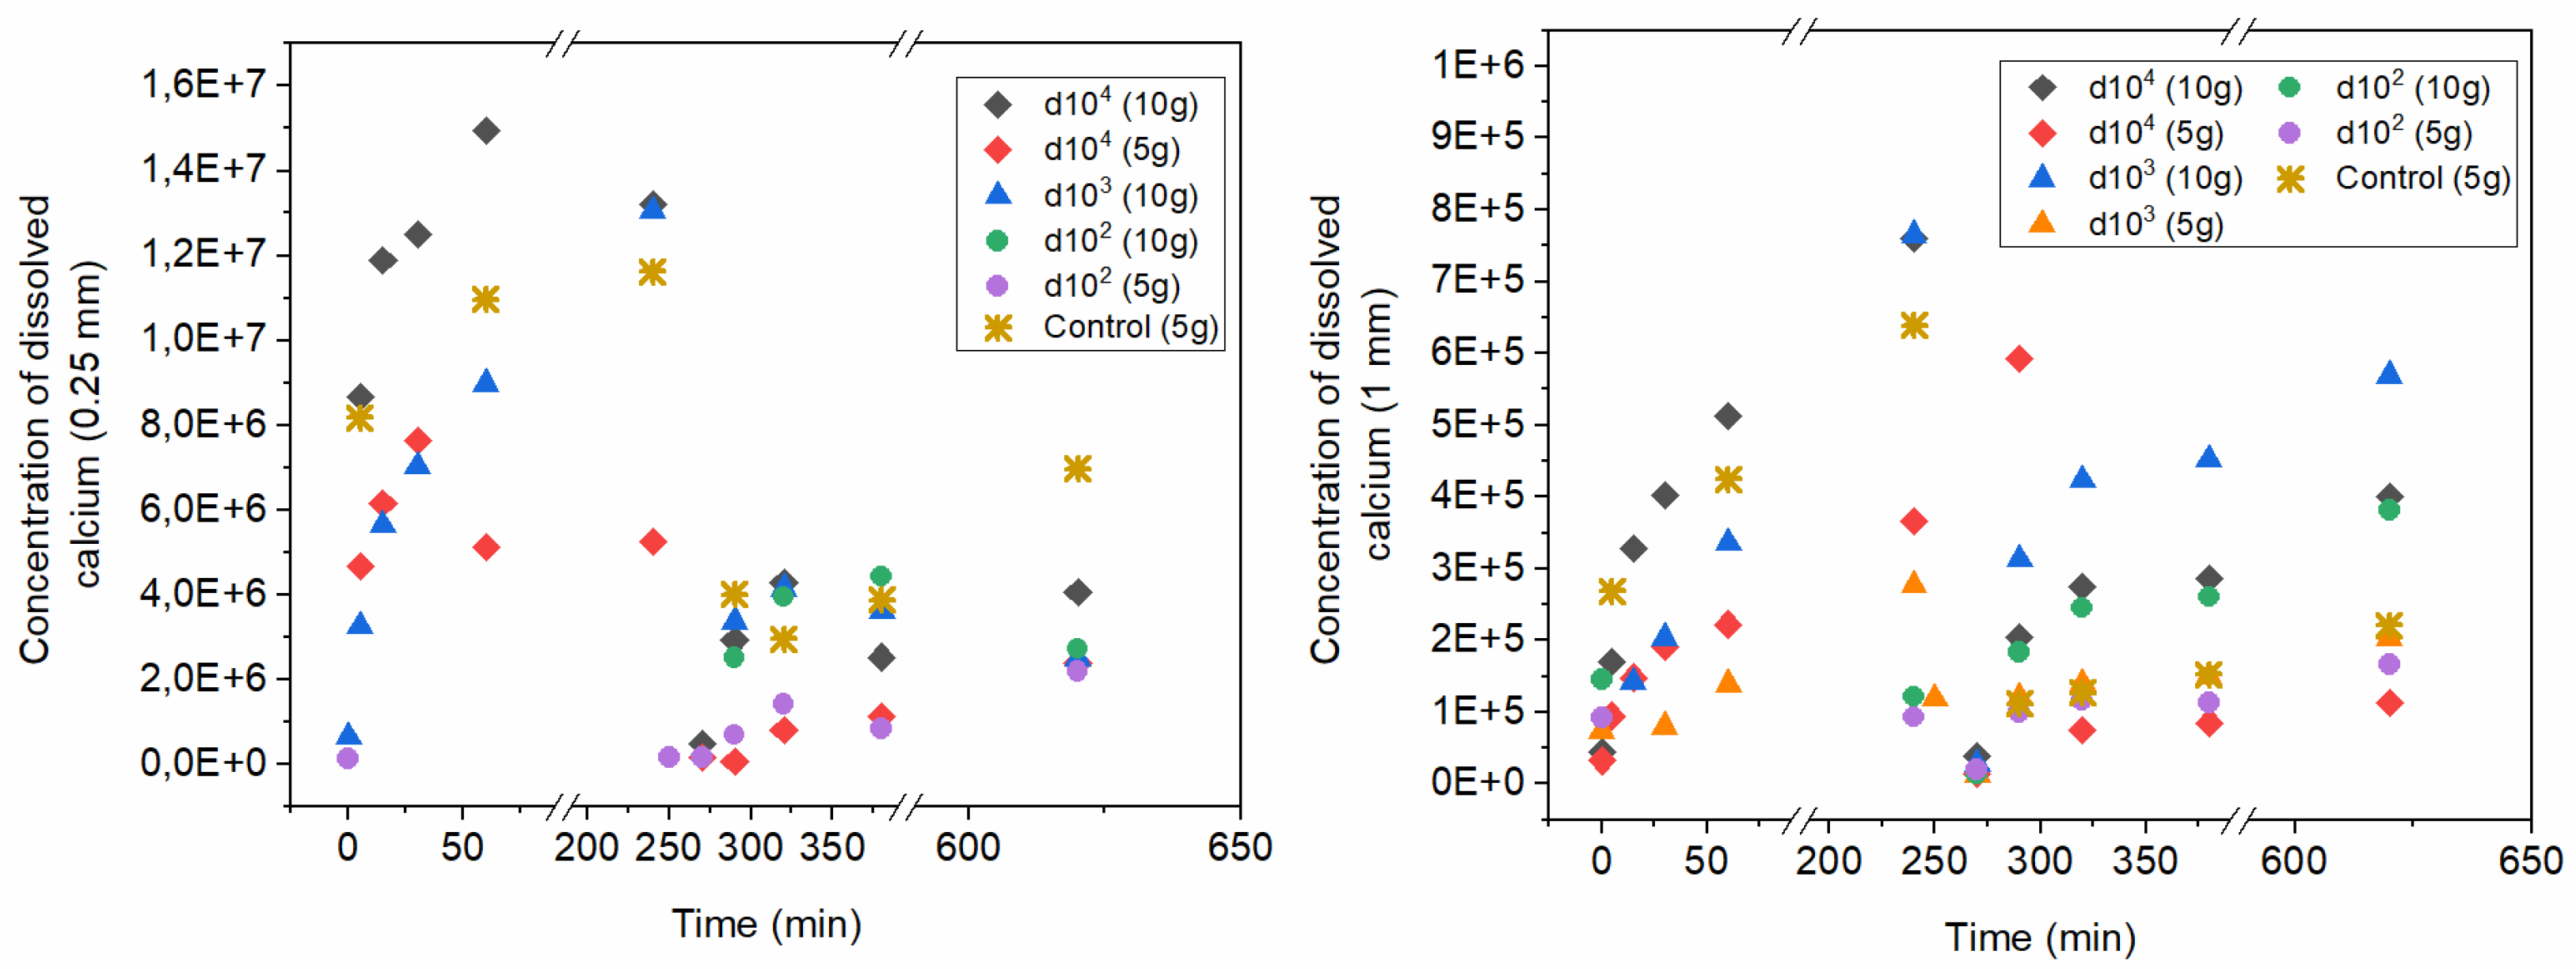
Figure 4.
SEM micrographs displaying (a) the bonding between calcite (i) and zirconia (ii), while (iii) is the resin used for embedding the sample, (b) partial filling of micro cracks, (c) topography of cured nano-zirconia with efflorescence and, (d) overview of the crackled consolidant on top of Apuan marble.
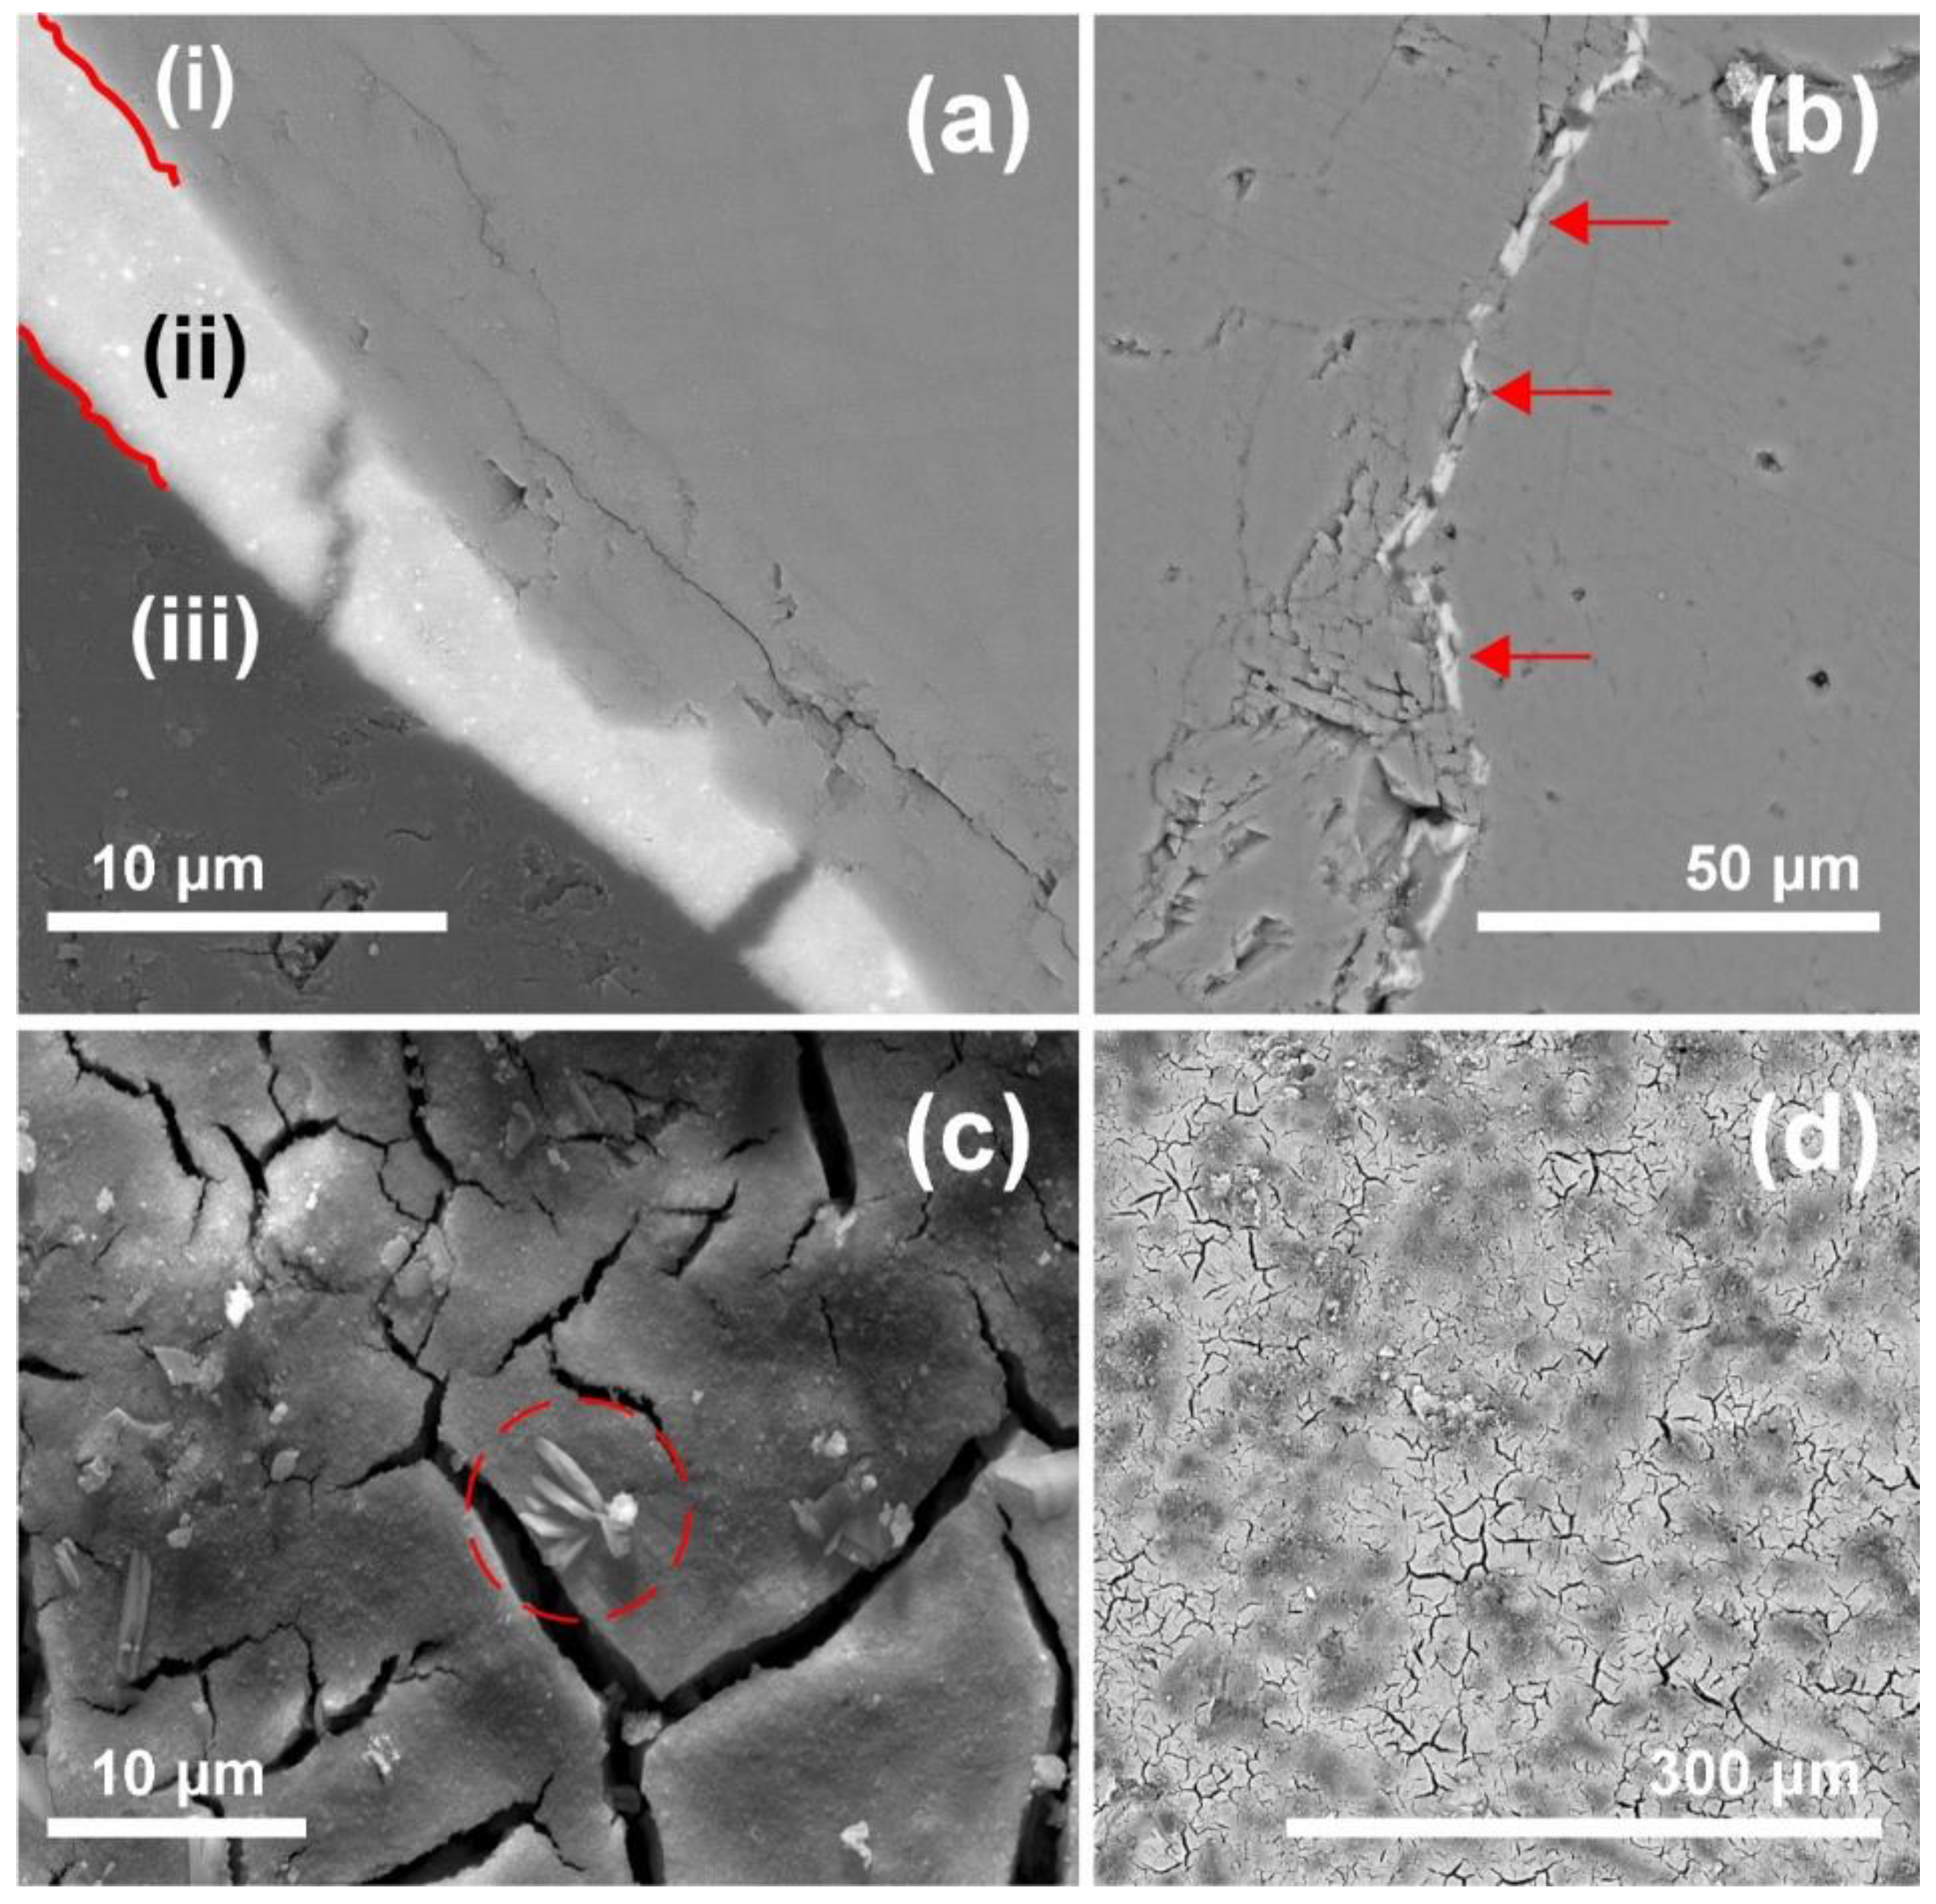
Figure 5.
Mercury intrusion porosimetry data displaying the pore radii distribution of Apuan marble in three conditions: (a) sound, (b) artificially aged or heat treated and, (c) artificially aged and consolidated with n-ZrO2. The open total porosity measured by means of Hg-intrusion is also displayed in the graphs for all stone conditions.
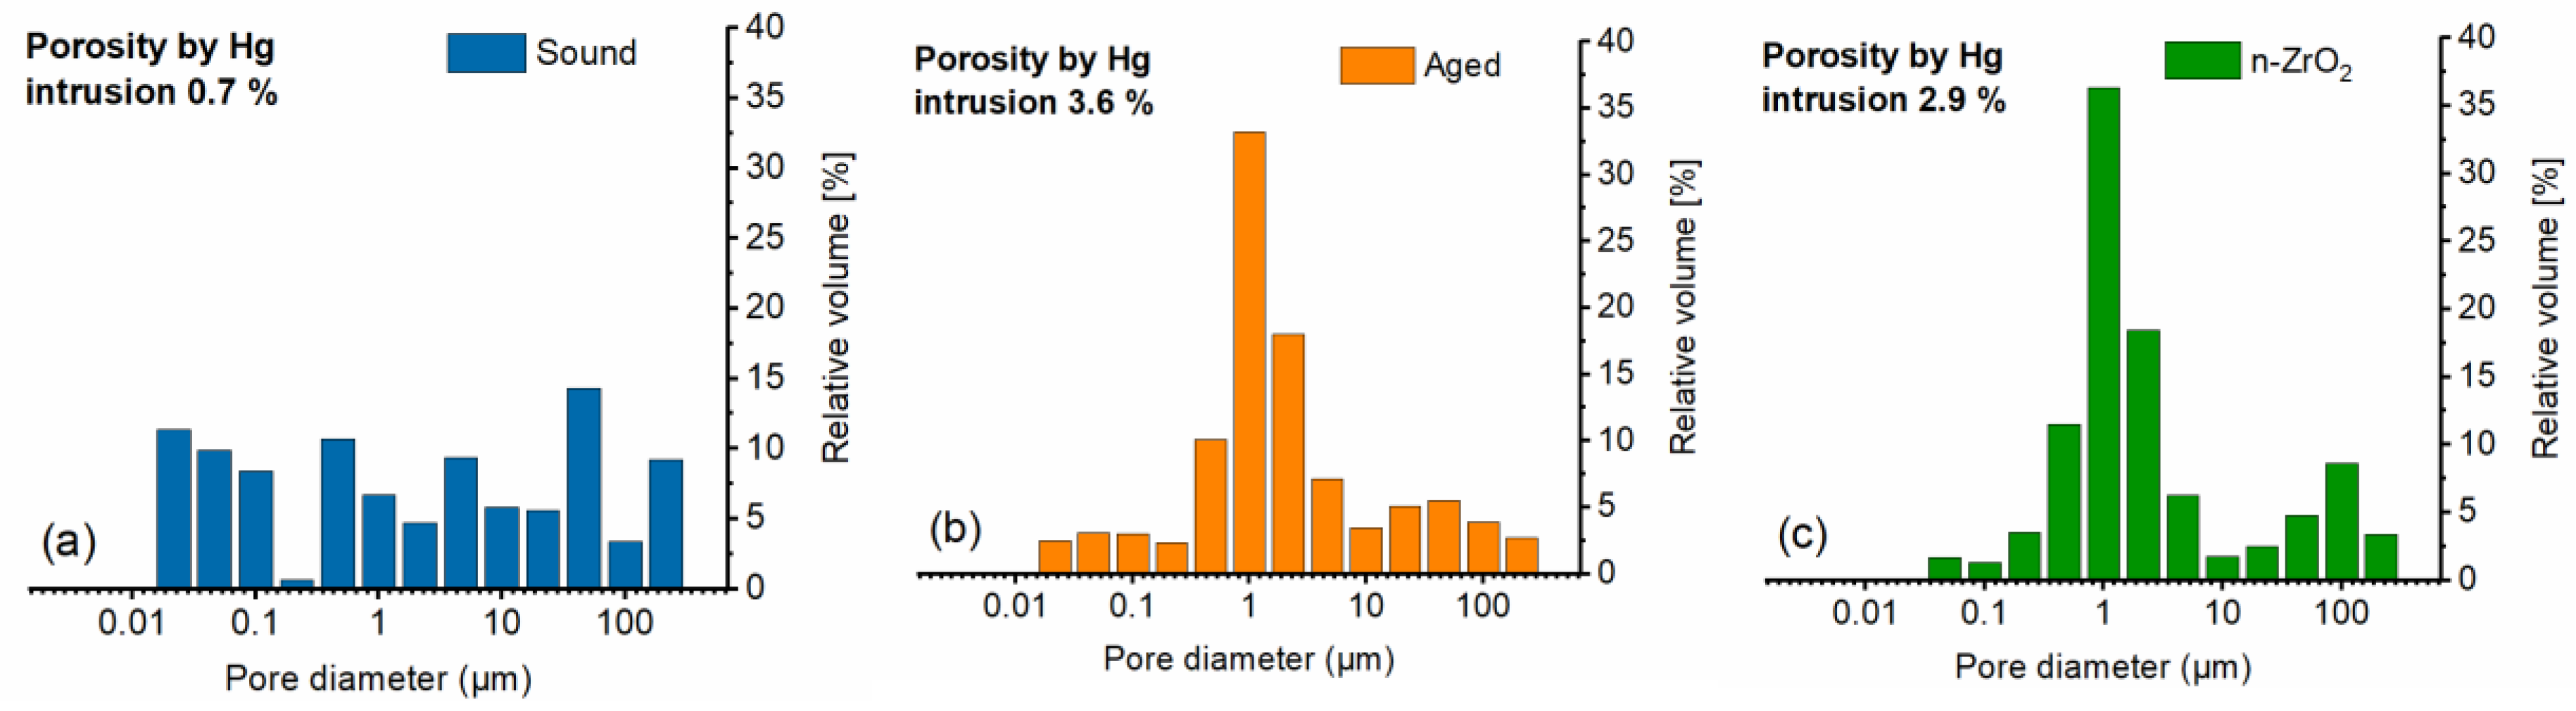
Figure 6.
(a) Youngs modulus and, (b) drilling resistance measurements before and after treatment.
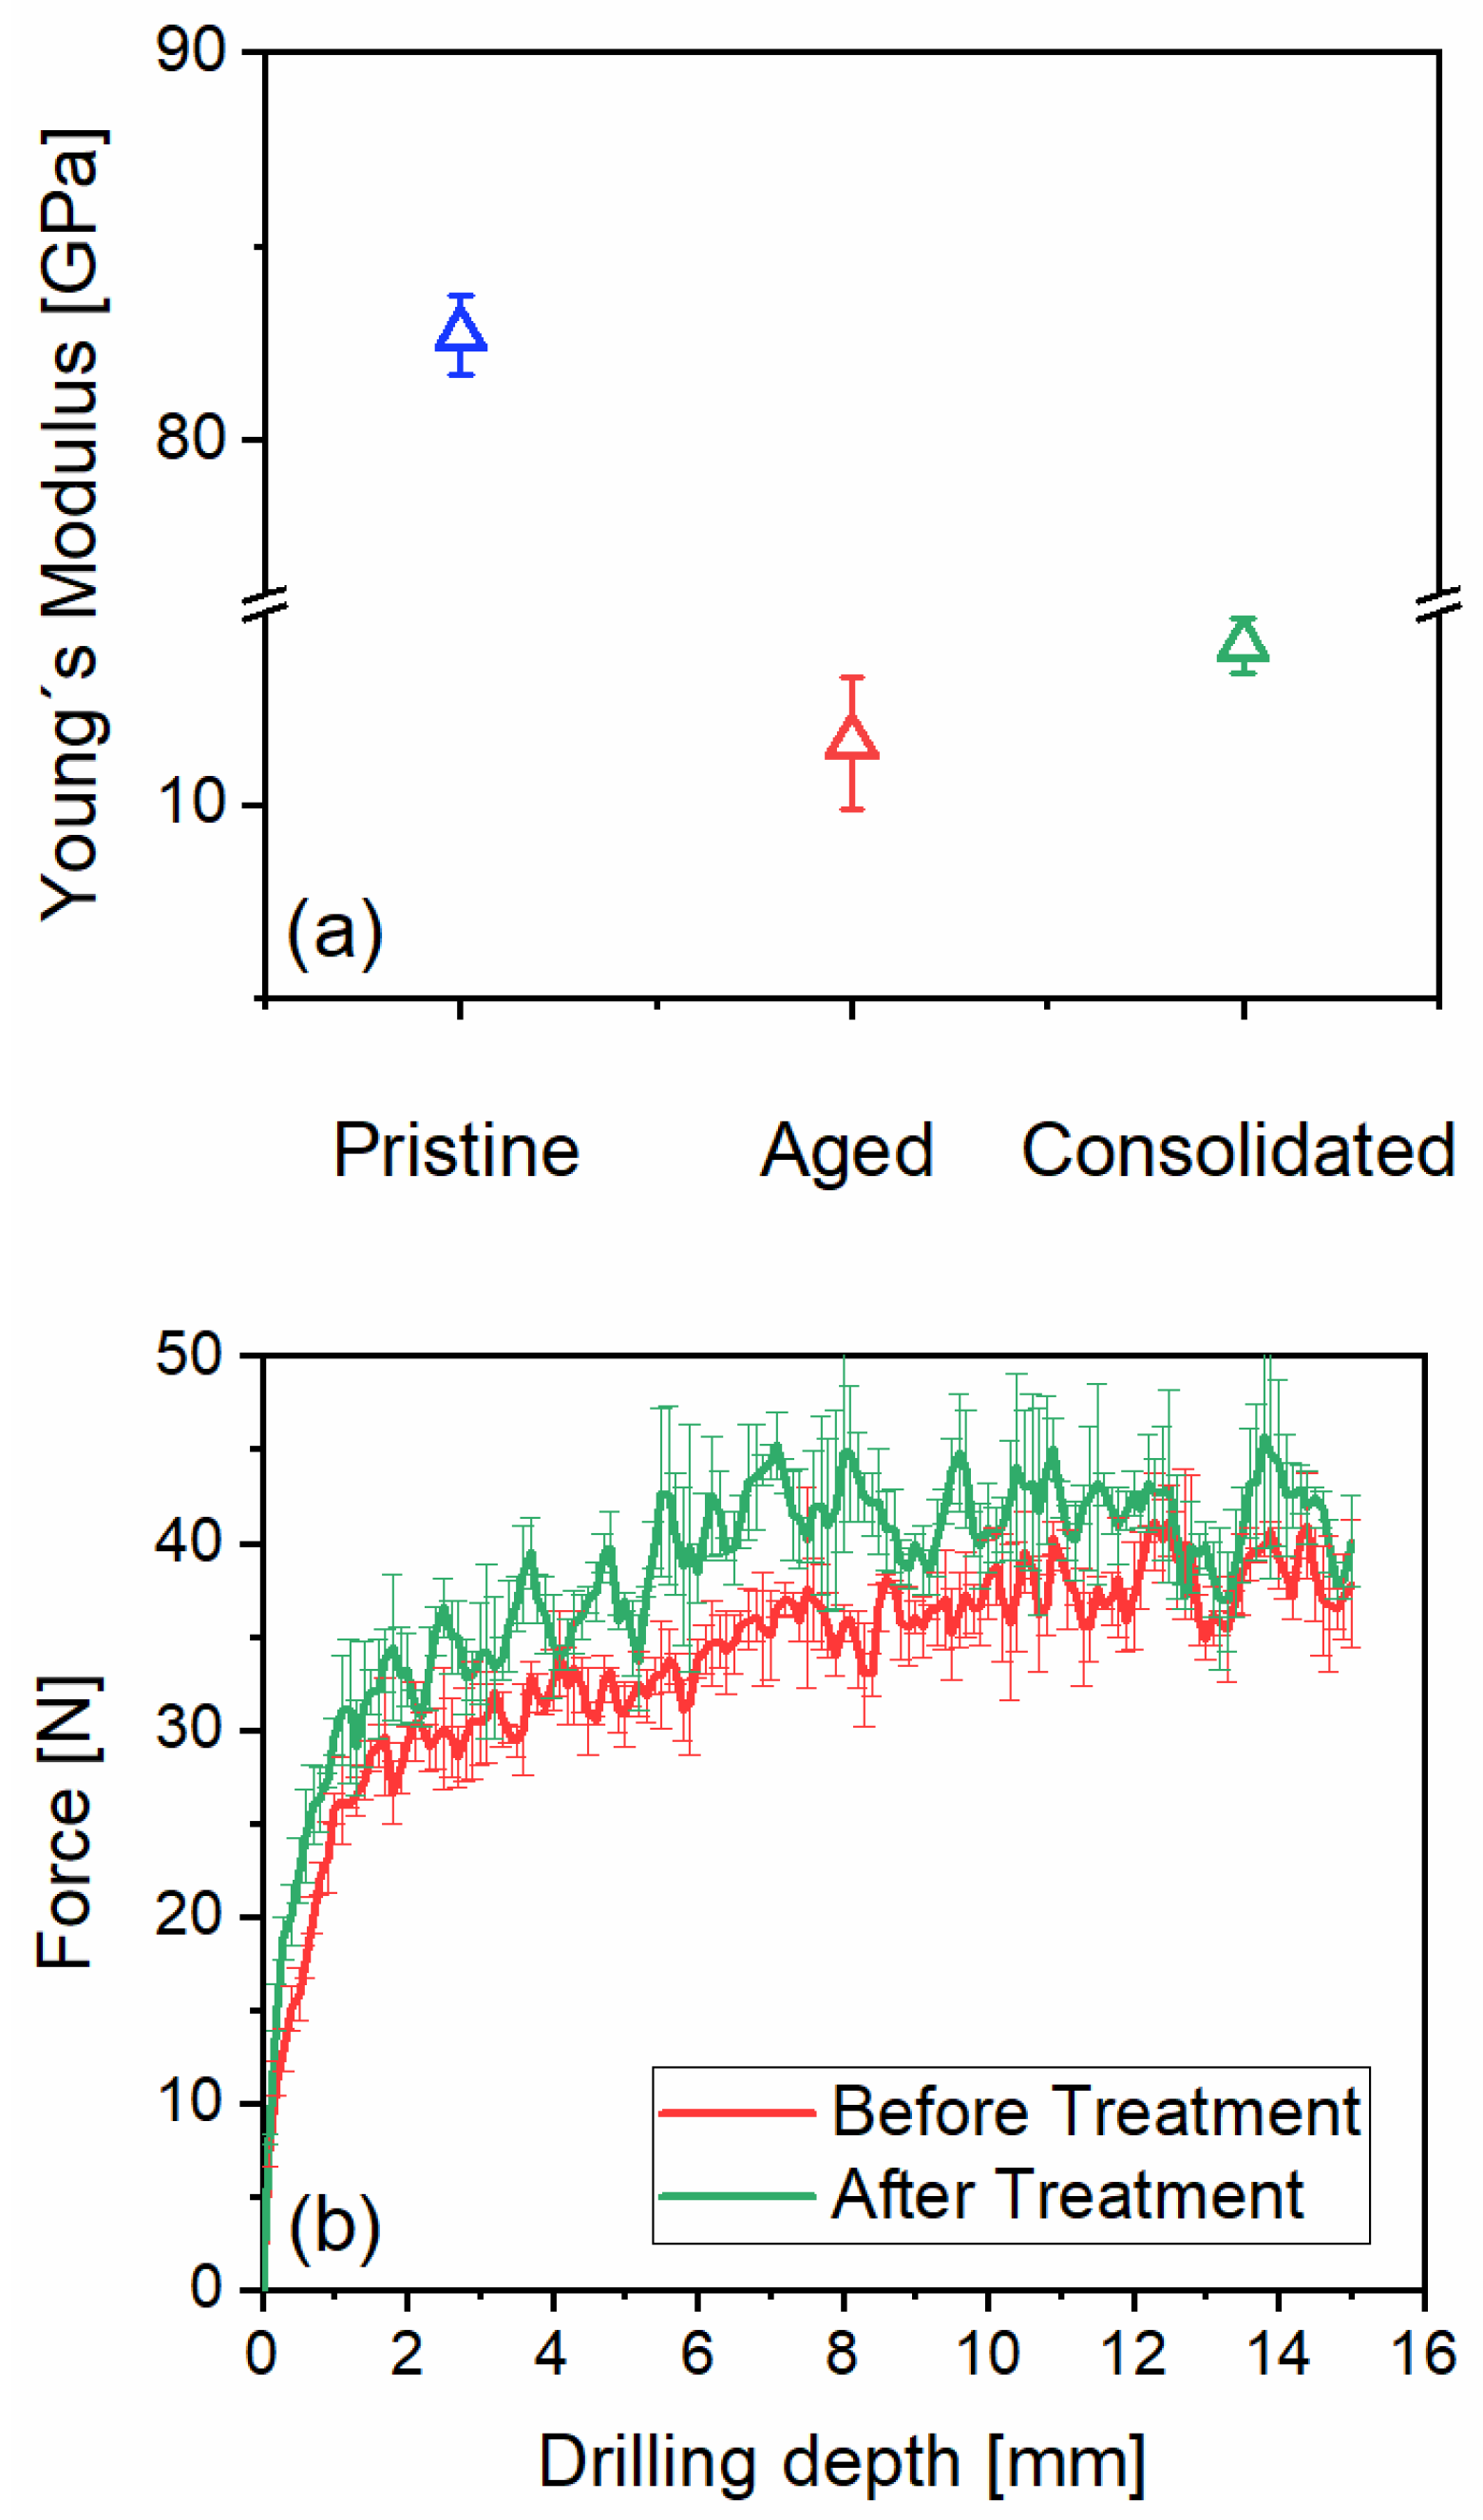
Figure 7.
Compatibility assessment of nano-ZrO2 applied on Apuan marble. dE*describes the metric difference or distance between two colours according to the rules of the International Commission on Illumination (CIE). IDt/IDnt represents the ratio of the drying index after a period of 24 hours. ACt/ACnt is the ratio of the water absorption coefficient by capillarity after 60 min. Pt/Pnt is the ratio of water vapour permeability. C.A. is the contact angle after treatment. The values for drying index, water absorption coefficient and water vapour permeability hold the subscript (t) for treated and (nt) for not treated. All corresponding raw data can be viewed in Table 2.
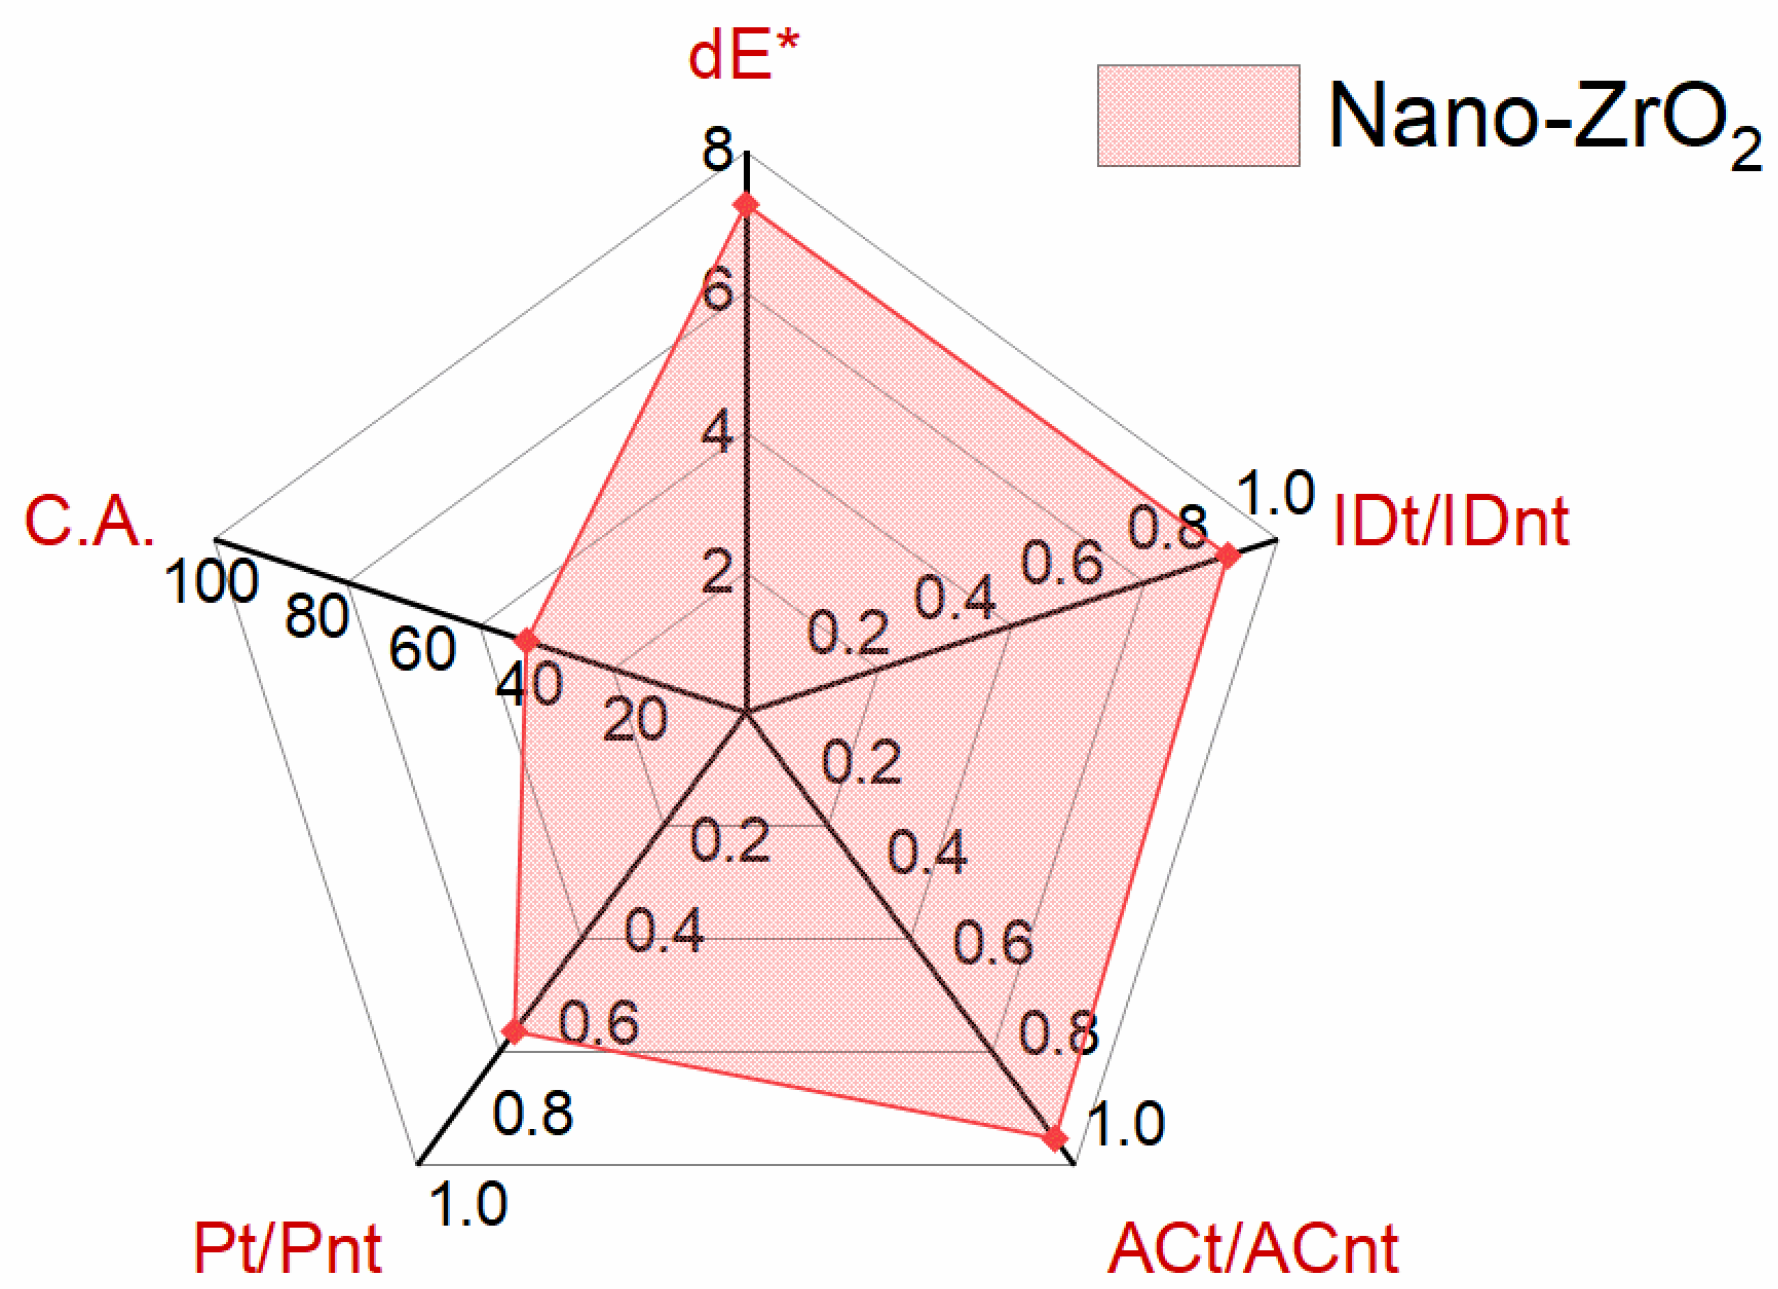

Table 1.
Laboratory based test methods used to assess the success criterion of treatment performance and materials properties.
Table 1.
Laboratory based test methods used to assess the success criterion of treatment performance and materials properties.
| Type of test | Reference | Criterion & Characterization |
|---|---|---|
| Scanning electron microscopy | Not std. | Bonding to substrate, bridging. |
| Atomic force microscopy | Not std. | Surface alterations |
| Pore size distribution | Not std. | No secondary micro porosity |
| Dynamic elastic modulus | EN 14146 [39] | Improvement |
| Drilling resistance | Not std. | Improvement, smooth profile |
| Water vapour permeability | EN 15803 [40] | No drastic reduction |
| Water absorption coefficient | EN 15801 [41] | No drastic reduction |
| Drying index | EN 16322 [42] | No drastic reduction |
| Contact angle of water | EN 15802 [43] | Change ≤20% untreated |
| Colour measurements | EN 15886 [44] | ΔE change <5 |
Table 2.
Laboratory based test methods used to assess the compatibility of n-ZrO2 on Apuan marble in terms of water related tests and colour measurements. Not treated corresponds to the artificially aged or heat-treated condition and treated corresponds to the artificially aged and subsequently n-ZrO2 treated condition.
| dE* metric difference between two colours | L/nt | a/nt | b/nt |
| 79.71 | -0.96 | -3.20 | |
| L/t | a/t | b/t | |
| 86.92 | -0.88 | -2.49 | |
| ΔL* | Δa* | Δb* | |
| 7.21 | 0.08 | 0.71 | |
| IDt/IDnt represents the ratio of the drying index after a period of 24 hours | Not treated | Treated | IDt/IDnt |
| 0.0549 0.0390 0.0654 |
0.0533 0.0448 0.0391 |
0.9711 1.1493 0.5975 |
|
| ACt/ACnt is the ratio of the water absorption coefficient by capillarity after 60 min | Not treated | Treated | ACt/ACnt |
| 0.601 ± 0.024 | 0.566 ± 0.018 | 0.94 | |
| Pt/Pnt is the ratio of water vapour permeability | Not treated | Treated | Pt/Pnt |
| 1.60E-12 ± 6.08E-14 | 1.12E-12 ± 1.26E-13 | 0.70 | |
| C.A. is the contact angle after the treatment | Not treated | Treated | |
| 68.89 | 41.25 |
Disclaimer/Publisher’s Note: The statements, opinions and data contained in all publications are solely those of the individual author(s) and contributor(s) and not of MDPI and/or the editor(s). MDPI and/or the editor(s) disclaim responsibility for any injury to people or property resulting from any ideas, methods, instructions or products referred to in the content. |
© 2024 by the authors. Licensee MDPI, Basel, Switzerland. This article is an open access article distributed under the terms and conditions of the Creative Commons Attribution (CC BY) license (http://creativecommons.org/licenses/by/4.0/).
Copyright: This open access article is published under a Creative Commons CC BY 4.0 license, which permit the free download, distribution, and reuse, provided that the author and preprint are cited in any reuse.


