1. Introduction
The rise of various online platforms and social media has resulted in a surge in the quantity of bot accounts, which are automated accounts designed to mimic human behavior. These bot accounts can be used for various malicious purposes, including spreading spam, phishing, and disinformation. In the context of data science platforms such as Kaggle, bot accounts can manipulate competition results, scrape data, and engage in other malicious activities that compromise the platform’s integrity. Therefore, it is essential to develop methods to identify and distinguish between bot and real accounts to maintain a safe and secure platform for data scientists and machine learning engineers.
Recent research in literature has made extensive use of machine learning algorithms to detect automated and fake social media accounts [
1]. Even though the fact that the terms fake account and bot account are occasionally used together, they are not the same. Social media accounts that are controlled by software are known as bots or Sybils.
Social bots are a different name for bot accounts on social networking sites [
2]. Fake accounts are those that users create by utilizing false identities, stolen identities, or impersonating real individuals on social media. From this, it may be inferred that identifying fake accounts managed by people is more difficult than identifying bot accounts controlled by software [
3]. Detecting bot accounts on social media is the subject of the majority of studies in literature [
4]. Also, it is apparent that most research works in literature concentrate on bot accounts on Twitter and Instagram [
1,
4]. Unexpectedly, Kaggle has not received much attention for bot account identification. The lack of datasets with real and automated user accounts is one of the causes. It is clear from the studies that are exclusive to Kaggle that they concentrate on a rich and varied research environment for examining a range of subjects relating to machine learning, data science, and online communities. The use of fake and bot accounts is crucial for the manipulation of competitions, spamming, and reputation management, all of which can negatively impact user experience. As a result, detecting bot accounts on Kaggle is an essential research topic. Due to the scarcity of research studies on bot account detection in Kaggle, machine learning methods have been employed to categorize genuine and automated accounts.
This article’s remaining sections are organized as follows: In chapter 2, existing studies on detecting bot accounts are examined. Chapter 3 presents the study’s materials and methods. Chapter 4 presents the results. Conclusions are provided in chapter 5.
2. Existing Studies
The problem of detecting Bot accounts have gained much interest over the years. A lot of research studies have been carried out on other social media platforms like Instagram and Twitter [
1,
4]. Moreover, studies related to Bot detection on Kaggle are limited despite the availability of the dataset on the online platform. Table 1 provides a summary of previous research conducted on the detection of bot accounts across various social media platforms. Also, classifiers that had the highest predictive performance were highlighted in bold in terms of their F-scores. Access to data sets is essential for the growth of the relevant research field and the study’s ability to be replicated. Sadly, only few datasets are accessible to the general public. One of the existing studies examined detecting real and fake identities. [
4] used supervised machine learning techniques to detect fake identities for human accounts on Twitter. They collected a dataset that contained 169,517 accounts for the detection task. Apart from the attributes that are currently included in the dataset, some new features obtained from other research studies similar to bot detection were added. After the necessary data preprocessing steps were carried out, supervised learning models like support vector machines and random forest were trained using resampling and cross validation to spot fake accounts. The models were evaluated in which random forest had the highest accuracy and F1 score of 87.11% and 49.75% respectively. The main contribution of their research was to examine whether the engineered features used in automated accounts detection can also detect fake human accounts. Based on the model results, detection of fake accounts using features for bot detection was not successful.
In the work of [
5], an algorithm was developed to detect automated accounts on Instagram using classifiers such as the Naïve Bayes, Support vector machines (SVM), Neural Networks, and Logistic Regression. There were 700 real accounts and 700 fake accounts in the dataset. For the study, features including the total number of media, follower and following counts, the presence of highlight reels (binary features), the number of photos with other people’s tags, and the average number of recent hashtags were used. To overcome the negative bias among features, a cost sensitive algorithm was applied for dimensionality reduction. The models were trained using grid search and 10-fold cross validation to determine the best parameters. In terms of F1-score, Neural Networks and SVM had the highest outcome of 86%. This score is expected given that SVMs are well known for optimizing the margin better than most other algorithms in binary problems and neural networks are well known for learning complex mappings with sufficient training data. Moreover, it was not surprising that Naive Bayes and logistic regression performed poorly because the features are not clearly independent (especially given how heavily both methods depend on feature independence).
Table 1.
Research studies about automated and fake account detection on social media platforms
Table 1.
Research studies about automated and fake account detection on social media platforms
| Study |
Account Type |
Dataset |
| [5] |
Real and Automated (Instagram) |
700 real and 700 automated accounts |
| [4] |
Real and Fake Accounts (Twitter) |
154,517 real and 15,000 fake accounts |
| [1] |
Bot, Real and Fake accounts (Instagram) |
870 fake, 959 real and 959 automated accounts |
A great deal of bot detection techniques relies on manually labeled data and supervised machine learning. [
6]. Popular approaches use random forest classifiers utilize user, temporal, content, and social network features [
2] using fewer features and logistic regression, faster classification can be obtained [
7] to detect bots at the tweet level, some methods combine information from tweet content with metadata [
8]. [
9] propose a simpler approach by testing the randomness of the screen name. An alternative method for identifying bots looks at collective behavior rather than individual accounts. This is accomplished without the use of human-labeled datasets by using unsupervised learning techniques to find unlikely similarities between accounts. Several examples of this approach include analyzing post timelines [
10], action sequences [
11], content [
12] and friends/followers’ ratio [
13]. Synchronized retweeting behavior can also be used to detect bots. However, this method is slow as it needs to analyze many pairs of accounts. A new method by [
2] was proposed in identifying social bots on social networking sites. The authors argue that current methods for detecting social bots are limited in scalability and generalizability, meaning that they may not work well on large datasets or be able to identify new types of social bots that have not been seen before. To address these limitations, the authors propose a new approach that focuses on selecting representative subsets of data that can be used to train machine learning models to detect social bots. They show that this approach is more scalable and generalizable than existing methods, and can detect a wide range of social bots with high accuracy. Their results showed that their data selection approach outperformed existing methods in terms of both scalability and generalizability. Specifically, they were able to detect a wide range of social bots with high accuracy, including those that had not been previously identified by other methods. For example, on the Twitter dataset, their approach achieved a precision of 0.934 and a recall of 0.883, which means that it correctly identified 93.4% of social bots in the dataset and only made false positive errors 6.6% of the time. On the Sina Weibo dataset, their approach achieved a precision of 0.919 and a recall of 0.901. Overall, these results suggest that their approach is a promising new method for social bot detection that can be applied to large-scale datasets and is more generalizable than existing methods.
The study by [
14] aimed to review the literature on the use of machine learning algorithms for detecting fake Instagram accounts. The study analyzed various approaches and algorithms used for this task and evaluated their performance. The study reviewed 19 research papers that proposed different machine learning algorithms for detecting fake Instagram accounts. The papers were selected based on their relevance to the topic and their publication in reputable journals or conferences. The study analyzed the algorithms used in the selected papers and evaluated their performance based on various metrics, including accuracy, precision, recall, F1-score, and area under the receiver operating characteristic curve (AUC-ROC). Five main categories of machine learning algorithms used for detecting fake Instagram accounts: supervised learning, unsupervised learning, hybrid learning, deep learning, and ensemble learning. Support Vector Machine (SVM) algorithm was the most widely used one, followed by Random Forest (RF) and Decision Tree (DT). The study also found that the performance of the algorithms varied depending on the dataset used for training and testing. Some algorithms achieved high accuracy, precision, and recall, while others performed poorly. The study reported that the highest accuracy achieved was 99.3%, the highest precision was 100%, the highest recall was 99.6%, and the highest AUC-ROC was 0.999. The study also identified several features that were commonly used for detecting fake Instagram accounts, including the number of followers, the number of posts, the account creation date, the ratio of followers to following, the use of hashtags, and the use of emojis. The research found that machine learning algorithms can detect fake Instagram accounts. The study identified and evaluated the performance of several algorithms and features commonly used for this task. The research found that the performance of the algorithms varies depending on the dataset used for training and testing, and that using multiple algorithms or ensemble learning can improve overall performance. The study is a great resource for academics and industry professionals who are interested in developing machine learning algorithms for spotting fake Instagram accounts.
Another research by [
15] aimed to develop a machine learning model for detecting fake accounts in Instagram. The study collected a dataset of Instagram accounts and used various machine learning algorithms to classify them as fake or genuine. The study collected a dataset of 3000 Instagram accounts, including 1500 fake and 1500 genuine accounts. The fake accounts were obtained from publicly available sources, such as bot farms and social media marketplaces, while the genuine accounts were obtained from random sampling of public profiles. The study used various machine learning algorithms, including logistic regression, decision tree, and random forest, to classify the accounts as fake or genuine. To differentiate between genuine and fake accounts, the research employed a range of attributes. These included features pertaining to account activity such as the number of posts, followers, and followings. Other features that were considered included profile information such as the profile picture, username, name, and bio. Additionally, the study also examined user engagement features such as the number of likes, comments and shares. The study demonstrated that machine learning algorithms can be effective in detecting fake accounts in Instagram. The study identified several features that are important for distinguishing between fake and genuine accounts and showed that the random forest algorithm achieved the best performance in this task. The study provides a valuable contribution to the field of social media analytics and can be used by researchers and practitioners to develop better methods for detecting fake accounts in Instagram.
Finally, the paper by [
16] proposes a method for detecting spammy names in social networks using Naive Bayes classification. The study aims to identify spam accounts based on their usernames alone, without analyzing other features like content or user behavior. The methodology involved building a dataset of usernames from Twitter, where each username was labeled as either spam or not spam. The dataset was then preprocessed to remove irrelevant characters and to standardize the format of usernames. After that, the dataset was divided into training and testing sets, with 80% of the data being used for training and 20% being used for testing. The Naive Bayes classifier was trained on the training set, where each username was represented as a bag of words, and the occurrence of each word was used as a feature. The results of the study showed that the Naive Bayes classifier achieved an accuracy of 94.5% in detecting spammy usernames. Additionally, the study analyzed the effectiveness of different features in detecting spam, finding that certain words and patterns were more indicative of spam accounts. For instance, words like "seo," "marketing," and "free" were found to be strong indicators of spam accounts. The study concludes that Naive Bayes classification is an effective method for detecting spammy usernames in social networks. This approach can be useful for social media platforms in automatically identifying and removing spam accounts, thereby improving the overall quality and reliability of the platform for genuine users.
3. Materials and Methods
3.1. Dataset
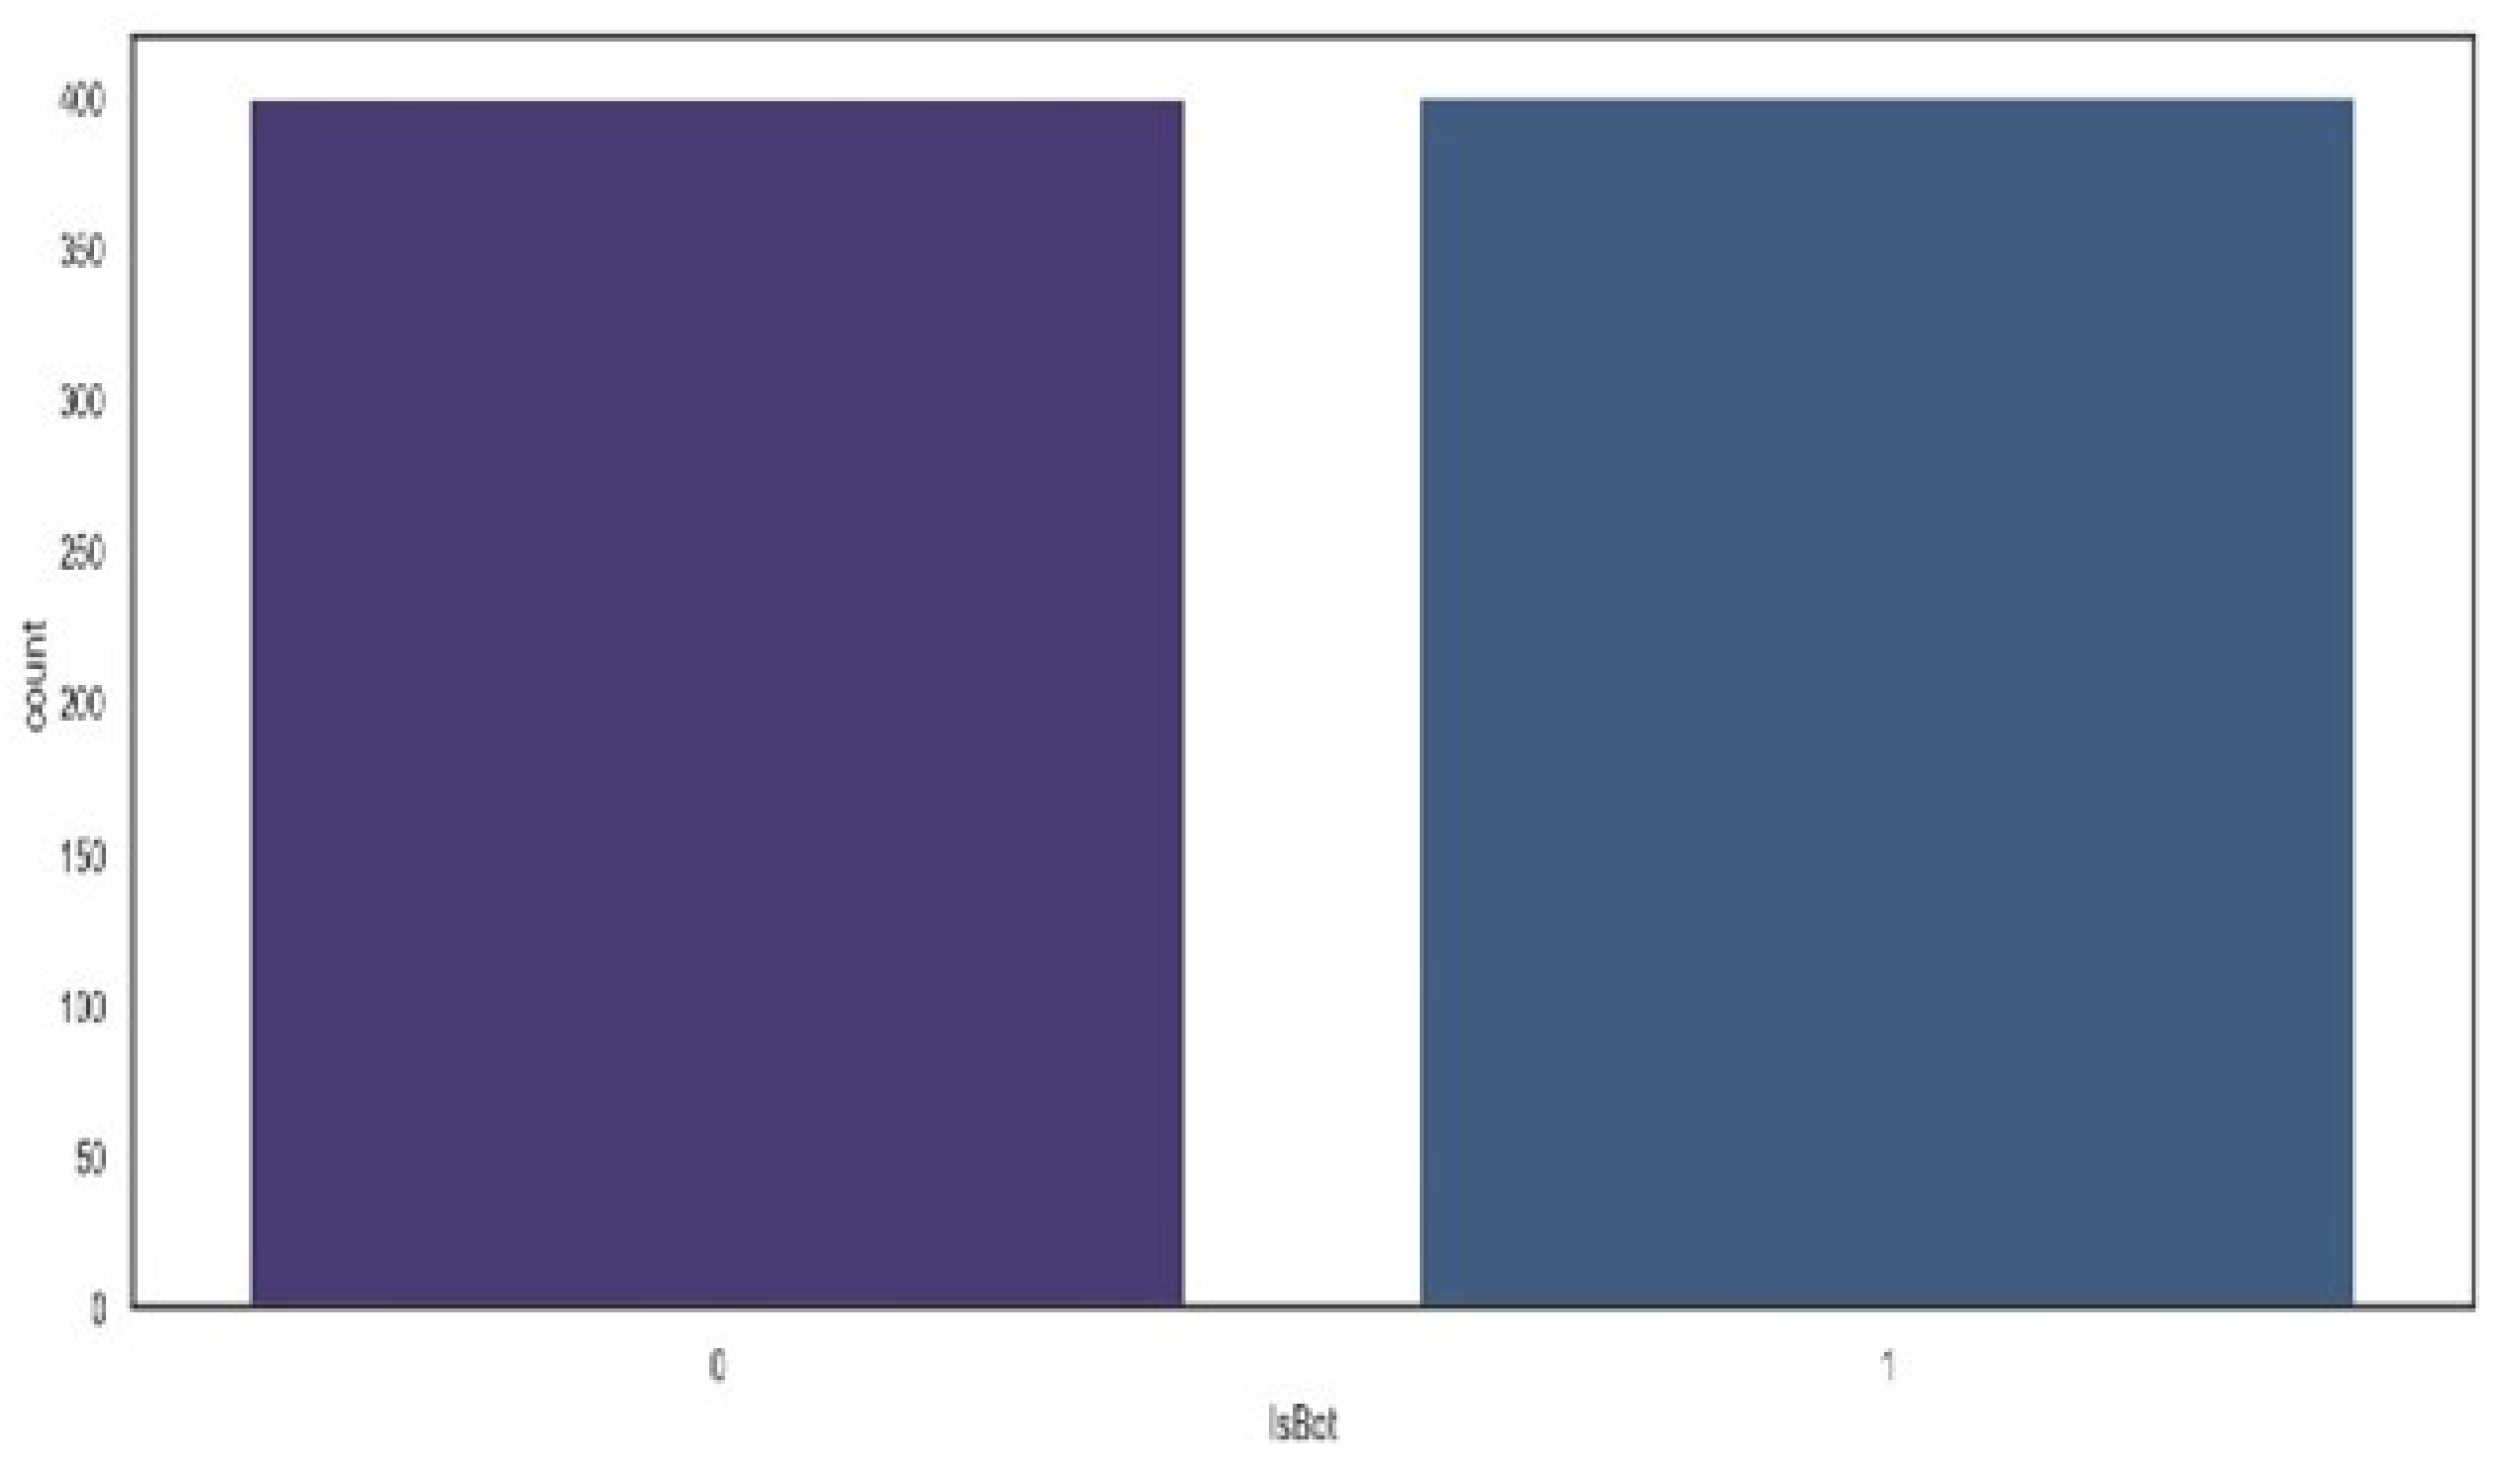
This research focuses on the meticulous detection of automated bot accounts on Kaggle, a prominent online platform for data science practitioners. Leveraging data scraped from Kaggle, our methodology involves a sophisticated approach to differentiate between genuine user accounts and automated bot entities. Real user accounts were sourced from top-ranking users across various facets of Kaggle, including competitions, datasets, notebooks, and discussions. The identification of automated bot accounts was facilitated by reports from vigilant users, flagging suspicious activity within Kaggle discussions. These flagged accounts underwent rigorous validation processes, integrating manual examination techniques to discern behavioral patterns indicative of automated activity. Notably, these patterns encompassed the rapid dissemination of automated and uniform comments, notebooks, and datasets, manifesting within short timeframes. The dataset consisted of 400 automated accounts and 399 real accounts as shown in
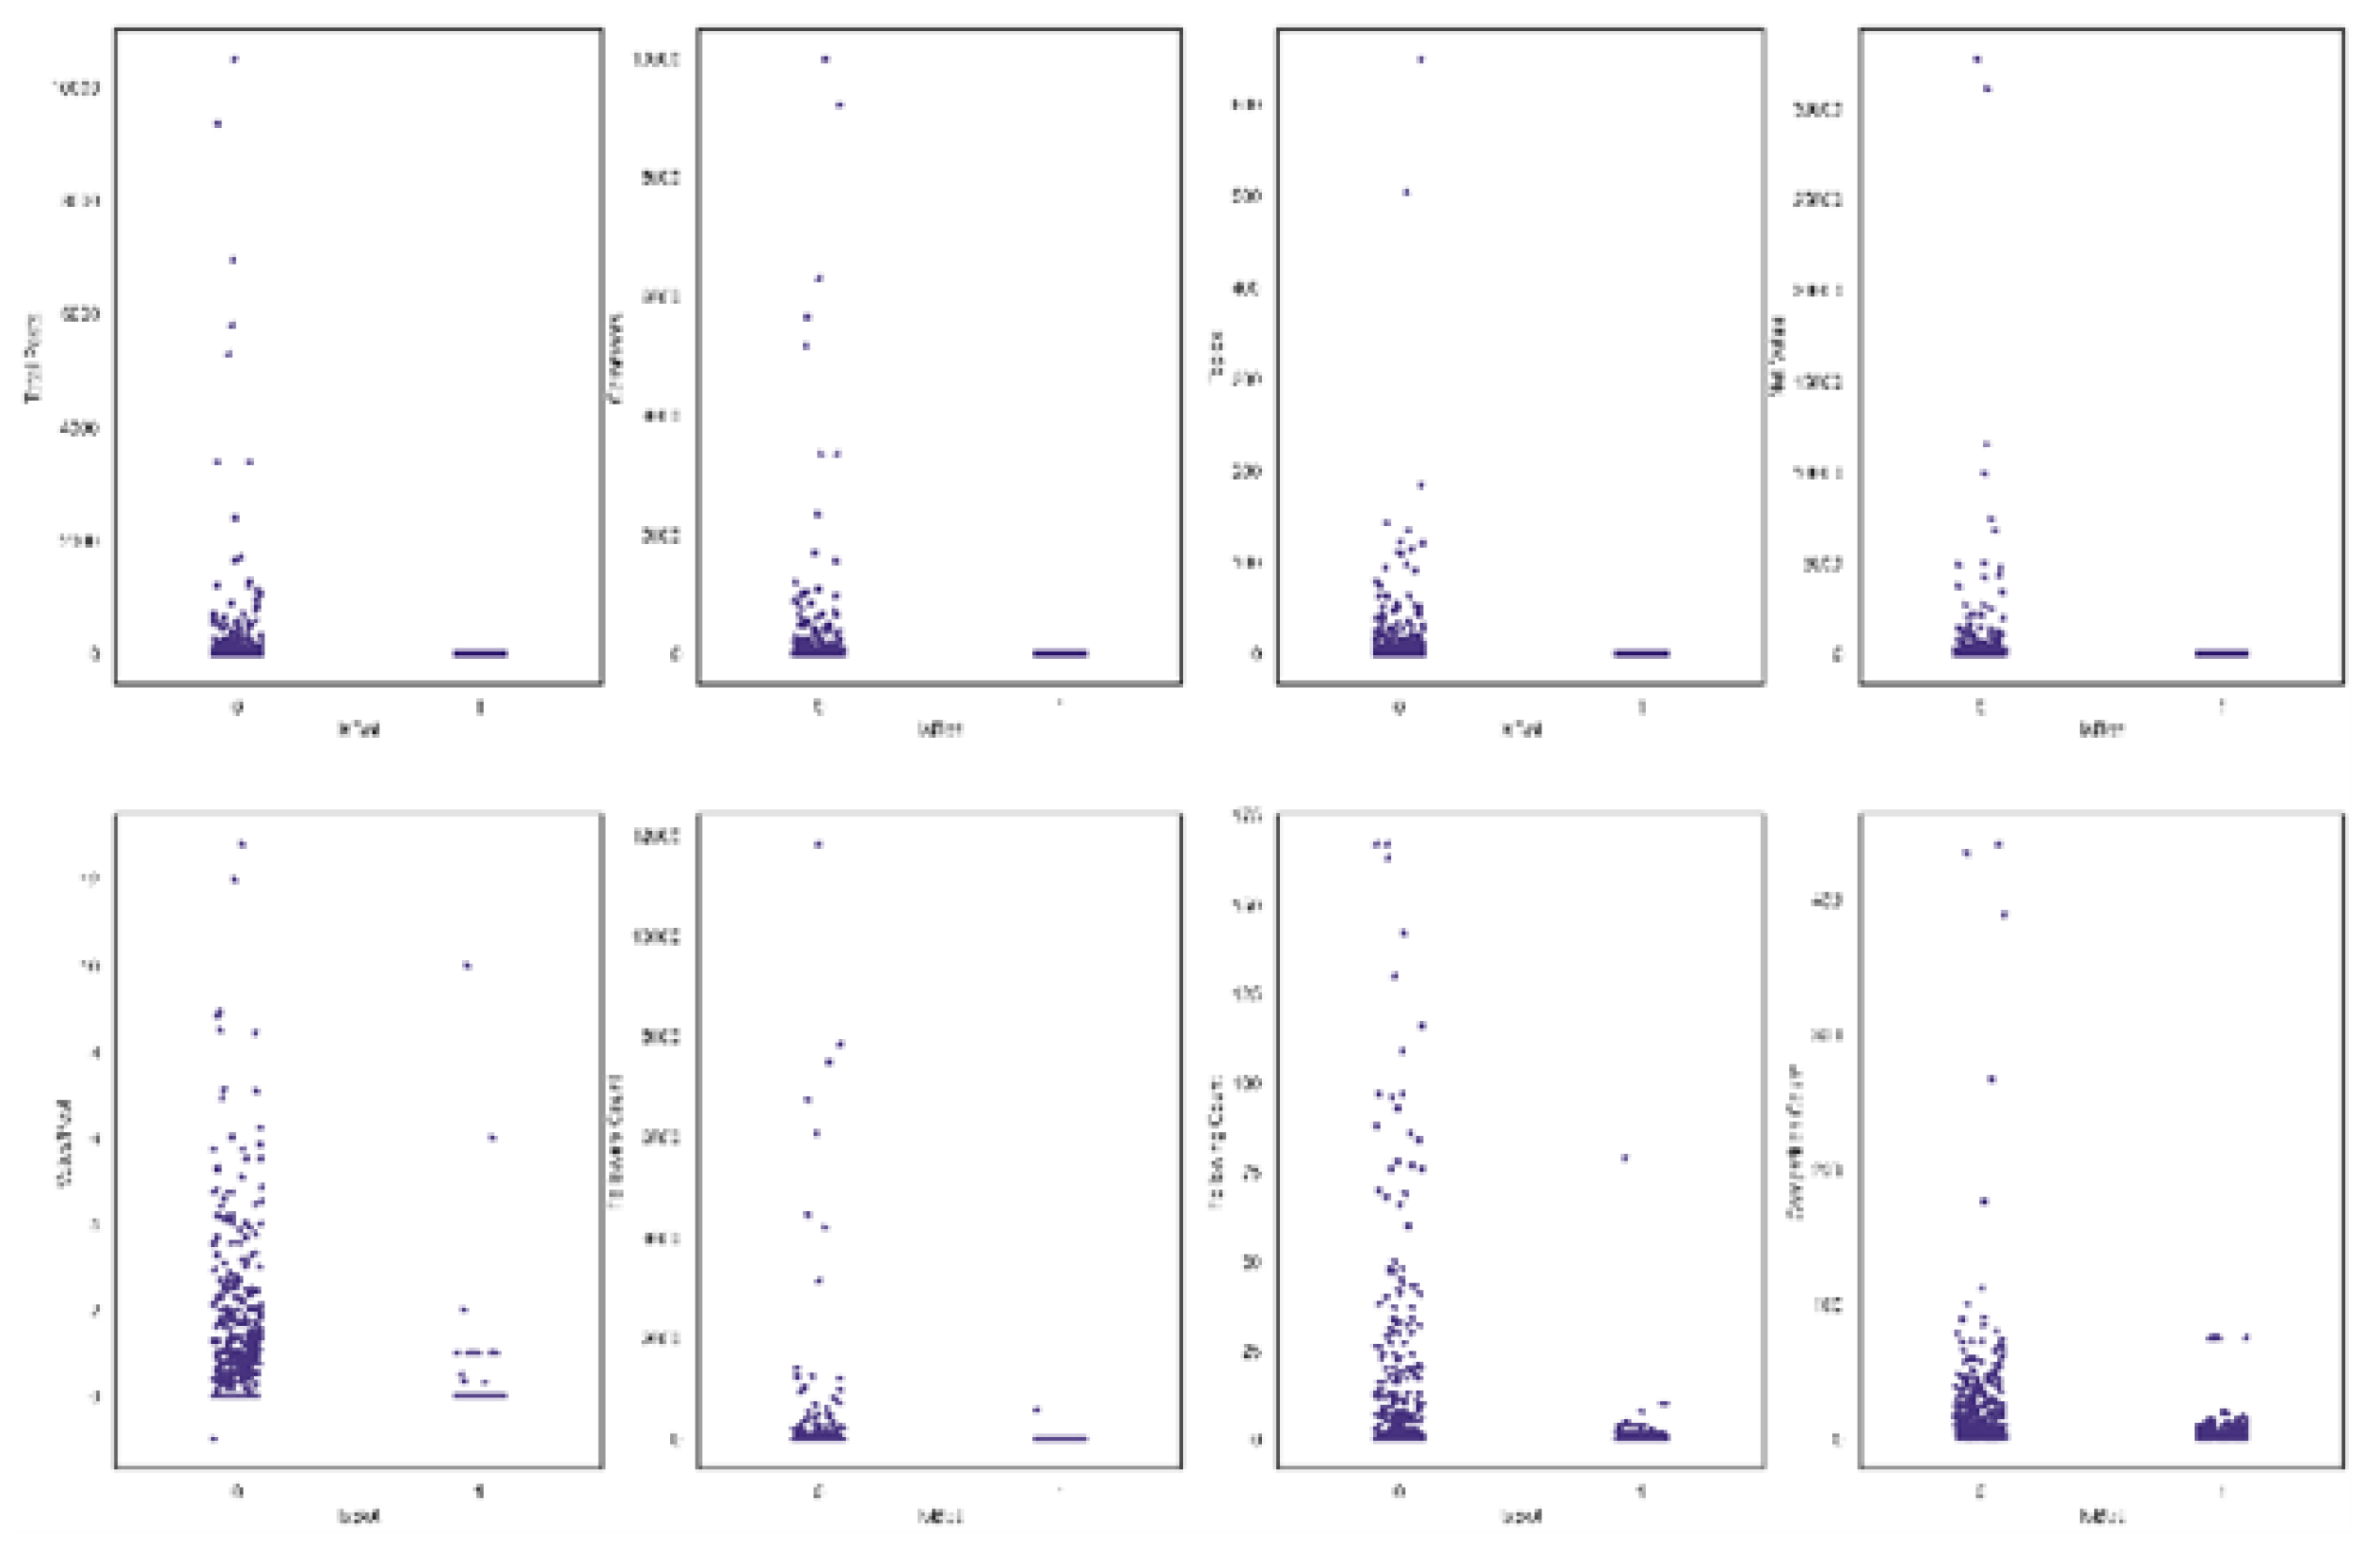
Figure 2. This figure indicates that there is a balance in the distribution of the dataset. Nine features of these accounts were compiled in the dataset in a structured format (.csv file). These features are shown in Table 2 along with their categories. Strip plots of the numerical features for each account type are displayed in
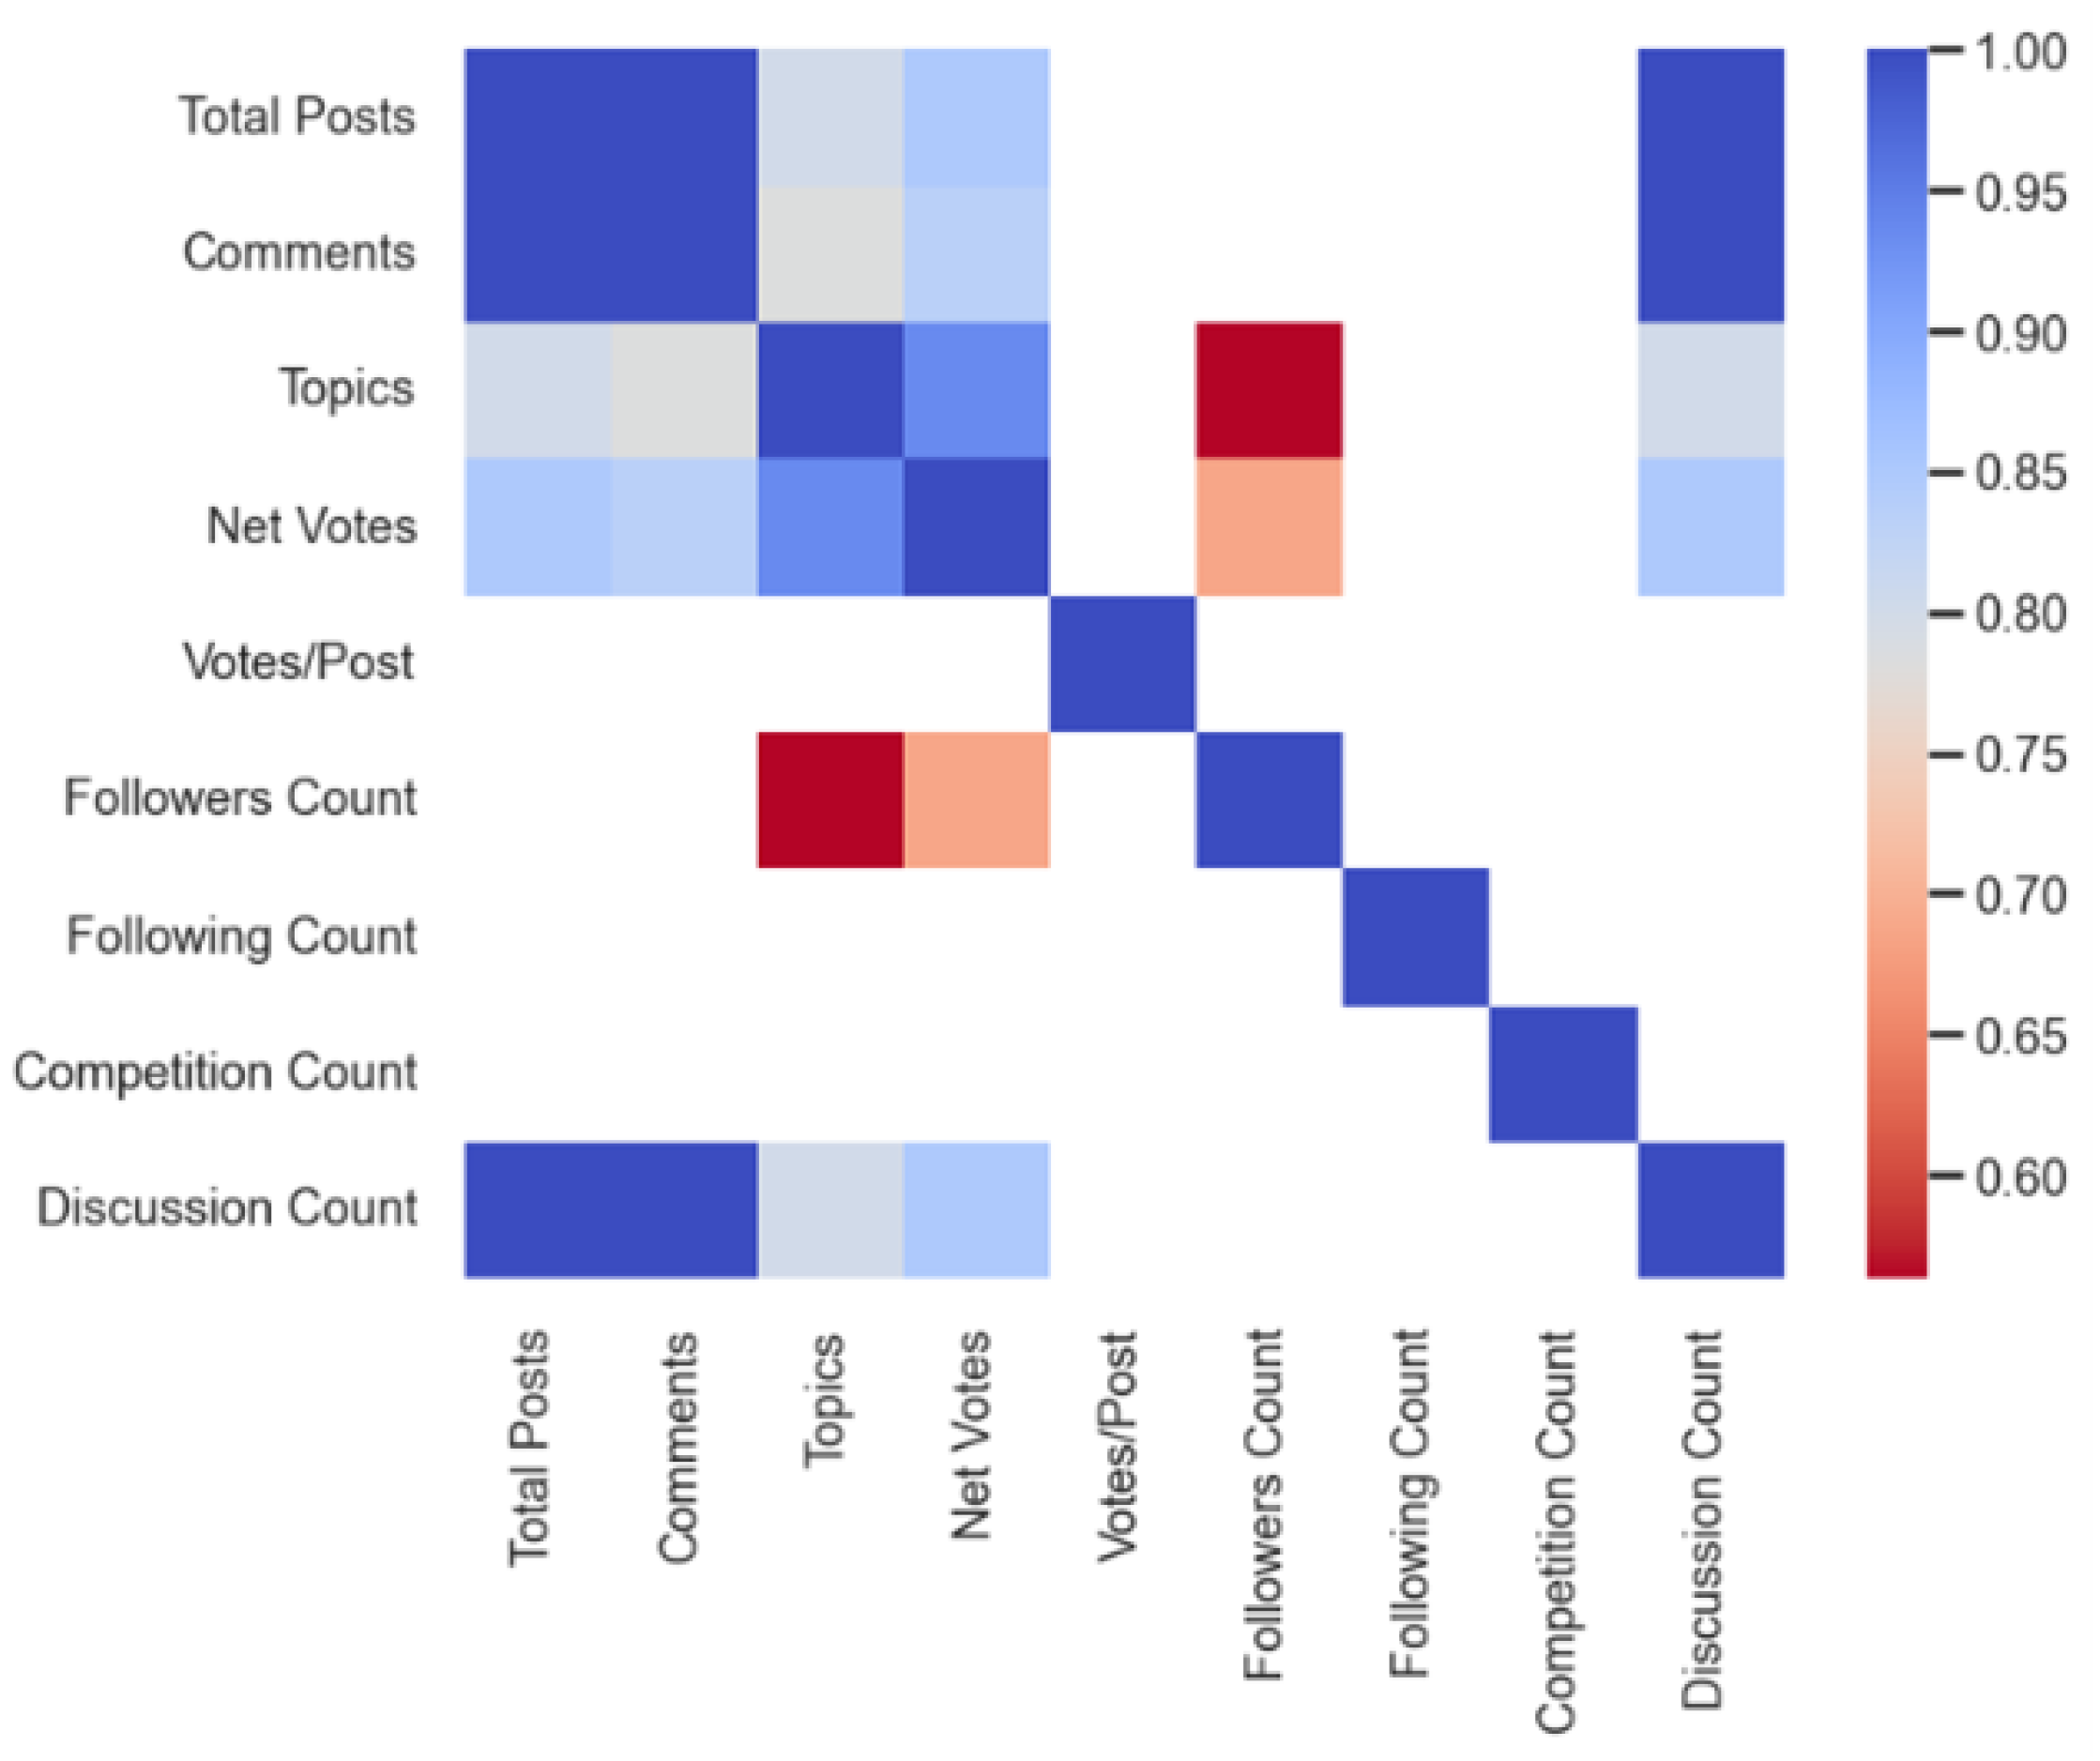
Figure 3. The graph suggests that compared to real accounts, bot accounts have a lower following count, follower count, net vote, discussion count, votes/post, total post, topic count, competition count and comment count. Also, the votes/post and competition count are high for automated accounts. The correlation coefficients between features are displayed in
Figure 4 above. It can be noticed from the diagram that there is a low positive correlation of about 0.16 between following and follower count. This phenomenon validates no multicollinearity between such features. Similar relationships also exist between features such as Net votes and competition count, discussion count and votes/post. Moreover, features with high positive correlation denoted in blue where excluded to eliminate redundancy while preserving important information to be passed to the algorithms.
Table 2.
Feature types and their corresponding data types.
Table 2.
Feature types and their corresponding data types.
| Features |
Type |
| Total Posts |
Numerical |
| Comment Count |
Numerical |
| Topics |
Numerical |
| Net Votes |
Numerical |
| Votes/Post |
Numerical |
| Followers Count |
Numerical |
| Competition Count |
Numerical |
| Discussion Count |
Numerical |
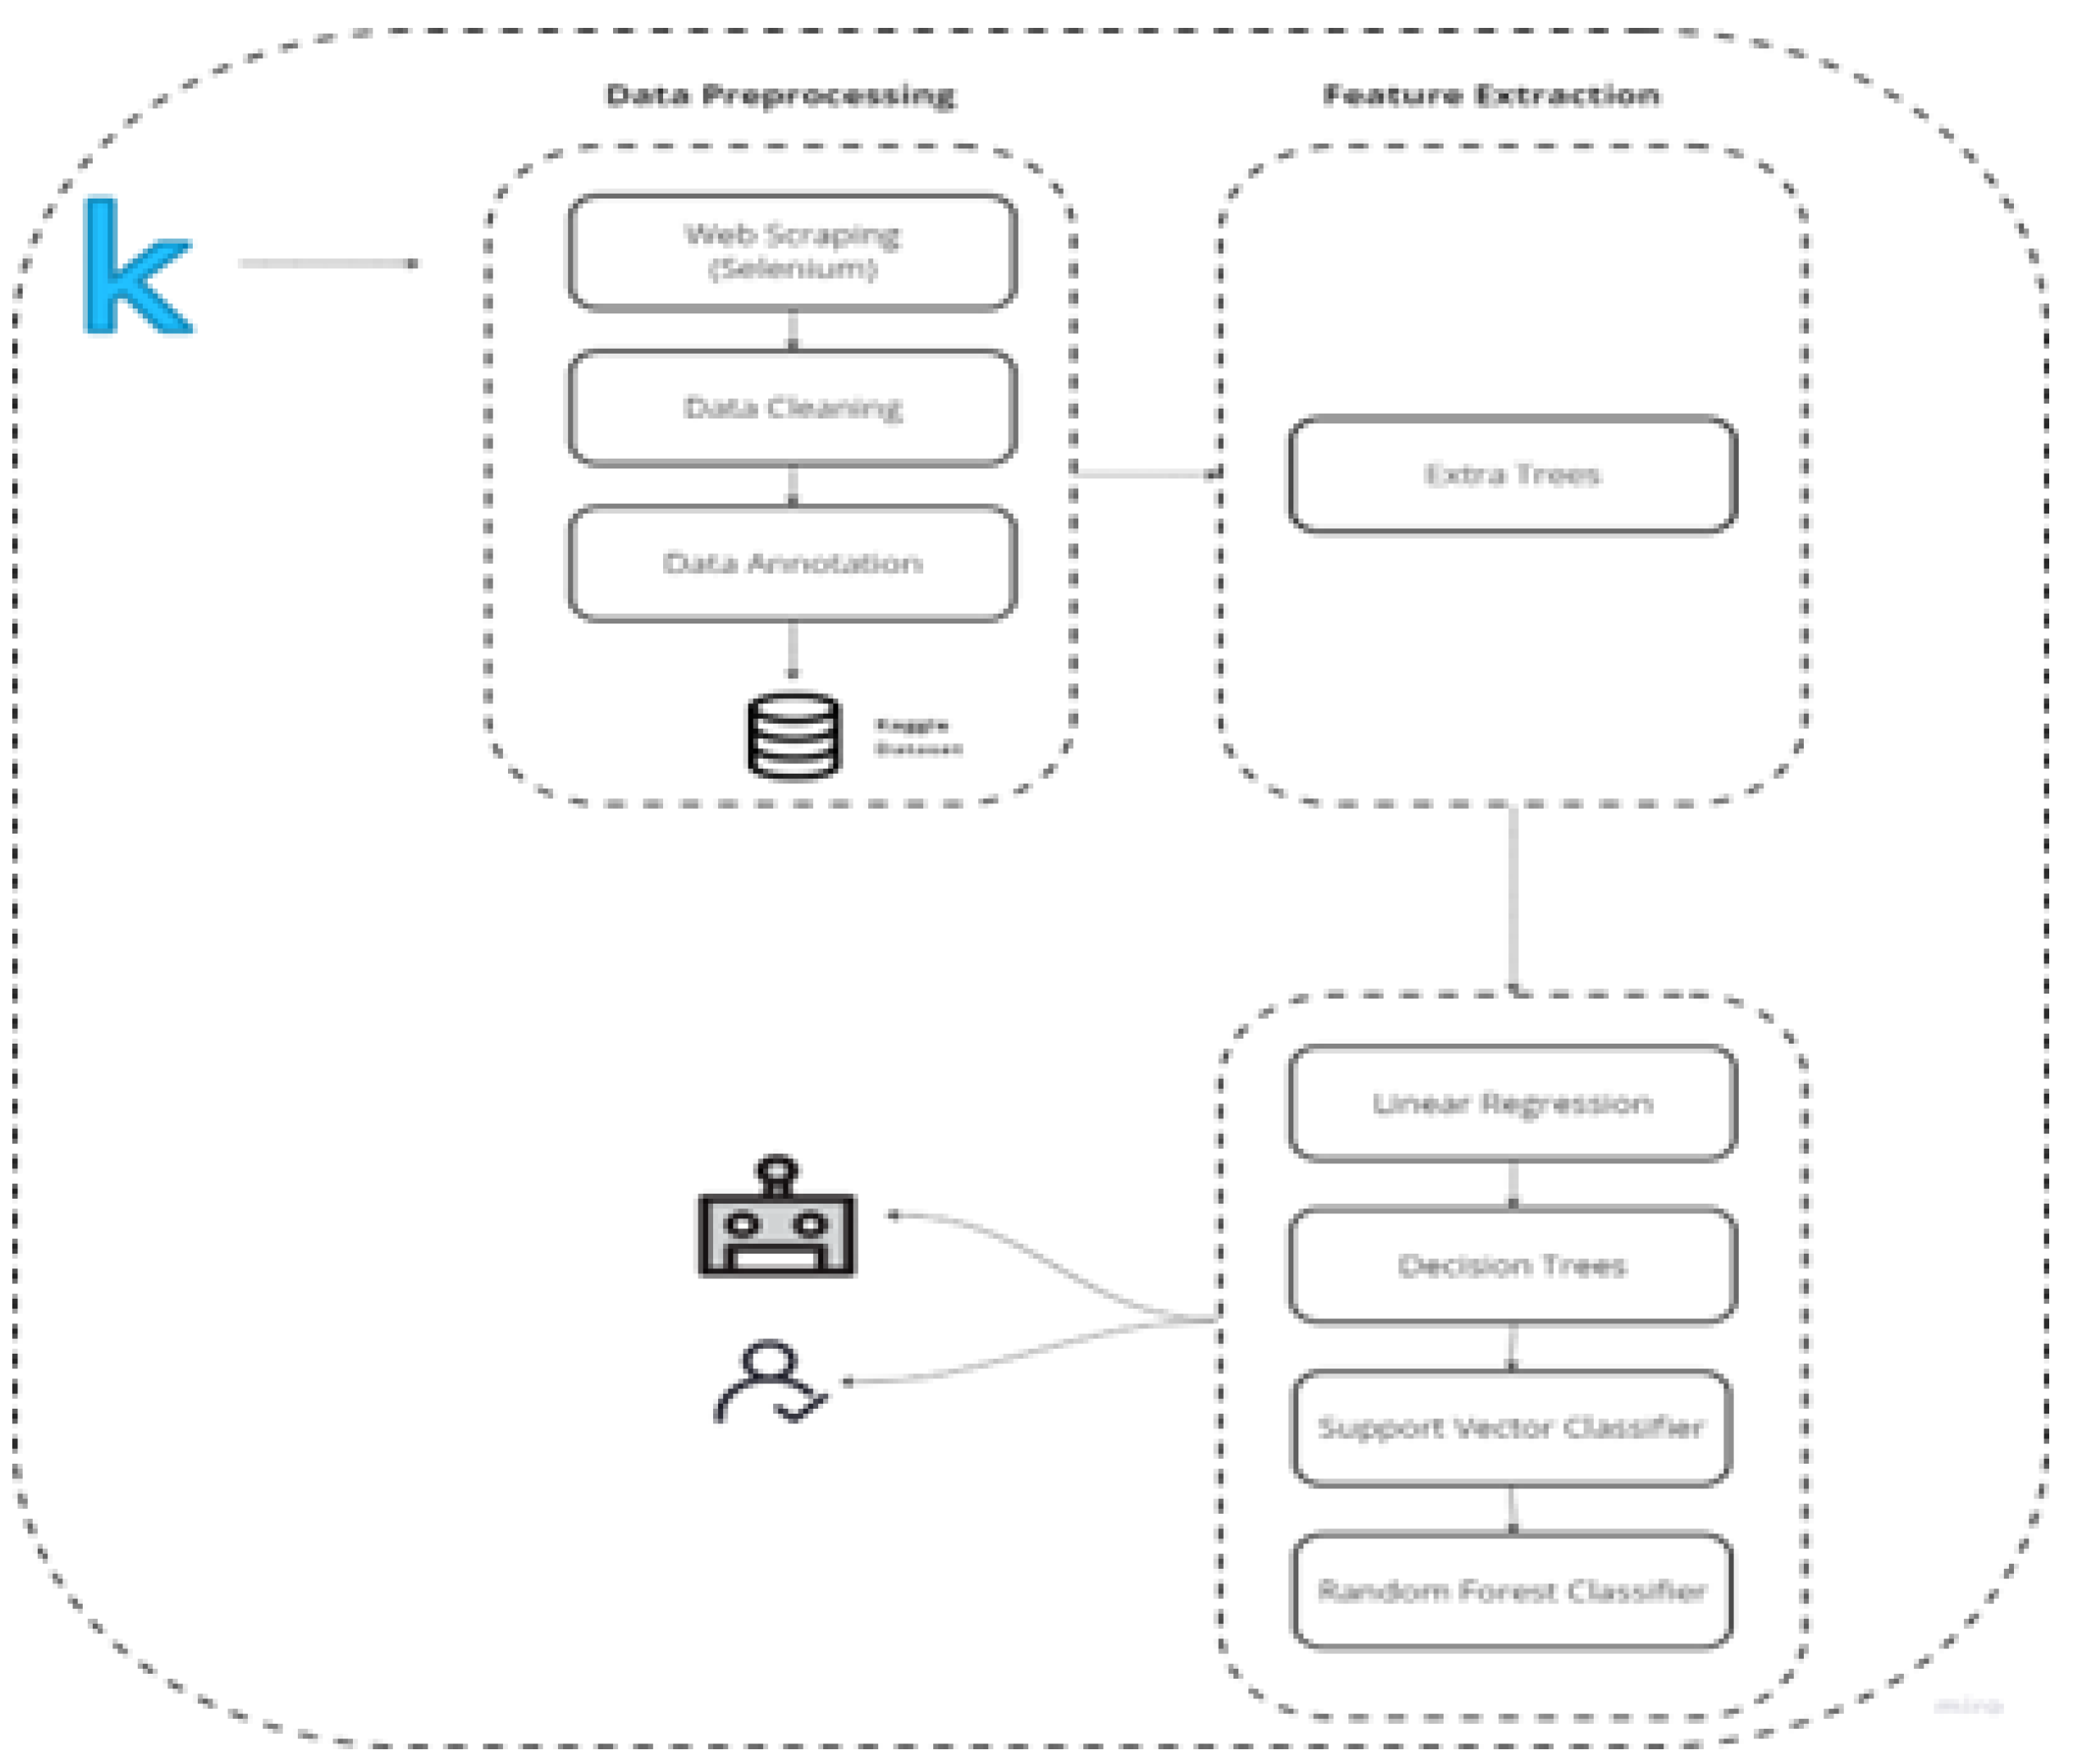
Figure 1.
Model architecture for kaggle bot detection.
Figure 1.
Model architecture for kaggle bot detection.
Figure 2.
The dataset distribution on account type.
Figure 2.
The dataset distribution on account type.
Figure 3.
strip plots of Numerical features.
Figure 3.
strip plots of Numerical features.
Figure 4.
Correlation heatmap between features.
Figure 4.
Correlation heatmap between features.
3.2. Data Preprocssing
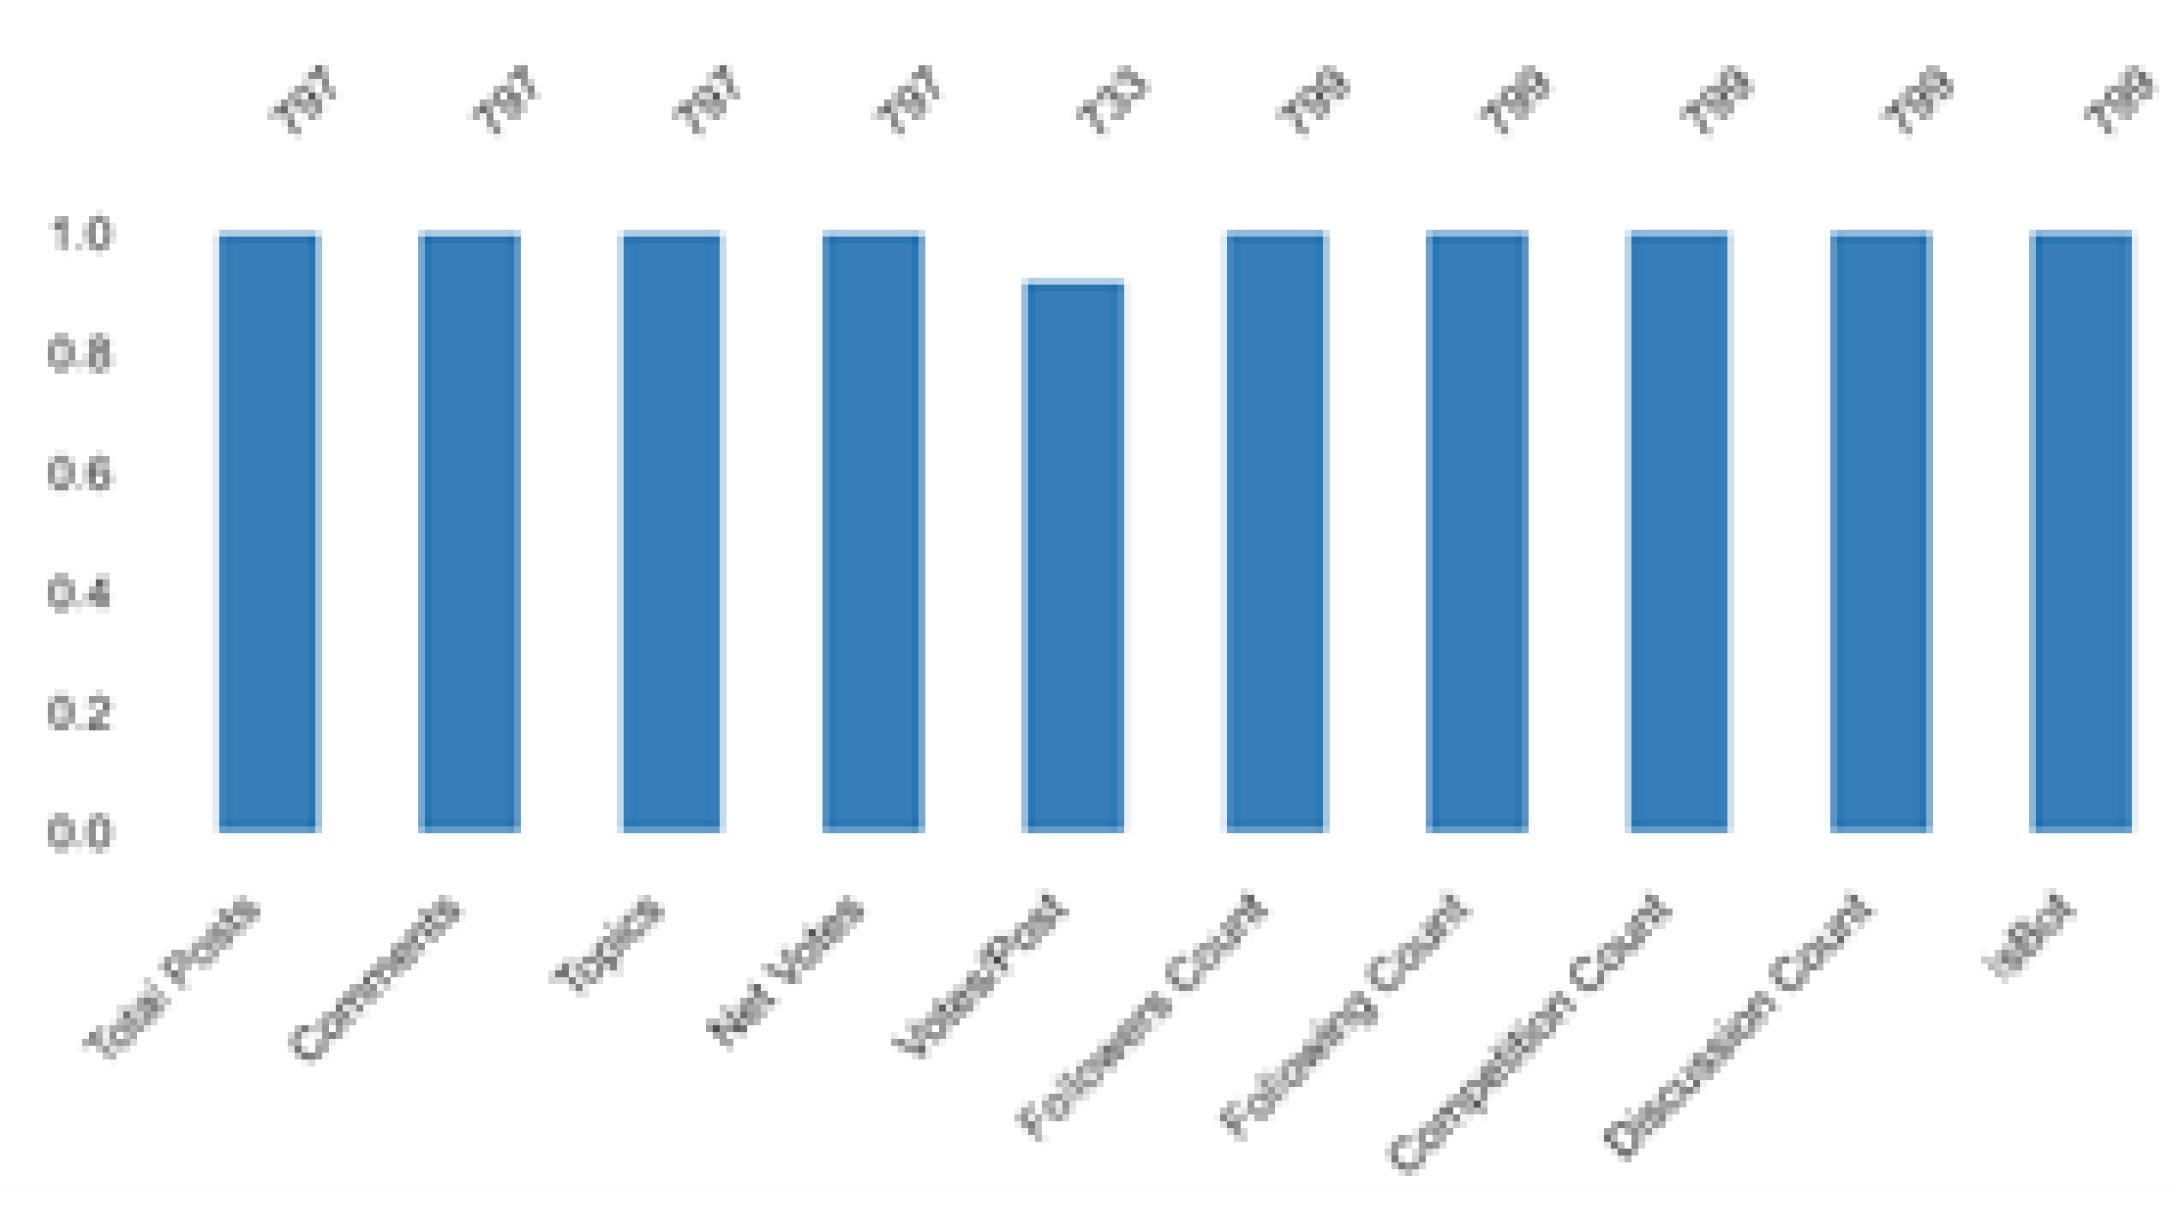
In every task involving data analysis or machine learning, preparing the data is essential. It entails preparing the raw data for analysis and for use in the construction of prediction models by cleaning, converting, and organizing it. Missing values are one of the most prevalent problems in real-world datasets, and they can happen for a number of different causes, including measurement errors, data manipulation, or inadequate data collection. The dataset’s missing data for each feature is shown in
Figure 5. Before proceeding with the training and prediction phases, it is important to handle the issue of missing data as machine learning algorithms are incapable of being trained on datasets that contain missing values. Using suitable values in place of the missing data or eliminating the missing data-containing samples from data collection are the two main methods used to address this problem. Rows with missing values were removed for handling missing data. In order to prevent overrepresentation of some patterns and under-representation of others leading to inaccurate predictions, duplicate rows in the dataset were also removed after dealing with missing values. The features present in the dataset had different range of values, therefore normaliza- tion technique was applied to ensure the features ranged between equal values (0-1) using the formula given in Equation 1.
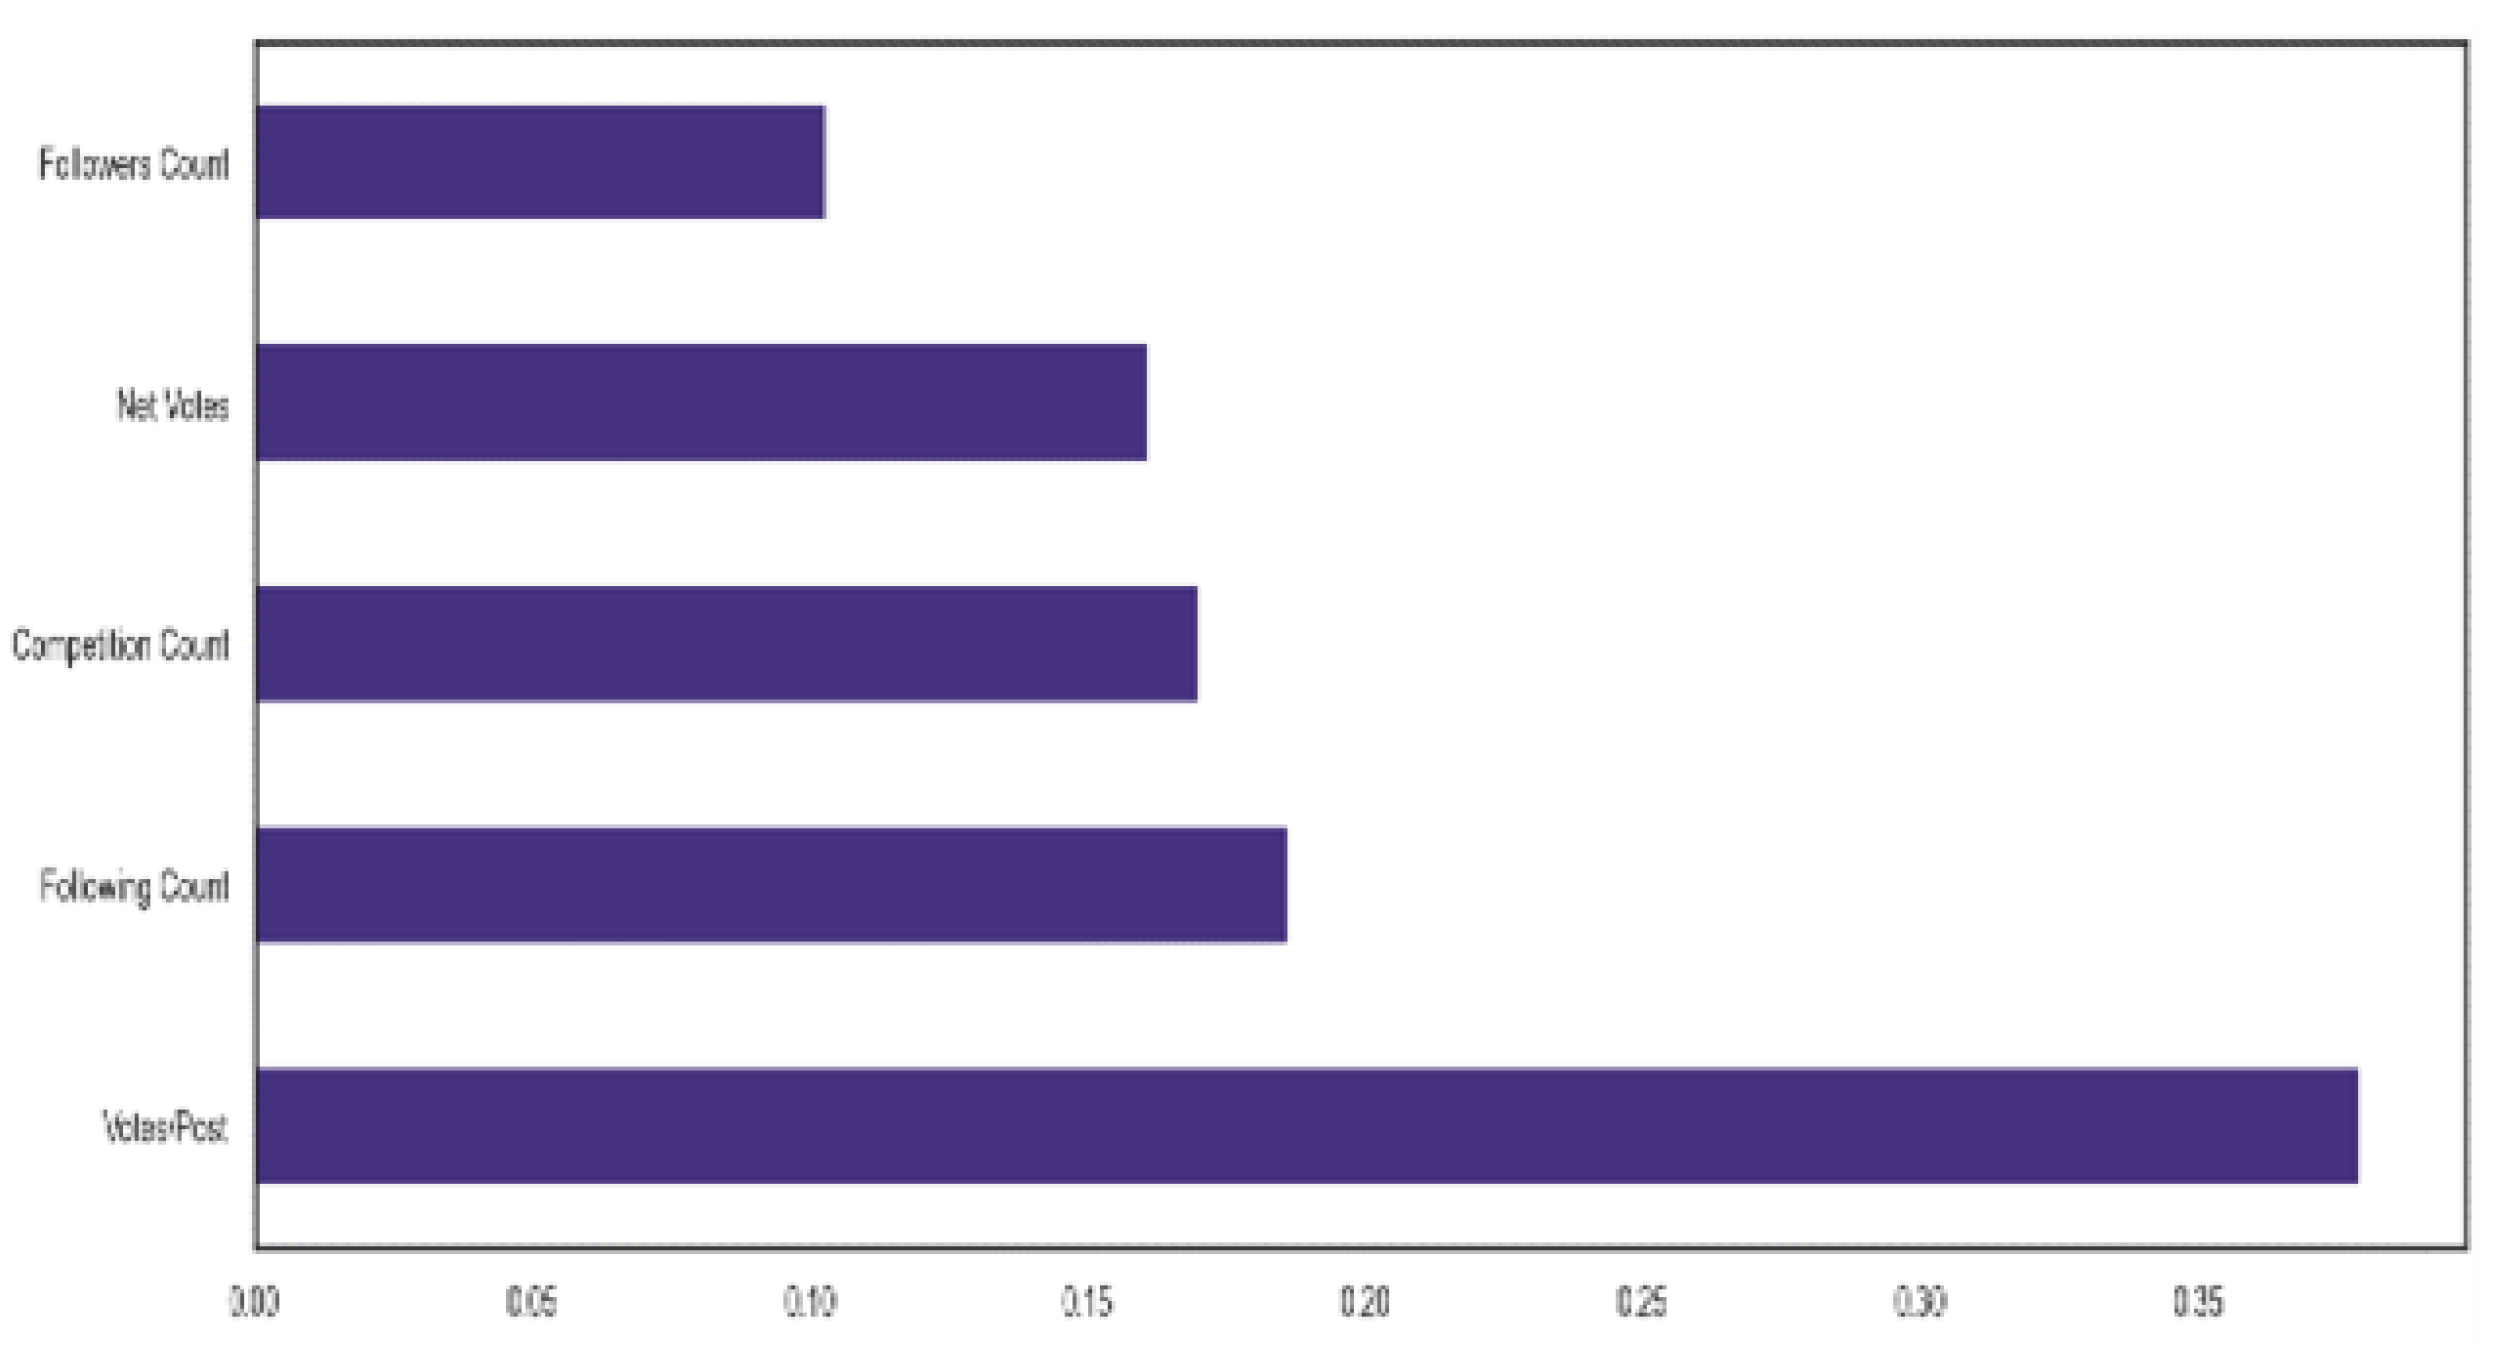
Finally, important features used for model training were selected using the extra trees algorithm. The feature importance measure in ExtraTrees is calculated based on the average impurity decrease caused by each feature across all decision trees in the ensemble. The impurity decrease is a measure of how much a feature contributes to the overall homogeneity of the nodes in the decision tree. The higher the impurity decrease caused by a feature, the more important it is considered to be.
3.3. Classifiers
Machine learning classifiers are algorithms that discover trends and relationships in data and then classify or categorize it accordingly. These classifiers serve as the foundation for a wide range of machine learning applications, including sentiment analysis, fraud detection, speech and picture recognition, sentiment analysis, and recommendation systems. In this study, five classifiers were used for detection of automated accounts on Kaggle: Support Vector Machines (SVM), Logistic Regression (LR), random forest (RF) and Decision Tree (DT).
Figure 6.
A bar plot showing important features in the dataset.
Figure 6.
A bar plot showing important features in the dataset.
Logistic regression is a binary classification problem-solving supervised learning algorithm. It is a type of regression analysis that calculates the likelihood of an input belonging to a specific class (e.g., 0 or 1) based on the values of its features. The logistic regression model assumes that the relationship between the features and the output variable (the class) can be represented by a linear function. The logistic function, also known as the sigmoid function, converts the outcome of the linear function into a number between 0 and 1, representing the probability that the input belongs to the positive class. The Logistic Regression is defined as
where z is the linear function of the input features:
The logistic regression model learns the coefficients (b0, b1, b2..., bn) that minimize the difference between the projected probability and the actual class labels in the training data. Maximum likelihood estimation is the process of determining the values of the coefficients that maximize the likelihood of the observed data given the model by calculating the value of the sigmoid function for the matching linear function, the model can be used to estimate the likelihood that a new input will fall into the positive class once it has been trained. The input is identified as belonging to the positive class if the probability is greater than a threshold, which is typically 0.5; otherwise, it is labeled as belonging to the negative class. Support Vector Machines is a type of supervised learning technique that can be applied to both classification and regression applications. SVMs are particularly useful for classification problems with two classes but can also be extended to multi-class problems. The fundamental concept of SVMs involves identifying a hyperplane in the feature space that effectively separates the two classes. The goal is to choose the hyperplane that maximizes the margin, or the distance between the hyperplane and the nearest data points for each class. Support vectors are the data points that are closest to the hyperplane, and they define the location and direction of the hyperplane. In SVMs, the input data is converted into a feature space with many dimensions through the use of a kernel function. SVMs are more efficient than linear models like logistic regression because the kernel function enables them to capture non-linear correlations between the features and the target variable.
subject to
The Naive Bayes algorithm is a type of machine learning that relies on probability for classification tasks. It is rooted in Bayes’ theorem, which states that the likelihood of a hypothesis or target class given observed evidence or input features is proportional to the probability of the evidence given the hypothesis multiplied by the hypothesis’s prior probability. Naive Bayes operates under the assumption that the input features are independent to each other given the target variable. Because it simplifies the model and increases its computational effectiveness, this assumption is referred to as the ”naive” assumption. Naive Bayes is frequently employed in applications for spam filtering and natural language processing because, despite its ease of use, it frequently produces good classification performance. The goal is to estimate the probability of the target class given the observed features, which can be written as
where P(y) is the prior probability of the target variable, P(x1, x2, ..., xn — y) is the likelihood of the observed features given the target class, and P(x1, x2, ..., xn) is the marginal probability of the observed features. Naive Bayes considers that the input features are conditionally independent given the target class, so we can write:
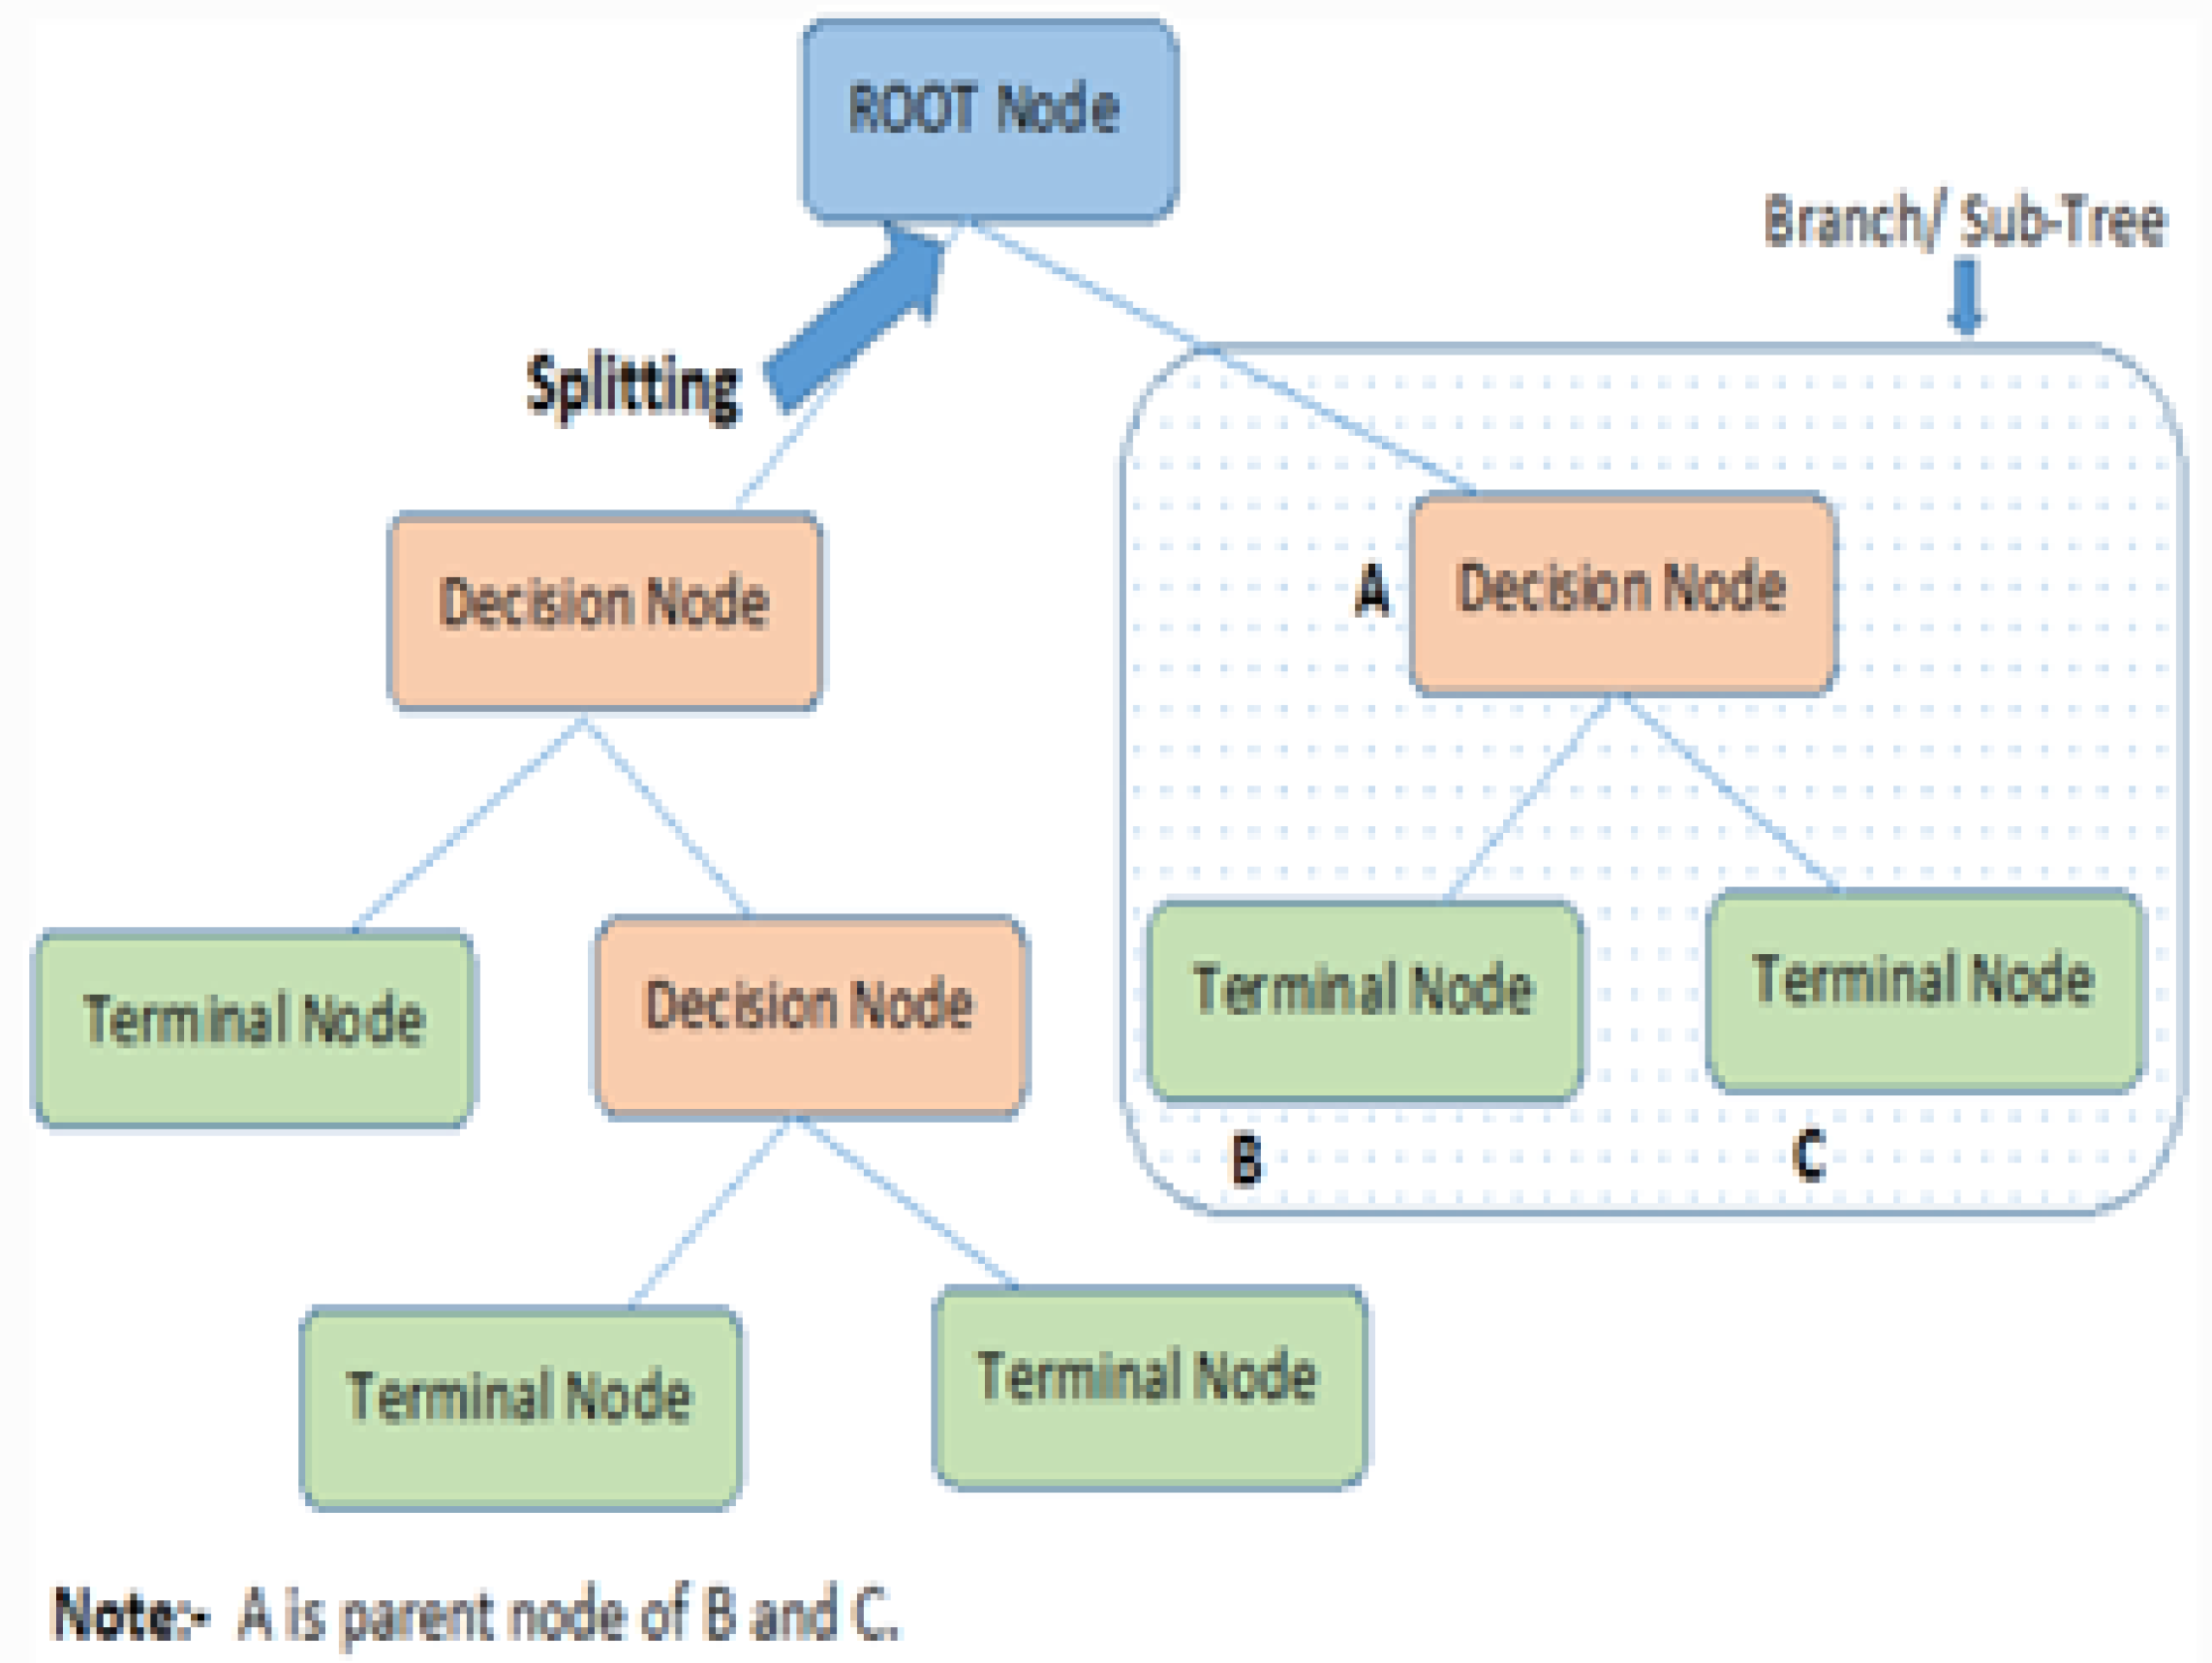
This allows us to estimate the likelihood of the observed features as the product of the individual conditional probabilities of each feature given the target class. The decision tree algorithm is commonly employed in the field of machine learning to address classification and regression problems. It takes on a tree-shaped structure, where every node signifies a decision or a test based on a feature, each branch represents the result of the decision, and every leaf node stands for a class label or a target value. The decision tree algorithm splits the data recursively into subsets depending on the most informative features, choosing the optimal feature to split on at each node based on a measure of impurity (such as entropy or Gini index). The objective is to design a tree where the impurity of the leaves is minimized, which means that each leaf should primarily contain samples from one class or have a low variation for the target variable.
Figure 7.
Decision Tree Algorithm.
Figure 7.
Decision Tree Algorithm.
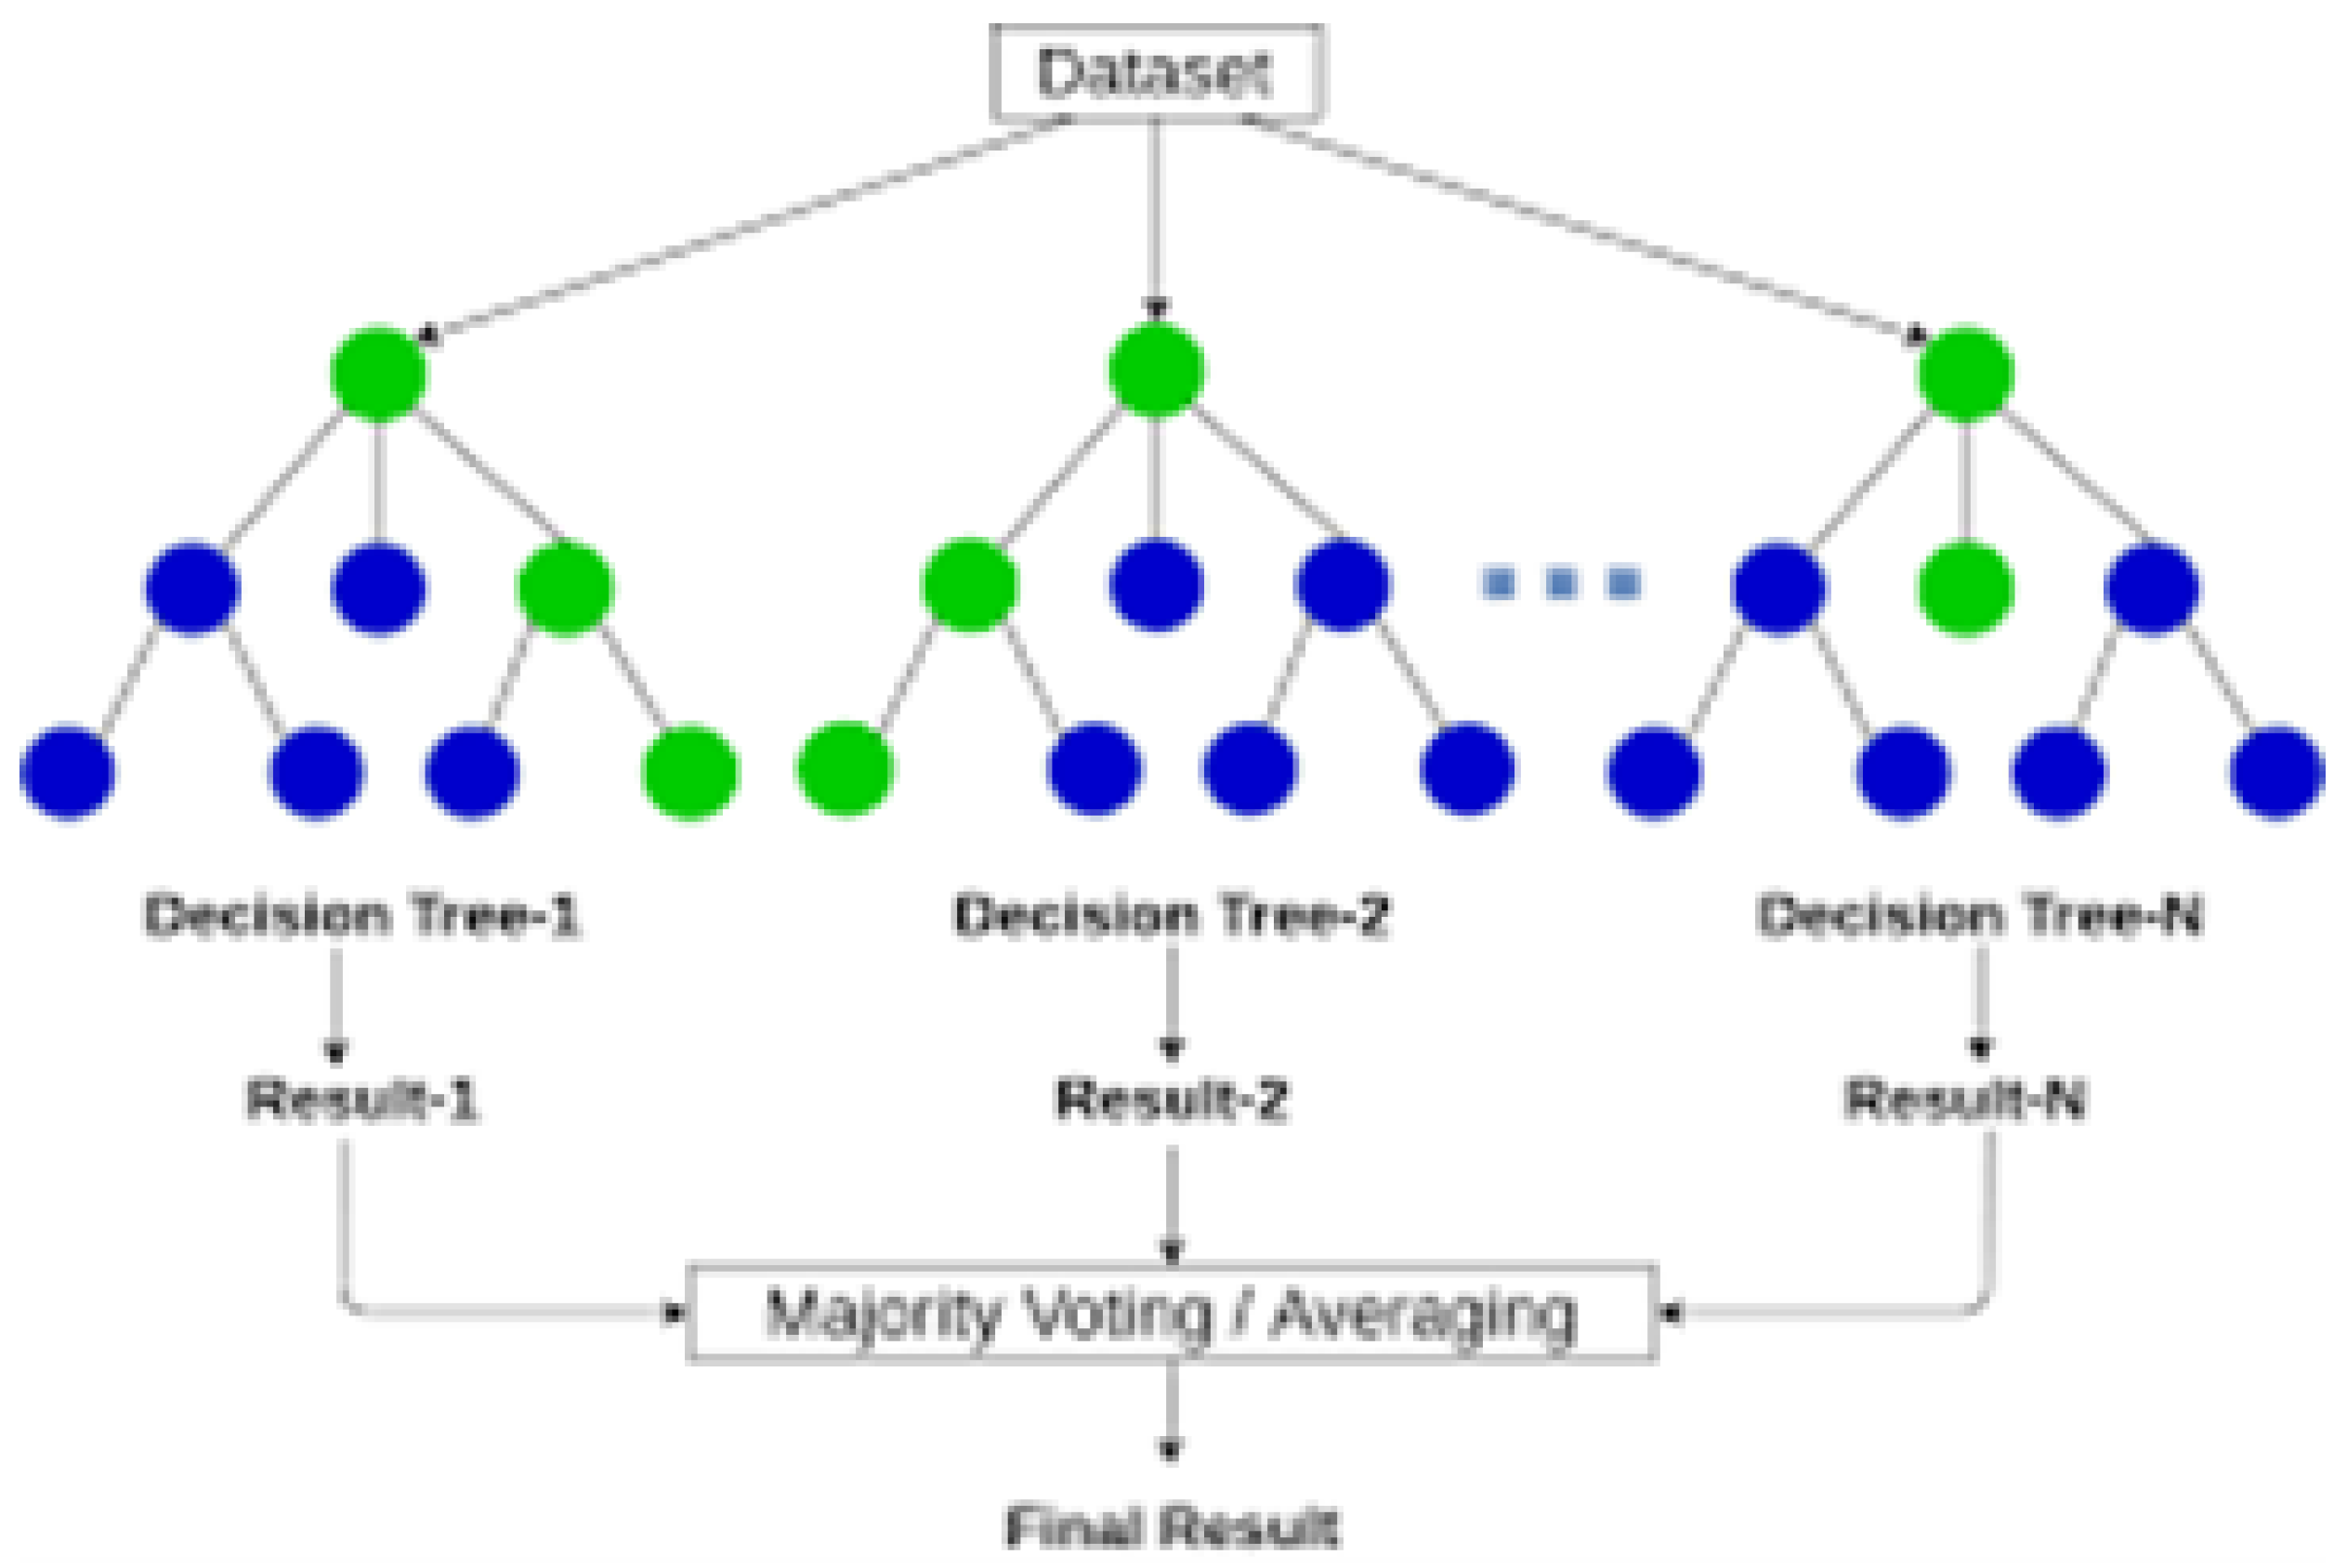
Random Forest is commonly utilized for solving supervised learning problems. It is suitable for both classification and regression tasks and can effectively manage high-dimensional datasets with intricate feature interactions. To create a final prediction, random forest builds several decision trees and then combines their results. A random subset of the training data and a random subset of the input features are used to train each decision tree in the forest. This randomization procedure aids in reducing overfitting and enhancing the model’s generalization capabilities
Figure 8.
Random Forest Algorithm.
Figure 8.
Random Forest Algorithm.
Metrics like accuracy, F1-score, recall, and precision were used to assess how well the classifiers predicted the results. To assess how successfully the classifiers generalized, these metrics were computed using a 3-fold cross-validation method.
4. Results
Metrics like accuracy, F1-score, recall, and precision were used to assess how well the classifiers predicted the results. To assess how successfully the classifiers generalized, these metrics were computed using a 3-fold cross-validation method.
Table 2 presents the Accuracy, F-score, Precision, and Recall metrics to indicate the performance of classifiers in predicting bot and real accounts.
Table 3.
Classifier evaluation metrics as a result of 3-fold cross-validation
Table 3.
Classifier evaluation metrics as a result of 3-fold cross-validation
| Classifier |
Accuracy |
F1-Score % |
| LR |
81 |
79 |
| DT |
88 |
88 |
| SVC |
84 |
83 |
| RF |
91 |
90 |
| Classifier |
Precision |
Recall % |
| LR |
387 |
92.4 |
| DT |
500 |
96.7 |
| SVC |
587 |
92.3 |
| RF |
1698 |
95 |
The performance metrics of different machine learning models—Logistic Regression (LR), Decision Tree (DT), Support Vector Classifier (SVC), and Random Forest (RF) —were evaluated based on accuracy, F1-score, precision, and recall. Starting with Logistic Regression (LR), it achieved an accuracy of 81precision of 86%, and recall of 79%. LR is known for its simplicity and interpretability, making it a popular choice for binary classification tasks. The precision of 86% indicates that when LR predicts a positive outcome, it is correct 86% of the time, while the recall of 79% suggests that LR captures 79% of actual positive instances. Moving on to Decision Tree (DT), it demonstrated superior performance across the board with an accuracy of 88%, F1-score of 88%, precision of 88%, and recall of 88%. Decision Trees are adept at capturing complex relationships in data and are less prone to overfitting on training data compared to some other models. The balanced performance across metrics indicates robustness in classification across different classes. The Support Vector Classifier (SVC) achieved an accuracy of 84%, an F1-score of 83%, precision of 88%, and recall of 83%. SVCs are powerful for handling high-dimensional data and finding optimal hyperplanes for classification. The precision and recall scores show that while it maintains a good balance, there may be some room for improvement, especially in recall, which is slightly lower. Finally, Random Forest (RF) emerged as the top performer among the models evaluated, boasting an accuracy of 91%, F1-score of 90%, precision of 91%, and recall of 90%. RF is an ensemble learning method that combines multiple decision trees to improve performance and reduce overfitting. Its high scores across all metrics indicate strong predictive capability and generalization to unseen data. In summary, each model showcased distinct strengths based on the metrics evaluated. Decision Trees and Random Forests excelled in overall performance, while Logistic Regression and Support Vector Classifier also provided competitive results, albeit with slight variations in precision and recall. The choice of model would depend on specific project requirements such as interpretability, computational efficiency, and the importance of different performance metrics. For example, if the primary concern is identifying a high proportion of automated accounts with minimal false positives, Random Forests might be preferred due to their robustness and ability to handle complex feature interactions. Conversely, if interpretability is paramount, Logistic Regression would be favored for its transparent modeling approach, facilitating easier insight into the factors influencing account classification. These considerations underscore the importance of aligning model selection with the unique demands of the task at hand, such as distinguishing between automated and genuine accounts on platforms like Kaggle.
5. Discussion and Conclusions
The aim of this study was to undertake a comparative analysis of supervised machine learning algorithms for distinguishing between automated and real accounts on Kaggle. For this aim, nine features of 400 automated and 399 real accounts were collected from Kaggle. The study’s key contribution was the presentation of a machine learning model that could detect automated accounts on Kaggle. Various preprocessing techniques were utilized to prepare the Kaggle dataset, and multiple machine learning classification algorithms were employed to construct prediction models, the results of which were documented. The findings indicate that while all classifiers performed well, the random forest classifier notably achieved the best evaluation metric. Further enhancement to this research could involve incorporating image processing techniques to categorize the profile pictures of Kaggle user accounts and integrating the resulting classifications as additional features into the datasets.
Figure 9.
A simple visualization of nullity for each feature.
Figure 9.
A simple visualization of nullity for each feature.
Author Contributions
All authors contributed equally to all aspects of the work, including conceptualization, methodology, software, validation, formal analysis, investigation, resources, data curation, writing the original draft, review and editing, visualization, supervision, project administration, and funding acquisition. All authors have read and agreed to the published version of the manuscript.
Funding
This research received no external funding.
Data Availability Statement
The data used in this study come from the following sources:
Conflicts of Interest
The authors declare no conflicts of interest.
Abbreviations
The following abbreviations are used in this manuscript:
| DT |
Decision Trees |
| LR |
Linear Regression |
| SVC |
Support Vector Classifier |
| RF |
Random Forest |
References
- Tunç, Ü.; Atalar, E.; Gargi, M.; Aydin, Z. E. Classification of Fake, Bot, and Real Accounts on Instagram Using Machine Learning. Journal of Polytechnic 2022, 24, 1–7. [Google Scholar]
- Yang, K.-C.; Varol, O.; Hui, P. M.; Menczer, F. Scalable and Generalizable Social Bot Detection through Data Selection. In Proceedings of the AAAI Conference on Artificial Intelligence; AAAI Press: Palo Alto, CA, USA, 2020; Volume 34, pp. 1096–1103. [Google Scholar] [CrossRef]
- Purba, K.; Asirvatham, D.; Murugesan, R. K. Classification of Instagram Fake Users Using Supervised Machine Learning Algorithms. International Journal of Electrical and Computer Engineering (IJECE) 2020, 10, 2763–2772. [Google Scholar] [CrossRef]
- Walt, E.; Eloff, J. Using Machine Learning to Detect Fake Identities: Bots vs Humans. IEEE Access 2018, 6, 1–1. [Google Scholar] [CrossRef]
- Akyon, F. C.; Kalfaoglu, E. Instagram Fake and Automated Account Detection. Proceedings of the ASYU Conference, Istanbul, Turkey, October 2019; pp. 1–7. [CrossRef]
- Ferrara, E.; Varol, O.; Davis, C.; Menczer, F.; Flammini, A. The Rise of Social Bots. Commun. ACM 2016, 59, 96–104. [Google Scholar] [CrossRef]
- Stella, M.; Ferrara, E.; De Domenico, M. Bots Increase Exposure to Negative and Inflammatory Content in Online Social Systems. Proceedings of the National Academy of Sciences 2018, 115, 201803470. [Google Scholar] [CrossRef] [PubMed]
- Kudugunta, S.; Ferrara, E. Deep Neural Networks for Bot Detection. Information Sciences 2018, 467, 312–322. [Google Scholar] [CrossRef]
- Beskow, M.; Carley, K. M. It’s All in a Name: Detecting and Labeling Bots by Their Name. Computational and Mathematical Organization Theory 2018, 25, 24–35. [Google Scholar] [CrossRef]
- Chavoshi, N.; Hamooni, H.; Mueen, A. DeBot: Twitter Bot Detection via Warped Correlation. In Proceedings of the IEEE International Conference on Data Mining (ICDM); IEEE: December 2016; pp. 1–8. [CrossRef]
- Cresci, S.; Di Pietro, R.; Petrocchi, M.; Spognardi, A.; Tesconi, M. Social Fingerprinting: Detection of Spambot Groups Through DNA-Inspired Behavioral Modeling. IEEE Transactions on Dependable and Secure Computing 2018, 15, 561–576. [Google Scholar] [CrossRef]
- Chen, Z.; Subramanian, D. An Unsupervised Approach to Detect Spam Campaigns that Use Botnets on Twitter. IEEE Transactions on Social Computing 2018, 12, 1–8. [Google Scholar]
- Jiang, M.; Cui, P.; Beutel, A.; Faloutsos, C.; Yang, S. Catching Synchronized Behaviors in Large Networks: A Graph Mining Approach. ACM Transactions on Knowledge Discovery from Data 2016, 10, 1–27. [Google Scholar] [CrossRef]
- Anklesaria, K.; Desai, Z.; Kulkarni, V.; Balasubramaniam, H. A Survey on Machine Learning Algorithms for Detecting Fake Instagram Accounts. In Proceedings of the International Conference on Computing, Communication, and Networking (ICAC3N); IEEE: December 2021; pp. 141–144. [CrossRef]
- Dey, T.; Mousavi, S.; Ponce Mojica, E.; Fry, T.; Vasilescu, B.; Filippova, A.; Mockus, A. Detecting and Characterizing Bots that Commit Code. In Proceedings of the ACM/IEEE International Conference on Software Engineering (ICSE); IEEE: June 2020; pp. 209–219. [CrossRef]
- Freeman, D. Using Naive Bayes to Detect Spammy Names in Social Networks. In Proceedings of the ACM Conference on Computer and Communications Security; 2013; pp. 3–12. [Google Scholar] [CrossRef]
|
Disclaimer/Publisher’s Note: The statements, opinions and data contained in all publications are solely those of the individual author(s) and contributor(s) and not of MDPI and/or the editor(s). MDPI and/or the editor(s) disclaim responsibility for any injury to people or property resulting from any ideas, methods, instructions or products referred to in the content. |
© 2024 by the authors. Licensee MDPI, Basel, Switzerland. This article is an open access article distributed under the terms and conditions of the Creative Commons Attribution (CC BY) license (http://creativecommons.org/licenses/by/4.0/).