
Submitted:
11 December 2024
Posted:
11 December 2024
You are already at the latest version
Abstract
The car resale industry is broad and precise price forecast is essential for preventing customers from overpaying to resellers. Machine learning is currently the most effective forecasting tool, which is why three machine learning models—Random Forest, CatBoost Regressor, and Support Vector Machine (SVM)—were chosen to analyze car features such as model, mileage, and year, as well as additional attributes such as color, conditioner, and car body type extracted from car advertisement descriptions. The data for the prediction was collected from the website mashina.kg[1] using a web scraper implemented in the Python programming language. The performances of multiple models were then evaluated to determine which one best suited the available data set. As a result, the model CatBoost provides the most effective way for accurate car price predictions in Bishkek, with an accuracy of 86.05%, making it a helpful tool for both customers and financial institutions in making well-informed decisions regarding cars price.
Keywords:
Machine Learning
; CatBoost Regressor
; Random Forest
; Support Vector Machine (SVM)
; Price Forecasting
; Automotive Market
; Web Scraping
; Feature Engineering
; Categorical Variable Encoding
; Regression Models
; Bishkek Car Market
1. Introduction
Cars are nearly everywhere nowadays, and almost all families possess at least one. Such extensive car ownership, along with a number of customer motives, has resulted in the formation of a very dynamic car resale industry. Cars are nearly everywhere nowadays, and almost all families possess at least one. Such extensive car ownership, coupled with various customer motives, has led to the formation of a highly dynamic car resale industry. The used car resale industry in Bishkek, Kyrgyzstan, is part of a continuously evolving automotive scene. The car resale industry in Bishkek, Kyrgyzstan, is part of an ever-evolving automotive industry. According to the National Statistical Committee of the Kyrgyz Republic, by the end of 2023 there were about 1.1 million passenger cars in the country, which is 9.7% more than in 2021[Med24]. This growth is particularly noticeable in Bishkek, as well as in the Chui, Osh, and Jalal-Abad regions, indicating a stable and developing market where effective pricing strategies and value creation models can bring significant benefits to consumers. In light of these modifications, reliable, data-driven pricing estimates for passenger cars are even more important.
Accurate prediction of car prices requires specialist knowledge, as prices are typically determined by a variety of distinct features and car elements. Typically, the most important ones are brand and model, age, horsepower, and mileage. The gasoline type used in the car, as well as fuel consumption per mile, have a significant impact on the price of a car due to frequent fluctuations in fuel prices. Different elements like exterior color, door number, transmission type, size, safety, air condition, interior, and whether or not it has navigation will all influence the car’s pricing. In this paper, we explore several methodologies and techniques to improve the precision of used automobile price predictions.
2. Related Work
Predicting the price of used cars has been thoroughly investigated in numerous studies. Pre- vious studies used a variety of approaches to model car price prediction. Enis Gegic[Geg19] from International Burch University, Sarajevo, Bosnia and Herzegovina divided car costs into nominal categories based on ranges (e.g., 0-12,000 as "cheap," 12,000-24,000 as "moderate," and more than 24,000 as "expensive"). Three machine learning classifiers—Random Forest (RF), Artificial Neural Network (ANN), and Support Vector Machine (SVM)—were tested, with accuracies of 41.18%, 42.35%, and 48.23%, respectively, and errors of 8.04%, 7.05%, and 10.53%. These findings demonstrated that depending on a single machine learning classifier was insufficiently robust for accurate price prediction. As a result, the authors suggested an ensemble method for car price prediction, which increased the accuracy of their test data to 87.38%. Interestingly, while their approach required nominal price categories for optimal results, our study shows that a single CatBoost model can achieve a comparable accuracy of 86.05% without explicitly defining nominal price classes, implying that advanced boosting techniques can capture complex price patterns directly from raw numerical attributes.
Another study by Muhammad Asghar[Muh] employed Ordinary Least Squares (OLS) regression and reported an R2 score of 90% for their car price predictions. Their findings also noted a visible gap between low-priced and high-priced vehicles, indicating a non-uniform distribution of target values. This gap can influence model performance, as certain segments of the market may be underrepresented or exhibit different price-driving factors.
Gonggie [GYQ11] suggested an ANN-based model for predicting used automobile prices. He considered several: miles traveled, anticipated vehicle life, and brand. The suggested model accommodates nonlinear relationships in data, unlike prior models that relied on sim- ple linear regression approaches. The non-linear model predicted car prices more accurately than linear ones.
Pudaruth[Pud24] used various machine learning methods, including k-nearest neighbors, multiple linear regression, decision trees, and Naïve Bayes, to estimate car pricing in Mauri- tius. Data were gathered manually from local newspapers over a short period of time, taking into account characteristics such as brand, model, engine displacement, mileage, manufacture year, exterior color, transmission type, and price. The investigation found issues in process- ing numeric price values, particularly for Naïve Bayes and decision trees, resulting in reduced accuracies (sub 70%), possibly due to restricted dataset size and the intrinsic difficulty of capturing complicated pricing dynamics. All these works underline the complexity of the used car market and the challenges in predicting prices accurately. While classification-based approaches and regression methods offer insights, our approach—focusing on advanced en- semble models and carefully engineered features—demonstrates that it is possible to achieve competitive accuracy levels without resorting to nominal price categorization or intricate preprocessing steps.
3. Methodology
3.1 Data Collection
Data was gathered from mashina.kg, the largest web used automobile marketplace in Bishkek. A custom Python-based web scraper was developed to retrieve 12679 advertisements, captur- ing information like as brand, model, mileage, year, color, body type, and textual description columns indicating car particular features like air conditioning, MP3, or airbags.
3.2. Data Cleansing
The initial dataset included missing values and potentially exaggerated observations. Data initially comprised 100 distinct brands, contributing to high variability and complexity. To streamline the dataset, we restricted the brand selection to those with more than 200 entries, ensuring more statistically reliable subsets. This filtering reduced the number of distinct brands to 14. Each brand was then further separated by automobile model for more com- prehensive analysis. To overcome missing data, we used imputation algorithms for essential attributes. For example, any rows with missing mileage values were imputed with the mean mileage relevant to the related brand, model, and year, ensuring that the imputation ap- proach considered specific similarities rather than relying on a global average. In addition, we improved our dataset by filtering items based on the car’s availability status. The original data contained automobiles labeled as In Stock, For Order or On the Way. Cars that are not currently in stock are often newer and with higher prices, making them less reflective of overall resale market dynamics. As a result, we kept 8238 automobiles advertised as In Stock.
Figure 3.1.
Data gathering and transformation workflow diagram.

3.3. Feature Engineering
To improve model interpretability and performance, we combined numerical and categorical variables and used a variety of encoding approaches. Numerical attributes such as mileage and year of manufacture were kept as important predictors, but high-cardinality categorical features including brand, model, body type, and color were encoded using target or fre- quency encoding to handle their complexity. In addition, we retrieved and converted textual data from car descriptions into binary indicators. For example, the presence of air condi- tioning was represented as a simple 0/1 variable. We also developed new features to better reflect vehicle characteristics. Engine power initially measured in kilowatts (kW) for electric automobiles, but in liters for other vehicles. To standardize this data, we included the En- gine Power kW column. Furthermore, based on the advertising posting date, we generated temporal features and included a Milage per Year variable to measure annual mileage. This provides a more nuanced picture of car usage trends.
3.4. Model Selection and Training
The cleaned dataset was divided into training (80%) and testing (20%) sets. Numerical features were scaled to ensure stable training, while categorical variables were transformed as per the chosen modeling technique. Four different regression models—CatBoost, Linear Regression, LightGBM (LGBMRegressor), and Random Forest—were evaluated to identify the most suitable approach for predicting used car prices. Their performances, measured through Mean Absolute Error (MAE), Root Mean Squared Error (RMSE), R2 score, and Mean Absolute Percentage Error (MAPE), are summarized below: Among the tested models, CatBoost achieved the most balanced and superior results, exhibiting a strong R2 score, relatively low MAE and RMSE, and the lowest MAPE. These findings suggest that CatBoost is best suited for this particular dataset and price prediction task.

Table 3.1.
Comparison of Model Performance Metrics.
| Model | MAE | RMSE | R2 | MAPE |
|---|---|---|---|---|
| CatBoost | 2,233.35 | 4,358.01 | 0.9288 | 13.95% |
| Linear Regression | 5,408.32 | 8,539.39 | 0.7266 | 49.66% |
| LGBMRegressor | 2,292.76 | 4,262.84 | 0.9319 | 14.83% |
| Random Forest Regressor | 2,341.65 | 4,600.31 | 0.9206 | 14.40% |
3.5. Hyperparameter Tuning
Each model underwent hyperparameter optimization with Optuna to systematically find an ideal set of parameters to improve prediction performance. To ensure that the tuning results were steady and not excessively dependent on a single data segment, we used cross-validation for all possible subgroups. This method produced a more reliable estimation of each model’s generalization ability. Optuna selected the following hyperparameters as the best-performing parameters for CatBoost: These modifications enabled the CatBoost model to better catch complicated patterns, resulting in the highest prediction accuracy of the models tested.
Table 3.2.
Hyperparameter Tuning result.
| Hyperparameter | Description | Value |
| iterations | Number of boosting iterations (trees). | 1812 |
| depth | Maximum depth of each tree | 8 |
| learning_rate | Scales the contribution of each tree to the final prediction. |
0.0293 |
| l2_leaf_reg | L2 regularization coefficient | 0.09 |
| bagging_temperature | Controls the randomness of the bagging process |
0.0293 |
| border_count | Number of discrete values for binning continuous features |
217 |
| feature_border_type | Selects feature split thresholds that minimize entropy, improving the qual- ity of splits. |
MinEntropy |
| grow_policy | Builds balanced trees by ensuring sym- metric splits |
SymmetricTree |
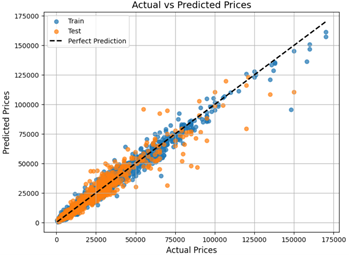
4. Result
The CatBoost model performed well on the training data, with low error metrics and excellent explanatory power. Despite a little reduction in performance on test data, the model maintained a high R2 score and explained variance, showing good generalization in unfamiliar scenarios. Although the MAPE, MAE, and RMSE values increased on the test set, they stayed within a reasonable range, indicating that the model accurately captures underlying patterns in car pricing. In summary, the results demonstrate that the CatBoost model not only matches the training data closely, but also maintains a significant level of accuracy and consistency when applied to new data.
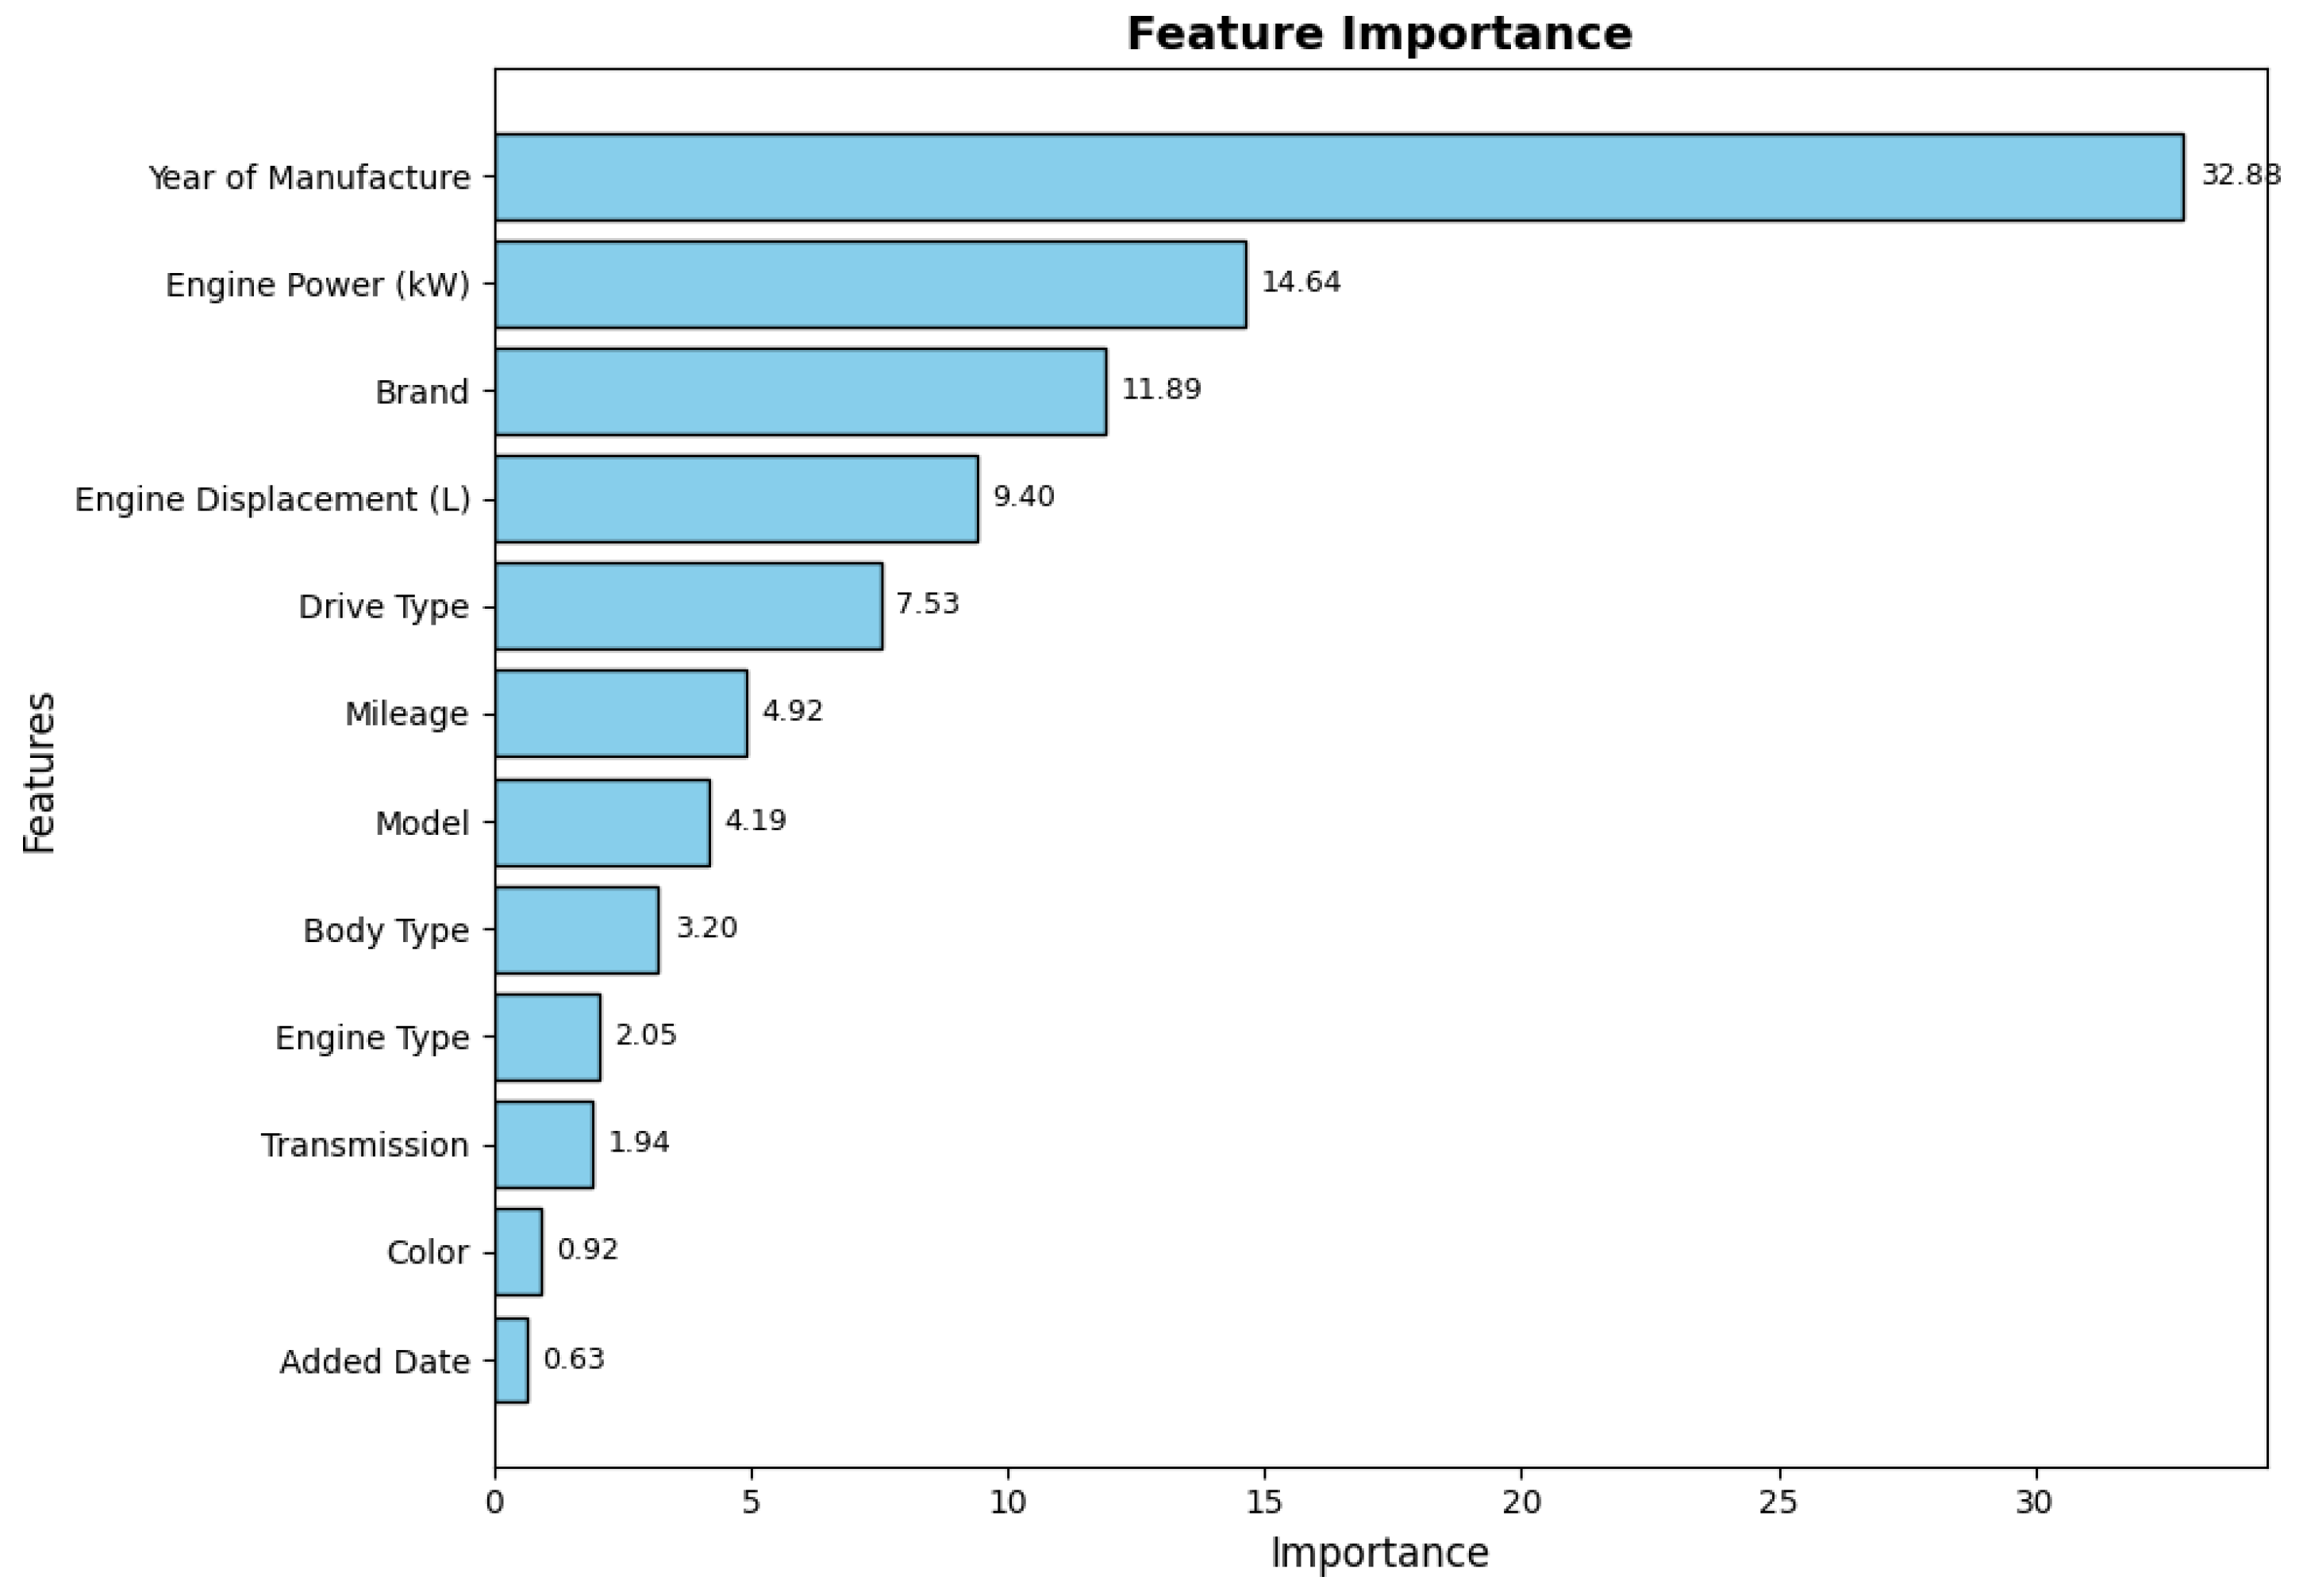
The table below presents the top 12 most important features influencing the target vari- able, ranked by their relative importance. These features were derived using the CatBoost model, emphasizing their contribution to the predictive power of the model.
Table 4.1.
Performance metrics for training and testing data.
| Metric | Train | Test |
|---|---|---|
| Mean Absolute Percentage Error (MAPE) | 11.08% | 13.95% |
| Mean Absolute Error (MAE) | 1374.42 | 2233.35 |
| Root Mean Squared Error (RMSE) | 2245.31 | 4358.01 |
| R2 Score | 0.9805 | 0.9288 |
| Median Absolute Error | 852.46 | 1145.86 |
| Explained Variance Score | 0.9805 | 0.9288 |
Figure 4.1.
Actual vs Predicted Price.
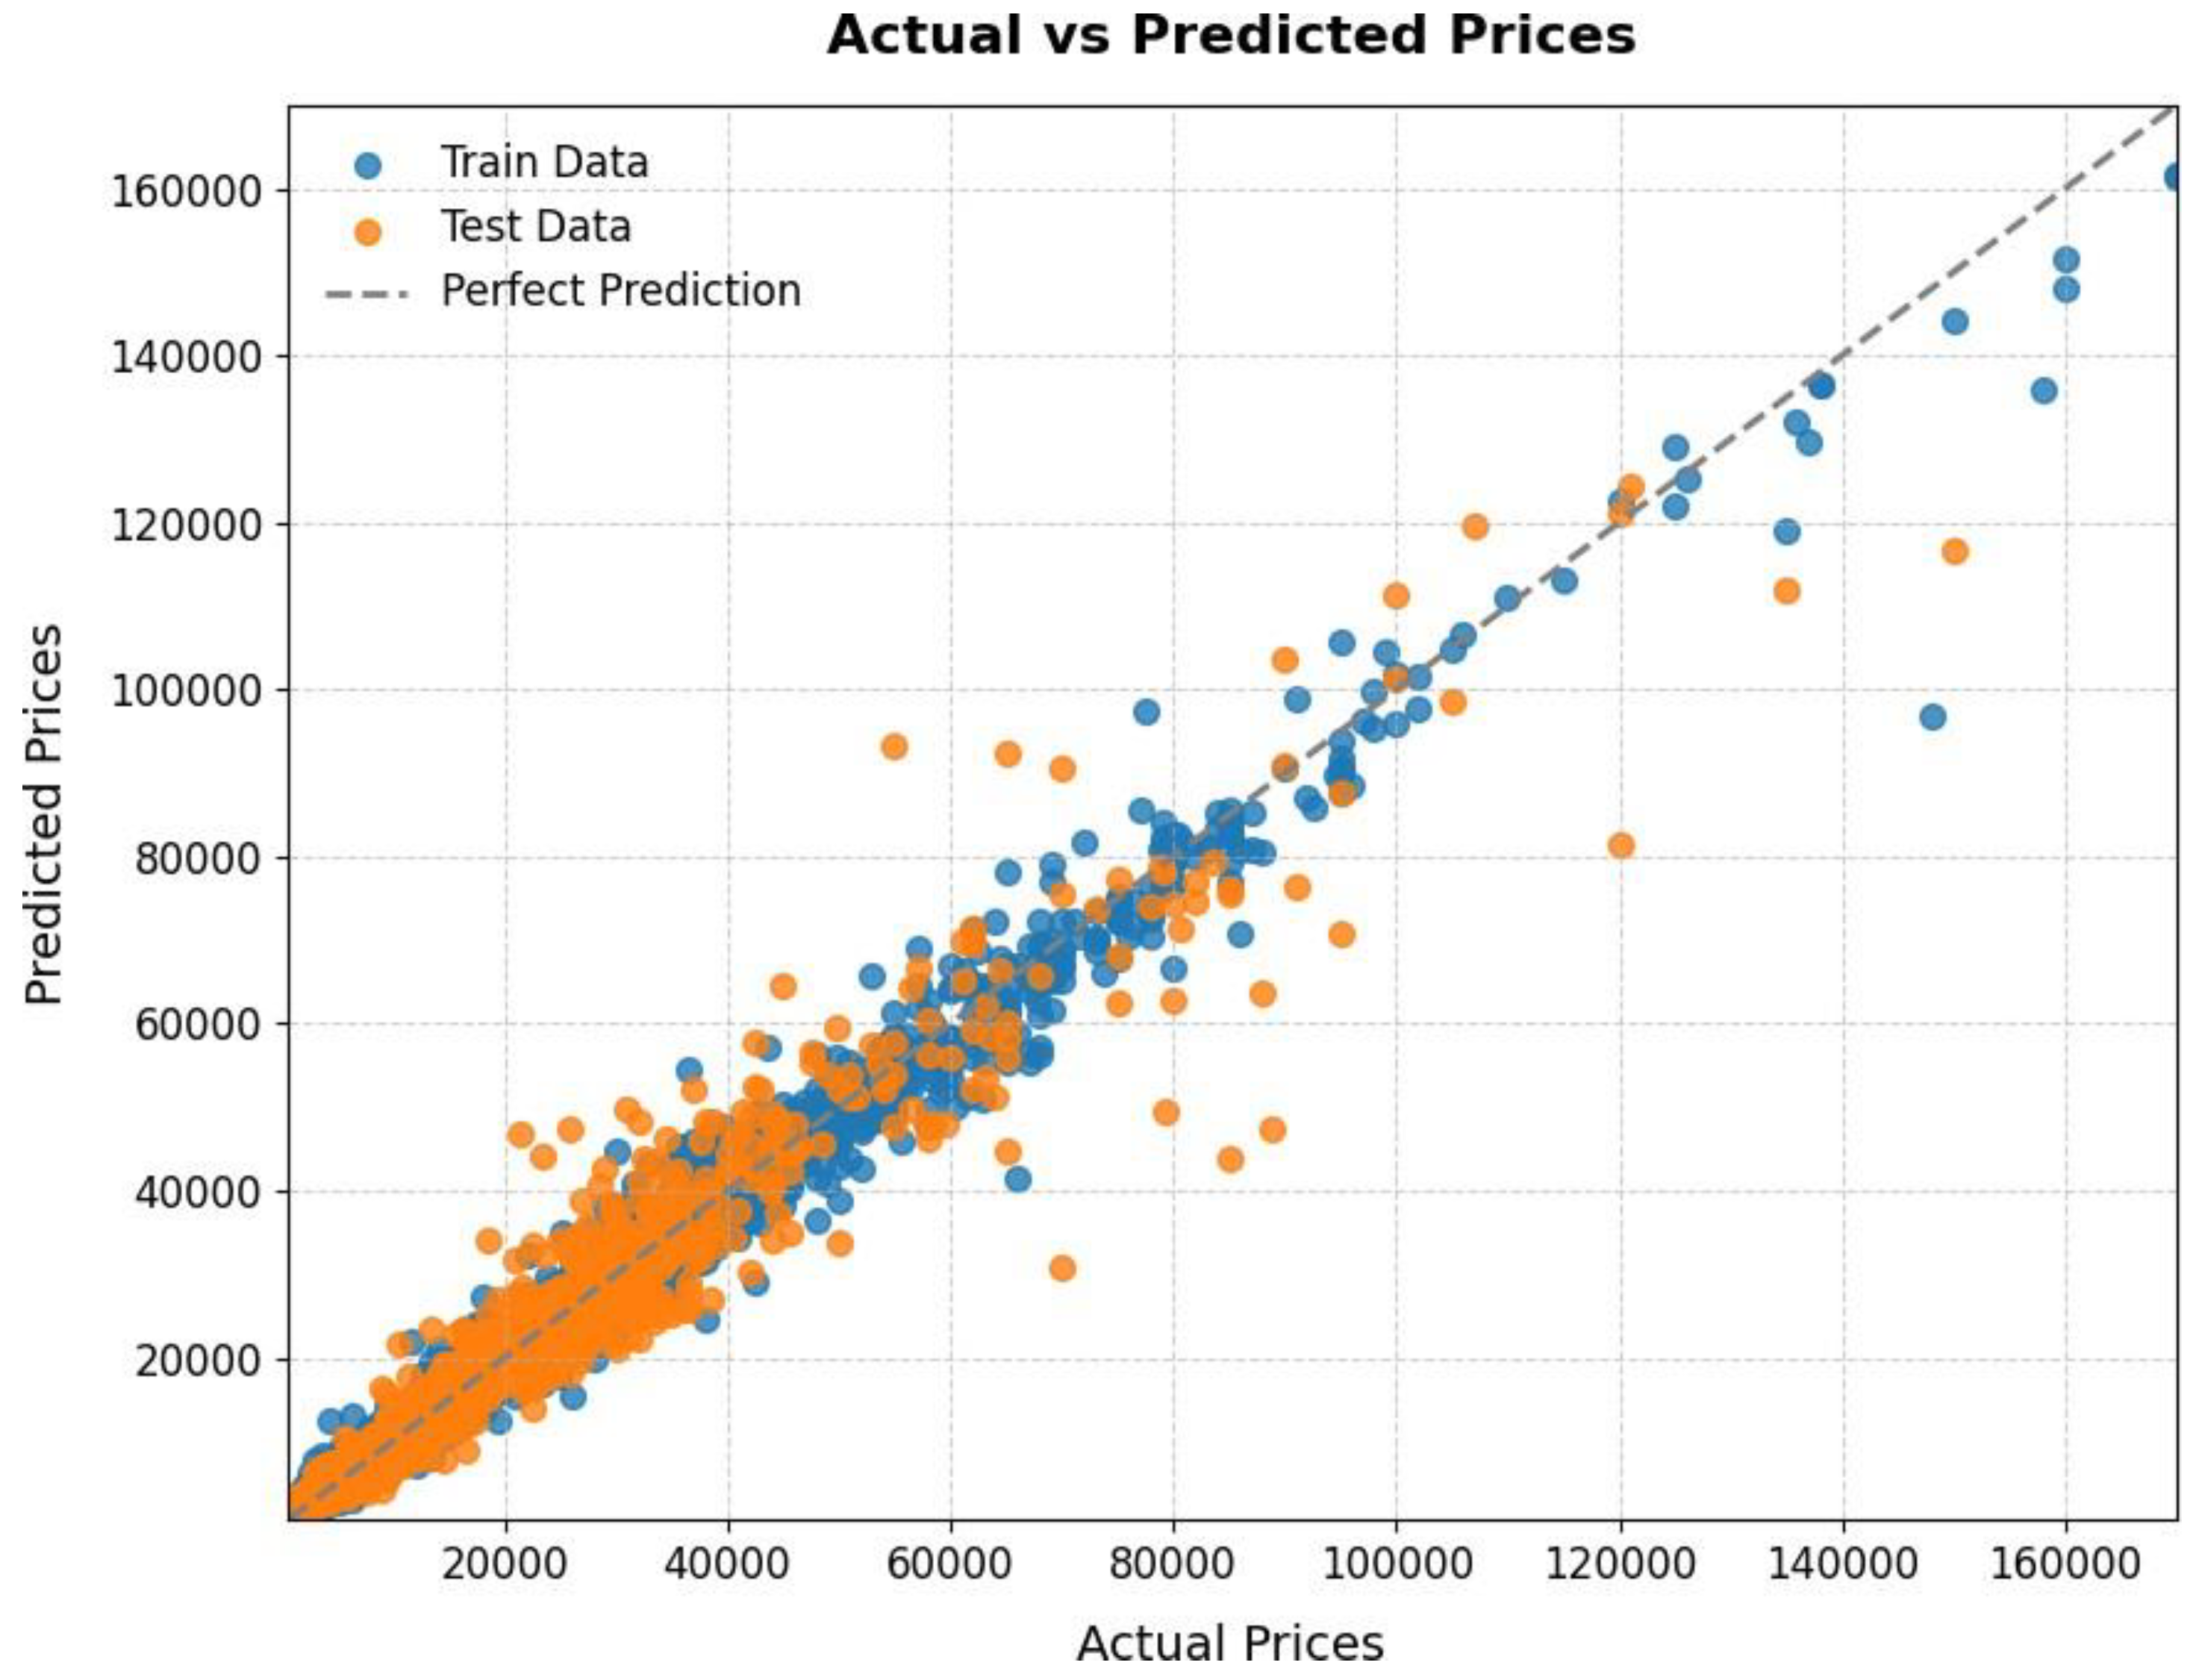
Figure 4.2.
Feature Importance Table.
5. Conclusion
The purpose of this study was to accurately predict the cost of used cars in the Bishkek market using advanced machine learning methods. After collecting and analyzing data from the website machine.kg several models were compared, including CatBoost [Dev18], linear regression, LGBM and random forest. Setting up Optuna hyperparameters and performance indicators (MAE, RMSE, MAPE and R2) showed that the CatBoost model consistently outperforms others. Notably, CatBoost has achieved excellent results without relying on nominal price categories, demonstrating its ability to capture complex nonlinear correlations in data. These results demonstrate the usefulness of ensemble-based gradient enhancement techniques such as CatBoost for predicting the resale value of cars. In addition to being directly useful to customers and dealerships, this method can also help financial institutions and insurance companies make more informed decisions. Further research should include the study of external factors, such as macroeconomic indicators and seasonal demand patterns, to improve the reliability and applicability of the model.
References
- [Dev18] C. Developers. CatBoost Documentation: CatBoostRegressor . Accessed: 2024-12-11. 2018.
- [Geg19] E. Gegic. Predicting the price of used cars using machine learning algorithms. International Burch University, 5(1): 12–24, 2019.
- [GYQ11] S. Gongqi, W. Yansong, and Z. Qiang. New model for residual value prediction of the used car based on bp neural network and nonlinear curve fit. Measuring Technology and Mechatronics Automation (ICMTMA), 2011 Third International Conference on, vol. 2. 682–685, 2011.
- [Mas24] Mashina.kg. Mashina.kg - Cars for Sale in Kyrgyzstan. 2024.
- [Med24] K. Media. 2024. url: https : / / kaktus . media / doc / 504697 _ v _ kyrgyzstane_znachitelno_vyroslo_kolichestvo_legkovyh_avtomobiley. html.
- [Muh] MuhammadAsghar. Used cars price prediction using machine learning with opti- mal features. Pakistan Journal of Engineering and Technology (PAKJET).
- [Pud24] S. Pudaruth. Predicting the price of used cars using machine learning techniques. International Journal of Information and Computation Technology (IJICT), 4(7), 2024.
Disclaimer/Publisher’s Note: The statements, opinions and data contained in all publications are solely those of the individual author(s) and contributor(s) and not of MDPI and/or the editor(s). MDPI and/or the editor(s) disclaim responsibility for any injury to people or property resulting from any ideas, methods, instructions or products referred to in the content. |
© 2024 by the authors. Licensee MDPI, Basel, Switzerland. This article is an open access article distributed under the terms and conditions of the Creative Commons Attribution (CC BY) license (http://creativecommons.org/licenses/by/4.0/).
Copyright: This open access article is published under a Creative Commons CC BY 4.0 license, which permit the free download, distribution, and reuse, provided that the author and preprint are cited in any reuse.


