Result
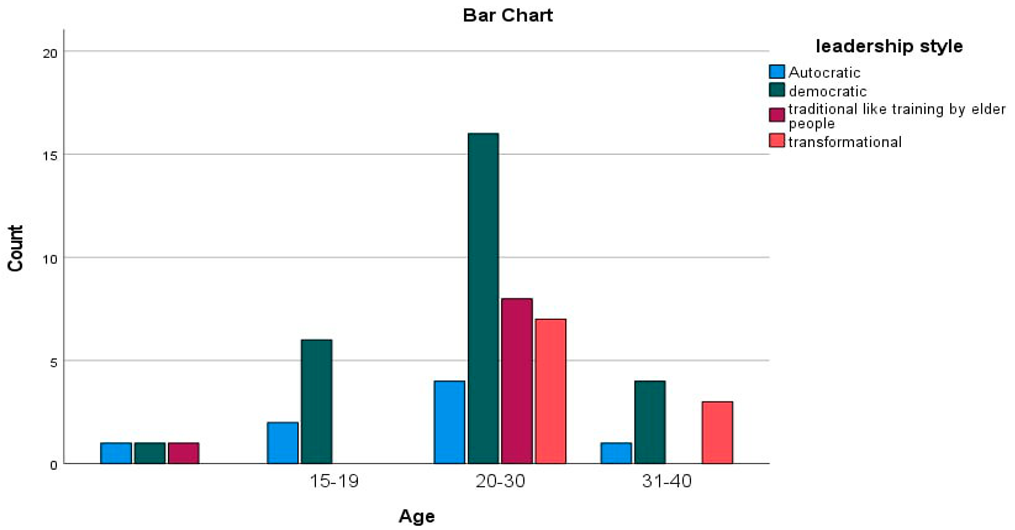 |
The above bar chart displays the distribution of leadership styles among three age groups (15–19, 20–30, and 31–40). The most dominant leadership style is democratic across the different age groups, particularly among employees aged 20 to 30, where 16% prefer democratic management. The second most dominant leadership style is transformational, which emphasizes motivating employees, creating a vision, and encouraging them to fulfill it. Moreover, the preference for the “traditional, like training by elder people” leadership style is comparatively stable but less predominant across all age groups. Additionally, the least popular style is autocratic management, implying a general preference for less authoritative approaches. Hence, this graph indicates a clear trend towards democratic and transformational leadership styles among the younger generation, specifically in their 20s. The most predominant style, democratic, is favored across all age groups because it helps workers to work independently without experiencing stress or pressure, thereby boosting their productivity and motivation.
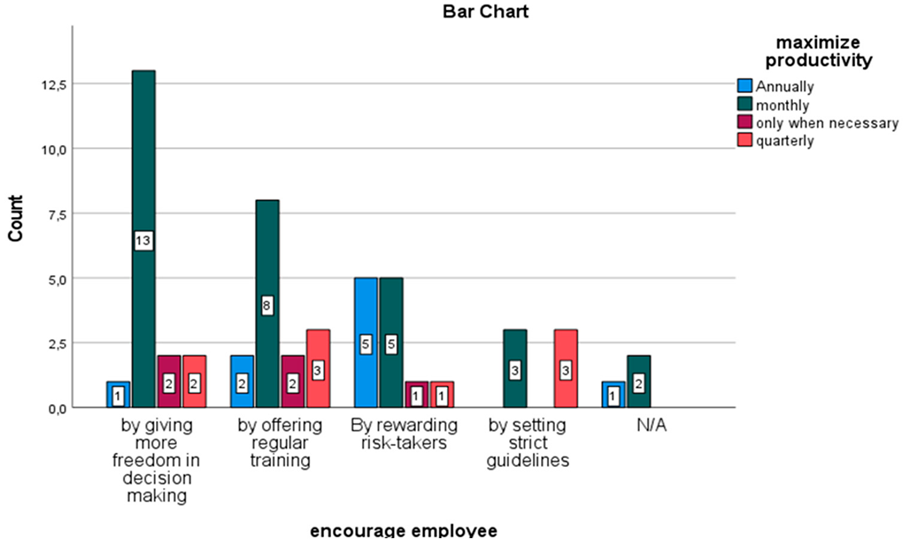 |
The next bar chart gives information about how encouraging employee impact maximizes productivity. The bar chart examines four strategies for maximizing productivity- By Giving More Freedom in Decision Making, By Offering Regular Training, By Rewarding Risk Takers, and By Setting Strict Guidelines analyzed across four timeframes: Annually, Monthly, Only When Necessary, and Quarterly. It provides insights into how employees or managers prefer these strategies to be implemented over time. Among the strategies, By Giving More Freedom in Decision Making received the highest number of responses, with 13 participants favoring implementation on a monthly basis, making it the most preferred option. Smaller numbers of participants supported this strategy on an annual (1), quarterly (2), or “Only When Necessary” (2) basis. “By Offering Regular Training” was another popular approach, with 8 participants preferring monthly implementation. Fewer people supported annual (2), quarterly (3), or “Only When Necessary” (2) schedules for this strategy. In terms of “By Rewarding Risk Takers,” there was an even split, with 5 participants each favoring annual and monthly implementation. Only 1 participant supported implementation “Only When Necessary” or quarterly. Lastly, “By Setting Strict Guidelines” had lower overall responses. No participants chose annual or “Only When Necessary,” while 3 participants each selected monthly and quarterly schedules. The chart highlights that monthly implementation is consistently the most preferred time frame across all strategies. “By Giving More Freedom in Decision Making” stands out as the most favored approach, while “By Setting Strict Guidelines” receives comparatively less support. These findings suggest that employees value consistent, regular actions to maximize productivity, particularly those that empower decision-making and skill development.
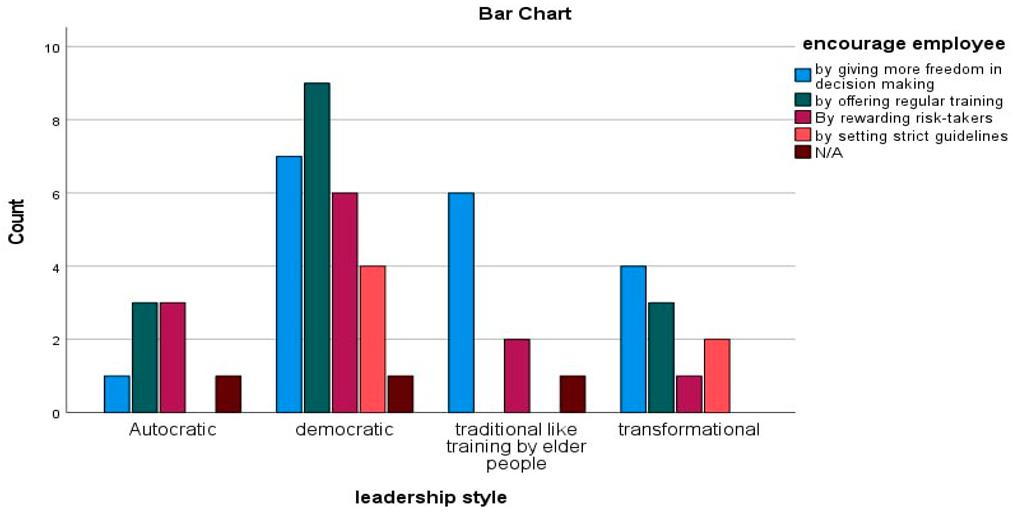 |
This graph illustrates data about how different leadership styles encourage employees through specific methods. The authority methods analyzed are autocratic, democratic, traditional, and transformational, with styles like giving more freedom in decision-making, offering regular training, rewarding risk-takers, and setting strict guidelines. Firstly, an autocratic leadership style seems to have minimal reliance on offering freedom in decision-making or rewarding risk-takers. However, strict guidelines dominate, though this method appears less popular compared to others. The most predominant management style is freedom in decision-making and offering regular training. The reason is that making independent decisions and ongoing practice can improve employees’ skills and encourage them to achieve their goals. The third, the traditional leadership style focuses mainly on structured training by elders in this method giving more freedom to workers and the best way to improve their job satisfaction. The last leadership style is transformational, which focuses on rewarding innovation or risk-taking, while also offering consistent freedom in decision-making. These findings suggest that the most effective leadership style is democratising style by offering regular training during work hours.
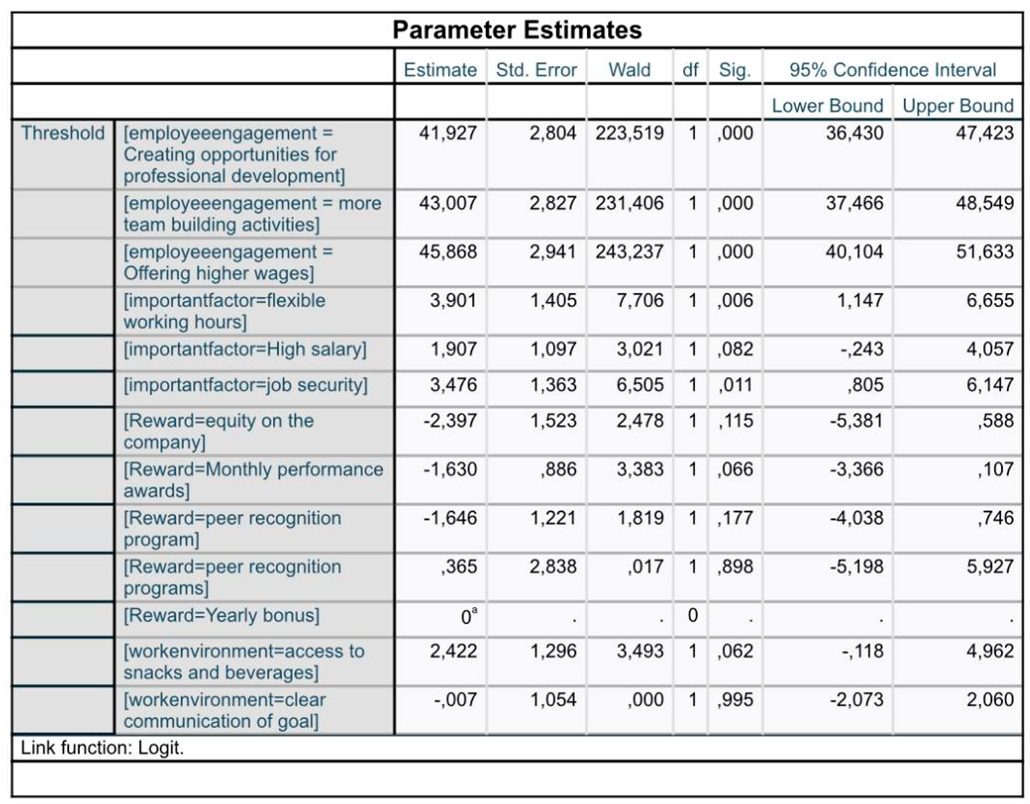 |
The table displays parameter estimates from a statistical model with the help of ordinal logistic regression. Ordinal Logistic Regression shows that creating opportunities for professional development is statistically significant at 0.01 level and we accept Ha and reject Ho, meaning that there is a positive relationship between Creating opportunities and employee engagement. If companies create opportunities for professional development, it leads to increased engagement of workers by 41%.
More team-building activities are statistically significant at 0.01 level and we accept Ha and reject Ho, meaning that there is a positive relationship between team-building activities and employee engagement. If companies build more team activities, it leads to an increased engagement of workers by 43%.
Offering higher wages is statistically significant at 0.01 level and we accept Ha and reject Ho, meaning that there is a positive relationship between offering higher wages and employee engagement. If companies offer higher wages, it leads to an increase in the engagement of workers by 45%.
The next is that Ordinal Logistic Regression shows that flexible working hours are statistically significant at 0.1 level and we accept Ha and reject Ho, meaning that there is a positive relationship between flexible working hours and employee engagement. If companies create opportunities for flexible working, it leads to increased productivity of workers by 3.9%.
High salary is statistically significant at 0.1 level and we accept Ha and reject Ho, meaning that there is a positive relationship between high salary and employee engagement. If companies increase workers' pay, it leads to increased productivity of employees by 1.9%.
Job security is statistically significant at 0.1 level and we accept Ha and reject Ho, meaning that there is a positive relationship between job security and employee productivity. If companies keep job security, it leads to increased productivity of employees by 3.4%.
Monthly performance awards are statistically significant at 0.1 level and we accept Ha and reject Ho, meaning that there is a negative relationship between monthly performance awards and employee engagement. If companies increase monthly performance awards, it leads to a decrease in the productivity of employees by 1.6%.
Access to snacks and beverages is statistically significant at 0.1 level and we accept Ha and reject Ho, meaning that there is a positive relationship between access to snacks and beverages and employee engagement. If companies increase access to snacks and beverages, it leads to an increase in productivity of employees by 2.4%.
However, equity in the company, peer regression program, and clear communication goals are statistically insignificant meaning that we accept Ho and reject Ha, and there is no relationship between these variables and employee engagement.
