2. Materials and Methods
2.1. Materials
Spermatozoa (about 20 samples from anonymous donors) were obtained from the Infertility and IVF Unit of the Chaim Sheba Medical Center, Tel-Hashomer, Israel, from January 1, 2018 to December 31, 2022.
Quinn’s Advantage Sperm Freezing Medium, (CooperSurgical, Ballerup, Denmark) and oil for tissue culture was purchased from Sage (SAGE In Vitro Fertilization, Målov, Denmark).
2.2. Ethics
Sperm was obtained after receiving signed informed consent from each patient to use cells that would have otherwise been discarded. All personal data were fully anonymized to maintain patient privacy and samples were coded so that patient information could not be reached. The study was approved by the local Institutional Review Board (approval number 0187-23-SMC).
2.3. Measurement System
Images were acquired using a motorized Olympus inverted IX81 microscope (Tokyo, Japan), which is equipped with a sub-micron Marzhauser-Wetzlar motorized stage type SCAN-IM, with an Lstep controller (Wetzlar-Steindorf, Germany) and a filter wheel including a fluorescein fluorescence cube containing excitation filters (470-490 nm), dichroic mirrors (505 nm long pass), and emission filters (510-530 nm). The filters were obtained from Chroma Technology Corp. (Brattleboro, VT, USA). A cooled, highly sensitive 14-bit, ORCA II C4742-98 camera (Hamamatsu, Japan) was used for imaging. Olympus Cell^P software (Tokyo, Japan) was used for image analysis.
2.4. Freezing and Thawing Sperm Cells
Molt 4 cells were used for viability testing after the freeze-thaw cycle. Spermatozoa, washing medium and freezing medium were mixed in a 1:1:2 ratio. The Petri dish was placed in liquid nitrogen vapor for 5-10 minutes and then immersed in liquid nitrogen for the freezing process. For thawing, the Petri dish was transferred to a microscope and incubated at 37°C.
2.5. Developing the Addressable Nanoliter Containers
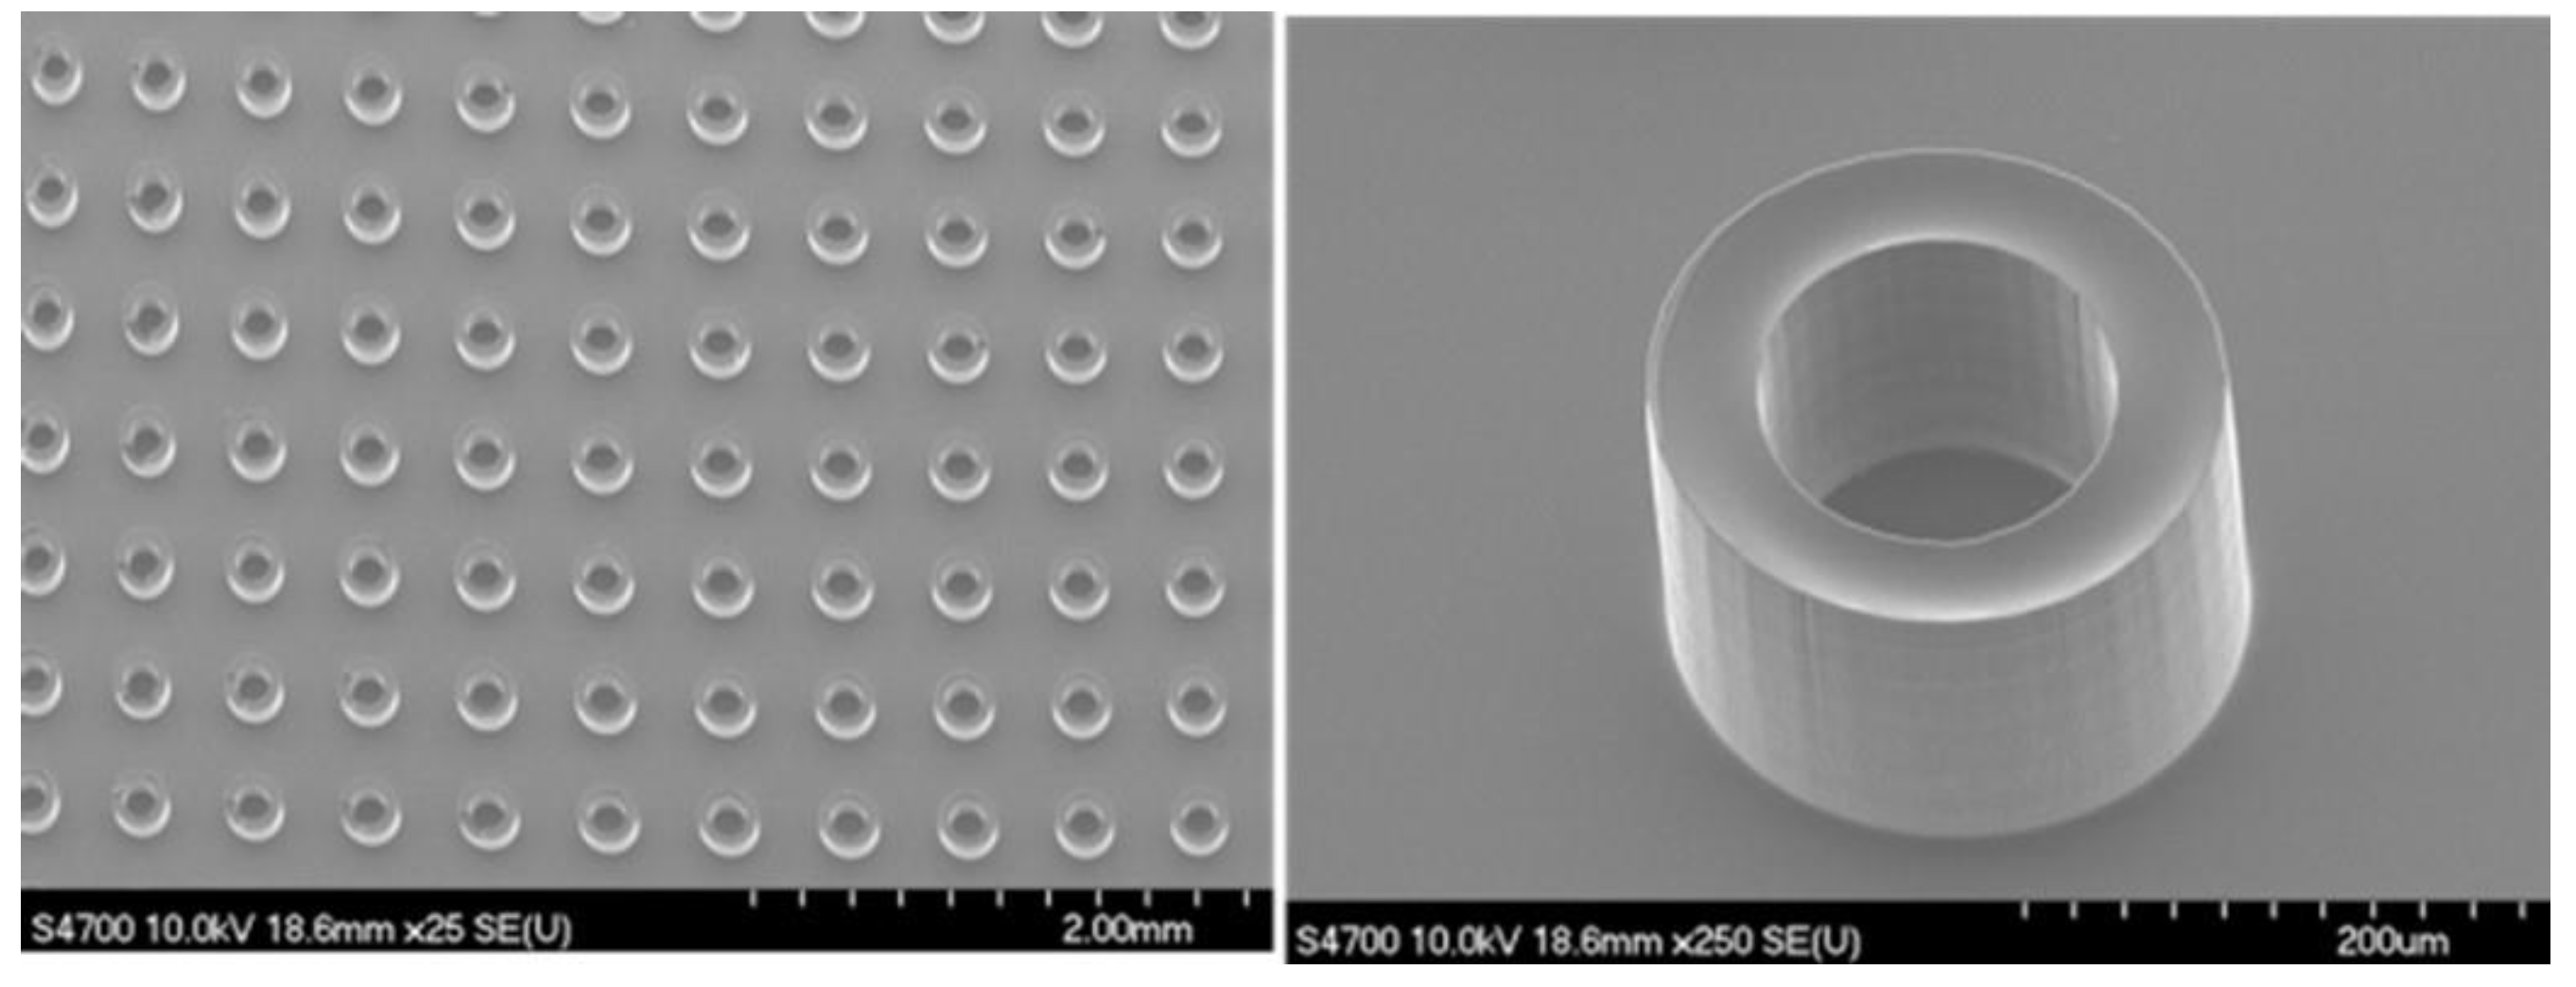
Efforts to trap a small number of cells in a given volume for various purposes have taken more than a decade and most are reviewed in the Introduction. Consequently, ANLC arrays have been developed, in which each (about 2.5 nl in volume) acts as an individual isolated ANLC, wherein an individual live sperm cell can be captured and monitored under a microscope noninvasively and in a time-resolved manner. After investigating a series of different shapes including a cylinder with a flat or a concave bottom, and an inverted truncated pyramid with different convergence angels, we chose the first option after researching the optical effects that the shapes may exhibit when examining the ANLC and the sperm cell model inside it with an interference microscope. The ANLC was designed and constructed to accommodate the freezing and thawing conditions required for cryopreservation.
The ANLC array (
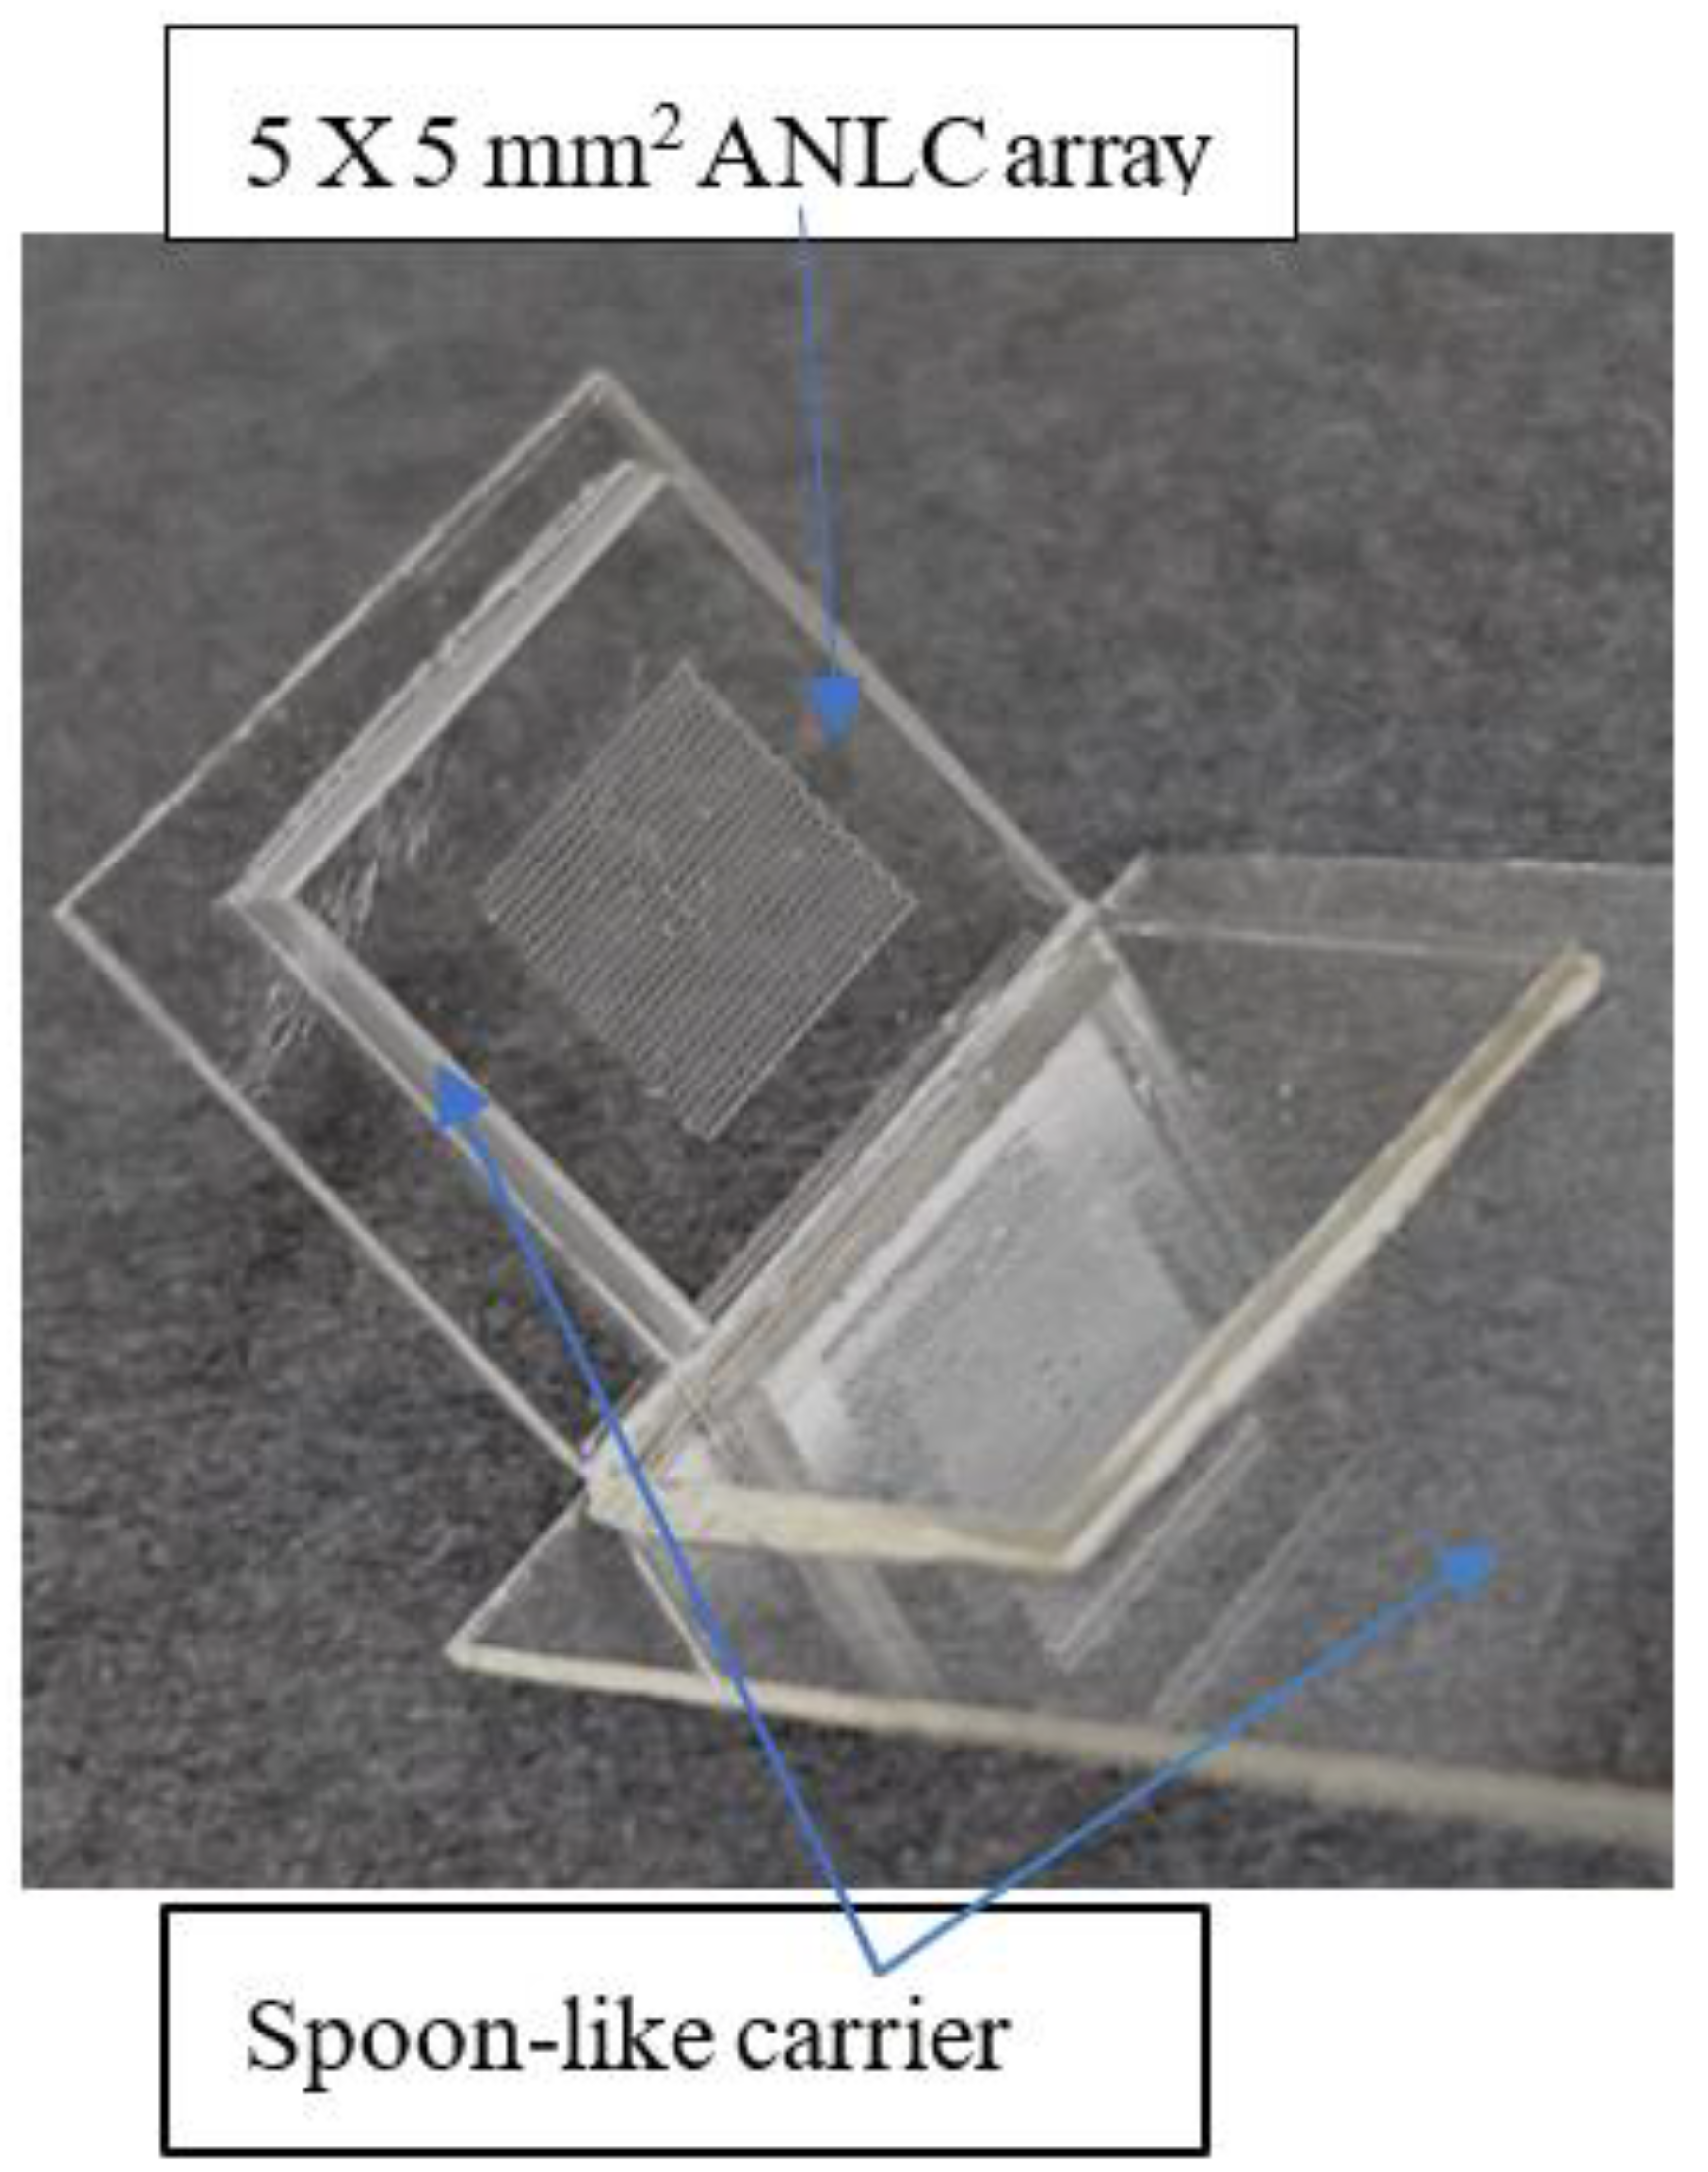
Figure 1) was fabricated using a Photo Lithographic Patterning technique. A sheet of 175 µm thick borosilicate glass, type D263 (GeSiM, Germany) was spin-coated at 3500 rpm with SU8-5 photoresist, to a thickness of 2–2.5 µm. The ANLC array was patterned on the photoresist by illuminating it through a prefabricated chromium-mask. This was followed by thermal annealing at 175˚C for 60 minutes, resulting in stiff, smooth surfaces of the structured SU8-5 ANLC. Finally, the arrayed glass was sawed into 5×5 mm2 chips, cleaned (mainly from glass debris) using water jetting, dried with clean compressed air and kept in antistatic bags until fabrication. Then, the ANLC arrays were glued onto a standard microscope slide with a droplet of NOA81 (Norland Optical Adhesives, Jamesberg, NJ, USA) and cured with UV light for 25 seconds. The ANLC array was suited for conventional cryopreservation by gluing it to a spoon-like handle, made of plastic or 0.3 mm aluminum foil, and then stored in a standard cryo-tube (
Figure 2).
Once the preparation of the ANLC print was completed, it was treated in an electronic plasma system (Diener Electronic GmbH & Co., KG, Ebhausen, Germany). This plasma system is used for surface cleaning, surface activation, surface etching and surface deposition treatment to give the print hydrophilic characteristics. The print was then sterilized for 2 minutes with UV light (Model 5000 Flood Light Curing System, Dymax Corp., Torrington, CT, USA) and packaged using a household vacuum machine into individual plastic bags.
2.6. Ways to Enhance Hydrophilic Characteristics
Using “cold plasma” (ours heats the prints and works without oxygen)
Using more professional vacuum machine and plastic bags.
Storing prepared and sealed prints at low temperatures.
However, ANLC attached to a plastic handle could not be treated with plasma because it melts during plasma treatment. However, when the handle was made of 0.3 mm aluminum foil, which could be plasma treated. In the former case, the plastic handle with the attached ANLC array was soaked in alcohol for 24 hours. After which, they were washed with water and medium and sealed in cryo-tubes (Eppendorf, Hamburg, Germany) soaked within the medium to be used.
2.7. Optical Aspects of Addressable Nanoliter Containers (ANLCs)
The objective of fabricating a nanoliter size container (ANLC) is based on the goal of improving the ability to localize a sperm cell accurately. On the other hand, reducing the ANLC container dimensions might cause increased clutter caused by the effect of scattered light. To demonstrate the usefulness of the suggested ANLCs, we examined the effect using a highly phase-sensitive measurement procedure. Therefore, an interference microscope was used (
Figure 3).
In short, an interference microscope is principally designed to enable imaging of a desired interference pattern [
9,
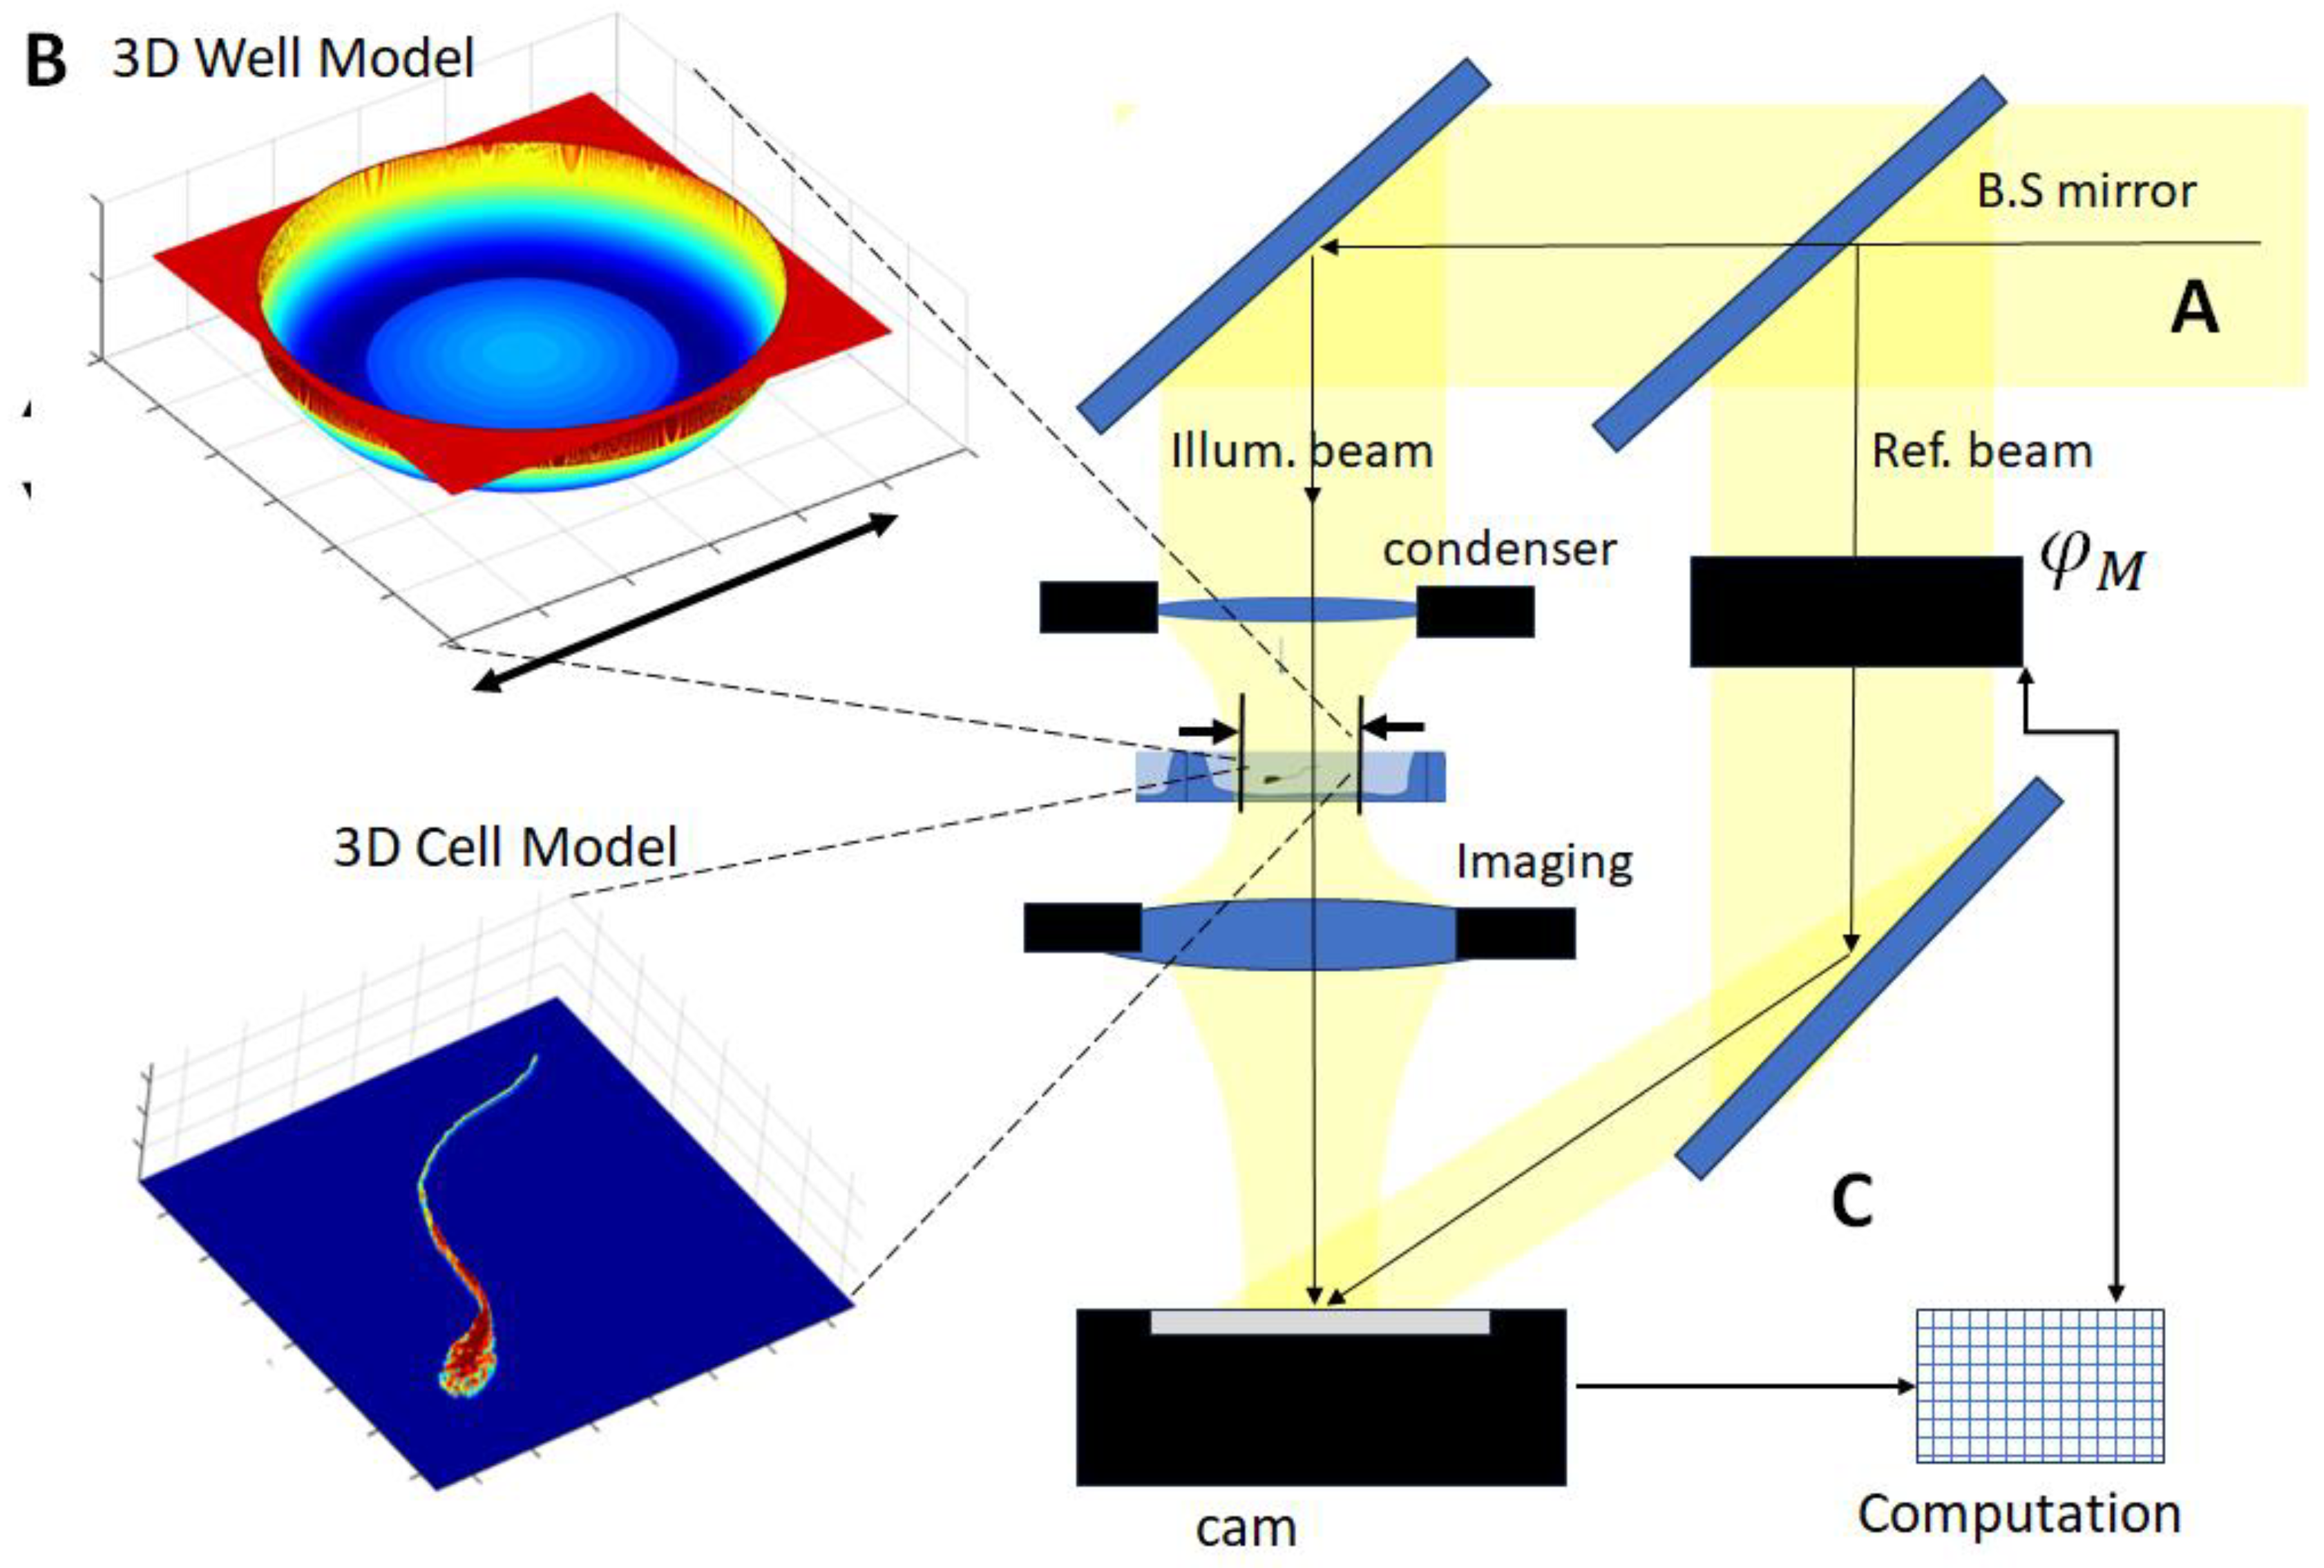
10]. The pattern is obtained by splitting an incoming monochromatic beam into illumination and reference beams. One passes through the measured object and hence, acquires a location-dependent optical delay. This optical delay may also be referred to as an optical phase distribution of the light wave field. This field may be imaged on the camera plane by means of an imaging lens. The second beam, which serves as a phase reference beam is then directed into the (camera) plane, resulting in an interference (typically fringe raster) pattern. This pattern encodes the phase information that can be decoded by means of analyzing algorithms.
The system could be numerically simulated; thus, enabling theoretical investigation of the effect of various micro-well designs on the accuracy of the retrieved optical pass length distribution, as deduced by the interferometric microscope model.
The results obtained by simulation were amazingly similar to the actual results [
9,
10] to the findings of Shaked (2012) and therefore, permitted the influence of the ANLC on measurements of interferometer microscope to be examined [
11].
2.8. The Numerical Model
The numerical simulation model [
12] included three main modules as depicted in
Figure 3: a. Interferometer microscopy setup: wave propagation of a Gaussian beam through various optical components of the device, based on the actual optical system to be investigated. b. Sample model which includes detailed 3D optical characteristics of both the sperm cell and c. the ANLC, which hosts a sperm cell during the process.
The 3-D model of the sperm cell is composed based on geometrical and optical parameters of a typical sperm-cell, obtained by means of optical coherence tomography (OCT). Simulation of data recording analysis: the full process of phase extraction is simulated by means of an algorithm fed with synthetic interferometric data.
As described in the data analysis section below, a fixed beam waist was used to illuminate the ANLC with the sperm cell model in it. The waist diameter of the input beam was 60 µm in the sample plane, with a depth-of-field of a few hundreds of microns, which is much larger than the height of the ANLC. The beam wavelength could be simulated to have a range of 0.8 > λ > 0.4 µm. To obtain the numerical value of the spot diameter, a condenser lens was used to focus the beam on the sample, while an imaging lens was used to create a magnified image on the camera plane. A reference beam was directed at the desired angle, typically a few degrees, to interfere with the electric field of the imaging arm at the camera image plane. By modulating the phase of the reference beam, the typical fringe pattern is affected making it possible to extract the relative spatial phase delay induced by the sample optical density distribution. The result may be presented in the form of a topographic phase map, indicating the combined effect of the size, shape and depth of the sperm cell under investigation. Alternatively, the optical density could be estimated by geometrical assumptions, avoiding the need for phase modulations.
The sample model was composed of a ANLC with dimensions in the range 100-150 µm and depth in the range of 90-110 µm. The sperm cell was modeled according to its characteristic optical and physiological parameters, as described by Shaked (2012), with dimensions and a refractive index that comprised a three-dimensional distribution.
The simulation system comprising the features described was adjusted to mimic several experimental situations, all of which could be compared to results reported by Shaked (2012).
2.9. Data Analysis
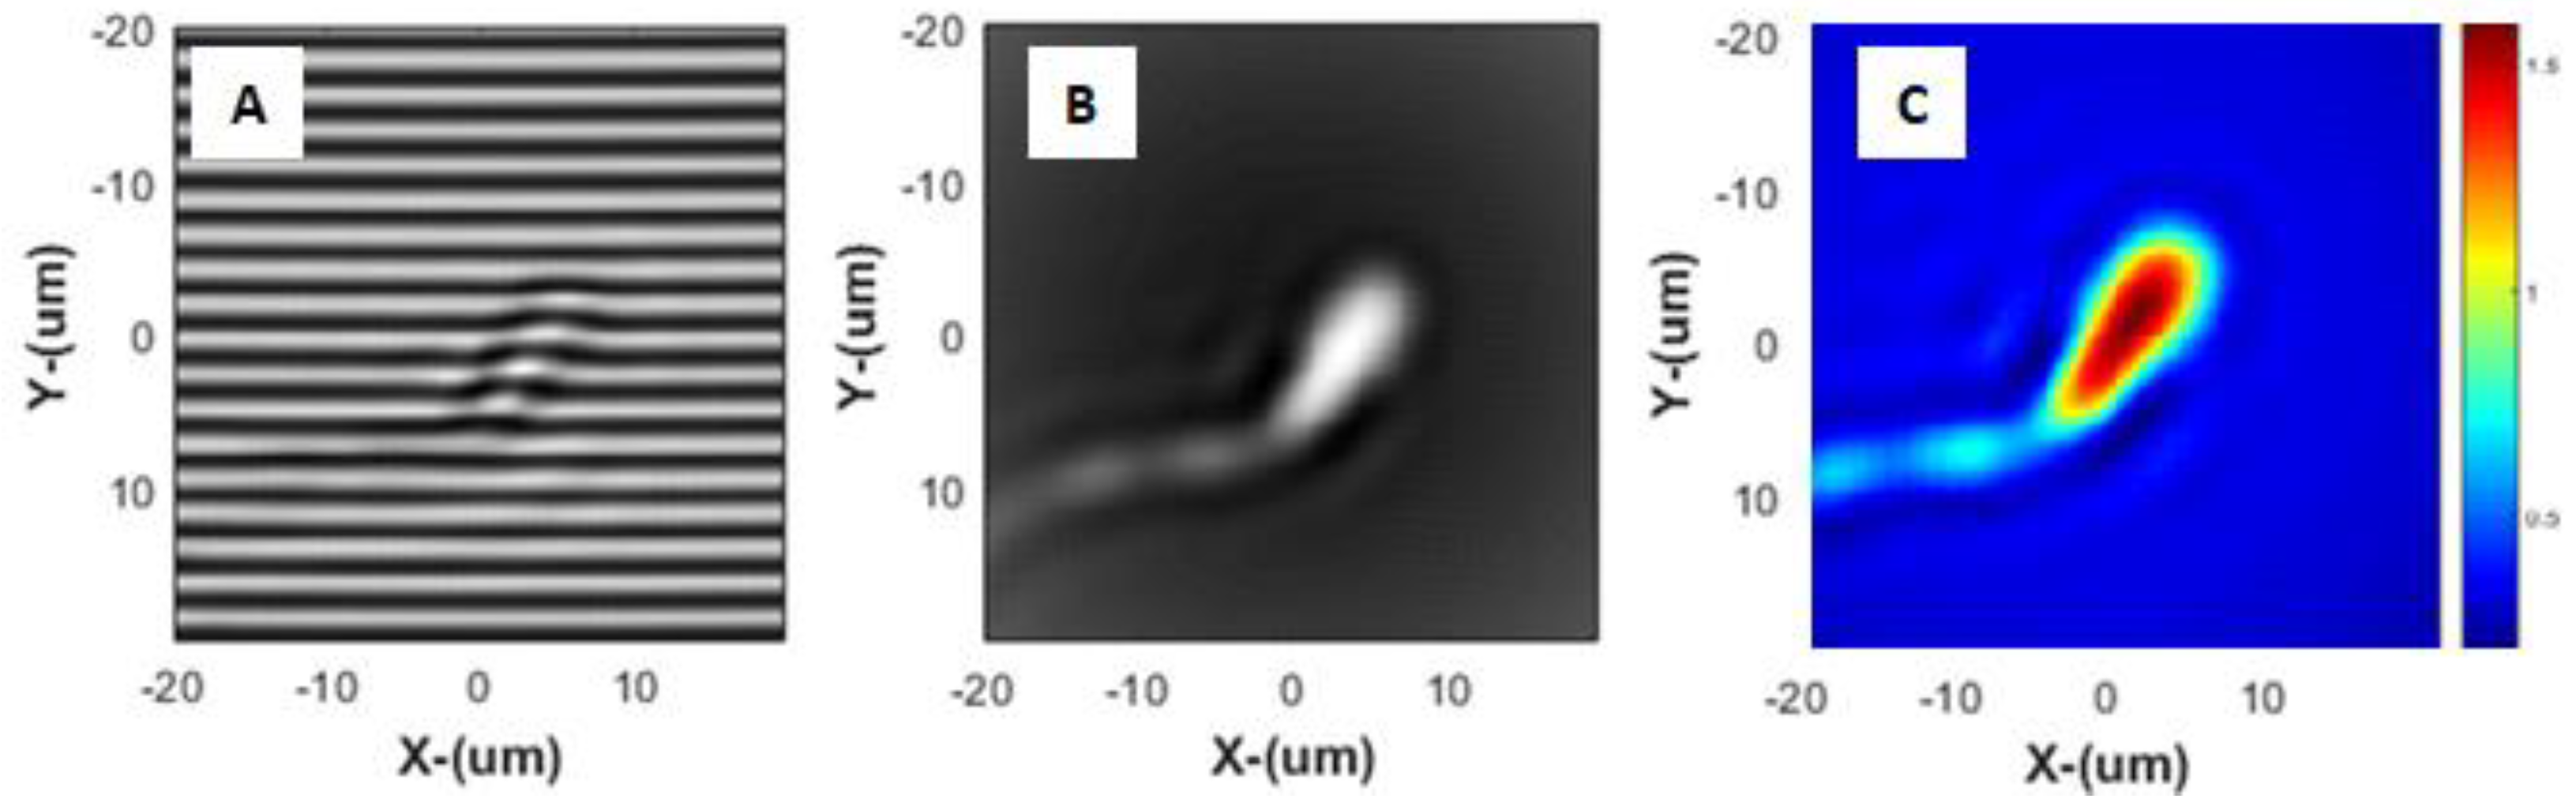
During the measurement process, the camera plane is illuminated by two beams. The first is the beam coming from the sample branch and the second is the reference beam. The interference between these creates fringes of the form presented in Figure. 4A. As the phase of the reference beam is modulated, the pattern of the fringes evolves; thus, enabling extraction of the relative phase delays at different points in the sample. These phase delays are caused by the optical density of the specimen, which depends on, among other factors, the size and contents of the sperm cell head.
As seen above, all phase data can be recovered very accurately by using the above-mentioned set of fringe patterns. The main limitation in the precision of the phase extraction process is dictated by diffraction due to the finite wavelength used and to the apertures along the collection optical path.
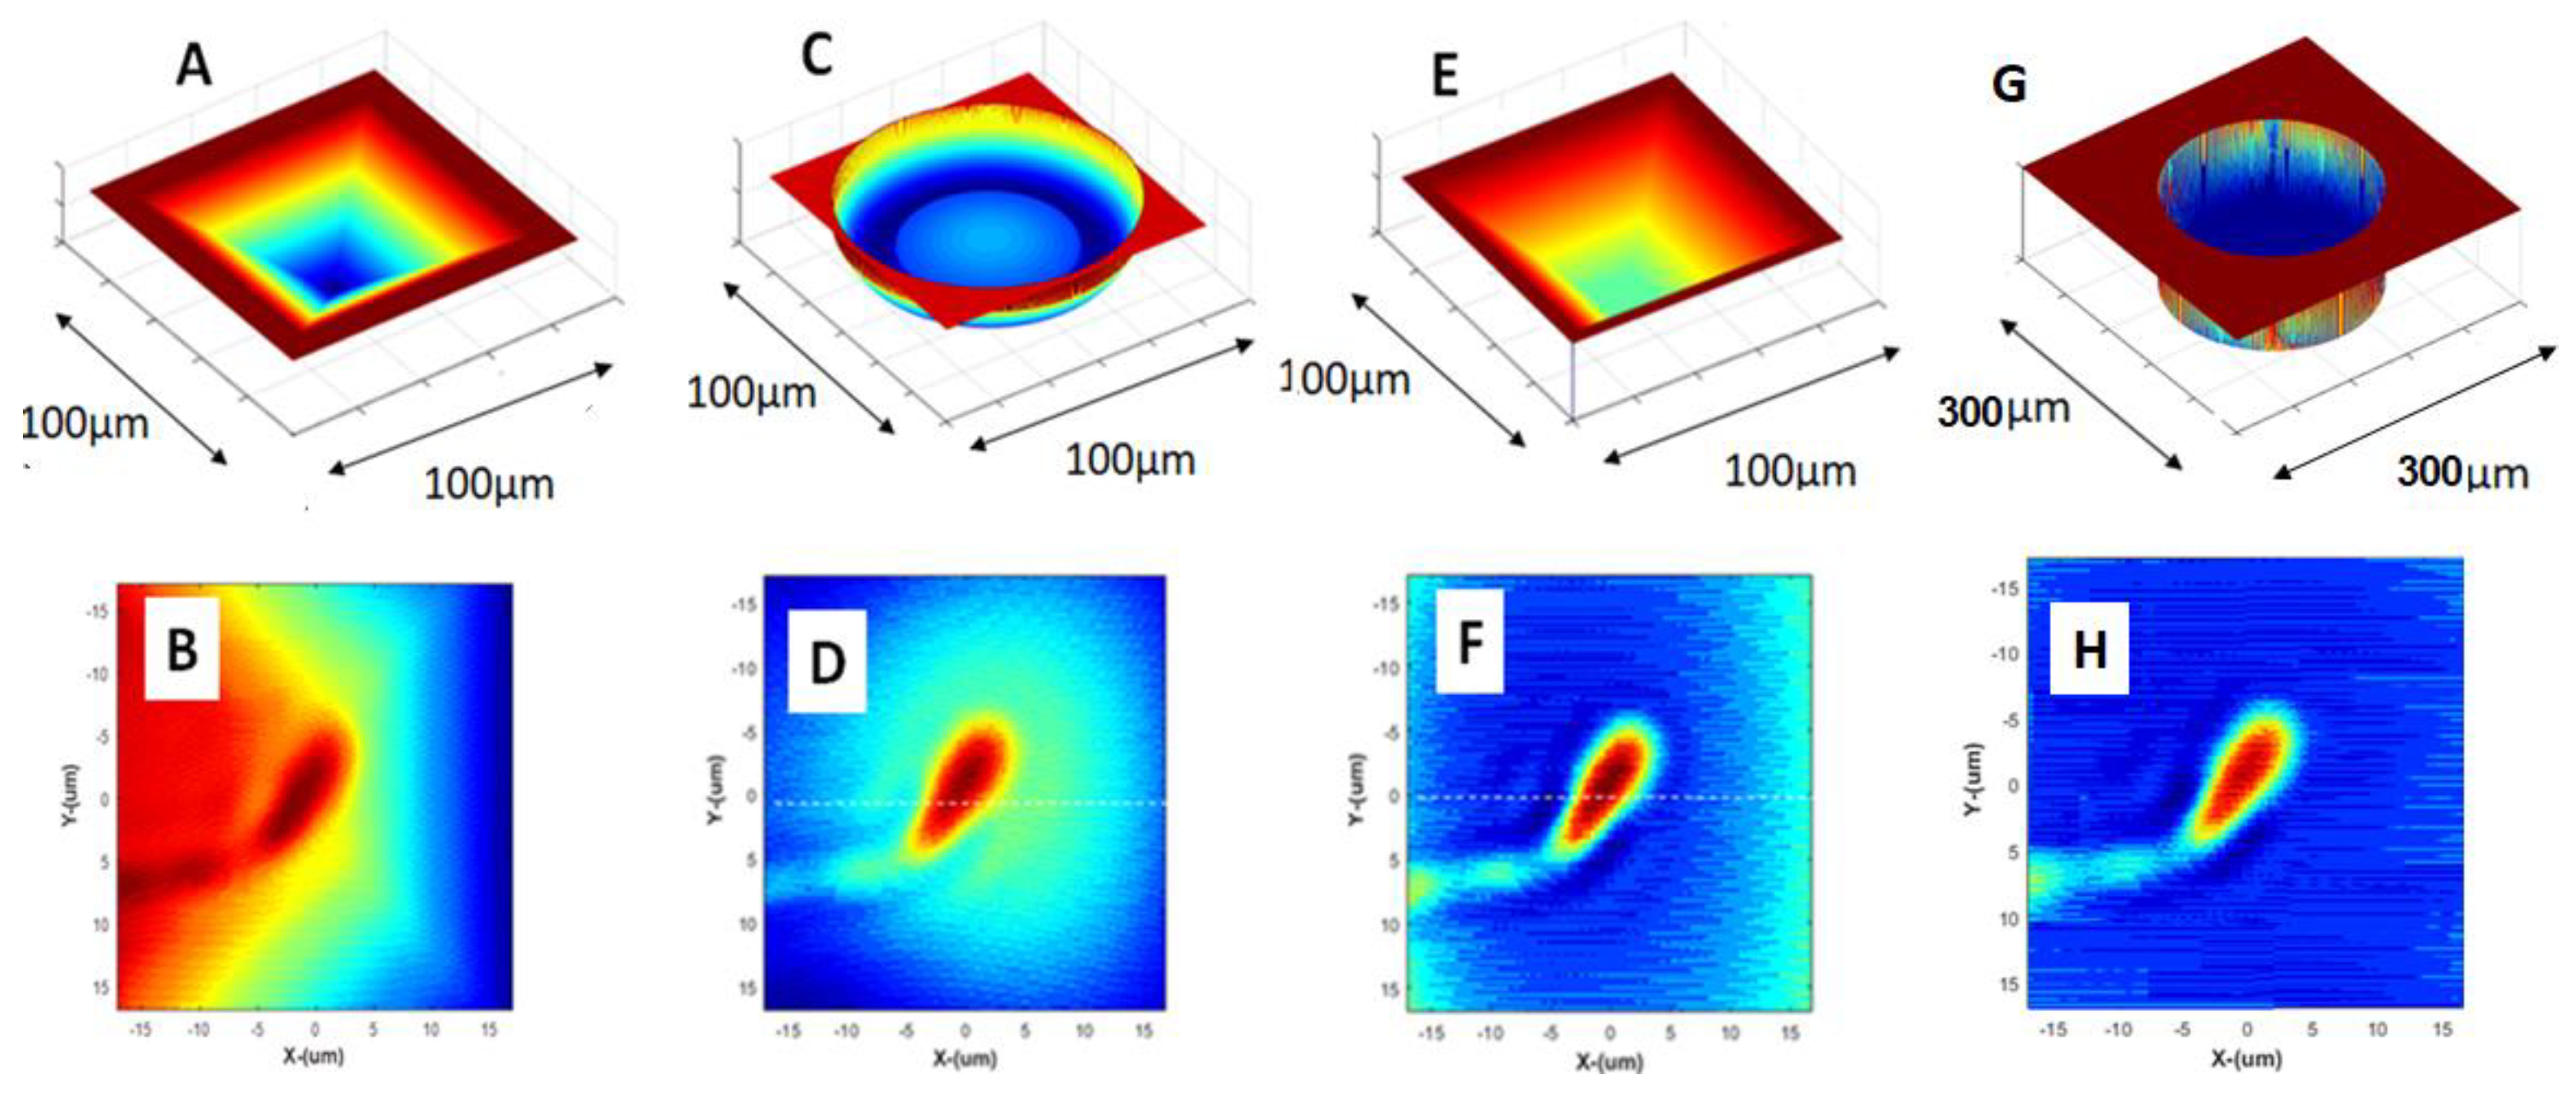
The main effect the ANLC could be on the wave front aberrations and deviations induced by the irregular shape of its walls and bottom. To check the effect of these aberrations, we examined the effects of four ANLC designs on the quality of the phase shift extracted by the interference microscope (Figure. 5). These four designs were: A. pyramidal walls with the tip having dimensions of about 10 µm, C. cylinder with a concave bottom, E. ANLC in the shape of a truncated pyramid with the tip having typical dimensions of about 80 µm, and G. cylinder with flat bottom.
Figure 5 presents these four types of ANLC and the corresponding images of sperm cell phase distribution expected to be extracted by the interferometer microscope. In B, a considerable halo is seen around the area of interest when compared to the actual or original phase distribution as in Figures 5F and 5H. Although with the spherical bottom ANLC (5C), the halo is less pronounced in 5D, it still has a blurring effect on the extracted image when compared to 5F and 5H, (E) and (G) the cylindrical ANLC where the retrieved phase distribution does not have these significant distortions.
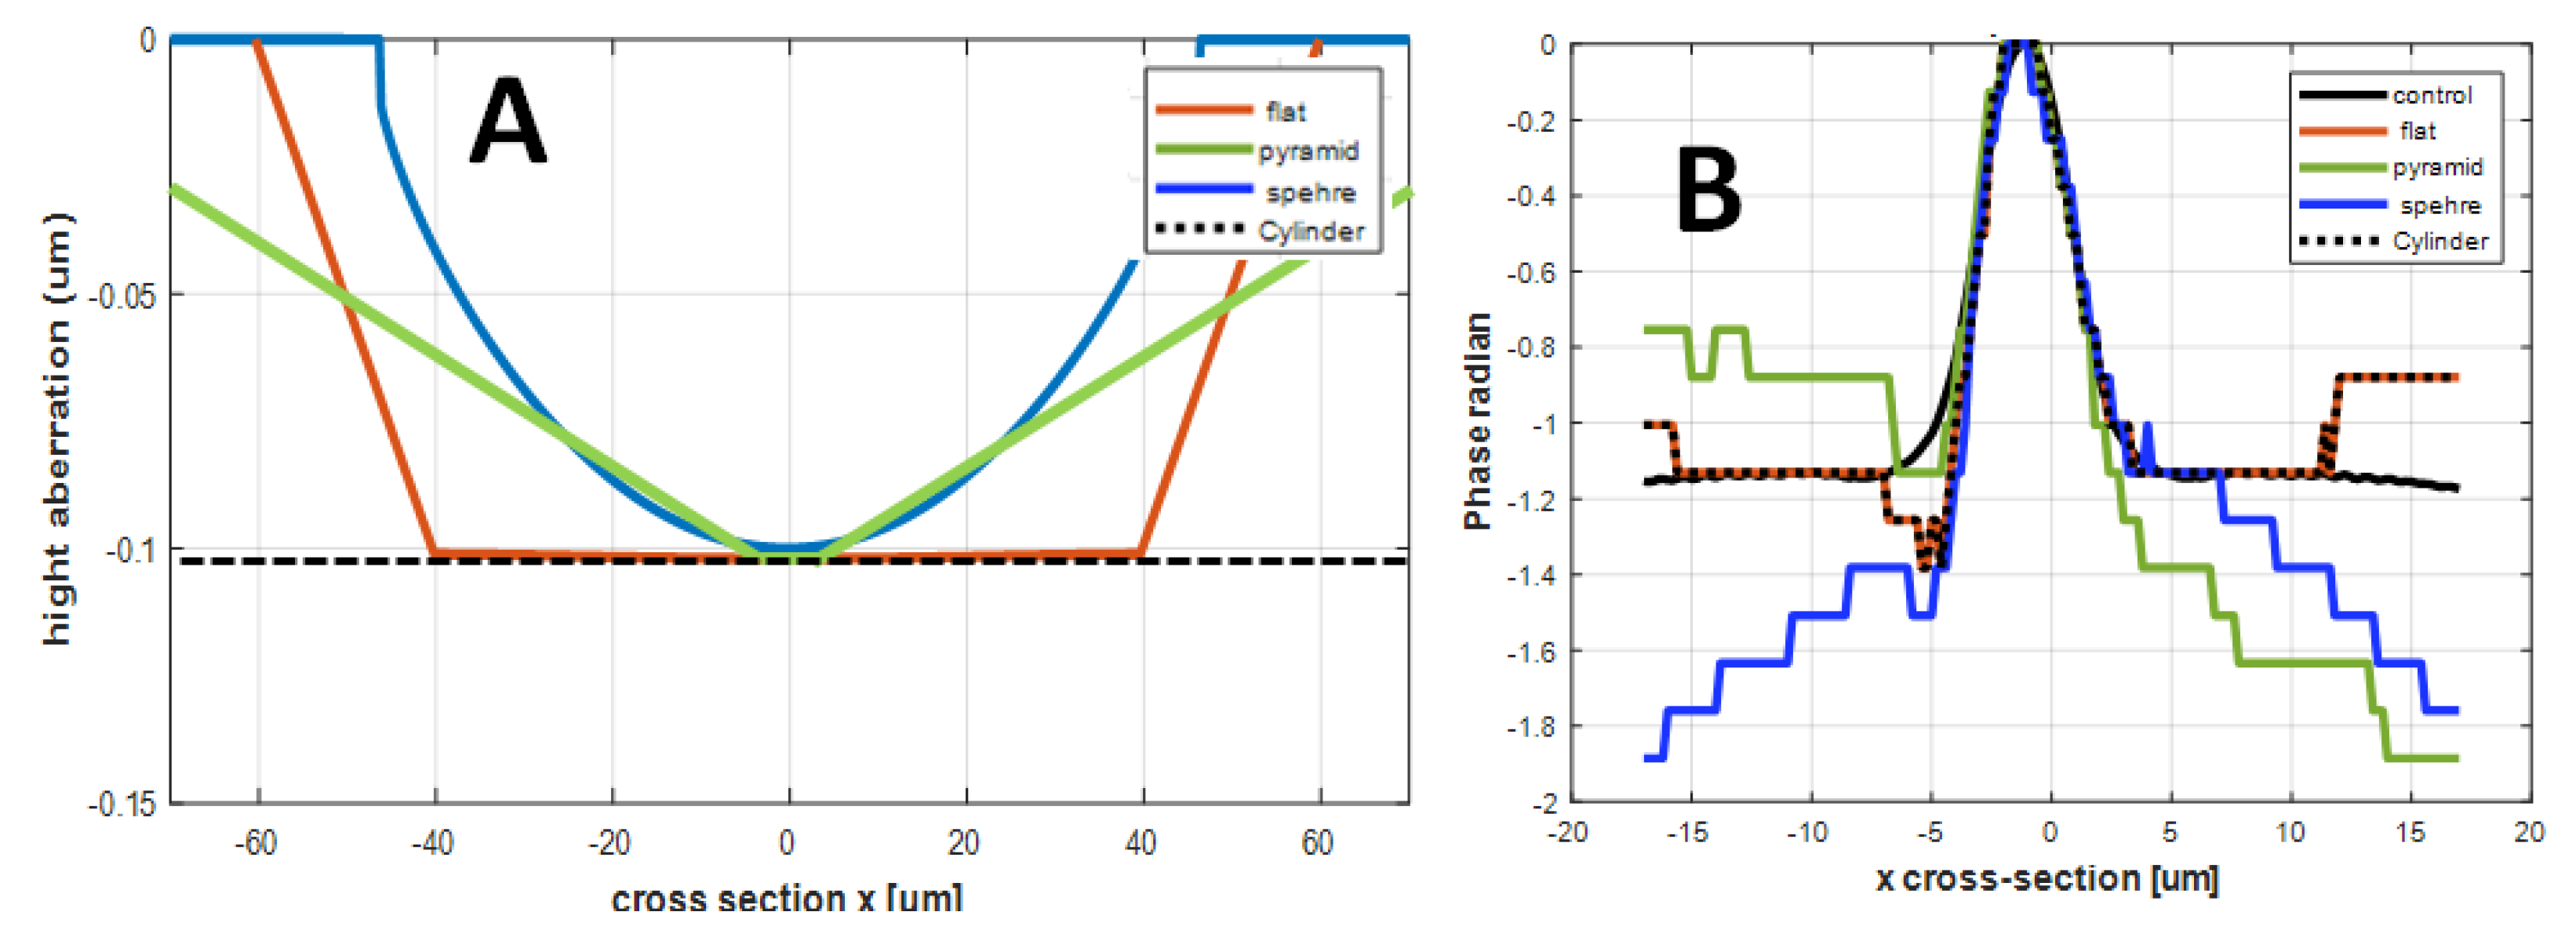
Figure 6 shows numerical examples of these four ANLC designs. The geometrical cross-section of the micro-well optical paths of the designs are presented in
Figure 6A. 6B presents the distributions of the cross-sections corresponding to the retrieved phases along the x-axis. The retrieved phase cross-section of the flat design matches the actual values, but the one obtained for the hemi-spherical micro-well has significant deviations and distortions with respect to the actual set of values.
2.10. Physical Summary of Tolerance
The simulation system presented in this work was designed to study the expected phase extraction of an interference microscope system in the four ANLC designs carrying a model of a typical sperm cell. The microscope system’s performance in the different ANLC clearly shows blurring and distortions caused by the optical properties (i.e., shape, size, etc.) of the ANLC designs. The flatness of the ANLC is a critical parameter, where the area illuminated by the beam was much larger than the sperm cell itself. However, the best performance was found with a flat bottom, cylindrical ANLC, which was consequently used in this study.
2.11. Software to Analyze Sperm Cell Mobility
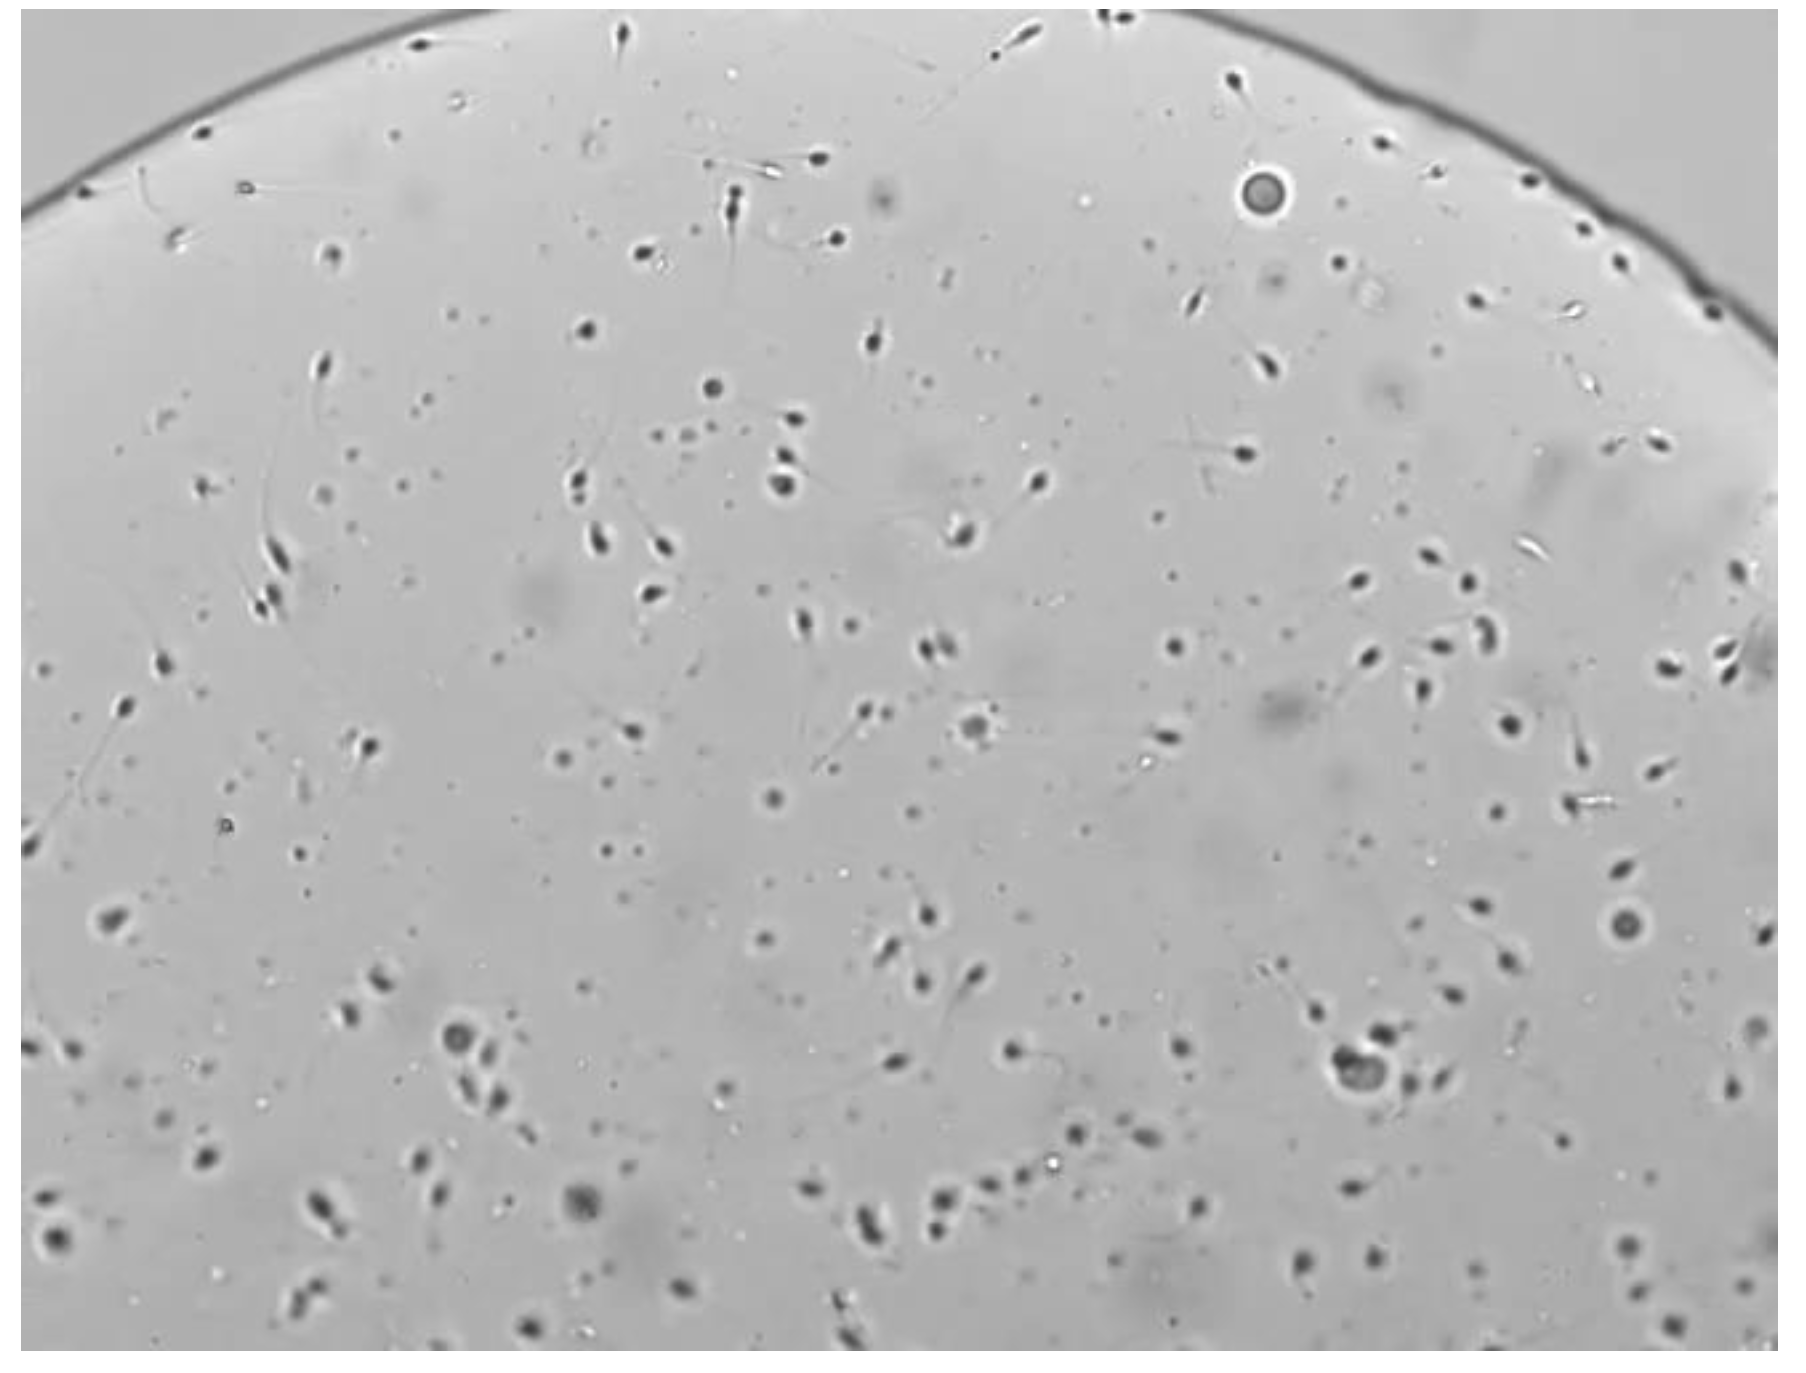
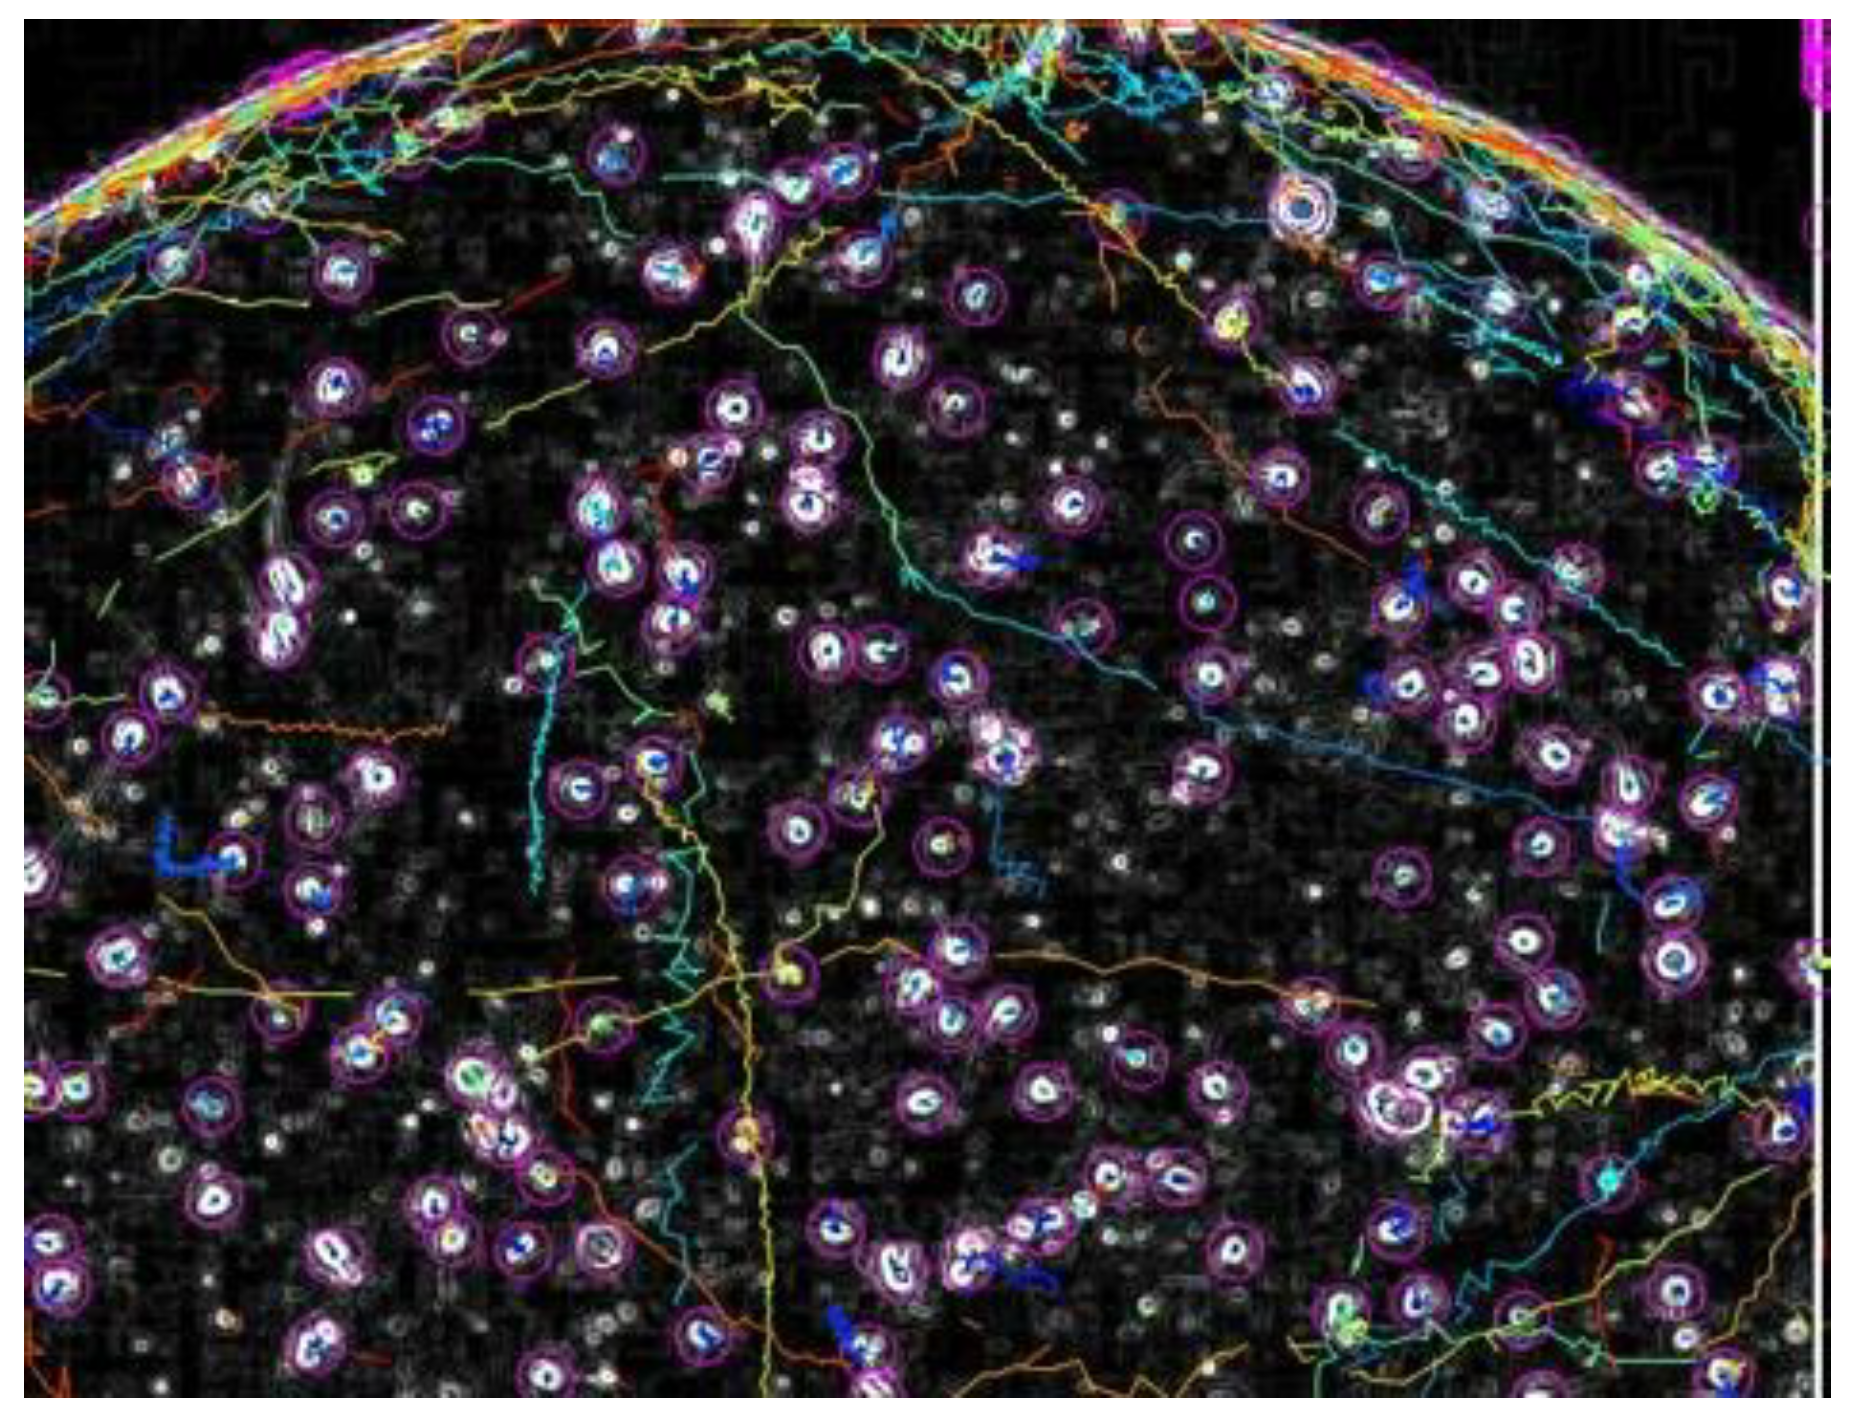
To obtain the best statistical information for dozens or hundreds of motile sperm cells in a droplet, a novel software was developed to analyze sperm cell mobility, based on a convolutional neural network. The software tracks a video clip taken under a microscope, learns to identify sperm cells, and tracks their route. It outputs the percentage of motile cells and their average velocity. The software was designed to provide highly accurate and detailed insights into sperm function. It incorporates several key features:
1) Precise Measurements: Calculations are performed in micrometers, with framerate and pixel size factored in, for high-resolution analysis.
2) AI-Powered Object Detection: A pre-trained convolutional neural network model enables accurate detection of individual sperm cells.
3) Motion Tracking: The software tracks sperm movement paths across sequential image frames, identifies sperm cells and head-tail orientation.
4) Data Filtering: The software removes immotile and abnormally motile sperm, to enhance data quality and focus on viable cells.
5) Involuntary Movement Analysis: Involuntary movements deviating significantly from the sperm's axis are identified and quantified. The external (collective) motion measured is subtracted from the total velocity of the cell.
6) The times when a cell enters and leaves the field of view are recorded and evaluated accordingly.
7) Robust Metrics: The software calculates the percentage of progressively motile sperm and average speeds, providing key indicators of sperm quality.
The software is designed to provide the following information:
Identify sperm cell and head-tail orientation
- -
detect movement towards the head, ignoring movement that is not forward
- -
detect external flow motion subtract it from the total velocity of the cell.
- -
recognize the point in time when objects enter and leave the image focus and calculate only the time in which the image is displayed in the clip; thus, the clip will be weighted according to time.