
Submitted:
03 February 2026
Posted:
06 February 2026
You are already at the latest version
Abstract
Accurate forecasting of photovoltaic (PV) power generation is essential for maintaining smart grid stability and supporting efficient renewable energy management. This study presents a hybrid deep learning framework that integrates one-dimensional convolutional neural networks (1D-CNNs), multi-head attention mechanisms, and long short-term memory (LSTM) networks to enhance short-term PV power prediction performance. Within the proposed architecture, the 1D-CNN component captures localized high-frequency temporal patterns, while the multi-head attention module models long-range contextual dependencies across time. The LSTM network subsequently learns the sequential dynamics governing PV power generation. To improve robustness and generalization, cyclical time-based features reflecting diurnal and seasonal characteristics are incorporated, and a systematic hyperparameter optimization strategy is employed. The proposed model is evaluated using real-world meteorological and PV power generation datasets collected from Gwangyang Port and the Dangjin Landfill Solar Power Plant in South Korea. Experimental results demonstrate that the proposed hybrid framework consistently outperforms conventional single-model baselines and alternative deep learning architectures. Notably, it achieves lower mean absolute error (MAE) and root mean square error (RMSE), along with a higher coefficient of determination (R²), indicating superior predictive accuracy and explanatory capability. Furthermore, model interpretability is enhanced through SHapley Additive exPlanations (SHAP), which quantify the relative contributions of key meteorological variables to PV power output. This interpretability analysis provides transparent insights into model behavior and supports informed decision-making for advanced energy management and smart grid operation.
Keywords:
photovoltaic power forecasting
; one-dimensional convolutional neural networks
; multi-head attention mechanisms
; long short-term memory networks
; explainable artificial intelligence
; smart energy management platforms
1. Introduction
As contemporary urban environments transition toward smart city paradigms, the incorporation of data-driven intelligence into renewable energy forecasting, photovoltaic power optimization, and sustainable infrastructure development has emerged as a central research priority, while continued advancements in transportation management and resource allocation remain equally essential. Early investigations in this area primarily addressed pedestrian safety, demonstrating that vision-based analytical approaches could effectively identify potential risks at unsignalized crosswalks [1]. Building upon these initial findings, subsequent studies introduced multi-dimensional analytical frameworks—most notably online analytical processing combined with data cube structures—to reveal latent behavioral patterns and support proactive pedestrian risk assessment [2]. With the rapid growth in the volume and complexity of urban data, automated techniques for extracting object-level behavioral features were developed, enabling more precise and fine-grained safety evaluations [3]. The emergence of deep learning methodologies represented a decisive shift in this research trajectory, substantially enhancing predictive and analytical capabilities. Deep learning–based models improved the accuracy of urban traffic accident risk estimation [4], while edge-vision architectures facilitated real-time vehicle–pedestrian risk prediction and early warning generation [5]. Policy-oriented analyses, including evaluations of reinforced school zone regulations, further provided empirical evidence of their effectiveness in enhancing pedestrian safety outcomes [6].
Beyond pedestrian-centered scenarios, researchers began integrating visual cues with community-level environmental variables to strengthen motorcycle crash and casualty prediction models, thereby expanding the scope of data-driven safety interventions [7]. In parallel, advances in trajectory collection and reconstruction techniques improved the reliability of behavioral datasets used in urban surveillance and safety analysis [8]. Investigations into walkability and infrastructure design highlighted the influence of crosswalk delays and zoning configurations on pedestrian accessibility and movement patterns [9]. As methodological sophistication increased, deep learning applications evolved from retrospective accident prediction toward preventive frameworks emphasizing early-stage risk mitigation [10]. Recent innovations, including asymmetric long-term graph-based multi-attention networks, have demonstrated strong capability in capturing complex spatiotemporal dependencies for long-horizon traffic speed forecasting [11]. The integration of data cube analytics with predictive modeling approaches further refined collision risk estimation between vehicles and pedestrians [12], deepened insights into interactive behaviors at unsignalized crosswalks [13], and enabled predictive identification of high-risk collision zones [14]. Complementary deep learning techniques—such as vision-based object recognition [15] and human movement classification using acceleration signals [16]—have underscored the flexibility of these models in interpreting heterogeneous urban mobility contexts.
The applicability of deep learning frameworks has also expanded into sustainability-oriented urban development. For example, stacking-based deep transfer learning approaches have enhanced short-term building energy forecasting across varying seasonal conditions and occupancy schedules [17]. Optimization-driven methodologies have supported the selection of energy-efficient construction materials tailored to regional climates [18], while three-dimensional spatial data extraction has informed data-driven urban planning strategies [19]. Additionally, the combination of data cube analysis and association rule mining has revealed complex energy consumption patterns in commercial buildings, enabling more strategic energy management decisions [20]. Beyond the built environment, deep learning techniques have been successfully applied in diverse domains, including stress detection in animal populations, illustrating their broad cross-domain adaptability [21]. Continued refinement of vision-based analytics has allowed for more detailed assessments of pedestrian risk under dynamic environmental conditions [22]. Emerging transportation concepts, such as urban air mobility, have likewise benefited from deep learning through computationally efficient vision-based approaches for in-flight risky behavior recognition [23]. Finally, advances in sensor-driven modeling—such as monovision-based vehicle cuboid estimation—have further demonstrated deep learning’s effectiveness in addressing complex three-dimensional geometric challenges in real-world urban environments [24].
Building upon these demonstrated capabilities, recent research attention has increasingly shifted toward applying deep learning techniques to sustainability-critical domains, particularly renewable energy systems, where accurate solar resource forecasting is indispensable for maintaining the stability and operational efficiency of smart city infrastructures. Among the diverse components that underpin smart city sustainability, the reliable integration of renewable energy sources remains a core challenge. Solar energy, owing to its environmental advantages and widespread availability, plays a pivotal role in achieving long-term energy resilience. Nevertheless, forecasting solar irradiance and photovoltaic power generation continues to pose substantial difficulties, arising from strong nonlinear relationships, long-range temporal dependencies, and pronounced sensitivity to heterogeneous meteorological conditions. Prior studies have shown that deep learning models incorporating self-attention mechanisms can significantly improve photovoltaic power forecasting accuracy [25]. Despite these advances, existing approaches often fall short in simultaneously addressing local temporal variations, global contextual dependencies, and the need for interpretability required in operational energy systems. To translate forecasting improvements into stable grid operations and trustworthy decision support, hybrid modeling strategies are therefore required—ones that can effectively fuse complementary deep learning architectures while providing transparent explanations of model behavior.
To address this need, this study proposes a hybrid deep learning framework that integrates one-dimensional convolutional neural networks, multi-head attention mechanisms, and long short-term memory networks. The proposed Trend–Context Fusion Network is designed to exploit the complementary strengths of these architectures and makes three primary contributions.
- First, the proposed framework enhances photovoltaic power forecasting accuracy through a dual-path modeling strategy. One-dimensional convolutional neural networks are employed to extract localized high-frequency temporal trends, while the multi-head attention module captures long-range contextual dependencies across time. These representations are subsequently processed by long short-term memory layers to model sequential dynamics and effectively accommodate complex meteorological variability.
- Second, model robustness and generalization are improved through advanced temporal feature engineering and systematic hyperparameter optimization. In particular, cyclical time encoding is incorporated to reflect diurnal and seasonal patterns, while the optimization strategy enables adaptive learning of site-specific characteristics, as demonstrated using datasets from Gwangyang Port and the Dangjin Landfill Solar Power Plant.
- Third, the proposed framework explicitly addresses the interpretability requirements of real-world energy management platforms by integrating Shapley additive explanations. This approach moves beyond conventional black-box prediction paradigms by enabling quantitative assessment of the influence of individual meteorological variables on photovoltaic power output. As a result, facility operators and system managers can gain transparent, actionable insights to support informed and reliable decision-making in smart city energy systems.
By synthesizing insights from prior research in urban safety, energy management, mobility behavior analysis, and advanced data analytics, this study contributes a robust, scalable, and interpretable solution for optimizing renewable energy integration within smart cities. The proposed approach aligns data-driven modeling with the broader objectives of sustainable, intelligent, and resilient urban development.
The remainder of this paper is organized as follows. Section 2 reviews related work on renewable energy forecasting. Section 3 details the proposed hybrid architecture, including the convolutional, attention-based, and recurrent components, together with explainable artificial intelligence techniques. Section 4 describes the experimental design, empirical datasets, and comparative evaluation results. Finally, Section 5 concludes the paper by summarizing the main findings and outlining directions for future research.
2. Related Work
In smart city environments, energy forecasting increasingly operates as a platform capability that supports operational decision-making, resource allocation, and reliable service delivery for both providers and end users. Early research in this space concentrated on building-level electricity consumption forecasting using ensemble machine learning, with an explicit focus on transparency through explainable artificial intelligence (XAI) to clarify feature influence and improve trust in practical use cases [26,27,28]. Subsequent studies expanded these foundations through deployable forecasting pipelines, including stacking-based ensembles, cold-start handling, and comparative analyses of forecasting architectures in realistic building-demand settings [29,30,31,32,33,34]. Beyond model design, real-world operation constraints also motivated work on household behavior analytics for demand prediction [35] and hybrid deep learning–based forecasting within building energy management systems [36], reinforcing that forecasting performance must be compatible with continuous service operation rather than offline evaluation alone. As deployment settings became more demanding, research attention shifted toward factors that typically degrade platform reliability, including demand volatility, missing or corrupted measurements, and heterogeneous usage patterns across facilities. In response, online learning strategies were explored to maintain robustness under non-stationary consumption profiles and evolving user behavior [37]. Complementary work on training-data generation and incremental evaluation further highlighted that stable forecasting depends not only on the predictor but also on how data are prepared and tested under operational constraints [38]. Missing-data imputation, which is often unavoidable in real monitoring streams, was also treated as a first-order requirement because errors introduced upstream can propagate directly into forecasting services [39]. Together, these studies support the view that scalable short-term load forecasting is best approached as an integrated platform workflow rather than as a single isolated model.
With richer time-series streams available, deep learning (DL) methods became increasingly practical for modeling nonlinear temporal structure in energy data. Convolutional neural networks (CNNs) were adopted to extract local temporal patterns, while recurrent neural networks (RNNs) were used to represent sequential dependencies. Advanced recurrent units—such as long short-term memory networks (LSTMs), bidirectional LSTMs (BiLSTMs), and gated recurrent units (GRUs)—were frequently employed to capture long-range dependencies in multistep forecasting, including combinations such as CNN–BiLSTM hybrids and attention-based GRU models [40,41]. Other DL variants, such as recurrent inception–style CNN formulations, further demonstrated the value of architectures that jointly model temporal locality and longer-range structure in load forecasting tasks [42]. Temporal convolutional networks (TCNs) also appeared as an alternative family for sequence learning in related forecasting pipelines, offering another route to stable temporal modeling under deployment-oriented constraints [25,36]. These methodological developments extend naturally to renewable generation forecasting, where prediction errors can propagate into scheduling and platform-level control decisions. In photovoltaic (PV) power forecasting, recent work increasingly emphasizes robustness-oriented design choices that align with operational deployment. For example, two-stage neural network optimization strategies with automated tuning were proposed to improve PV forecasting reliability under real-world variability [43]. Attention-based modeling has also gained prominence; in particular, a PV forecasting approach integrating one-dimensional CNNs (1D-CNNs) with Transformer architectures provides a direct precedent for using global context modeling in multistep PV prediction [44]. Alongside performance, interpretability has remained a recurring requirement when forecasts are used for operational decisions. Shapley Additive exPlanations (SHAP), for instance, have been used as an attribution mechanism in energy forecasting contexts to quantify how inputs contribute to predictions, supporting transparency in model-driven services [27,45].
Broader studies on solar-related prediction and explainable modeling further reinforce the practical demand for transparent forecasting components within energy platforms, even when the specific target differs across tasks [46,47,48,49]. In addition, surveys of smart energy monitoring systems position forecasting as one component within a wider platform stack, where reliability and interpretability affect system-level adoption [50]. Despite this progress, existing approaches often struggle to satisfy competing deployment requirements simultaneously—capturing fine-grained temporal variation, remaining stable under volatile PV output regimes, and producing explanations that are actionable for stakeholders. Motivated by these gaps, our study develops a hybrid DL framework that explicitly combines 1D-CNN, multi-head attention (MHA), and LSTM modules, and integrates SHAP-based XAI to provide transparent, platform-ready PV power forecasting suitable for scalable smart city energy services.
3. Materials and Methods
3.1. Data Sources and Study Sites
This study develops and validates a robust, explainable forecasting model using empirical data from two solar power generation sites in South Korea. Because the sites differ in both geography and operating environment—one situated near a coastal logistics hub and the other deployed on a landfill-based installation—the evaluation is designed to probe how well the proposed deep learning framework transfers across distinct conditions, while also highlighting its potential scalability.
- The first dataset was obtained from the Dangjin Landfill Solar Power Plant in Chungcheongnam-do, South Korea. This inland facility is built on reclaimed land, where PV output can be affected by ground-related thermal effects and site-specific microclimatic phenomena, including fog. The dataset covers a five-year period (2015–2019) and consists of hourly PV power generation records (kW) together with a set of meteorological measurements.
- The second dataset comes from the Gwangyang Port Solar Power Station in Jeollanam-do, South Korea. In contrast to Dangjin, this coastal site is shaped by maritime weather dynamics, such as sea-breeze circulation, elevated humidity, and fast-evolving cloud fields. Data were collected over the same five-year window (2015–2019), enabling a consistent cross-site comparison under a unified temporal scope.
Across both sites, the input features include major meteorological variables commonly used in solar power analysis, including temperature, humidity, wind speed, barometric pressure, sunshine duration, insolation, and cloudiness. Table 1 summarizes the variables used as model inputs.
3.2. Data Preprocessing and Feature Engineering
3.2.1. Handling Missing Values and Normalization
Sensor-derived datasets collected in real-world environments are inevitably subject to missing values and occasional anomalies, often caused by equipment maintenance, temporary sensor malfunction, or communication interruptions. In the Gwangyang dataset, small gaps were observed in the Solar_Power time series. To preserve temporal consistency while avoiding the introduction of artificial discontinuities, these missing observations were reconstructed using linear interpolation. This approach provides smooth transitions between adjacent measurements and is well suited for short, isolated gaps in time-series data. After addressing missing values, feature scaling was applied to all independent input variables, including temperature, wind speed, and insolation. Specifically, standard scaling was used to transform each variable to a normalized distribution with zero mean and unit variance. This normalization step is essential for deep learning–based models, as it ensures that input features with larger numerical ranges do not disproportionately influence gradient updates during training, thereby stabilizing convergence and improving learning efficiency. Notably, the target variable (Solar_Power) was retained in its original scale (kW) without normalization to directly preserve the interpretability of absolute error metrics during evaluation.
3.2.2. Handling Missing Values and Normalization
Solar power generation exhibits pronounced periodic behavior driven by daily and seasonal cycles. However, representing temporal variables using simple integer encodings—such as hours ranging from 0 to 23 or days from 1 to 365—fails to reflect the circular nature of time. For example, 23:00 and 00:00 are numerically distant despite being temporally adjacent, which can hinder a model’s ability to learn smooth temporal transitions.
To address this limitation, temporal features were encoded using a cyclical representation based on sine and cosine transformations. As shown in Equations (1) to (4), the day of the year and hour of the day were each mapped onto two-dimensional continuous coordinates:
where d denotes the day of the year, h represents the hour of the day, and D is set to 365 for non-leap years and 366 for leap years. This cyclical encoding enables the model to explicitly capture the continuity inherent in temporal cycles, allowing it to recognize that late-night and early-morning hours are closely related. As a result, the representation improves the learning of both diurnal and seasonal patterns that are fundamental to photovoltaic power generation dynamics.
Daysin = sin((2π × d) / D),
Daycos = cos((2π × d) / D),
Hoursin = sin((2π × h) / 24),
Hourcos = cos((2π × h) / 24),
3.3. Proposed Hybrid Architecture: Trend–Context Fusion Network (TCFN)
Solar power generation time series exhibit two contrasting characteristics: rapid, short-term fluctuations driven by transient weather events (e.g., sudden cloud movement) and more stable, long-term regularities governed by the sun’s daily and seasonal trajectory. Models relying on a single architectural principle often struggle to represent both aspects simultaneously. To address this limitation, we introduce the Trend-Context Fusion Network (TCFN), a hybrid architecture specifically designed to separate and subsequently integrate these heterogeneous temporal behaviors.
As shown in Figure 1, the TCFN adopts a dual-stream structure rather than a simple layer-stacking strategy. Local temporal patterns are captured using 1D-CNN, broader temporal dependencies are identified through MHA, and sequential evolution is modeled using LSTM. This combination enables the network to respond to fine-grained variability while maintaining awareness of overarching daily trends in solar power generation.
3.3.1. Dual-Path Processing: Integrating Local Trends and Global Context
The defining feature of the TCFN is its parallel processing mechanism, in which the same input sequence (the previous 24 hours) is analyzed through two complementary pathways.
- Path A: Local Trend Extraction via 1D-CNN—Short-term PV output often changes abruptly within narrow time windows due to localized atmospheric effects. In this pathway, 1D-CNN with a kernel size of 3 and Swish activation serves as a localized feature extractor, emphasizing high-frequency temporal variations. This operation is particularly effective for identifying sudden drops or spikes in power output associated with transient cloud cover or wind-driven disturbances. Batch normalization and dropout are applied to stabilize training and reduce sensitivity to noise, allowing the model to focus on meaningful short-term patterns rather than spurious fluctuations.
- Path B: Global Context Modeling via MHA—While 1D-CNN excels at capturing localized behavior, it does not explicitly account for long-range temporal relationships. MHA addresses this limitation by evaluating dependencies across all time steps in the input sequence, irrespective of temporal distance. Through this mechanism, the model can associate conditions observed earlier in the day with later power generation outcomes, such as linking morning atmospheric conditions to afternoon peak output. By assigning adaptive weights to different time steps, the attention module encodes a global view of daily operating conditions rather than treating each observation in isolation.
3.3.2. Feature Fusion and Sequential Forecasting
The outputs from the 1D-CNN and attention pathways are concatenated to form a unified feature representation that combines short-term variability with long-range contextual information. This fused representation is then passed to the LSTM layer, which models temporal dependencies through its internal memory structure. By maintaining a hidden state across time, the LSTM integrates information about recent fluctuations and overall daily context to predict the subsequent evolution of power generation. In effect, the LSTM captures how immediate volatility and broader conditions jointly influence near-term output. The final prediction is produced by a dense layer using the Swish activation function, followed by a final output layer with a ReLU activation function, which maps the learned representation to the target PV power output (kW).
3.3.3. Enhancing Reliability Through Explainable AI
For applications involving critical infrastructure such as smart grids, predictive accuracy alone is insufficient if the decision-making process remains opaque. To enhance trust and operational reliability, SHAP is incorporated into the TCFN framework as a post-hoc explainability tool. Rather than altering the model’s predictions, SHAP quantifies the contribution of each input variable to a given forecast. For example, it can indicate whether a predicted reduction in output is primarily attributable to elevated humidity during late morning hours rather than to temperature effects. By presenting these contributions through feature importance visualizations and instance-level explanations, the framework enables operators to assess whether the model’s reasoning aligns with known physical behavior, thereby supporting informed validation and deployment in real-world energy management systems.
4. Results
4.1. Experimental Design
4.1.1. Data Partitioning and Implementation Environment
To assess the proposed TCFN, we used hourly PV power generation data collected from two South Korean sites—Dangjin Landfill and Gwangyang Port—covering a five-year period (2015–2019). To avoid information leakage and to mirror a realistic forecasting workflow, the datasets were separated strictly by time:
- Training set (2015–2017): used for model fitting and parameter learning.
- Validation set (2018): used for hyperparameter selection and for determining the effective training duration via early stopping.
- Test set (2019): reserved exclusively for the final evaluation.
After selecting hyperparameters and identifying the best epoch using the validation set, we followed a retraining strategy: the model was trained again using the combined training and validation period (2015–2018) and then evaluated once on the held-out test year (2019). This procedure increases data utilization and helps the final model reflect more recent site-specific weather patterns before test-time inference.
All experiments were carried out in Google Colab with GPU acceleration (NVIDIA Tesla T4) using Python 3.8. Model implementation relied on TensorFlow 2.x and Keras, while Scikit-learn was used for feature scaling and metric computation. Reproducibility was enforced by fixing the random seeds for both NumPy and TensorFlow to 42. For preprocessing, all independent variables were standardized using standard scaling, whereas the target variable (PV power generation) was kept in its original unit (kW) without normalization to preserve the direct interpretability of absolute-error measures. Post-hoc interpretability was conducted using the SHAP library.
4.1.2. Hyperparameter Optimization Strategy
To obtain a configuration that balances convergence and generalization, we performed a structured grid search under four predefined experimental regimes: Light_Fast, Standard_Balanced, Deep_Slow, and Deep_Robust. These regimes differ in model capacity (number of LSTM units), learning rate, and regularization strength (dropout rate), enabling a controlled exploration of the accuracy–stability trade-off. Based on this search, the Deep_Robust configuration was selected as the optimal regime for both the Dangjin and Gwangyang datasets. Model training used the Adam optimizer and mean squared error (MSE) as the loss function. Across all convolutional and dense layers, we adopted the Swish activation function instead of commonly used ReLU or SELU, as it showed more favorable empirical behavior within the proposed hybrid architecture. During validation, early stopping was applied with a patience of 5 epochs and restore_best_weights was enabled so that the model retains parameters from the epoch that achieved the minimum validation loss rather than from the last training epoch. After hyperparameter selection, a retraining strategy was employed: the Dangjin model was re-trained for 5 epochs, whereas the Gwangyang model converged more rapidly and was re-trained for 2 epochs. The final hyperparameter choices and the corresponding search space are summarized in Table 2.
4.1.3. Evaluation Metrics
Forecast accuracy was evaluated using three complementary regression metrics: mean absolute error (MAE), root mean square error (RMSE), and the coefficient of determination (R²) score, as defined in Equations (5)–(7), respectively. MAE (Equation (5)) summarizes the average absolute deviation between predictions and observations, whereas RMSE (Equation (6)) penalizes larger errors more strongly, which is particularly relevant when occasional large deviations can be operationally costly. R² (Equation (7)) quantifies how much of the variance in the observed series is explained by the model relative to a mean baseline.
where yₜ denotes the observed power generation, ŷₜ is the prediction at time t, ӯ is the mean of the observed values, and n is the number of test samples.
MAE = (1 / n) × Σ| yₜ − ŷₜ |,
RMSE = √ [(1 / n) × Σ (yₜ − ŷₜ)²],
R² = 1 − [Σ (yₜ − ŷₜ)² / Σ (yₜ − ӯ)²],
4.2. Experimental Results
4.2.1. Experimental Results and Benchmark Comparison
To rigorously assess the predictive capability of the proposed TCFN, a benchmark study was conducted against eight representative deep learning models: RNN, LSTM, GRU, BiLSTM, 1D-CNN, 1D-CNN-BiLSTM, Attention-GRU, and TCN. For consistency, all baseline models were trained and evaluated under the same experimental protocol and shared hyperparameter configuration (i.e., the Deep_Robust setting described in Section 4.1). All performance comparisons were conducted on the held-out test set corresponding to the year 2019, ensuring that the evaluation reflects a realistic forecasting scenario using unseen future data. This design choice ensures that performance differences can be attributed to architectural characteristics rather than configuration-induced bias. The comparative outcomes for the Dangjin Landfill and Gwangyang Port datasets are reported in Table 3. Model performance was evaluated using RMSE, MAE, and R².
As summarized in Table 3, TCFN achieved the most favorable performance across both datasets, indicating strong generalization capability under differing geographical and meteorological conditions.
- Accuracy across heterogeneous environments: For the Dangjin dataset, TCFN recorded the lowest error levels (RMSE: 86.37, MAE: 39.49) along with the highest R² value (0.883). These results represent a clear improvement over conventional recurrent architectures such as RNN and LSTM, underscoring the advantage of the dual-path design in capturing localized temporal variations while maintaining sequence awareness. The performance advantage becomes more evident in the Gwangyang dataset, where coastal weather introduces pronounced volatility. In this setting, several deep architectures—including 1D-CNN-BiLSTM (RMSE: 152.55) and LSTM (RMSE: 279.14)—exhibited degraded performance, likely due to convergence difficulties associated with unstable input sequences. In contrast, TCFN remained stable, achieving an RMSE of 89.60 and an R² of 0.954, demonstrating resilience under highly variable conditions.
- Effectiveness of the hybrid fusion strategy: Standalone 1D-CNN models produced competitive results (Dangjin RMSE: 86.80), confirming the importance of short-term feature extraction in solar power forecasting. However, TCFN further reduced prediction error by integrating attention-based context modeling and LSTM-based sequence learning, enabling it to capture dependencies beyond the receptive field of convolution alone. Compared with the Attention-GRU baseline (Gwangyang RMSE: 108.71), which relies primarily on attention for contextual representation, TCFN achieved a 17.6% reduction in RMSE at the Gwangyang site, highlighting the benefit of explicit trend–context fusion.
Overall, the experimental findings demonstrate that TCFN provides a robust and accurate forecasting framework. By jointly leveraging Conv1D for local pattern extraction, attention mechanisms for global context representation, and LSTM for sequential modeling, the proposed architecture delivers reliable performance for solar power forecasting, even under challenging and highly dynamic meteorological conditions.
4.2.2. Visualization of Forecasting Trends and Discussion
To provide an intuitive assessment of forecasting behavior, the predicted solar power outputs generated by the TCFN were visually compared with the corresponding ground-truth values over the first 200 hours of the 2019 test period. The visualization results for the Dangjin Landfill and Gwangyang Port datasets are presented in Figures 4 and 5, respectively. In both figures, the horizontal axis denotes time in hourly resolution, while the vertical axis represents solar power generation measured in kilowatts (kW).
Figure 2 illustrates the forecasting performance at the Dangjin site. The TCFN effectively captures the dominant diurnal pattern of solar power generation, accurately identifying both the initiation and cessation of generation associated with sunrise and sunset. During these transition intervals, the predicted outputs exhibit close agreement with the observed values. Minor deviations become noticeable around midday, particularly between approximately 12:00 PM and 2:00 PM on days characterized by elevated variability. Although the model continues to track the overall trajectory, it occasionally underestimates pronounced peak values observed on exceptionally clear days. This tendency can be attributed to a smoothing effect commonly observed in regression-oriented deep learning models, where minimizing aggregate error leads to conservative estimates in the presence of extreme but infrequent fluctuations.
Figure 3 presents the corresponding results for the Gwangyang Port site. Despite the pronounced variability introduced by coastal meteorological conditions, the TCFN maintains stable predictive performance. The estimated generation curve closely follows the observed trajectory, including abrupt power reductions associated with transient cloud cover. The model also preserves the underlying daily periodic structure with high fidelity. Nonetheless, under more complex atmospheric scenarios—such as intermittent or rapidly evolving cloud formations—small phase shifts or amplitude discrepancies can be observed. These effects suggest that, while the existing feature representation (including cyclical temporal encoding) is sufficient for modeling regular temporal dynamics, additional high-resolution weather information could further enhance accuracy during rapidly changing conditions.
Overall, the visualization analysis confirms that the Trend-Context Fusion Network successfully captures both short-term variability and long-term periodic structure in solar power generation across distinct geographic environments. Consistent predictive behavior at both the inland Dangjin facility and the coastal Gwangyang site highlights the model’s generalization capability under heterogeneous operating conditions. At the same time, the results reveal opportunities for refinement, particularly in relation to peak output estimation. The systematic underprediction of extreme values indicates a conservative bias when handling rare but high-magnitude events. To address this limitation, future work will focus on two complementary directions.
- First, integrating satellite-based cloud imagery could provide spatial context on cloud movement, enabling earlier detection of sudden irradiance changes.
- Second, adopting alternative objective functions—such as quantile-based or weighted loss formulations—may encourage the model to place greater emphasis on extreme observations, thereby improving predictive fidelity at the upper range of power generation.
4.3. SHAP-Based Explainability Analysis: Global Drivers and Instance-Level Attribution
4.3.1. Global Feature Importance (Site-Level Interpretation)
Figure 4 and Figure 5 summarize global feature importance using mean |SHAP| values, computed by averaging absolute SHAP magnitudes across both the test samples and the 24-hour input window. This aggregation provides a site-level view of which input variables most consistently influence the model output, independent of specific time lags.
For the Dangjin dataset (Figure 4), the most influential signals are dominated by cyclical time features—particularly Hour_cos and Hour_sin—followed by SteamPress and Insolation. This ranking indicates that the model relies strongly on the diurnal structure encoded in the time features while refining the magnitude of PV output using meteorological drivers. In practical terms, Dangjin forecasts appear to be anchored by “when in the day/year” the prediction is made, with irradiance- and moisture-related variables modulating deviations around that baseline.
In contrast, the Gwangyang dataset (Figure 5) shows a more weather-driven importance profile. Insolation dominates the ranking by a clear margin, and moisture/thermal indicators such as DewPoint, HighTemp, and wind-related inputs also appear among the top contributors. Compared with Dangjin, this pattern suggests that Gwangyang predictions depend less on purely periodic cues and more on short-term atmospheric conditions, which is consistent with the higher variability typically observed in coastal environments.
4.3.2. Local Explanation
Figure 6 and Figure 7 provide local explanations using SHAP waterfall plots for a representative test instance (sample_idx = 0). Here, each feature is time-stamped (e.g., Insolation_t9, Hour_cos_t22), indicating that the contribution is tied to a specific position within the 24-hour look-back window. The plots therefore complement the global ranking by revealing which lagged measurements drive a single prediction upward or downward relative to the baseline E[f(X)].
For Dangjin (Figure 6), the baseline is E[f(X)] = 86.75, and the prediction is pulled downward primarily by large negative contributions from Insolation_t9 and several Hour_cos terms (e.g., Hour_cos_t3, Hour_cos_t22, Hour_cos_t5). Smaller negative effects from Cloudiness_t8, HighTemp_t12, and Sunshine_t13 further reduce the output, while Insolation_t13 provides a limited positive offset. Taken together, this instance reflects a situation in which the temporal position (hour-phase) and reduced irradiance signals jointly explain a lower-than-average forecast, with many other lagged variables contributing only marginally (shown as “418 other features”).
For Gwangyang (Figure 7), the baseline is higher (E[f(X)] = 231.208), and the prediction is strongly decreased by moisture-related and seasonal/time components, including SteamPress_t18, DewPoint_t22, and Day_sin_t12, along with multiple irradiance terms (e.g., Insolation_t23, Insolation_t10, Insolation_t22) and hour-phase terms (e.g., Hour_cos_t22). A notable counteracting factor is HighTemp_t6, which contributes positively and partially compensates for the downward drivers. This decomposition highlights that, at Gwangyang, moisture and irradiance conditions at specific lags can dominate a single forecast, aligning with the more weather-sensitive global importance profile observed in Figure 5.
Overall, the SHAP results suggest a consistent division of explanatory roles: cyclical time features provide a stable periodic scaffold—especially prominent in Dangjin—while irradiance- and moisture-related variables account for deviations driven by transient weather. This combination supports the practical interpretability of TCFN, enabling operators to verify whether a forecast is primarily “time-of-day driven” or “weather-driven” on a case-by-case basis.
5. Conclusions
This study presented the TCFN, a hybrid deep learning framework designed for PV power forecasting under realistic, weather-driven variability. The core idea was to explicitly combine complementary modeling strengths within a single architecture: a 1D-CNN pathway to capture short-horizon, high-frequency fluctuations, an MHA pathway to emphasize globally relevant temporal context within the input window, and an LSTM module to integrate these representations into a coherent sequential forecast. To better align the inputs with the periodic structure of PV generation, cyclical time encoding was incorporated as part of feature engineering, and the evaluation protocol was defined using a strictly chronological split to reflect operational forecasting conditions (2015–2017 training, 2018 validation, and 2019 testing).
Across two empirically collected datasets from South Korea—Dangjin Landfill (inland) and Gwangyang Port (coastal)—TCFN demonstrated consistently strong predictive performance when compared with widely used deep learning baselines (RNN, LSTM, GRU, BiLSTM, 1D-CNN, 1D-CNN–BiLSTM, Attention-GRU, and TCN). Using the 2019 test set as a held-out evaluation year, TCFN achieved RMSE/MAE/R² of 86.37/39.49/0.883 for Dangjin and RMSE/MAE/R² of 89.60/43.07/0.954 for Gwangyang, indicating that the proposed fusion strategy generalizes well across geographically distinct operating regimes. The gap was particularly meaningful at the coastal site, where the model maintained stable performance despite rapid fluctuations, suggesting that jointly learning local trend cues and global context is more reliable than relying on a single modeling principle.
Beyond predictive accuracy, the study emphasized interpretability through SHAP-based explanations. Global importance analyses indicated that time-encoding features (e.g., hour-phase terms) play a strong anchoring role in some settings, while irradiance- and moisture-related variables dominate in others, reflecting site-dependent drivers of PV output. Instance-level waterfall explanations further clarified why specific predictions moved upward or downward relative to the baseline expectation, providing an auditable rationale that is better aligned with operational needs than purely “black-box” outputs. From a deployment perspective, this combination of accuracy and explanation supports more credible use in energy-management workflows, where operators must validate whether forecasts are consistent with physical intuition before acting on them.
At the same time, the results also reveal clear directions for improvement. Visual inspection suggested a mild conservative tendency around rare, high-magnitude peaks—an outcome that is common in regression settings when models minimize average error and effectively smooth extreme events. Future work will therefore focus on (1) enriching the input space with higher-resolution or spatially informative weather signals (e.g., cloud-motion proxies or satellite-derived features) to improve peak-time responsiveness, and (2) revisiting the learning objective by adopting quantile-based or weighted loss formulations that explicitly discourage systematic underestimation at the upper tail. Additional validation on broader climatic regions and longer operating periods would further strengthen claims of scalability and robustness, particularly for platform-level deployment where model behavior must remain stable across sites, seasons, and sensor idiosyncrasies.
Overall, the proposed TCFN offers a practical and transparent approach to PV power forecasting that balances short-term volatility tracking with longer-term periodic structure learning. By pairing a trend–context fusion architecture with SHAP-based explanations, the framework moves toward forecasting models that are not only accurate, but also operationally interpretable—an increasingly important requirement for reliable integration of renewable generation into smart-grid decision pipelines.
Supplementary Materials
Additional supporting files including source code, model implementation, hyperparameter settings, and benchmark results for this study are available at the GitHub repository: https://github.com/johnnyone89/TCFN4PVForecasting.
Author Contributions
Conceptualization, J.M.; methodology, Y.S. and J.M.; software, Y.S.; validation, Y.S. and J.M.; formal analysis, Y.S.; investigation, Y.S.; resources, J.M.; data curation, Y.S.; writing—original draft preparation, Y.S.; writing—review and editing, J.M.; visualization, Y.S.; supervision, J.M.; project administration, J.M.; funding acquisition, J.M. All authors have read and agreed to the published version of the manuscript.
Funding
This research was supported by Duksung Women's University Research Grants 2025.
Institutional Review Board Statement
Not applicable.
Informed Consent Statement
Not applicable.
Data Availability Statement
All data and code supporting the reported results are available at the GitHub repository: https://github.com/johnnyone89/TCFN4PVForecasting. Publicly archived datasets used in this analysis are referenced and linked within the repository documentation; if any data are unavailable due to restrictions, corresponding notes are included in the repository.
Acknowledgments
The authors would like to thank Seung-Min Lee, Vice President of POWER21 Corp., for his expert insights and valuable discussions, which contributed to the development and potential application of the technology presented in this paper.
Conflicts of Interest
The authors declare no conflict of interest.
References
- Noh, B.; Ka, D.; Lee, D.; Yeo, H. Vision-Based Potential Pedestrian Risk Analysis on Unsignalized Crosswalk Using Data Mining Techniques. Appl. Sci. 2020, 10, 1057. [Google Scholar] [CrossRef]
- Noh, B.; Yeo, H. SafetyCube: Framework for Potential Pedestrian Risk Analysis Using Multi-Dimensional OLAP. Accid. Anal. Prev. 2021, 155, 106104. [Google Scholar] [CrossRef] [PubMed]
- Noh, B.; Ka, D.; No, W.; Yeo, H. Automated Object Behavioral Feature Extraction for Potential Risk Analysis Based on Video Sensor. arXiv 2021, arXiv:2107.03554. [Google Scholar] [CrossRef]
- Jin, Z.; Noh, B.; Cho, H.; Yeo, H. Deep Learning-Based Approach on Risk Estimation of Urban Traffic Accidents. In Proceedings of the IEEE International Conference on Intelligent Transportation Systems (ITSC), Macau, China, 8–12 October 2022; pp. 1446–1451. [Google Scholar]
- Lee, H.; Cho, H.; Noh, B.; Yeo, H. NAVIBox: Real-Time Vehicle–Pedestrian Risk Prediction System in an Edge Vision Environment. Electronics 2023, 12, 4311. [Google Scholar] [CrossRef]
- Jin, Z.; No, W.; Noh, B. Do Enhanced School Zone Policies Improve Pedestrians’ Safety? A Deep Learning-Based Case Study of Osan City, South Korea. Cities 2025, 156, 105505. [Google Scholar] [CrossRef]
- Kim, Y.; Yeo, H.; Lim, L.; Noh, B. Integrating Visual and Community Environments in a Motorcycle Crash and Casualty Estimation. Accid. Anal. Prev. 2024, 208, 107792. [Google Scholar] [CrossRef] [PubMed]
- No, W.; Noh, B.; Kim, Y. A Novel Approach for Reliable Pedestrian Trajectory Collection with Behavior-Based Trajectory Reconstruction for Urban Surveillance Systems. Adv. Eng. Softw. 2024, 195, 103687. [Google Scholar] [CrossRef]
- No, W.; Lee, D.; Noh, B.; Kim, Y. How Do Crosswalk Delays Affect Pedestrian Access in Zoning Areas? Walking Access Reduction by Signalized Crosswalks in Seoul, South Korea. Appl. Geogr. 2023, 156, 102975. [Google Scholar] [CrossRef]
- Jin, Z.; Noh, B. From Prediction to Prevention: Leveraging Deep Learning in Traffic Accident Prediction Systems. Electronics 2023, 12, 4335. [Google Scholar] [CrossRef]
- Hwang, J.; Noh, B.; Jin, Z.; Yeo, H. Asymmetric Long-Term Graph Multi-Attention Network for Traffic Speed Prediction. In Proceedings of the IEEE International Conference on Intelligent Transportation Systems (ITSC), Macau, China, 8–12 October 2022; pp. 1498–1503. [Google Scholar]
- Noh, B.; Park, H.; Yeo, H. Analyzing Vehicle–Pedestrian Interactions: Combining Data Cube Structure and Predictive Risk Estimation Model. Accid. Anal. Prev. 2022, 165, 106539. [Google Scholar] [CrossRef]
- Noh, B.; Ka, D.; Lee, D.; Yeo, H. Analysis of Vehicle–Pedestrian Interactive Behaviors near Unsignalized Crosswalk. Transp. Res. Rec. 2021, 2675, 494–505. [Google Scholar] [CrossRef]
- Noh, B.; Yeo, H. A Novel Method of Predictive Collision Risk Area Estimation for Proactive Pedestrian Accident Prevention System in Urban Surveillance Infrastructure. Transp. Res. C 2022, 137, 103570. [Google Scholar] [CrossRef]
- Noh, B.; No, W.; Lee, D. Vision-Based Overhead Front Point Recognition of Vehicles for Traffic Safety Analysis. In Proceedings of the ACM International Joint Conference on Pervasive and Ubiquitous Computing (UbiComp), Singapore, 8–12 October 2018; pp. 1096–1102. [Google Scholar]
- Noh, B.; Cha, K.; Chang, S. Movement Classification Based on Acceleration Spectrogram with Dynamic Time Warping Method. In Proceedings of the IEEE International Conference on Mobile Data Management (MDM), Daejeon, Korea, 29 May–1 June 2017; pp. 397–400. [Google Scholar]
- Park, H.; Park, D.Y.; Noh, B.; Chang, S. Stacking Deep Transfer Learning for Short-Term Cross Building Energy Prediction with Different Seasonality and Occupant Schedule. Build. Environ. 2022, 218, 109060. [Google Scholar] [CrossRef]
- Son, J.J.; Noh, B.; Park, H.; Chang, S. Optimization of Building Material Selection for Energy Saving in Commercial Buildings in Different Climatic Conditions. J. Green Build. 2022, 17, 89–106. [Google Scholar] [CrossRef]
- Shon, D.; Noh, B.; Byun, N. Identification and Extracting Method of Exterior Building Information on 3D Map. Buildings 2022, 12, 452. [Google Scholar] [CrossRef]
- Noh, B.; Son, J.; Park, H.; Chang, S. In-Depth Analysis of Energy Efficiency Related Factors in Commercial Buildings Using Data Cube and Association Rule Mining. Sustainability 2017, 9, 2119. [Google Scholar] [CrossRef]
- Lee, J.; Noh, B.; Jang, S.; Park, D.; Chung, Y.; Chang, H.H. Stress Detection and Classification of Laying Hens Sound Analysis. Asian-Australas. J. Anim. Sci. 2015, 28, 592–599. [Google Scholar] [CrossRef] [PubMed]
- Kim, B.; Im, J.; Noh, B. Federated learning-based road surveillance system in distributed CCTV environment: Pedestrian fall recognition using spatio-temporal attention networks. Appl. Intell. 2025, 55, 543. [Google Scholar] [CrossRef]
- Kim, B.; Noh, B.; Song, K. Method on Efficient Operation of Multiple Models for Vision-Based In-Flight Risky Behavior Recognition in UAM Safety and Security. J. Adv. Transp. 2024, 2024, 7113084. [Google Scholar] [CrossRef]
- Noh, B.; Lin, T.; Lee, S.; Jeong, T. Deep Learning and Geometry Flow Vector Using Estimating Vehicle Cuboid Technology in a Monovision Environment. Sensors 2023, 23, 7504. [Google Scholar] [CrossRef]
- Min, H.; Hong, S.; Song, J.; Son, B.; Noh, B.; Moon, J. SolarFlux Predictor: A Novel Deep Learning Approach for Power Forecasting in South Korea. Electronics 2024, 13, 2071. [Google Scholar] [CrossRef]
- Moon, J.; Maqsood, M.; So, D.; Baik, S. W.; Rho, S.; Nam, Y. Advancing Ensemble Learning Techniques for Residential Building Electricity Consumption Forecasting: Insight from Explainable Artificial Intelligence. PLOS ONE 2024, 19, e0307654. [Google Scholar] [CrossRef] [PubMed]
- Moon, J.; Rho, S.; Baik, S. W. Toward Explainable Electrical Load Forecasting of Buildings: A Comparative Study of Tree-Based Ensemble Methods with Shapley Values. Sustain. Energy Technol. Assess. 2022, 54, 102888. [Google Scholar] [CrossRef]
- Moon, J.; Park, S.; Rho, S.; Hwang, E. Interpretable Short-Term Electrical Load Forecasting Scheme Using Cubist. Comput. Intell. Neurosci. 2022, 2022, 6892995. [Google Scholar] [CrossRef] [PubMed]
- Moon, J.; Park, S.; Jung, S.; Rew, J.; Rho, S.; Hwang, E. Combination of Short-Term Load Forecasting Models Based on Stacking Ensemble Approach. Energy Build. 2020, 216, 109921. [Google Scholar] [CrossRef]
- Moon, J.; Kim, J.; Kang, P.; Hwang, E. Solving the Cold-Start Problem in Short-Term Load Forecasting Using Tree-Based Methods. Energies 2020, 13, 886. [Google Scholar] [CrossRef]
- Moon, J.; Park, S.; Rho, S.; Hwang, E. A Comparative Analysis of Artificial Neural Network Architectures for Building Energy Consumption Forecasting. Int. J. Distrib. Sens. Netw. 2019, 15, 1550147719877616. [Google Scholar] [CrossRef]
- Moon, J.; Kim, Y.; Son, M.; Hwang, E. Hybrid Short-Term Load Forecasting Scheme Using Random Forest and Multilayer Perceptron. Energies 2018, 11, 3283. [Google Scholar] [CrossRef]
- Moon, J.; Park, J.; Hwang, E.; Jun, S. Forecasting Power Consumption for Higher Educational Institutions Based on Machine Learning. J. Supercomput. 2018, 74, 3778–3800. [Google Scholar] [CrossRef]
- Moon, J.; Kim, K. H.; Kim, Y.; Hwang, E. A Short-Term Electric Load Forecasting Scheme Using 2-Stage Predictive Analytics. In Proceedings of the IEEE International Conference on Big Data and Smart Computing (BigComp), Shanghai, China, 15–17 January 2018; pp. 219–226. [Google Scholar]
- Moon, J.; Kim, Y.; Rho, S. User Behavior Analytics with Machine Learning for Household Electricity Demand Forecasting. In Proceedings of the International Conference on Platform Technology and Service (PlatCon), Jeju, Republic of Korea, 22–24 August 2022; pp. 13–18. [Google Scholar]
- So, D.; Oh, J.; Jeon, I.; Moon, J.; Lee, M.; Rho, S. BiGTA-Net: A Hybrid Deep Learning-Based Electrical Energy Forecasting Model for Building Energy Management Systems. Systems 2023, 11, 456. [Google Scholar] [CrossRef]
- Moon, J.; Park, S.; Rho, S.; Hwang, E. Robust Building Energy Consumption Forecasting Using an Online Learning Approach with R Ranger. J. Build. Eng. 2022, 47, 103851. [Google Scholar] [CrossRef]
- Moon, J.; Park, S.; Jung, S.; Hwang, E.; Rho, S. Training-Data Generation and Incremental Testing for Daily Peak Load Forecasting. In Proceedings of the International Conference on Artificial Intelligence (ICAI) and International Conference on Applied Cognitive Computing (ACC), Las Vegas, NV, USA, 27–30 July 2020; pp. 801–812. [Google Scholar]
- Jung, S.; Moon, J.; Park, S.; Rho, S.; Baik, S. W.; Hwang, E. Bagging Ensemble of Multilayer Perceptrons for Missing Consumption Data Imputation. Sensors 2020, 20, 1772. [Google Scholar] [CrossRef] [PubMed]
- Gul, M. J.; Urfa, G. M.; Paul, A.; Moon, J.; Rho, S.; Hwang, E. Mid-Term Electricity Load Prediction Using CNN and Bi-LSTM. J. Supercomput. 2021, 77, 10942–10958. [Google Scholar] [CrossRef]
- Jung, S.; Moon, J.; Park, S.; Hwang, E. An Attention-Based Multilayer GRU Model for Multistep-Ahead Short-Term Load Forecasting. Sensors 2021, 21, 1639. [Google Scholar] [CrossRef] [PubMed]
- Kim, J.; Moon, J.; Hwang, E.; Kang, P. Recurrent Inception Convolution Neural Network for Multi Short-Term Load Forecasting. Energy Build. 2019, 194, 328–341. [Google Scholar] [CrossRef]
- Oh, J.; So, D.; Jo, J.; Kang, N.; Hwang, E.; Moon, J. Two-Stage Neural Network Optimization for Robust Solar Photovoltaic Forecasting. Electronics 2024, 13, 1659. [Google Scholar] [CrossRef]
- Moon, J. A Multi-Step-Ahead Photovoltaic Power Forecasting Approach Using One-Dimensional Convolutional Neural Networks and Transformer. Electronics 2024, 13. [Google Scholar] [CrossRef]
- Jang, J.; Jeong, W.; Kim, S.; Lee, B.; Lee, M.; Moon, J. RAID: Robust and Interpretable Daily Peak Load Forecasting via Multiple Deep Neural Networks and Shapley Values. Sustainability 2023, 15, 6951. [Google Scholar] [CrossRef]
- Yang, T.; Kim, M.; Moon, J. Understanding Solar Irradiance Predictions Through Explainable AI: Perspectives from Gwangju. J. Platform Technol. 2024, 12, 3–16. [Google Scholar]
- So, D.; Oh, J.; Leem, S.; Ha, H.; Moon, J. A Hybrid Ensemble Model for Solar Irradiance Forecasting: Advancing Digital Models for Smart Island Realization. Electronics 2023, 12, 2607. [Google Scholar] [CrossRef]
- Moon, J.; Shin, Z.; Rho, S.; Hwang, E. A Comparative Analysis of Tree-Based Models for Day-Ahead Solar Irradiance Forecasting. In Proceedings of the International Conference on Platform Technology and Service (PlatCon), Jeju, Republic of Korea, 23–25 August 2021; pp. 1–6. [Google Scholar]
- Park, J.; Moon, J.; Jung, S.; Hwang, E. Multistep-Ahead Solar Radiation Forecasting Scheme Based on the Light Gradient Boosting Machine: A Case Study of Jeju Island. Remote Sens. 2020, 12, 2271. [Google Scholar] [CrossRef]
- Hussain, T.; Ullah, F. U. M.; Muhammad, K.; Rho, S.; Ullah, A.; Hwang, E.; Moon, J.; Baik, S. W. Smart and Intelligent Energy Monitoring Systems: A Comprehensive Literature Survey and Future Research Guidelines. Int. J. Energy Res. 2021, 45, 3590–3614. [Google Scholar] [CrossRef]
Figure 1.
The overall architecture of trend-context fusion network (TCFN) with XAI.
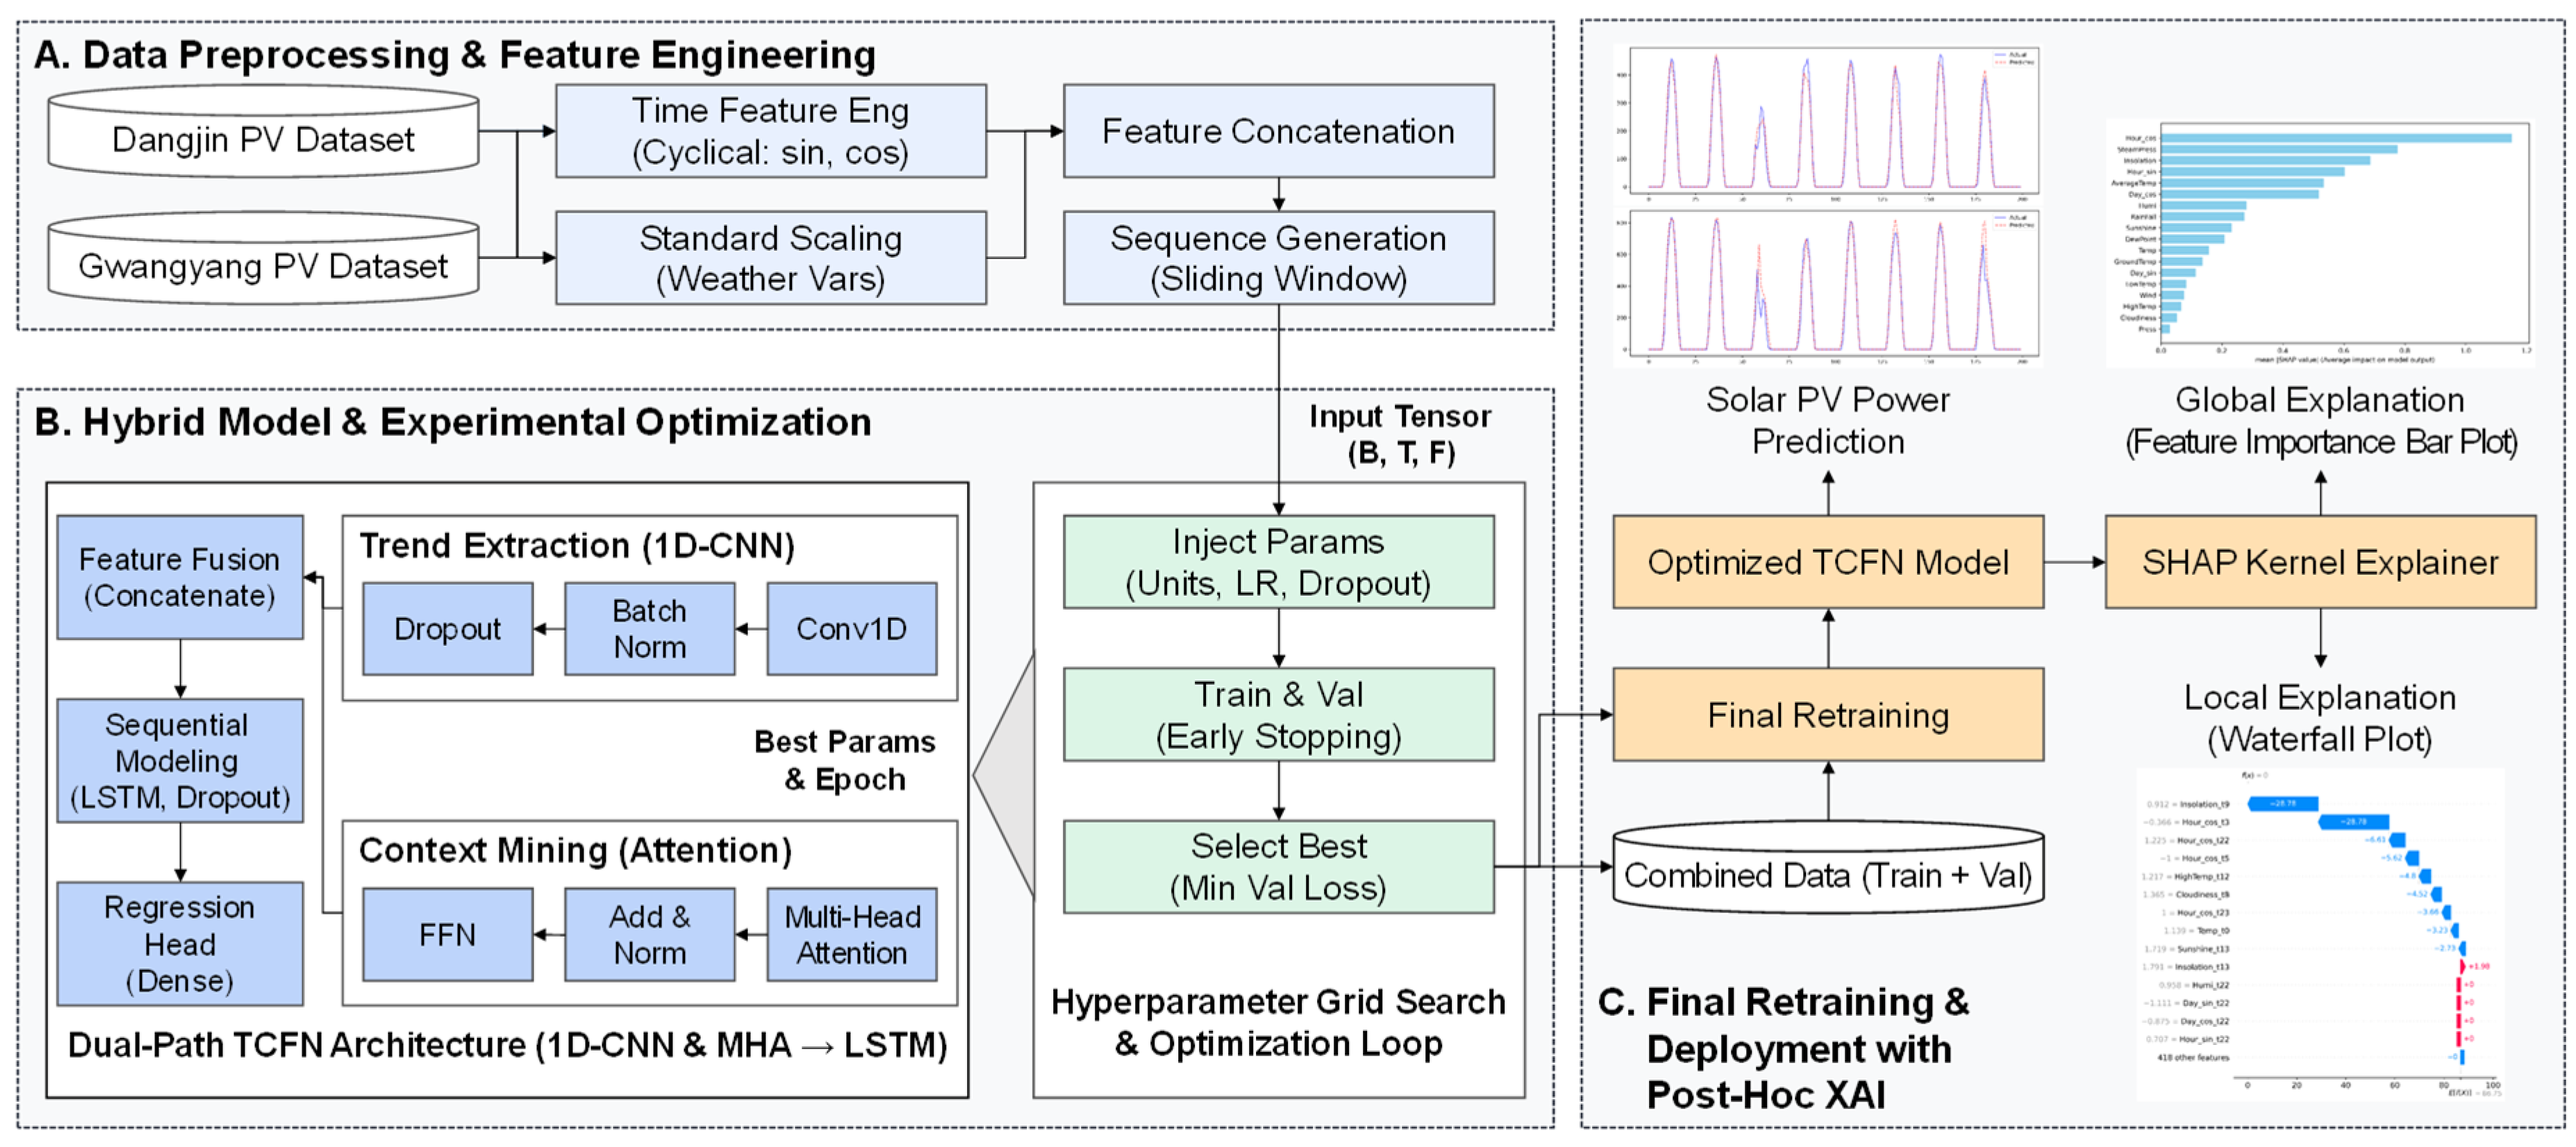
Figure 2.
Comparison between actual (blue) and predicted (red) solar power generation at the Dangjin Landfill site for the first 200 hours of the 2019 test set.
Figure 2.
Comparison between actual (blue) and predicted (red) solar power generation at the Dangjin Landfill site for the first 200 hours of the 2019 test set.
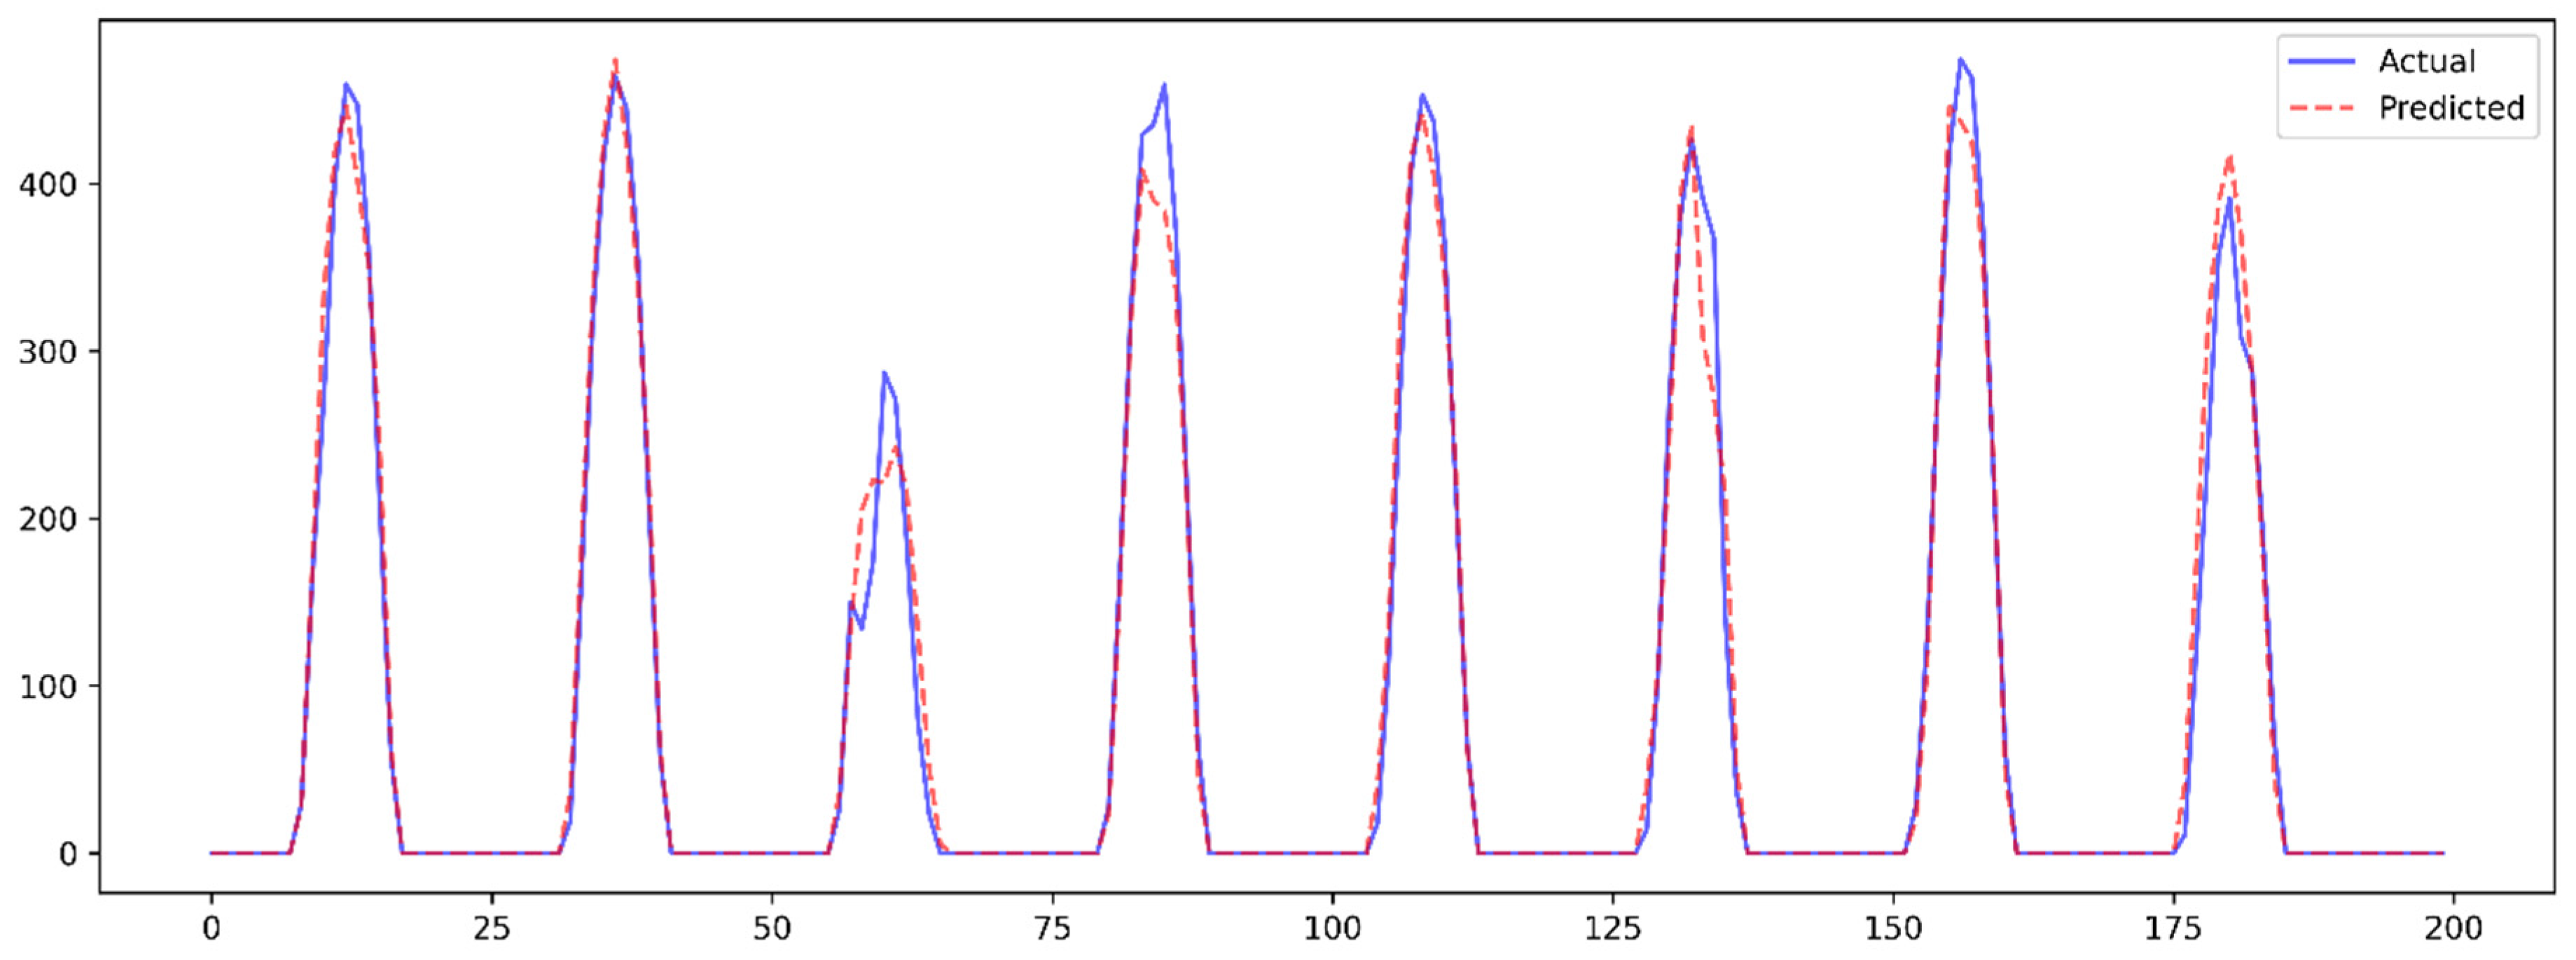
Figure 3.
Comparison between actual (blue) and predicted (red) solar power generation at the Gwangyang Port site for the first 200 hours of the 2019 test set.
Figure 3.
Comparison between actual (blue) and predicted (red) solar power generation at the Gwangyang Port site for the first 200 hours of the 2019 test set.
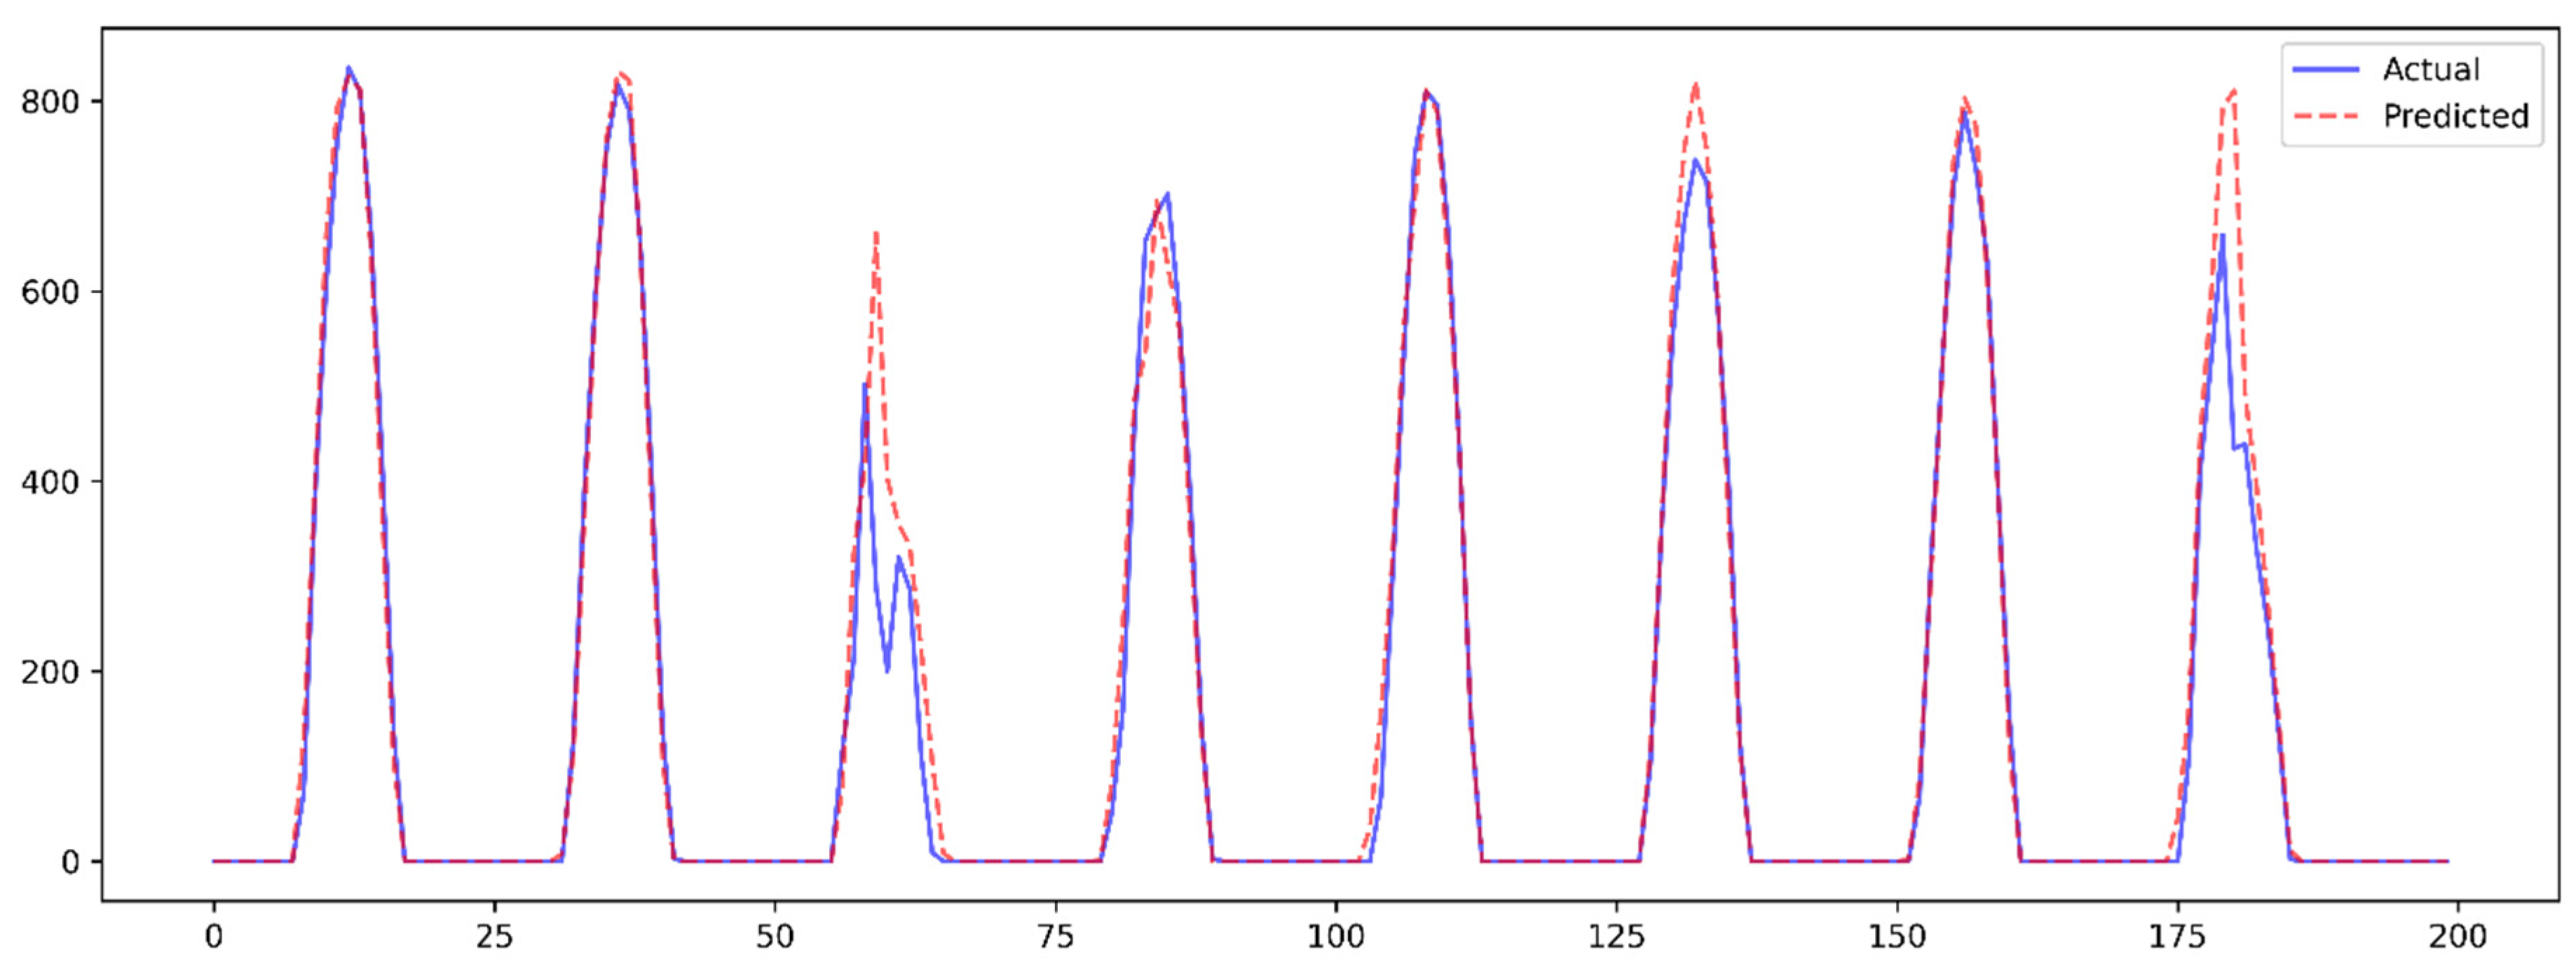
Figure 4.
Global SHAP feature importance for the Dangjin dataset.
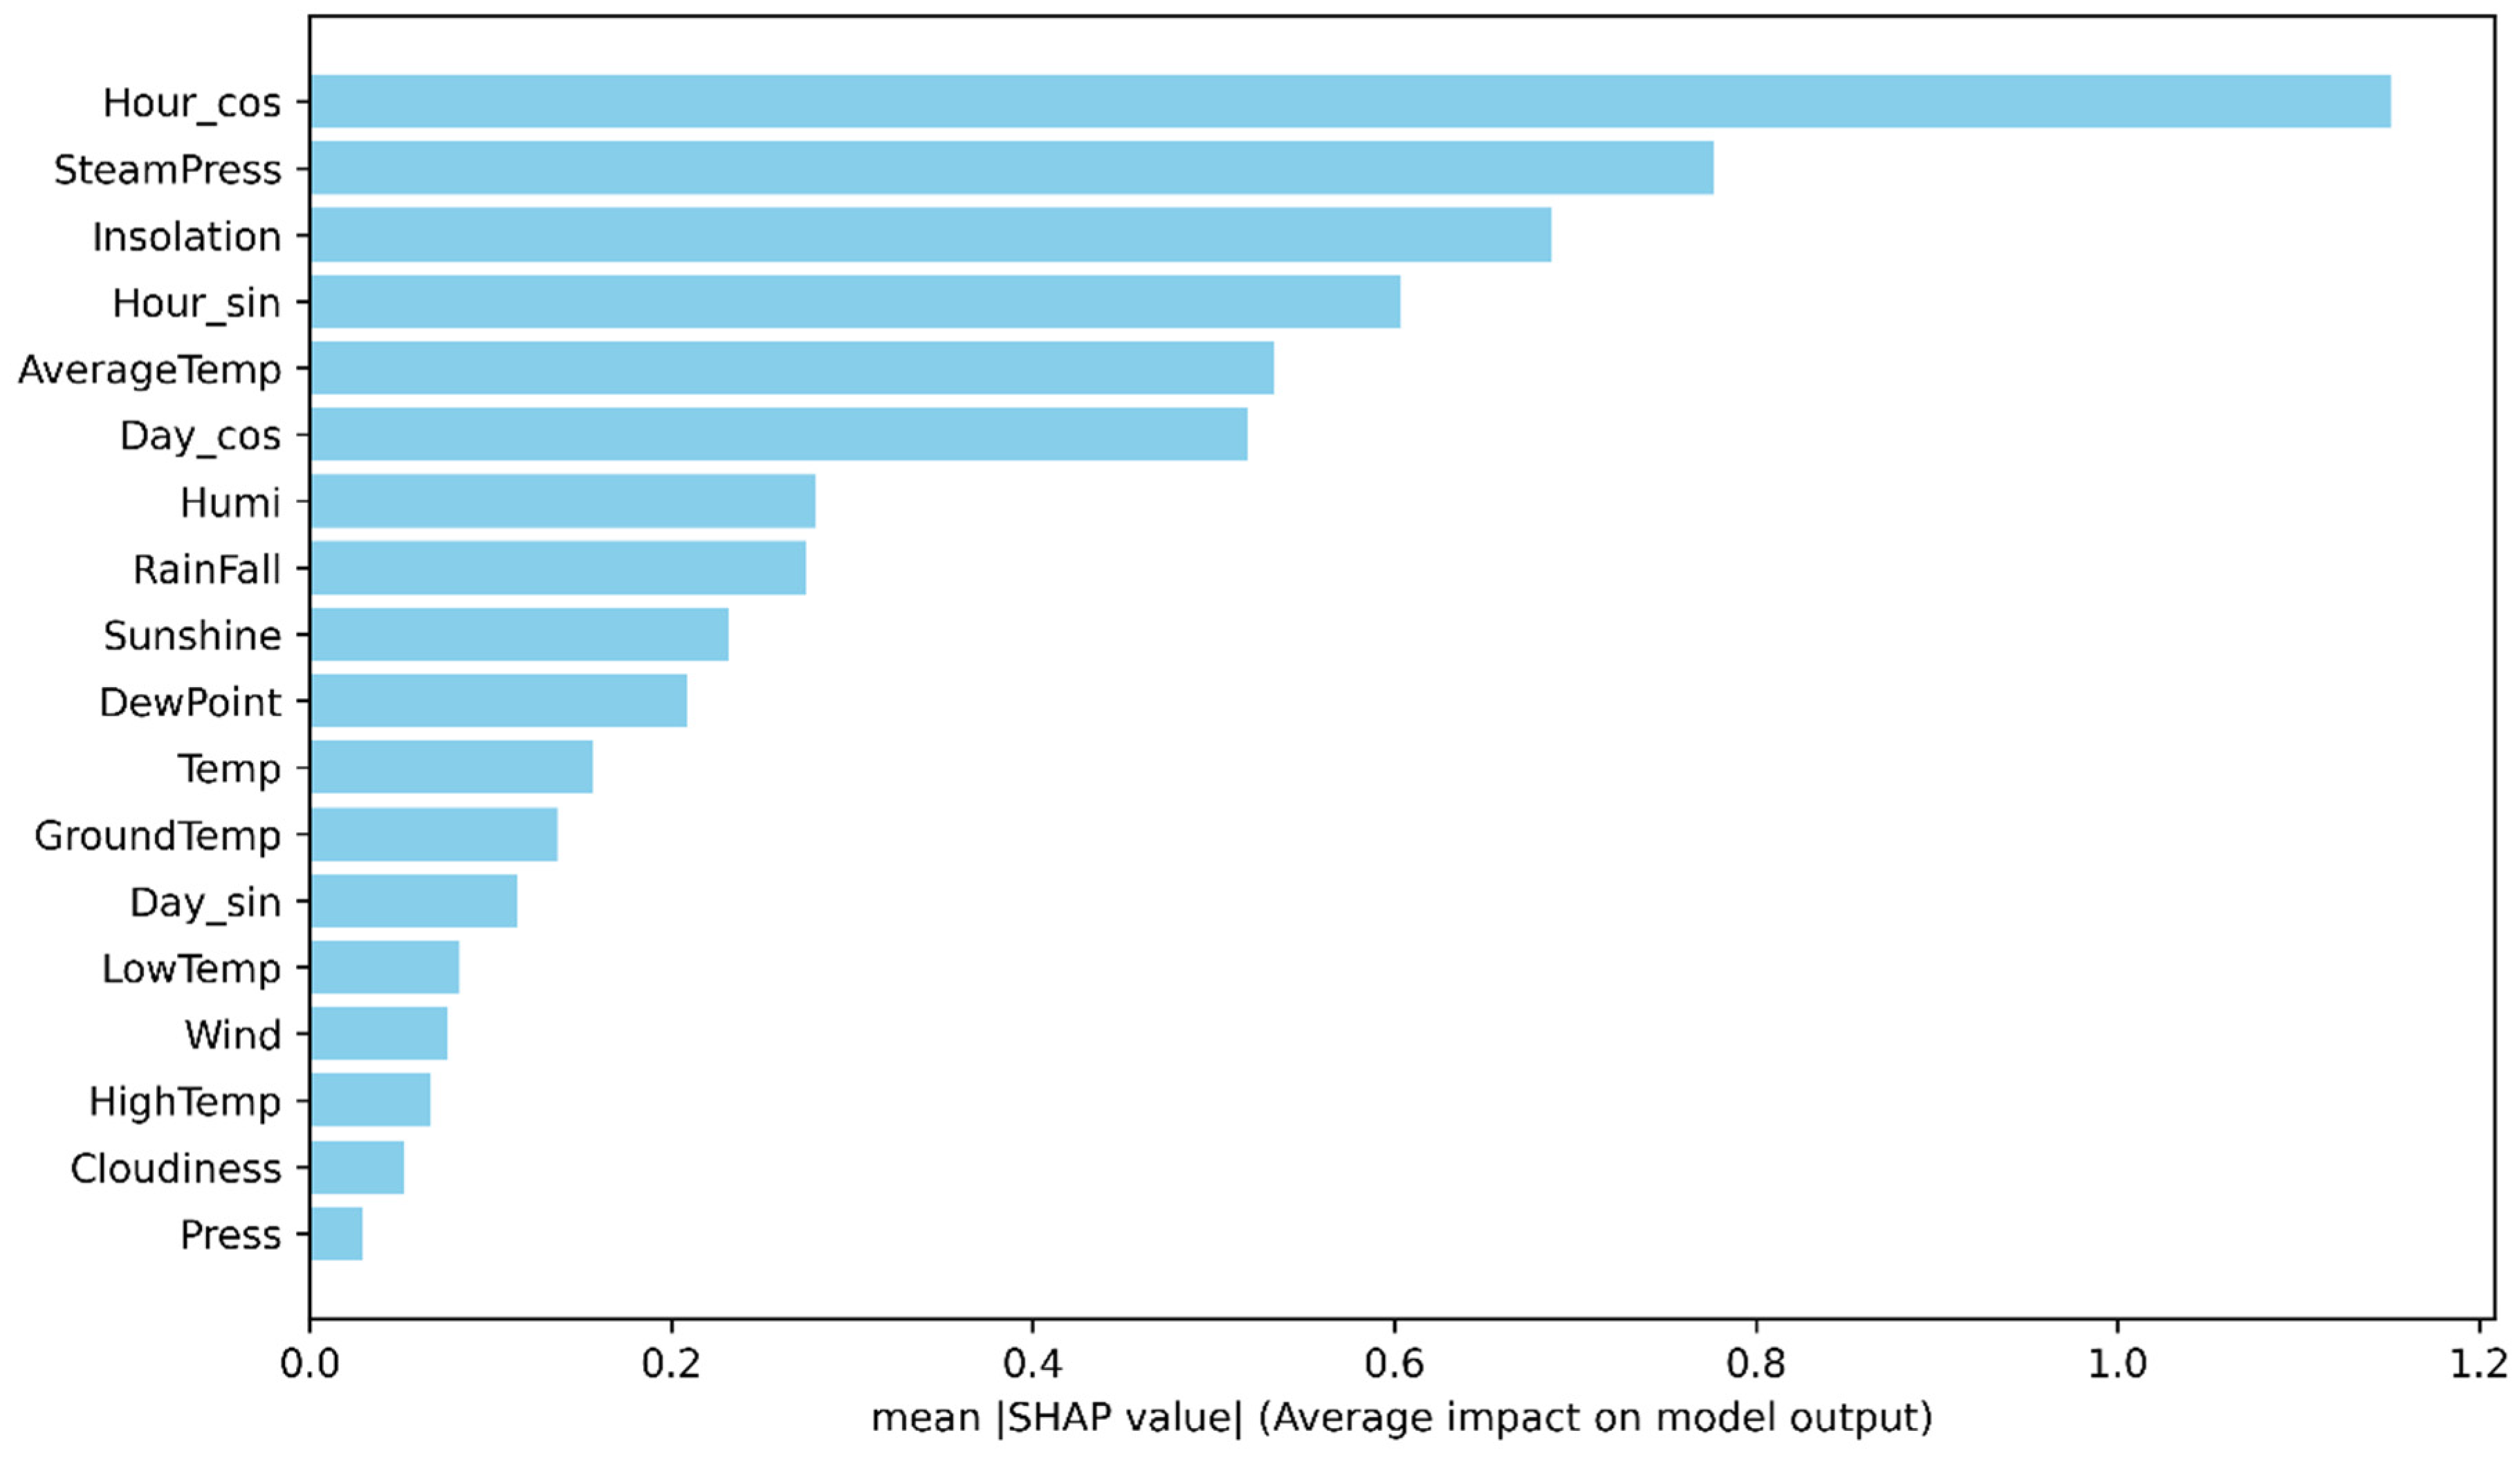
Figure 5.
Global SHAP feature importance for the Gwangyang dataset.
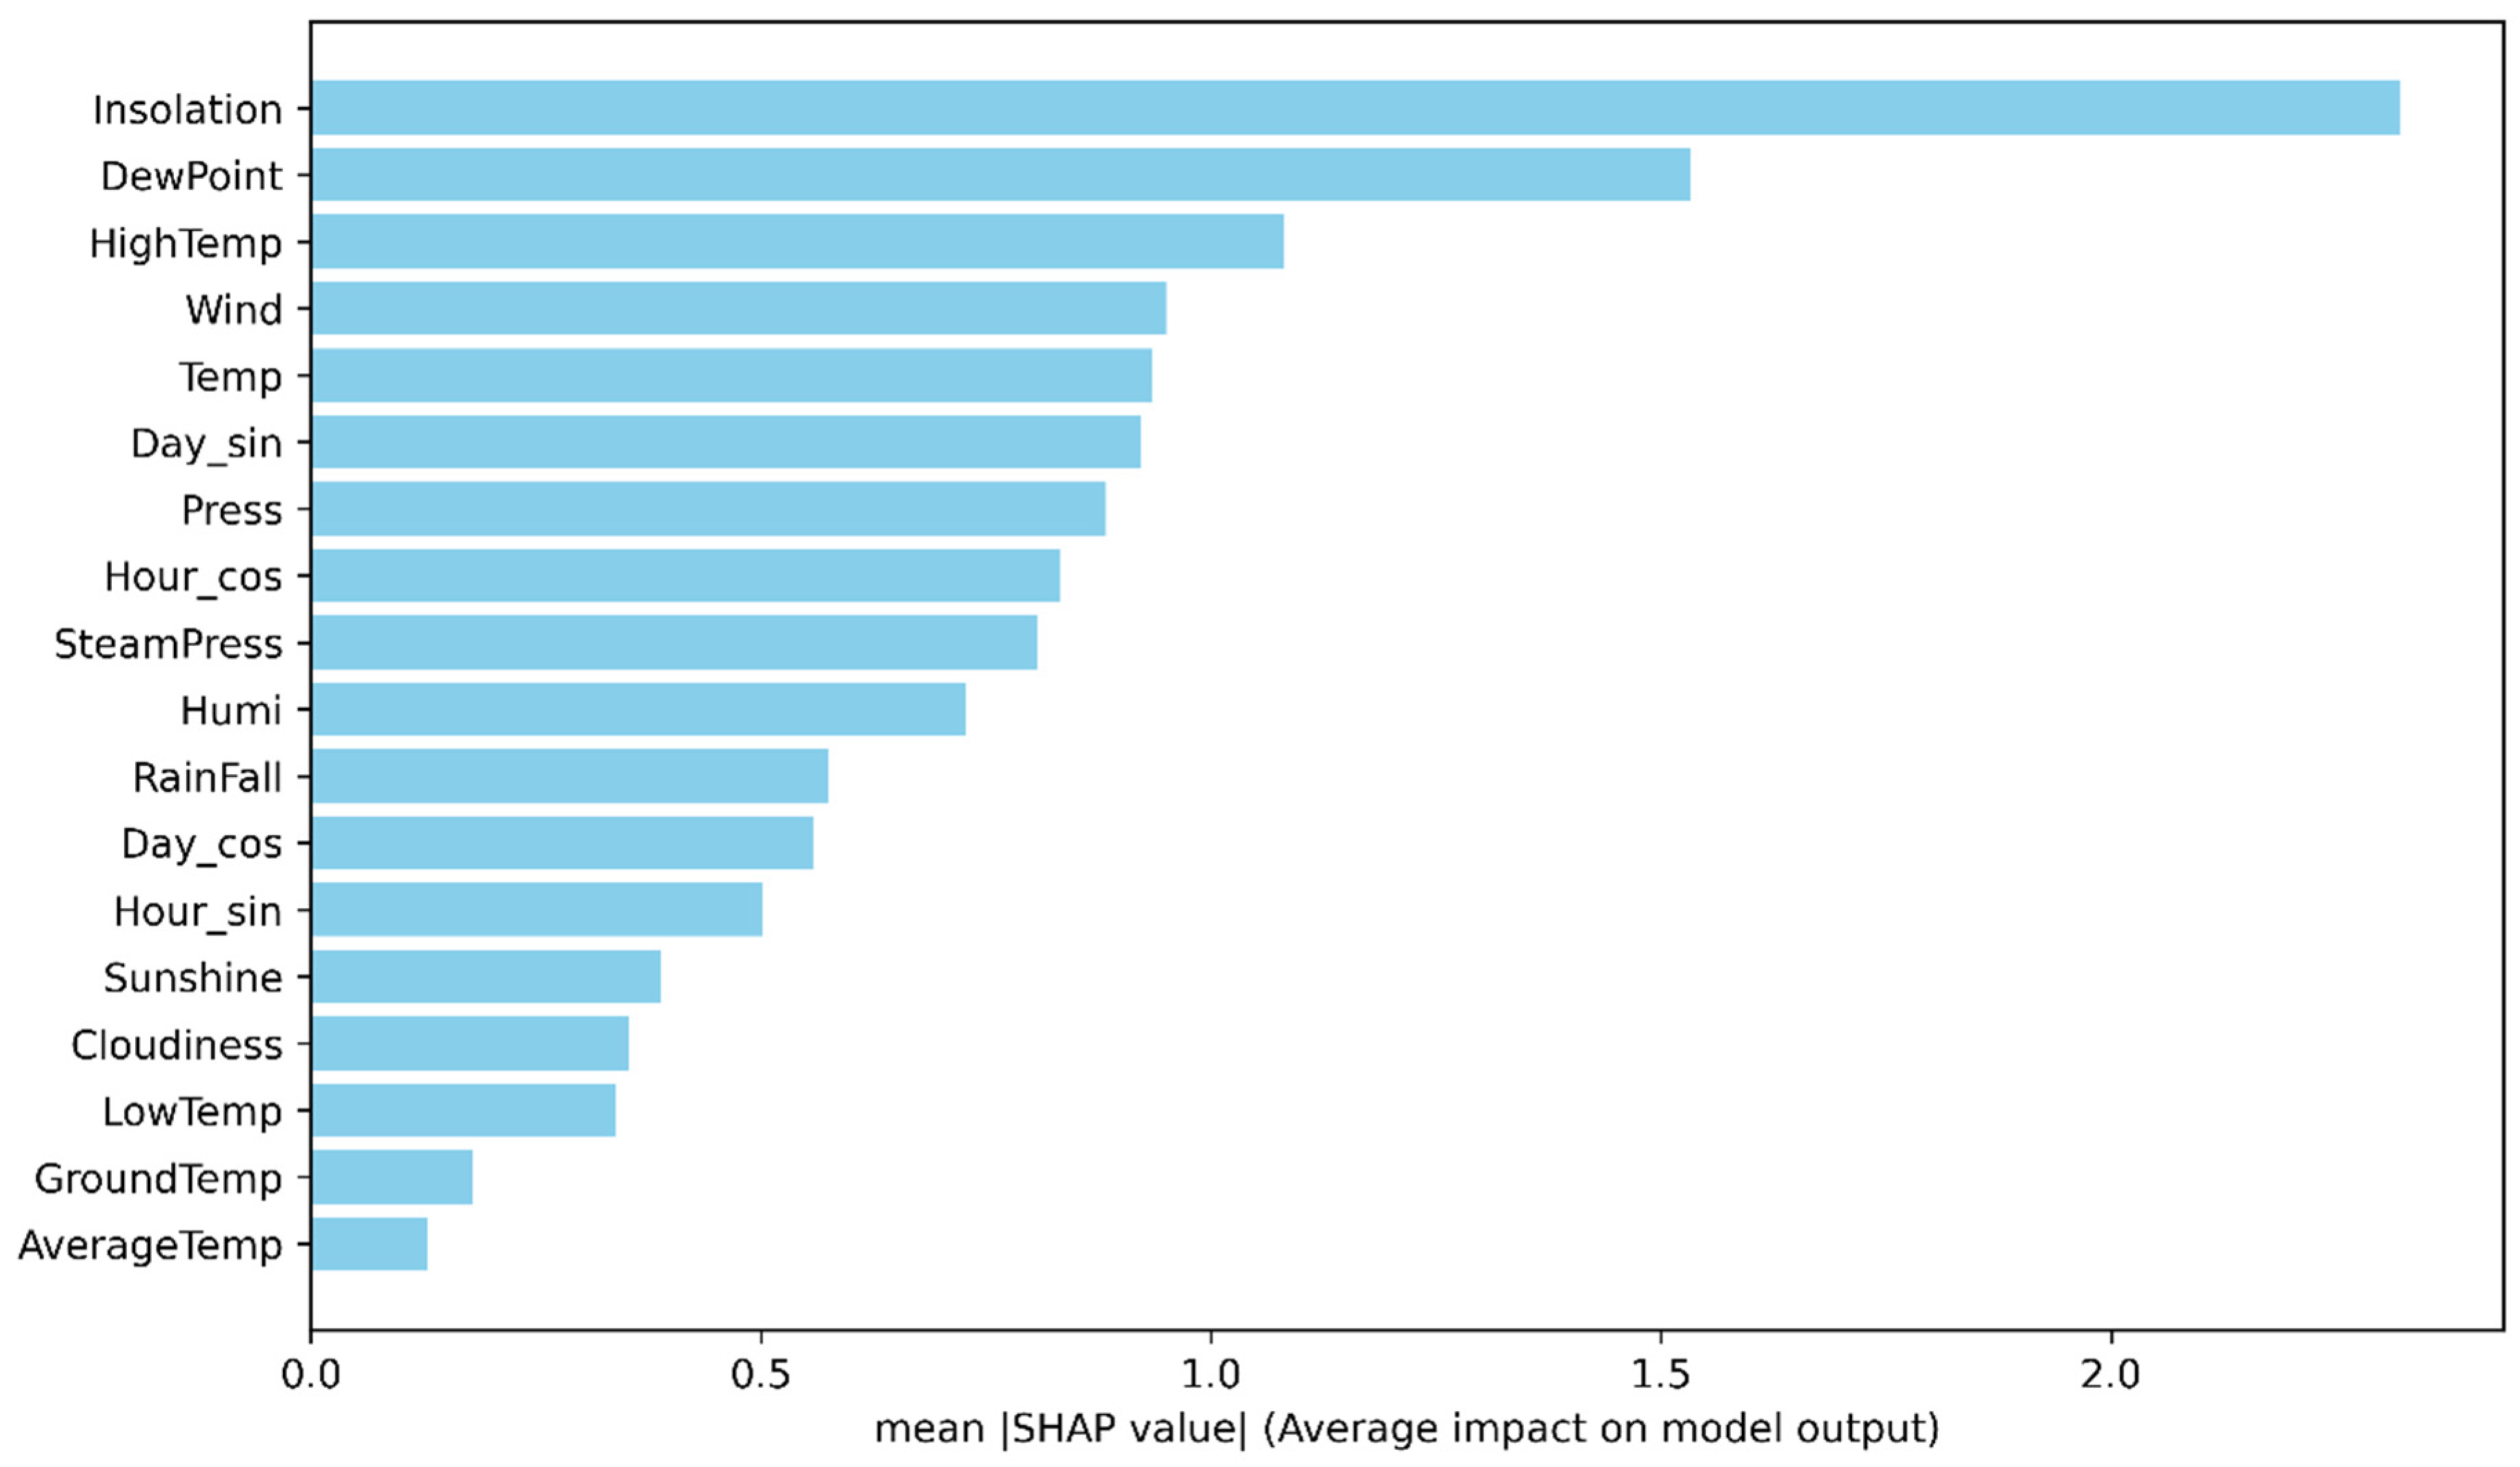
Figure 6.
SHAP waterfall explanation for a Dangjin test instance (Sample #0, 2019).
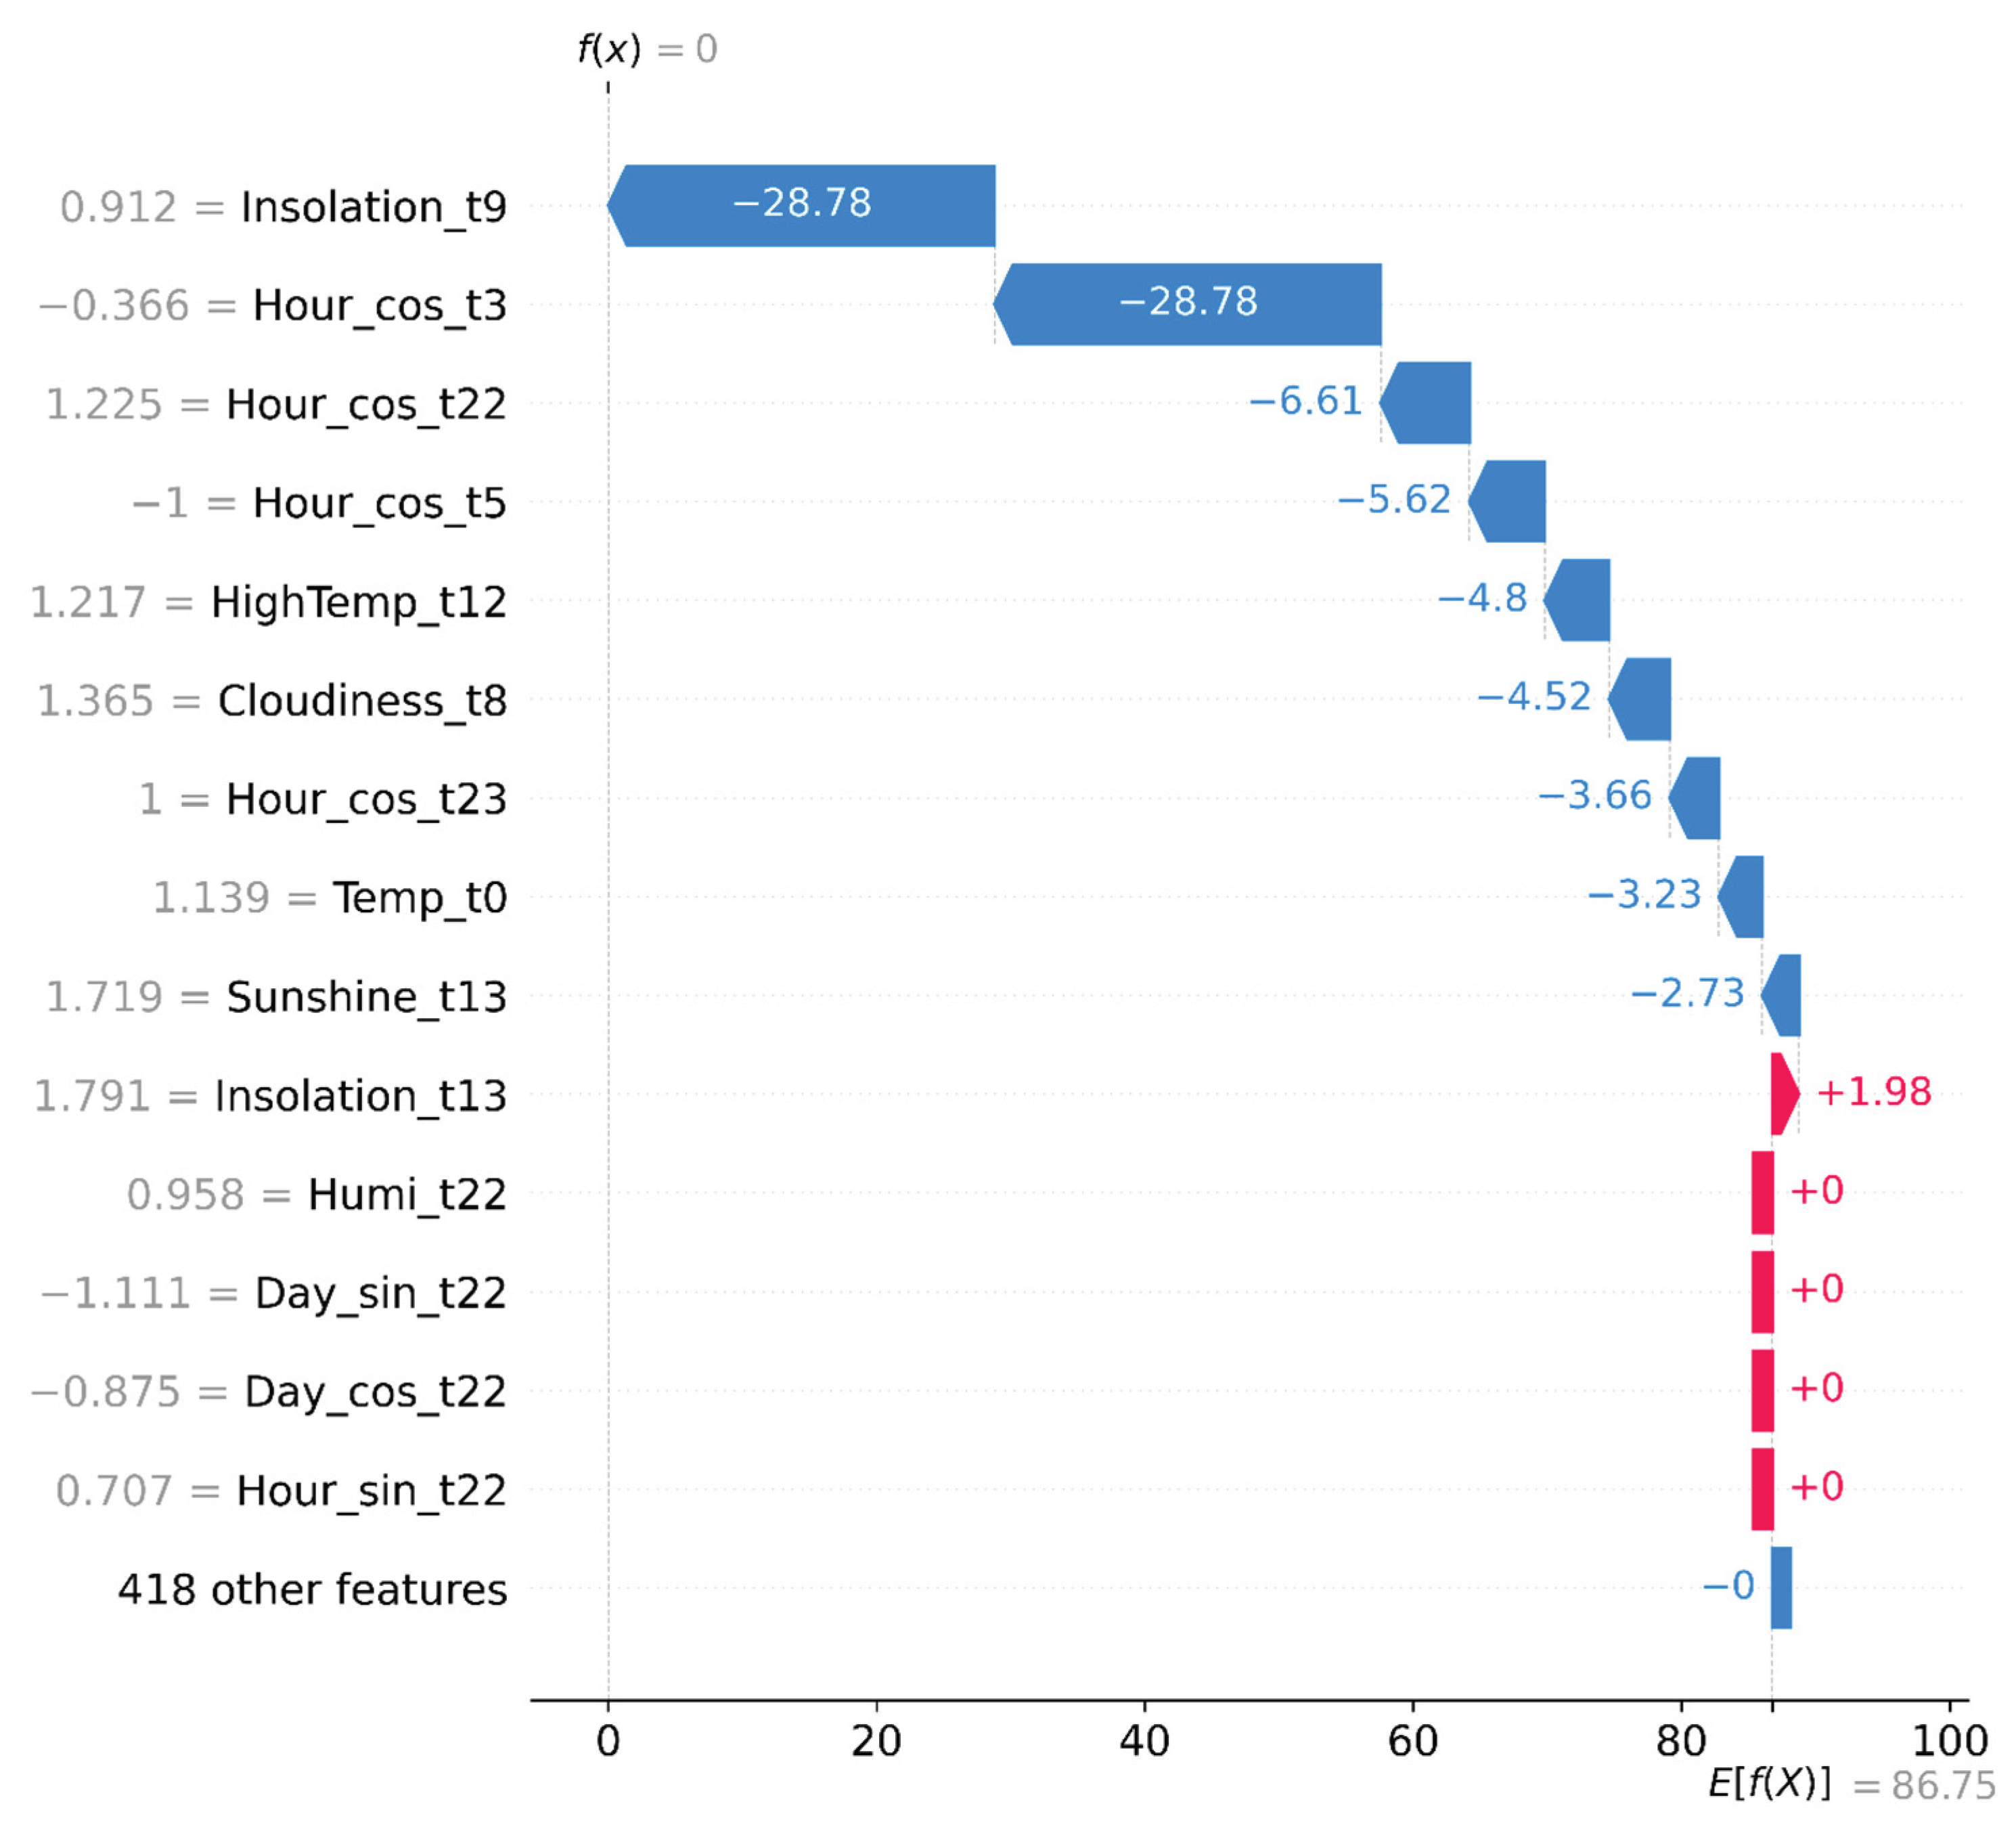
Figure 7.
SHAP waterfall explanation for a Gwangyang test instance (Sample #0, 2019).
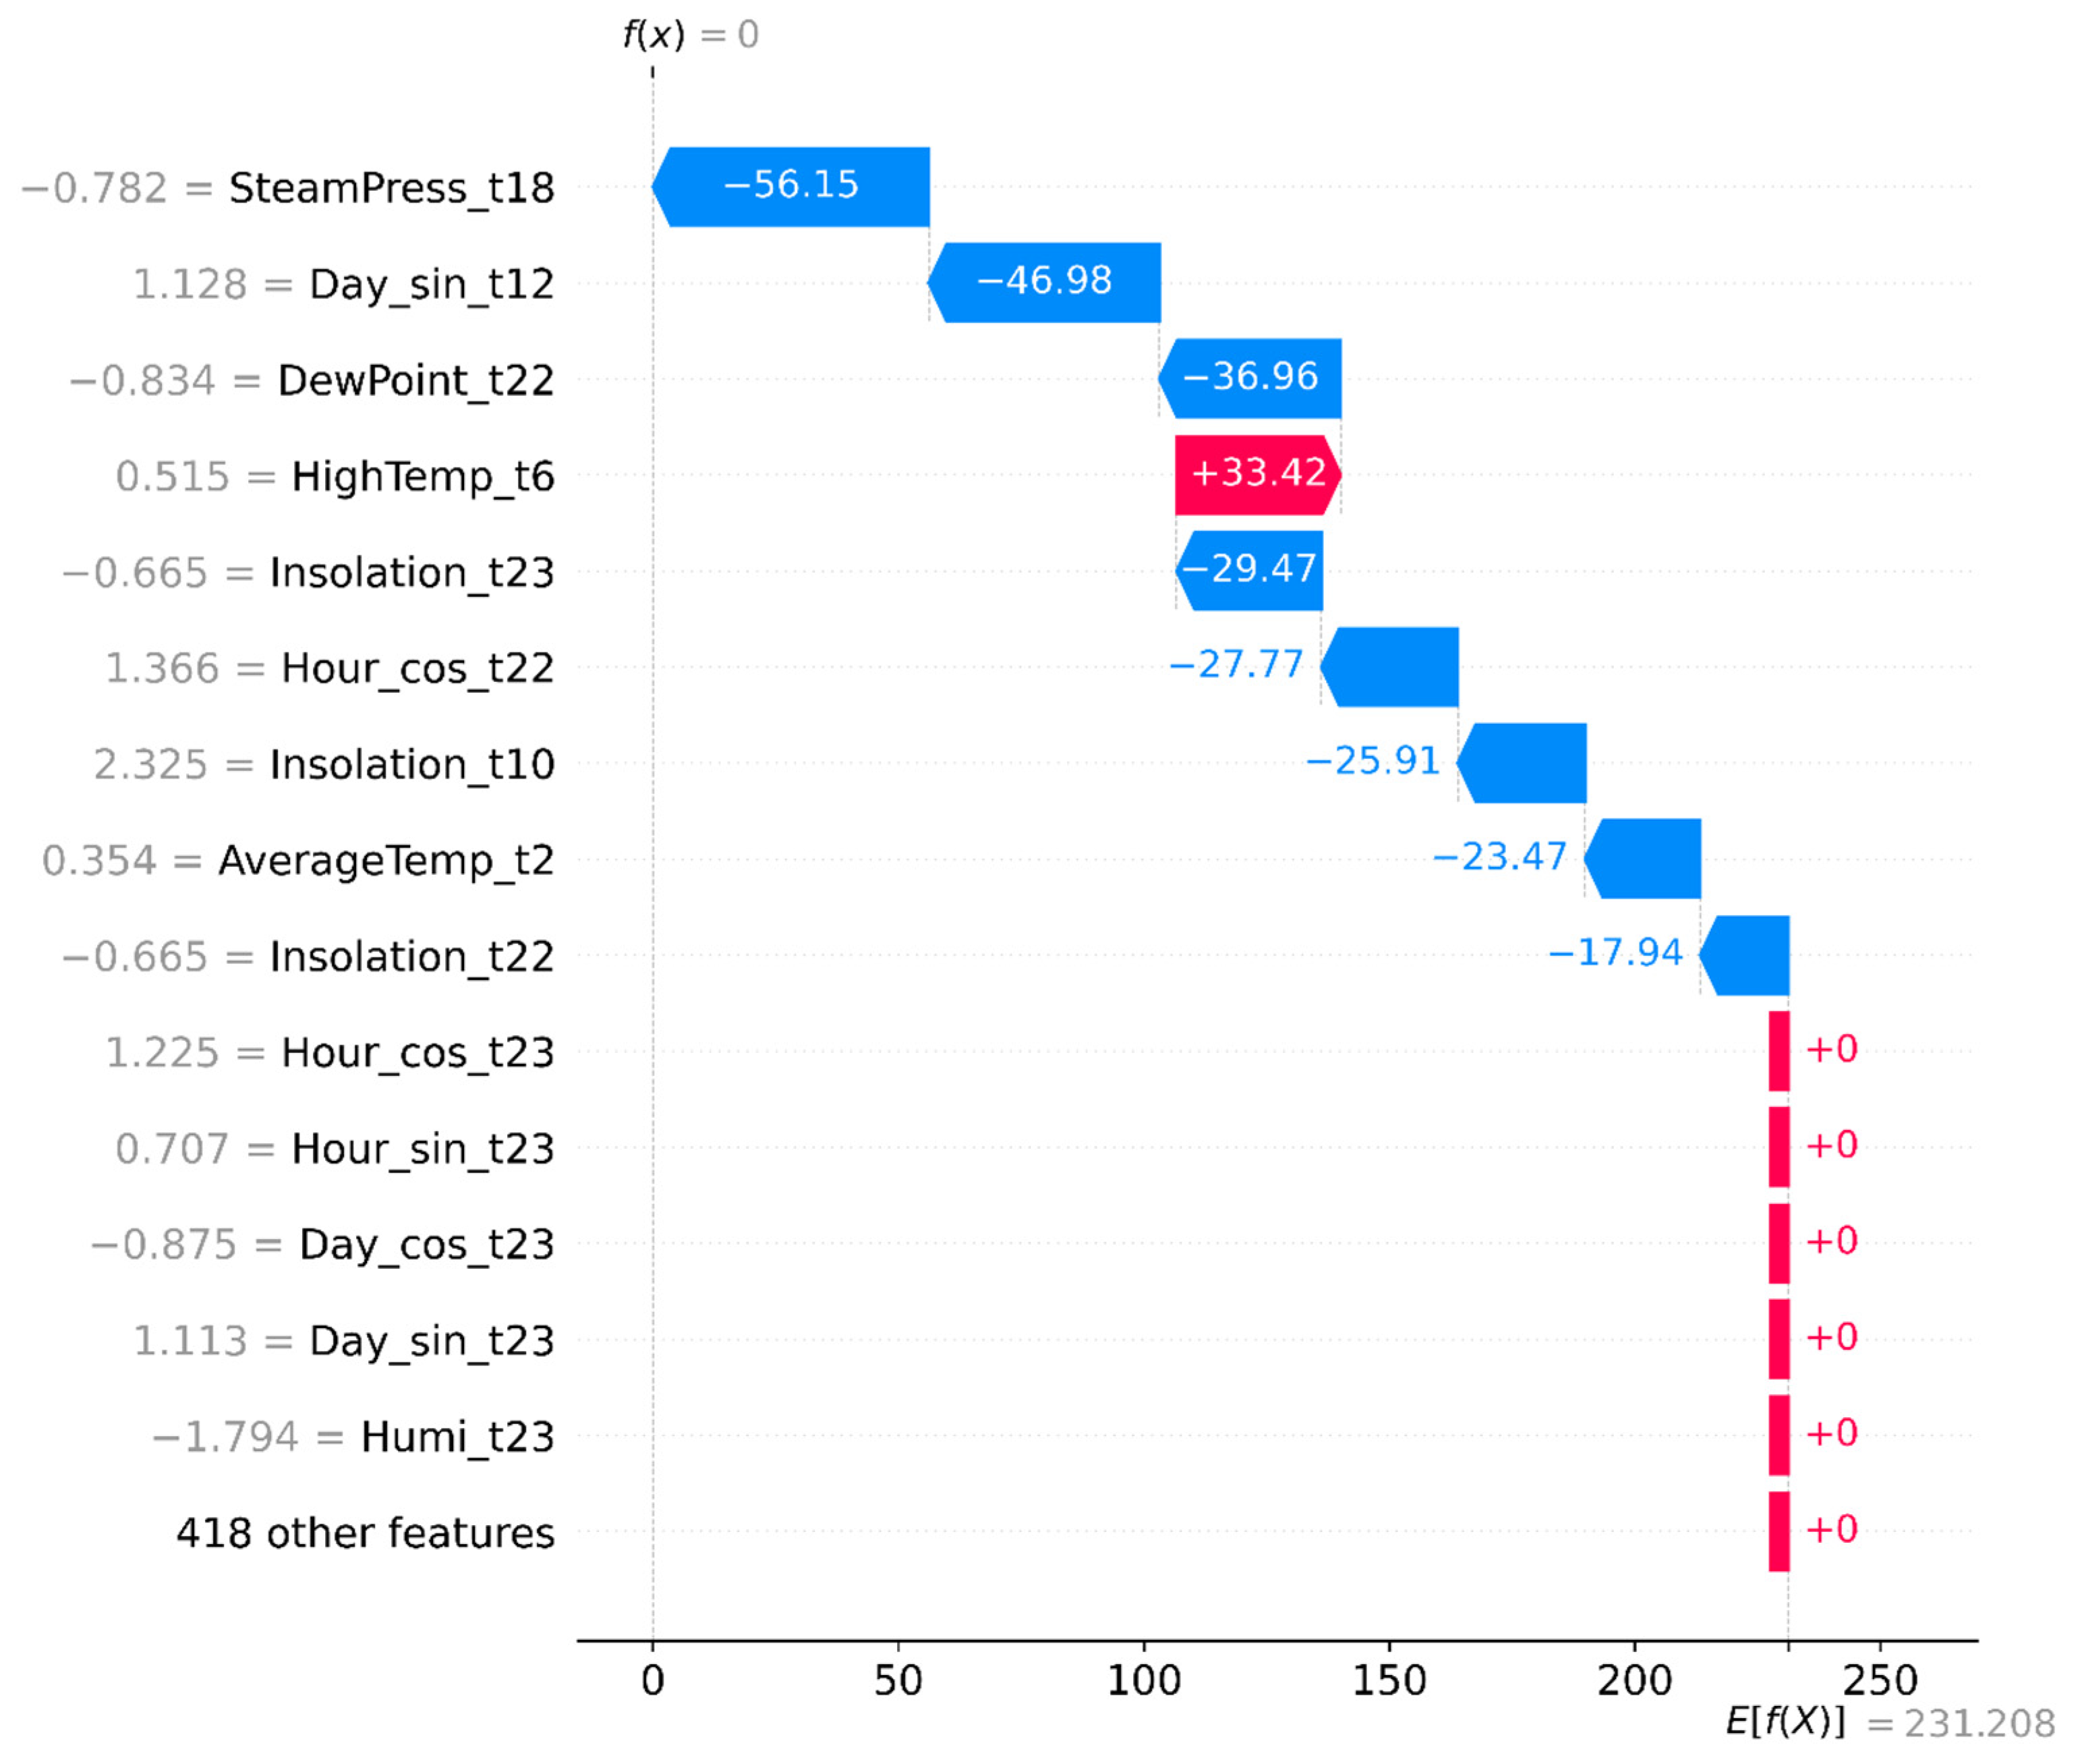

Table 1.
Meteorological and solar power variables collected from Dangjin and Gwangyang datasets.
| No. | Variable Name | Description (Unit) |
| 1 | Year/Month/Day | Timestamp information |
| 2 | Hour | Time of day (0–23h) |
| 3 | AverageTemp | Hourly average temperature (°C) |
| 4 | LowTemp | Hourly minimum temperature (°C) |
| 5 | HighTemp | Hourly maximum temperature (°C) |
| 6 | RainFall | Precipitation amount (mm) |
| 7 | Wind | Wind speed (m/s) |
| 8 | Humi | Relative humidity (%) |
| 9 | SteamPress | Vapor pressure (hPa) |
| 10 | DewPoint | Dew point temperature (°C) |
| 11 | Sunshine | Sunshine duration (hr) |
| 12 | Insolation | Solar radiation (MJ/m²) |
| 13 | Cloudiness | Cloud cover (0–10 scale) |
| 14 | GroundTemp | Surface temperature (°C) |
| 15 | Press | Atmospheric pressure (hPa) |
| 16 | Solar_Power | Target Variable: Power Generation (kW) |
Table 2.
Hyperparameter configuration and search space for model training.
| Category | Hyperparameter | Search Space / Setting | Selected (Best) |
| Input | Sequence Length | Fixed | 24 hours |
| Model | LSTM Units | {32, 64, 128} | 128 (Deep_Robust) |
| Dropout Rate | {0.2, 0.3, 0.5} | 0.5 | |
| Kernel Size (Conv1D) | Fixed | 3 | |
| Attention Heads | Fixed | 4 | |
| Activation Function | Fixed | Swish | |
| Training | Optimizer | Fixed | Adam |
| Learning Rate | {0.001, 0.0005, 0.0001} | 0.0005 | |
| Batch Size | Fixed | 32 | |
| Loss Function | Fixed | MSE (Mean Squared Error) | |
| Max Epochs | Fixed | 30 (with Early Stopping) |
Table 3.
Performance comparison of deep learning models for solar power forecasting.
| Model Architecture | Dangjin Landfill (Inland) | Gwangyang Port (Coastal) | ||||
| RMSE | MAE | R2 | RMSE | MAE | R2 | |
| RNN | 110.47 | 52.87 | 0.808 | 101.03 | 52.55 | 0.941 |
| LSTM | 109.54 | 54.14 | 0.811 | 279.14 | 152.66 | 0.549 |
| GRU | 93.24 | 43.80 | 0.863 | 103.20 | 51.33 | 0.938 |
| BiLSTM | 101.22 | 51.54 | 0.839 | 176.91 | 97.31 | 0.819 |
| 1D-CNN | 86.80 | 39.86 | 0.882 | 94.31 | 48.02 | 0.949 |
| 1D-CNN-BiLSTM | 105.68 | 49.54 | 0.824 | 152.55 | 85.00 | 0.865 |
| Attn-GRU | 93.70 | 44.96 | 0.862 | 108.71 | 57.62 | 0.932 |
| TCN | 96.29 | 49.11 | 0.854 | 108.17 | 56.37 | 0.932 |
| TCFN (Ours) | 86.37 | 39.49 | 0.883 | 89.60 | 43.07 | 0.954 |
Disclaimer/Publisher’s Note: The statements, opinions and data contained in all publications are solely those of the individual author(s) and contributor(s) and not of MDPI and/or the editor(s). MDPI and/or the editor(s) disclaim responsibility for any injury to people or property resulting from any ideas, methods, instructions or products referred to in the content. |
© 2026 by the authors. Licensee MDPI, Basel, Switzerland. This article is an open access article distributed under the terms and conditions of the Creative Commons Attribution (CC BY) license (http://creativecommons.org/licenses/by/4.0/).
Copyright: This open access article is published under a Creative Commons CC BY 4.0 license, which permit the free download, distribution, and reuse, provided that the author and preprint are cited in any reuse.


