Submitted:
05 December 2024
Posted:
09 December 2024
You are already at the latest version
Abstract
Objective
The study the relationships or working physical activity, physical fitness and energy intake on all-cause mortality and age at death in cohorts of middle-aged men followed-up for 61 years.
Material and Methods
In 1960 there were 2 residential cohorts of middle-aged men examined for a total of 1712 subjects and 3 indexes were measured, i.e. physical activity by a questionnaire (3 classes, sedentary, moderate, vigorous: Phyac) , physical fitness estimated by combining arm circumference, heart rate and vital capacity by Principal Component Analysis whose score was divided in 3 tertile classes (low, intermediate and high: Fitscore) and energy intake in Kcalories estimated by a dietary history divided in 3 classes (low, intermediate, high: Calories), plus a number of 5 traditional cardiovascular risk factors (age, cigarette smoking, body mass index, systolic blood pressure and serum cholesterol). Cox models were used to predict all-cause mortality as a function for those adjusted indexes. Multiple Linear Regression Models were used to predict age at death as a function of the same co-variates.
Results
There were large correlations across the 3 indexes. Prediction of all-cause mortality showed the independent and complementary roles of the 3 indexes all statistically significant and all being protective for their highest levels. The same outcome was found predicting age at death.
Conclusions
Working physical activity, a score of physical fitness and energy intake are all directly related to lower all-cause mortality and to higher age at death thus suggesting a large part of independence.
Keywords:
physical activity
; physical fitness
; energy intake
; all-cause mortality
INTRODUCTION
Old [1] and relatively recent [2] reviews have clearly shown evidence of the beneficial role of physical activity on health status and the danger of sedentary habits. Similar findings were provided in the Italian Rural Areas of the Seven Countries Study of Cardiovascular Diseases (SCS) started in 1960, where participants were classified for their physical activity into 3 classes, i.e. sedentary, moderate and vigorous and the end point was made by all-cause mortality, several single causes of death and age at death during extremely long follow-up periods [3,4]. The classification of physical activity was based only on the apparent engagement at work but, despite its rough characteristics, it performed in a rather good way. Previously, in 1992, we made an analysis where, together with the basic physical activity classification, some allegedly fitness components were considered showing their good relations with 25-year all-cause mortality [5].
More recently, the research group of the SCS published 2 contributions comparing the role of physical activity versus that of a fitness score derived from the combined levels of arm circumference, heart rate and vital capacity in predicting major lethal events in a group of European cohorts of middle-aged men [6,7]. The present analysis has the purpose to replicate that analysis in the Italian areas of the SCS with the addition of another variable, i.e. energy intake, whose connection with energy expenditure may help to validate the previous approach.
Physical activity and physical fitness are defined in different ways and following some classical proposals physical activity is “any bodily movement produced by skeletal muscles that results in energy expenditure “[1] while physical fitness is “ the ability to carry out daily tasks with vigor and alertness, without undue fatigue and with ample energy to enjoy leisure-time pursuits and to meet unforeseen emergencies” [1]. Sometimes, confusion has arisen considering these 2 characteristics that clearly have some connections. However, physical fitness can be partly due to genetic traits and improved or promoted by physical activity.
MATERIAL AND METHODS
Population and measurements.
The analysis was run on data of Italian Rural Areas (IRA) or the Seven Countries Study of Cardiovascular Diseases made by 1712 men aged 40-59 years at entry examination in 1960, representing the 98.7 % of the invited samples. Details of these residential cohorts may be found elsewhere [8].
The variables used for analysis were: A) working physical activity classification (Phyac) derived from the type of work with the addition of a few non standardized questions and classified as low, intermediate and high (roughly corresponding to sedentary, moderate and vigorous); leisure physical activity was not considered since it was practically absent among males in rural communities in the early 1960’s; B) indicators of physical fitness (Fitscore) that were: i) arm circumference (in mm) following the technique reported in the WHO Manual [10] with the crude measurement cleaned for the contribution of subcutaneous tissue using a formula that included the tricipital skinfold thickness [11]; this characteristic was considered an indicator of muscular mass; ii) heart rate (beats/min) derived from a resting ECG; this characteristic was considered an indicator of cardio-circulatory fitness; iii) vital capacity (L/m2) following the technique reported in the WHO Manual [10] using the best of 2 attempts for analysis; this characteristic was considered a respiratory indicator of fitness; C) energy intake calculated in daily Kilocalories’ intake derived from a dietary survey based on dietary history, using a questionnaire administered by trained, experienced and supervised technicians and computed from local food tables [9]; D) other variables used as possible confounders in multivariate predictive analysis were: 1) age (years) approximated to the nearest birthday; 2) cigarettes smoked on average per day (n/day), adopted since preliminary analyses showed that in the long run ex-smoker had a risk rather similar to the non-smokers (both groups being classified with zero cigarettes); 3) body mass index (kg/m2) following the technique reported in the WHO Manual [10]; 4) systolic blood pressure (mmHg) measured in supine position at the end of a physical examination, using a mercury sphygmomanometer, following the technique reported in the WHO Manual [10 adopting the average of two measurements taken 1 min apart as analytical variable; 5) serum cholesterol (mmol/L) measured in casual blood samples following the technique by Anderson and Keys [12].
Mortality data.
During 61 years, out of 1712 men enrolled at baseline there were 1708 deaths, 3 men were still alive with age ranging 102 to 106 years, and 1 man was lost to follow-up after year 50 of follow-up when he was aged 91 years. End-points for this analysis were all-cause mortality and, for those who died, age at death in years. However, the 4 men still alive or lost to follow-up received an estimate of age at death adopting the age when last seen alive and then included in all the analyses.
Age at death is an old demographic metrics that has been recently re-evaluated [13]. However, its use in population cohort studies is legitimate only if the cohorts are extinct or nearly extinct.
Statistical Analysis.
Phyac was used as originally defined and classified in 3 classes (low, intermediate, high) roughly corresponding to sedentary, moderate and vigorous physical activity (Phyac1, Phyac2, Phyc3); Fitscore was a Factor Score derived from a Principal Components Analysis (PCA) where the 3 indexes of fitness were fed for the computation. The PCA coefficients of the 3 indexes were -0.1404 for heart rate, +0.6812 for vital capacity and +0.6433 for arm circumference (see Appendix). Each individual had a value of Fitscore represented by the factor score of the PCA and the rank list was divided into 3 tertile classes corresponding to low, intermediate and high levels (Fitscore1, Fitscore2, Fitscore3). Calories were treated, in the majority of analyses, into 3 tertile classes (low, intermediate, high) similar to Fitscore. The 3 classes of Fitscore and Calories had different numerical sizes compared to Phyac as a consequence of the different procedure adopted for their creation.
Mean baseline levels of the various variables were computed. Mean levels of arm circumference, heart rate and vital capacity were distributed into 3 classes of Phyac, Fitscore and Calories and ANOVA computed across the 3 levels.
Tests of the predictive power of the 3 indexes were made as follows: a) Kaplan Meier survival versus all-cause mortality separately for Phyac, Fitscore and Calories each divided in 3 classes; b) Cox proportional hazards models with all-cause mortality as end-point run in 3 different shapes i.e. with Phyac alone (model 1), then with Phyac and Fitscore (model 2) and then with Phyac, Fitscore and Calories (model 3) as covariates with the addition, as possible confounding variables, of age, cigarette smoking, body mass index, systolic blood pressure, and serum cholesterol. The 3 main covariates were used as divided in 3 classes (the lowest being used as reference). The Cox model with all-cause mortality could be run, despite the practical extinction of the cohort, since it included the role of time and survival; c) Multiple Linear Regression (MLR) models with age at death as end-point run in 3 different shapes with Phyac alone (model 1), then with Phyac and Fitscore (model 2) and then with Phyac, Fitscore and Calories (model 3) as covariates with the addition, as confounding variables, of age, cigarette smoking, body mass index, systolic blood pressure, and serum cholesterol. The 3 main covariates again were used as divided in 3 classes (the lowest being used as reference). For both Cox and MLR models T tests comparing coefficients were computed.
RESULTS
Baseline variables.
Baseline mean levels of the variables used in the analysis are given as reference in Table 1. They reflect the levels common among men in rural environments in Italy in the 1960’s with relatively high mean levels of blood pressure and smoking habits and relatively low mean levels of serum cholesterol. Also energy intake was relatively high, but justified by the high physical activity levels. Phyac, divided in 3 classes, showed an excess of vigorous physical activity justified by the large number of farmers in the population sample.
Phyac and Fitscore versus Caloric Intake.
In Table 2, mean levels of calories intake regularly increased from class 1 to class 3 of the 2 indexes and in both cases ANOVA across the 3 classes was highly significant for heterogeneity and trend.
Phyac and Fitscore versus Indicators of Fitness.
In Table 3 there were increasing levels of arm circumference and vital capacity across the 3 classes of Phyac, Fitscore and Calories indexes, while the reverse was the case for heart rate. In all cases ANOVA was highly significant for heterogeneity and trend. Using the original units of measurement, the correlation coefficients (R) of Fitscore versus Calories was 0.25; of Fitscore versus Phyac was 0.24 whereas of Phyac versus Calories was 0.21, all of them highly significant.
Prediction of 61-year mortality and age at death by Phyac and Fitscore.
Kaplan Meier survival curves (Figure 1) for Phyac showed a clear separation of the curves for Class 1 (low-sedentary) while those for classes 2 and 3 largely overlapped. The 3 survival curves for Fitscore, instead, were largely segregated with longer survival for intermediate and high levels. Also, survival curves for Calories were rather separated with worse survival for the low class. All characteristics showed strong significant levels for p of log rank chi2 (p<0.0017 for Phyac, p<0.0001 for Fitscore, and p<0.0001 for Calories).
Cox proportional hazards models predicting all-cause mortality in 61 years showed a negative algebraic sign for all coefficients and all had significant p values except marginally for Phyac2 in models 2 and 3 (Table 4). Fitscore coefficients were all significant and in general greater than those of Phyac although the differences never reached a significant level. Also, coefficients for Calories in model 3 were statistically significant. In all cases low levels of Phyac, Fitscore and Calories had adverse effects while the opposite was the case for high levels.
Similar findings were seen for MLR models predicting age at death in 61 years of follow-up (Table 5). Coefficients of Phyac, Fitscore and Calories (that should be interpreted as relative risk versus the reference variable) were all positive and significant with beneficial effects of their high levels. The addition of Fitscore in model 2 and of Calories in model 3 were associated with slight not significant decreases in the levels of Phyac coefficients. The advantages for age at death associated with high levels of the 3 major covariates ranged 1.9 to 3.5 years.
A series of 24 comparisons between couples of major determinants coefficients were made as follows: Phyac versus Fitscore in the same models; Phyac versus Phyac in different (parallel) models; Fitscore versus Fitscore in different (parallel) models. None of the comparisons, done independently for Cox and MLR models, was statistically significant.
DISCUSSION
The purpose of this analysis was at validating rough physical activity classification using characteristics bound to physical fitness and caloric intake. Actually, we had another source for validation consisting in caloric expenditure estimated by ergonometric measurements performed in men classified in the same way, with mean levels <2400 kcalories for sedentary activity, between 2400 to 3000 for moderate activity and >3000 for vigorous activity [14]. Unfortunately, the original individual data are not anymore available and could not be used for this analysis.
Present findings suggest that a score of physical fitness (Fitscore), produced by combining the role of arm circumference, heart rate and vital capacity, is equally or even more predictive of 61-year mortality deaths and age at death when compared with the original classification of Phyac. Moreover, even 3 classes of energy intake in Kcal, are well related with the fitness indexes and also predictive of events. The interesting fact is that, despite the relationship across Phyac, Fitscore and Calories, these 3 characteristics produce significant and additive coefficients when forced in the same multivariate models. Proper tests were made and no problems were found in terms of multicollinearity, with high levels of tolerance.
The apparent conclusion is that the 3 classes of physical activity of the original classification are well related to the indicators of fitness involving muscular mass (arm circumference), circulatory (heart rate) and respiratory (vital capacity) functions and to energy expenditure justifying their valuable predictive power of events. Moreover, the strong connections between Fitscore and Phyac is confirmed by the fact that 80% of men located in the high class of Fitscore were classified as having a high class of Phyac.
A somewhat unexpected but interesting finding consisted in the favorable relationship of energy intake with mortality and age at death. This can be explained by the fact that in this rural population those with higher energy intake were mainly the same who spent many calories during the long working days in the fields. From a metabolic point of view, energy intake, in case of probable energy balance, is a good estimate of energy expenditure.
A relatively simple score like that suggested here indicated that arm circumference, heart rate and vital capacity are objective indicators of muscular, cardio-circulatory and respiratory fitness and give a significant contribution to the current knowledge in this field. We recommend that further comparative studies be carried out, including the female sex and considering leisure physical activity that nowadays is the prevalent one. On the other hand, from a technical point of view, adopting these 3 measurements is not anymore so complex as in the past mainly for the availability of modern spirometers that are definitely superior to the old-fashioned ones used in this study.
Therefore, the 3 classes of occupation physical activity in the original Seven Countries Study classification [3-5] are well related to the indicators of fitness involving muscular mass (arm circumference), circulatory (heart rate), and respiratory (vital capacity) functions, thus leading to their valuable predictive power of events. The Fitscore derived from the above indicators represents an outperforming and powerful predictor of all-cause death and age at death [6]. The literature does not offer contributions really similar to the present one due to different definitions of physical activity, physical fitness and the rare use of energy intake so that comparisons with our findings can be only indirect.
We used a single or few questions to define the levels of working physical activity and a similar approach was followed by others but the conclusion was that it is not enough to classify in a proper way people with sedentary habits [15]. Other investigators measured the time spent in physical activity to reach a valuable classification [16]. There were several other methods to classify physical activity including self-reported information [17], the use of activity pattern questionnaires 18], the estimate of metabolic equivalents [19].
In most studies physical fitness was defined by the outcome of maximal exercise testing, either comparing physical activity with physical fitness or considering only physical fitness [17-24]. In general, comparative studies showed a better performance of physical fitness than physical activity, like partly was the case in our previous experience [1,2]. Among studies focused on single fitness indicators two contributions deserve mention since they stress the beneficial role of physical activity on respiratory function and the role of the later as predictor of all-cause mortality [25,26]. Moreover, it is interesting to learn that cardiometabolic risk factors can be improved by increasing muscular strength. [27].
There are recent contributions, like a large metanalysis, suggesting that high levels of working physical activity are not protective versus cardiovascular diseases and all-cause mortality [28]. This conclusion seems to include both recent studies and older studies published before 1989. On the other hand, the same metanalysis suggests the protective role of leisure physical activity. From this point of view, our population did not engage in leisure physical activity that anyhow would have been difficult to describe because those times the complex questionnaires on leisure physical activity were not available. Moreover, nowadays the levels of working physical activity are probably smaller than those observed in the 1960’s in a rural environment.
In conclusion, our findings point to the protective role of working vigorous physical activity versus all-cause mortality and age at death based at least as roughly measurable in the mid of last century, together with a simple score of fitness and the energy intake whose roles are related but also cumulative.
Author Contributions
A.M. and P.E.P. contributed to the conception, design, work analysis, interpretation of data, draft of the manuscript, final approval and agreed to be accountable for all aspects of work ensuring integrity and accuracy.
Funding
For the initiation of the Italian Section of Seven Countries Study of Cardiovascular Diseases, funds were received from Prof Ancel Keys, University of Minnesota, USA, obtained as research grants from the National Heart Institute (later NHLBI) and the American Heart Association. Other funds obtained at national level came from the: Association for Cardiac Research, Rome; Centre of Cardiovascular Disease, S. Camillo Hospital, Rome; City of Naples; National Institute of Public Health (ISS); National Research Council (CNR); European Union; Centre for the Fight against Infarction, Rome. Analysis and writing of this contribution were not covered by the above funds.
Conflicts of Interest:
None to declare.
Data availability
The data and computing codes are not available for replication because the original data are not publicly available, although the Board of Directors of the Study may evaluate specific requests for dedicated analyses.
Institutional review board statement
The Board of Directors of the various institutions involved in data collections (4 in the case of [6]) were de facto playing the role of Ethical Committee approving the execution of the study on the basis of the local existing legislation by the date this investigation started.
Informed consent
Baseline measurements were taken before the era of the Helsinki Declaration and approval was implied in participation, while verbal or written consent was obtained for the collection of follow-up data.
Appendix
Introduction
The positive outcome of this analysis suggested the idea to provide the readers with a means to estimate, in a single individual, its factor score and to locate it in one of the 3 tertile classes (low, intermediate or high). The basic procedure, i.e. taking measurements of the 3 fitness indexes can be done without difficulties. The transformation of the indexes into the Fitscore, calls instead for substantial needs, dealing with the Principal Component Analysis (PCA) coefficients to be used. In fact, the coefficients produced in this contribution deal with a population having very high levels of working vigorous physical activity and relate substantially to a Mediterranean country.
Another option is to adopt the coefficients produced using the same technique in the pool of 7 cohorts in 4 countries of the Seven Countries Study (Finland, the Netherlands, Italy and Greece) published previously [6] that related to the mix of different and partly contrasting European cohorts, and derive from a definitely larger denominator (5482 instead of 1712). This source, however, does not include the estimate and use of caloric intake.
Material
The following material is needed: 1) flexible ruler for measurement of arm circumference; 2) plicometer for measurement of tricipital skinfold thickness in the same arm; 3) spirometer for measurement of vital capacity; 4) stiff ruler for measurement of height; 5) chronometer watch to measure heart rate (or the availability of an ECG tracing); 6) pocket calculator.
Measurement of ARM CIRCUMFERENCE. It is taken at right arm, pendant and relaxed, at mid-way between acromion and olecranon using a flexible steel or plastic ruler, expressed in mm.
Measurement of TRICIPITAL SKINFOLD THICKNESS.It is taken on the back side of the same arm as above, pendant and relaxed, using a plicometer applied to the skinfold lifted (with fingers) parallel to the long axis of arm, in mm. Tricipital skinfold should be used to clean the crude arm circumference from the subcutaneous tissue and to retain the size of the muscular mass. The following formula is applied (all in mm):
Clean arm circumference = Crude arm circumference – (tricipital skinfold * 3.14)
Measurement of HEART RATE. Can be measured by traditional pulse tasting during a full period of one minute, after at least 5 minutes rest in sitting or supine position (in beats per minute). The availability of a resting ECG would be a better option.
Measurement of VITAL CAPACITY. The procedure, relatively complex and detailed, can be usually found attached to the spirometer. The mouthpiece should be held between teeth and lips, and the subjects should take a long inspiration followed by a strong, and as long as possible, expiration. Usually, 2 tests are made and the best of the two is retained for analysis, expressed in liters and deciliters.
Measurement of HEIGHT. It is measured without shoes, the back square against a wall tape with straight visual, and a set square on the scalp, in cm. Height is needed to express vital capacity adjusted for body surface using the following formula:
Adjusted Vital capacity = crude Vital capacity (in liters)/height2 (in meters, centimeters).
Computation of Fitness score
Each of the 3 indexes should be Z transformed (the new distribution has average = 0 and standard deviation =1) i.e.
Z transformed = (original level - average level of reference population)/SD of the same population
The levels of the 3 indexes in the reference population are for average and (SD=standard deviation):
Arm circumference 262.8 (22.5), Heart rate 68.5 (13.1), Vital capacity 1.54 (0.24)
Then, the following calculations are done to obtain the individual level of Fitness score, i.e. by applying the PCA coefficients (derived from the mix of the European cohorts) to the Z transformed indexes Z as follows:
Fitness score = (Heart rate Z *(-0.1404)) + (Vital capacity Z *0.6812) + (Arm Z *0.6433)
The final Fitness score should be classified as low, intermediate and high on the basis of the following groups: a) Low: between -5.04 to -0.391; b) Intermediate: between -0.390 to +0.395; c) High: between +0.396 to +3.850.
Comments
It must be taken into account that the estimate relates only to men aged 40 to 59 years. Still, also this approach could not be satisfactory but a relatively new simple study may easily provide better indications. It should consist in enrolling a defined population, measuring the 3 fitness indexes and produce the PCA coefficients, to apply them for the conversion in factors scores that will be divided into 3 tertiles. There are high probabilities that the 3 tertiles will identify 3 levels of Fitness and at the same time 3 levels of risk due to the strong association of the indexes with the further events independently from their inclusion in the Fitscore.
References
- Powell KE, Paffenbarger RS Jr. Workshop on epidemiologic and public health aspects of physical activity and exercise: a summary. Public Health Rep 1985; 100: 118-126.
- Warburton DER, Nicol CW, Bredin SSD. Health benefits of physical activity: the evidence. Can Med Ass J 2006; 174: 801-809.
- Menotti A, Puddu PE, Maiani G, Catasta G. Age at death as a useful indicator of healthy aging at population level: a 50-year follow-up of the Italian rural areas of the seven countries study. Aging Exper Clin Res (Springer) 2018; 30: 901-911.
- Menotti A, Puddu PE, Catasta G. Determinants of longevity and age at death in a practically extinct cohort of middle-aged men followed-up for 61 years. Aging Clin Exper Res Aging Clin Exp Res 2022; 34: 1247-1258.
- Seccareccia F, Menotti A. Physical activity, physical fitness and mortality in a sample of middle-aged men followed-up for 25 years. J Sports Med Phys Fit 1992; 28: 335-341.
- Menotti A, Puddu PE, Geleijnse JM, Kafatos A, Tolonen H. Physical activity and physical fitness in prediction of all-cause mortality and age at death in European extinct cohorts of middle-aged men followed for 60 years. Eur J Prev Cardiol 2024; 31: 1441-1448.
- Puddu PE, Kafatos A, Tolonen H, Geleijnse JM, Menotti A. Occupational physical activity and fitness in predicting cardiovascular mortality among European cohorts of middle-aged men: a 60-year follow-up in the Seven Countries Study. Hearts 2024; 5: 259-274.
- Menotti A, Puddu PE. How the Seven Countries Study contributed to the launch and development of cardiovascular epidemiology in Italy. A historical perspective. Nutr Metab Cardiovasc Dis 2020; 30: 368-383.
- Fidanza F, Versiglioni N. Tabelle di composizione degli alimenti. Idelson: Napoli, Italy, 1981 (Food Composition Tables).
- Rose G, Blackburn H Cardiovascular survey methods. Geneva, World Health Organization, 1968: 1-188.
- Hemsfield SB, MacManus C, Smith J, Stevens V, Nixon DW. Anthropometric measurement of muscle mass: revised equations for calculating bone-free arm muscle area. Am J Clin Nutr 1982; 36: 680-690.
- Anderson JT, Keys A. Cholesterol in serum and lipoprotein fractions: its measurement and stability. Clin Chem 1956; 2:145-159.
- Robine JM. Age at death, the return of an old metrics whose impact is growing. Aging Clin Exper Res 2018; 30: 1147-1149.
- Menotti A, Puddu V. Ten-year mortality from coronary heart disease among 172,000 men classified by occupational physical activity. Scand J Work Environ Health 1979; 5: 100-108.
- Macera CA, Ham SA, Jones DA, Kimsey CD, Ainsworth BE, Neff LJ. Limitations on the use of a single screening question to measure sedentary behavior. Am J Public Health 2001; 91: 2010-2012.
- Ainsworth BE, Bassett DRjr, Strath SJ, Swartz AM, O’Brien WL, Thompson RW, Jones DA, Macera CA, Kimsey CD. Comparison of three methods for measuring the time spent in physical activity. Med Sci Sports Exerc 2000; 32: S457-S464.
- Davidson T, Vainshelboim B, Kokkinos P, Myers J, Ross R. Cardiorespiratory fitness versus physical activity as predictors of all-cause mortality in men. Am Heart J 2018; 196: 156-162.
- Myers J, Kaykha A, George S, Abella J, Zaheer N, Lear S, Yamazaki T, Froelicher V. Fitness versus physical activity patterns in predicting mortality in men. Am J Med 2004; 117: 912-918.
- Myers J, McAuley P, Carl J Lavie CJ , Despres JP, Arena R, Kokkinos P. Physical activity and cardiorespiratory fitness as major markers of cardiovascular risk: their independent and interwoven importance to health status. Prog Cardiovasc Dis 2015; 57: 306-314.
- Villeneuve PJ, Morrison HI, Craig CL, Schaubel DE. Physical activity, physical fitness, and risk of dying. Epidemiology 1998; 9: 626-631.
- DeFina LF, Haskell WL, Willis BL, Barlow CE, Finley CE, Levine BD, Cooper KH. Physical activity versus cardiorespiratory fitness: two (partly) distinct components of cardiovascular health? Prog Cardiovasc Dis 2015; 57: 324-329.
- SSandvik L, Erikssen J, Thaulow E, Erikssen G, Mundal R, Rodahl K. Physical fitness as a predictor of mortality among healthy, middle-aged Norwegian men. N Engl J Med 1993; 328: 533-537.
- Blair SN, Kampert JB, Kohl HW 3rd, Barlow CE, Macera CA, Paffenbarger RS Jr, Gibbons LW. Influences of cardiorespiratory fitness and other precursors on cardiovascular disease and all-cause mortality in men and women. JAMA 1996; 276: 205-210.
- Kodama S, Saito K, Tanaka S, Maki M, Yachi Y, Asumu M, Sugawara A, Totsuka K, Shimano H, Ohashi Y, Yamada N, Sone H. Cardiorespiratory fitness as a quantitative predictor of all-cause mortality and cardiovascular events in healthy men and women: a meta-analysis. JAMA 2009; 301: 2024-2035.
- Cheng YJ, Macera CA, Addy CL, Sy FS, Wieland D, Blair SN. Effects of physical activity on exercise tests and respiratory function. Br J Sports Med 2003; 37: 521-528.
- Weinmayr G, Schulz H, Klenk J, Denkinger M, Duran-Tauleria E, Koenig W, Dallmeier D, Rothenbacher D and ActiFE Study Group. Association of lung function with overall mortality is independent of inflammatory, cardiac, and functional biomarkers in older adults: the ActiFE-study. Sci Rep 2020; 10: 11862.
- Lopez-Jaramillo P, Lopez-Lopez JP, Tole MC, Cohen DD. Increasing muscular strength to improve cardiometabolic risk factors. Clin Investig Arterioscler 2023; 35: 144-154.
- Cillekens B, Huysmans MA, Holtermann A, van Mechelen W, Straker L, Krause N, van der Beek AJ, Coenen P. Physical activity at work may not be health enhancing. A systematic review with meta-analysis on the association between occupational physical activity and cardiovascular disease mortality covering 23 studies with 655892 participants. Scand J Work Environ Health 2022; 48: 86-98.
Figure 1.
Kaplan-Meier survival in 61 years as a function of 3 classes of Phyac, and 3 tertiles of Fitness score and energy intake. In all graphs: Line 1=low; Line 2=intermediate; Line 3=high.
Figure 1.
Kaplan-Meier survival in 61 years as a function of 3 classes of Phyac, and 3 tertiles of Fitness score and energy intake. In all graphs: Line 1=low; Line 2=intermediate; Line 3=high.
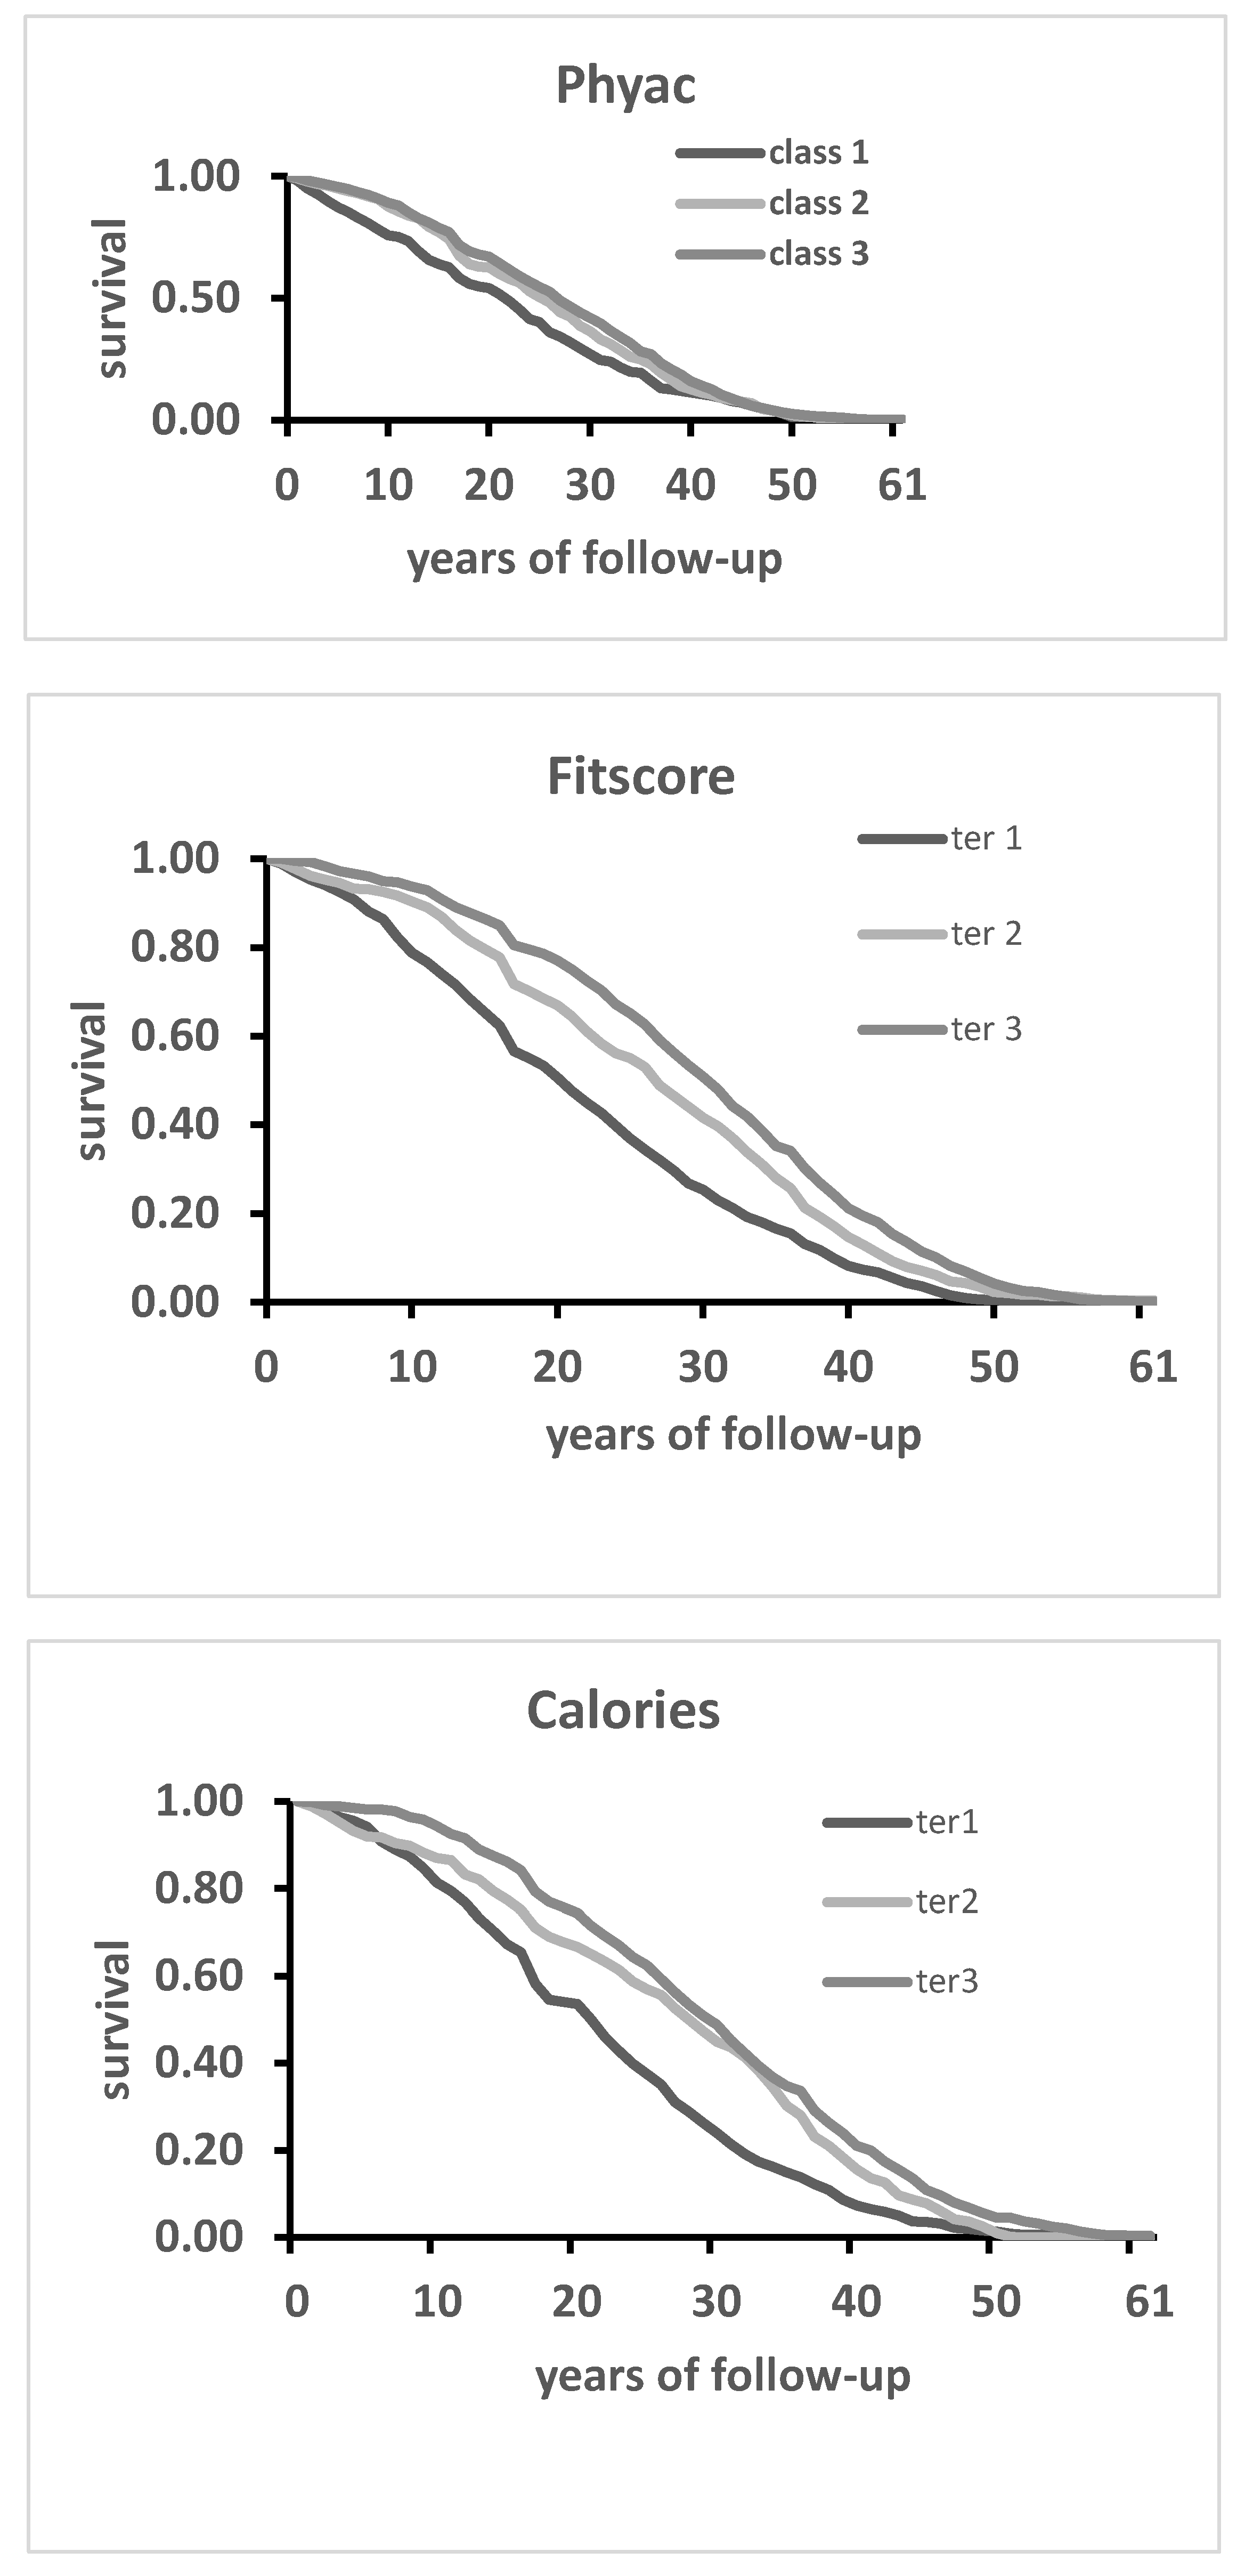

Table 1.
Baseline mean levels of variables used in the analysis.
| Variable | ||||||||
|---|---|---|---|---|---|---|---|---|
| Physical activity class | N | % (SE) | ||||||
| Low | 166 | 9.7 (0.7) | ||||||
| Intermediate | 378 | 22.1 (1.0) | ||||||
| High | 1168 | 68.2 (1.1) | ||||||
| Fitness variables | Mean | SD | ||||||
| Arm circumference, mm | 268.6 | 23.6 | ||||||
| Heart rate, beats/min | 71.3 | 12.9 | ||||||
| Vital capacity, L/m2 | 1.65 | 0.24 | ||||||
| Calories | ||||||||
| Daily intake | 3112 | 647 | ||||||
| Calories, tertile 1 | 2463 | 346 | ||||||
| Calories, tertile 2 | 3108 | 131 | ||||||
| Calories, tertile 3 | 3766 | 517 | ||||||
| Confounding variables | ||||||||
| Age, years | 49.1 | 5.1 | ||||||
| Cigarette, N/day | 8.7 | 9.5 | ||||||
| Body mass index, kg/m2 | 25.2 | 3.7 | ||||||
| Systolic blood pressure, mmHg | 143.6 | 21.0 | ||||||
| Serum cholesterol, mmol/L | 5.21 | 1.06 | ||||||
N=number; SE=standard error; SD=standard deviation.
Table 2.
Mean values of caloric intake in 3 classes of Phyac and Fitscore.
| Variable | Mean (SD) | Mean (SD) |
|---|---|---|
| Class | Phyac low | Fitscore low |
| N | 166 | 571 |
| Energy, Kcal/day | 2816 (618) | 2919 (614) |
| Class | Phyac intermediate | Fitscore intermediate |
| N | 378 | 570 |
| Energy, Kcal/day | 2962 (602) | 3164 (650) |
| Class | Phyac high | Fitscore high |
| N | 1168 | 571 |
| Energy, Kcal/day | 3203 (643) | 3254 (629) |
| ANOVA across classes | P<0.0001 | P<0.0001 |
N: number; SE: standard error; SD: standard deviation.
Table 3.
Mean values of indicators of fitness in 3 classes of Phyac, Fitscore and Calories.
| Variable | Mean (SD) | Mean (SD) | Mean (SD) |
|---|---|---|---|
|
Phyac low N=166 |
Fitscore low N=571 |
Calories low N=571 |
|
| Arm circumference | 259.4 (5.2) | 255.6 (23.3) | 264.8 (25.5) |
| Heart rate | 77.4 (14.8) | 81.3 (13.4) | 73.8 (14.0) |
| Vital capacity | 1.59 (0.27) | 1.45 (0.21) | 1.58 (0.25) |
|
Phyac intermediate N=378 |
Fitscore intermediate N=570 |
Calories intermediate N=570 |
|
| Arm circumference | 268.1 (25.6) | 268.0 (19.9) | 268.6 (21.6) |
| Heart rate | 74.3 (13.5) | 69.2 (9.2) | 70.8 (12.1) |
| Vital capacity | 1.61 (0.25) | 1.65 (0.15) | 1.66 (0.23) |
|
Phyac high N=1168 |
Fitscore high N=571 |
Calories high N=570 |
|
| Arm circumference | 270.0 (22.1) | 282.0 (19.7) | 272.2 (22.9) |
| Heart rate | 69.5 (11.9) | 63.4 (8.2) | 69.3 (12.1) |
| Vital capacity | 1.67 (0.21) | 1.84 (0.18) | 1.70 (0.22) |
| ANOVA | |||
| Arm circumference | <0.0001 | <0.0001 | <0.0001 |
| Heart rate | <0.0001 | <0.0001 | <0.0001 |
| Vital capacity | <0.0001 | <0.0001 | <0.0001 |
Units of measurement as in Table 1.
Table 4.
Multivariate models predicting all-cause mortality (Cox) as a function of 3 classes of Phyac, Fitscore and Calories adjusted for 5 covariates.
Table 4.
Multivariate models predicting all-cause mortality (Cox) as a function of 3 classes of Phyac, Fitscore and Calories adjusted for 5 covariates.
| Coefficient | P value | Hazard ratio | 95% CI | |
|---|---|---|---|---|
| COX MODEL (1) predicting All-cause mortality Phyac only | ||||
| Phyac 1 | Reference | ---- | ---- | ---- |
| Phyac 2 | -0.1948 | 0.0383 | 0.82 | 0.68 0.99 |
| Phyac 3 | -0.2740 | 0.0004 | 0.76 | 0.64 0.90 |
| COX MODEL (2) predicting All-cause mortality with Phyac and Fitscore | ||||
| Phyac 1 | Reference | ----- | ----- | ----- |
| Phyac 2 | -0.1872 | 0.0465 | 0.83 | 0.69 1.00 |
| Phyac 3 | -0.2226 | 0.0089 | 0.80 | 0.68 0.95 |
| Fitscore 1 | reference | ----- | ----- | ----- |
| Fitscore 2 | -0.2286 | 0.0002 | 0.80 | 0.71 0.90 |
| Fitscore 3 | -0.2616 | 0.0001 | 0.77 | 0.68 0.87 |
| COX MODEL (3) predicting All-cause mortality with Phyac, Fitscore and Calories | ||||
| Phyac 1 | Reference | ----- | ----- | ----- |
| Phyac 2 | -0.1731 | 0.0658 | 0.84 | 0.70 1.01 |
| Phyac 3 | -0.1830 | 0.0342 | 0.83 | 0.70 0.99 |
| Fitscore 1 | reference | ----- | ----- | ----- |
| Fitscore 2 | -0.2010 | 0.0012 | 0.82 | 0.72 0.92 |
| Fitscore 3 | -0.2428 | 0.0002 | 0.78 | 0.70 0.89 |
| Calories 1 | reference | ----- | ----- | ----- |
| Calories 2 | -0.2394 | 0.0001 | 0.79 | 0.70 0.89 |
| Calories 3 | -0.1998 | 0.0023 | 0.82 | 0.72 0.93 |
CI: confidence intervals.
Table 5.
Multiple linear repression (MLR) models predicting age at death as a function of 3 classes of Phyac, Fitscore and Calories, adjusted for 5 covariates.
Table 5.
Multiple linear repression (MLR) models predicting age at death as a function of 3 classes of Phyac, Fitscore and Calories, adjusted for 5 covariates.
| Coefficient | P value | 95% CI | ||
|---|---|---|---|---|
| MLR model (1) predicting Age at death with Phyac only | ||||
| Phyac 1 | Reference | ----- | ----- | |
| Phyac 2 | 2.4898 | 0.0154 | 0.48 4.50 | |
| Phyac 3 | 3.2097 | 0.0005 | 1.41 5.00 | |
| MLR model (2) predicting Age at death with Phyac and Fitscore | ||||
| Phyac 1 | Reference | ----- | ----- | |
| Phyac 2 | 2.3688 | 0.0202 | 0.37 4.37 | |
| Phyac 3 | 2.5104 | 0.0064 | 0.71 4.31 | |
| Fitscore 1 | reference | ----- | ----- | |
| Fitscore 2 | 2.5132 | 0.0002 | 1.15 3.76 | |
| Fitascore 3 | 3.5287 | 0.0001 | 2.15 4.91 | |
| MLR model (3) predicting Age at death with Phyac, Fitscore and Calories | ||||
| Phyac 1 | Reference | ----- | ----- | |
| Phyac 2 | 2.1578 | 0.0339 | 0.17 4.15 | |
| Phyac 3 | 1.9303 | 0.0381 | 0.11 3.75 | |
| Fitscore 1 | reference | ----- | ----- | |
| Fitscore 2 | 2.1554 | 0.0012 | 0.85 3.46 | |
| Fitscore 3 | 3.2317 | 0.0001 | 1.85 4.61 | |
| Calories 1 | reference | ----- | ----- | |
| Calories 2 | 2.2916 | 0.0005 | 0.99 3.59 | |
| Calories 3 | 2.4836 | 0.0004 | 1.10 3.87 | |
CI: confidence intervals. Note: in these MLR models with dichotomic variables the levels of coefficients have the meaning of relative risk versus the respective reference variables.
Disclaimer/Publisher’s Note: The statements, opinions and data contained in all publications are solely those of the individual author(s) and contributor(s) and not of MDPI and/or the editor(s). MDPI and/or the editor(s) disclaim responsibility for any injury to people or property resulting from any ideas, methods, instructions or products referred to in the content. |
© 2024 by the authors. Licensee MDPI, Basel, Switzerland. This article is an open access article distributed under the terms and conditions of the Creative Commons Attribution (CC BY) license (http://creativecommons.org/licenses/by/4.0/).
Copyright: This open access article is published under a Creative Commons CC BY 4.0 license, which permit the free download, distribution, and reuse, provided that the author and preprint are cited in any reuse.


