Submitted:
05 December 2024
Posted:
05 December 2024
Read the latest preprint version here
Abstract
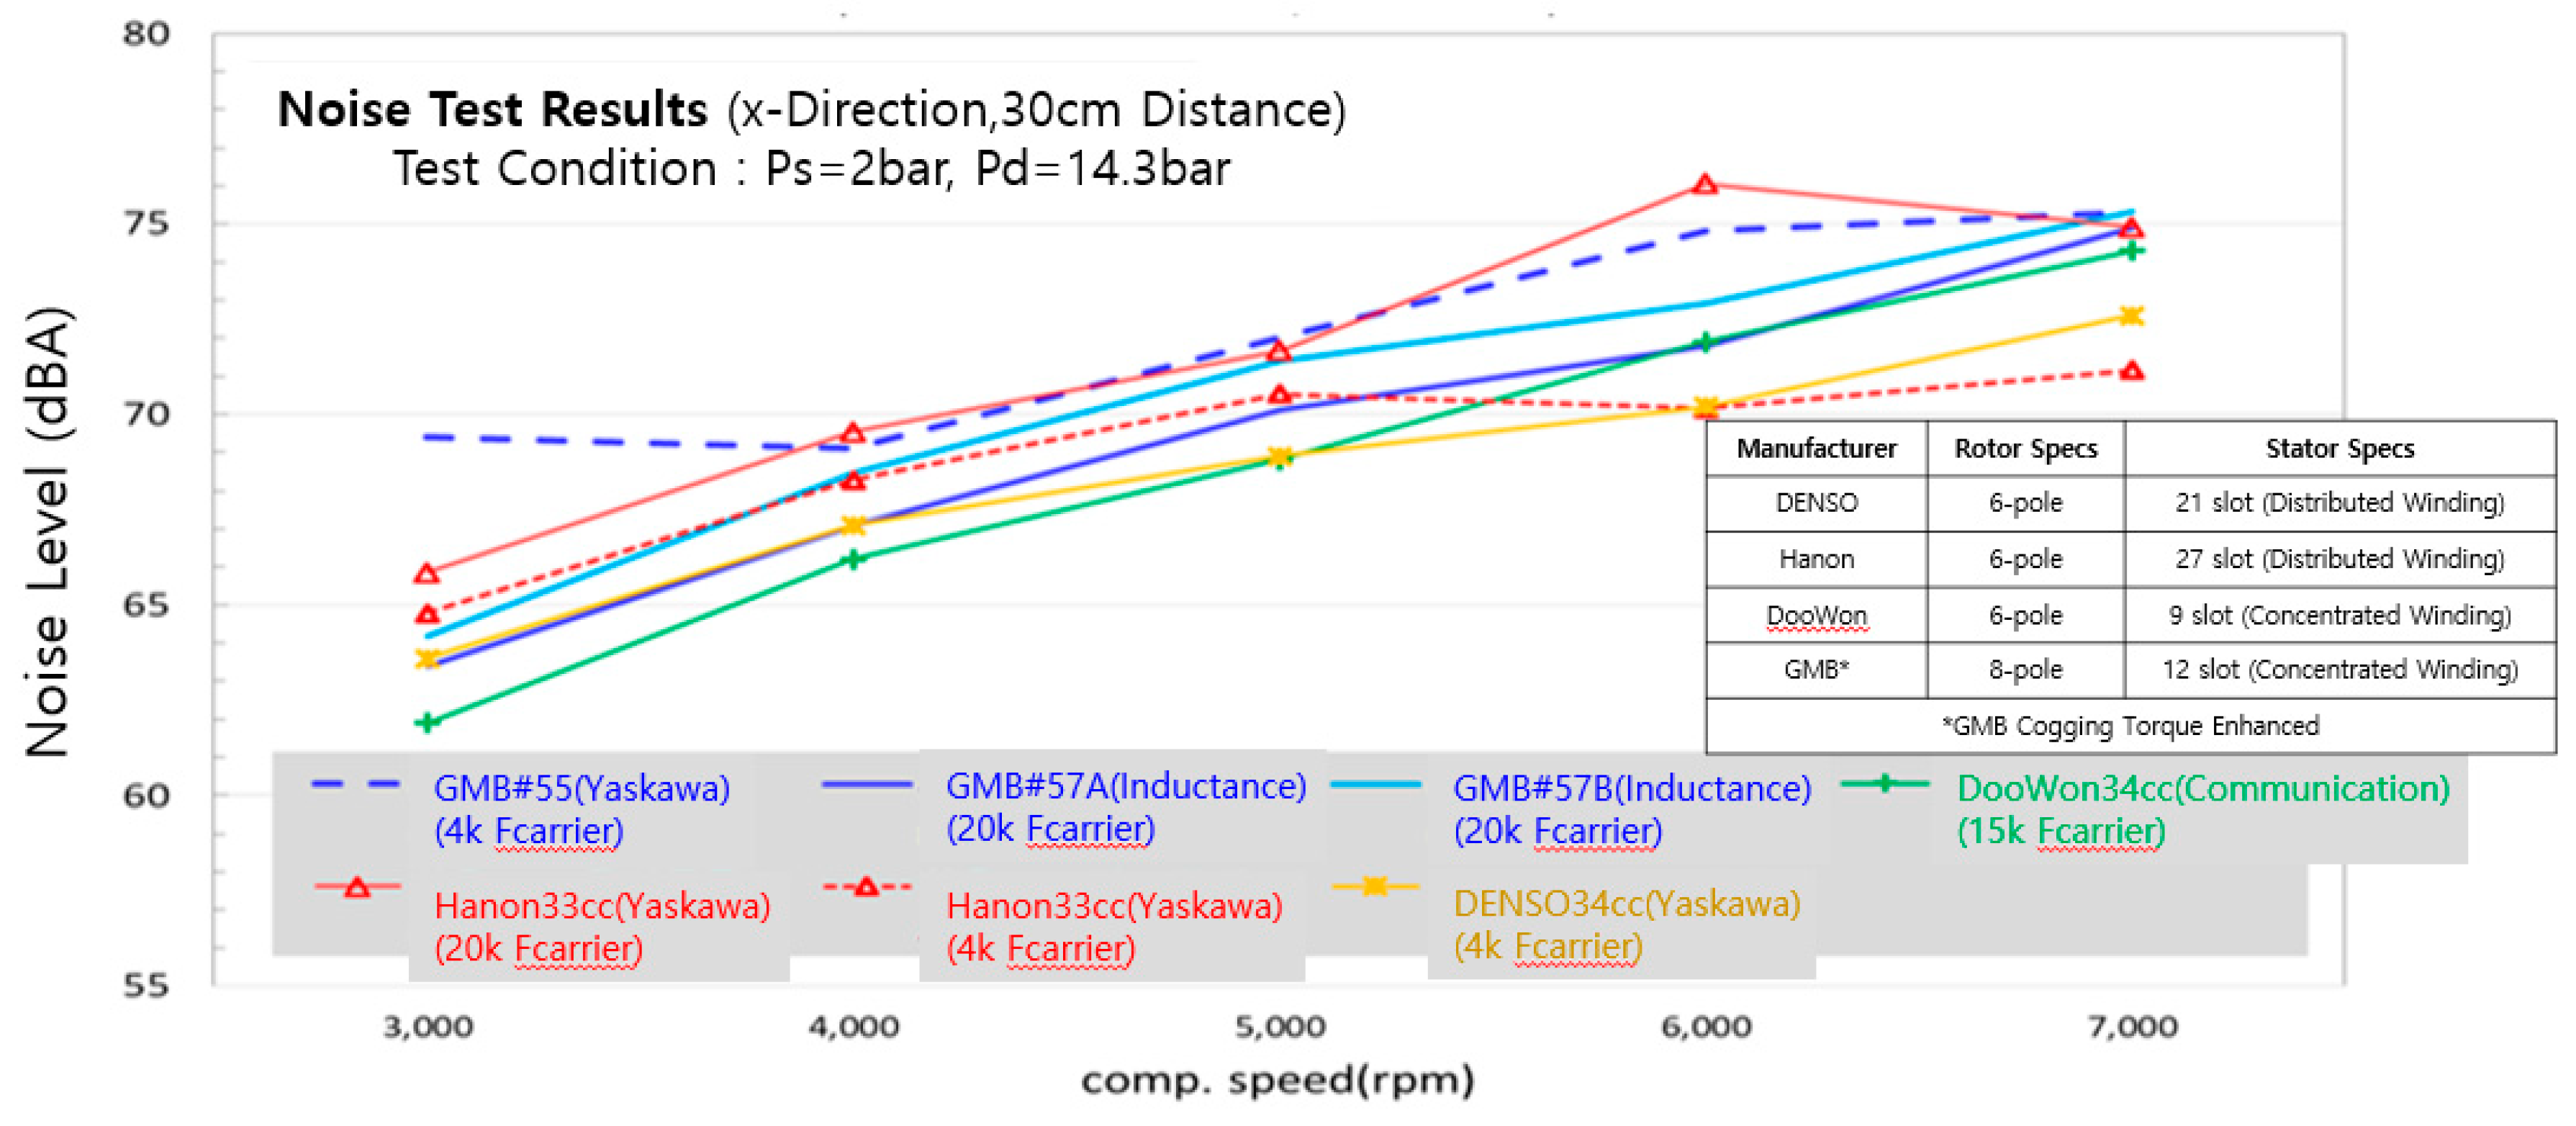
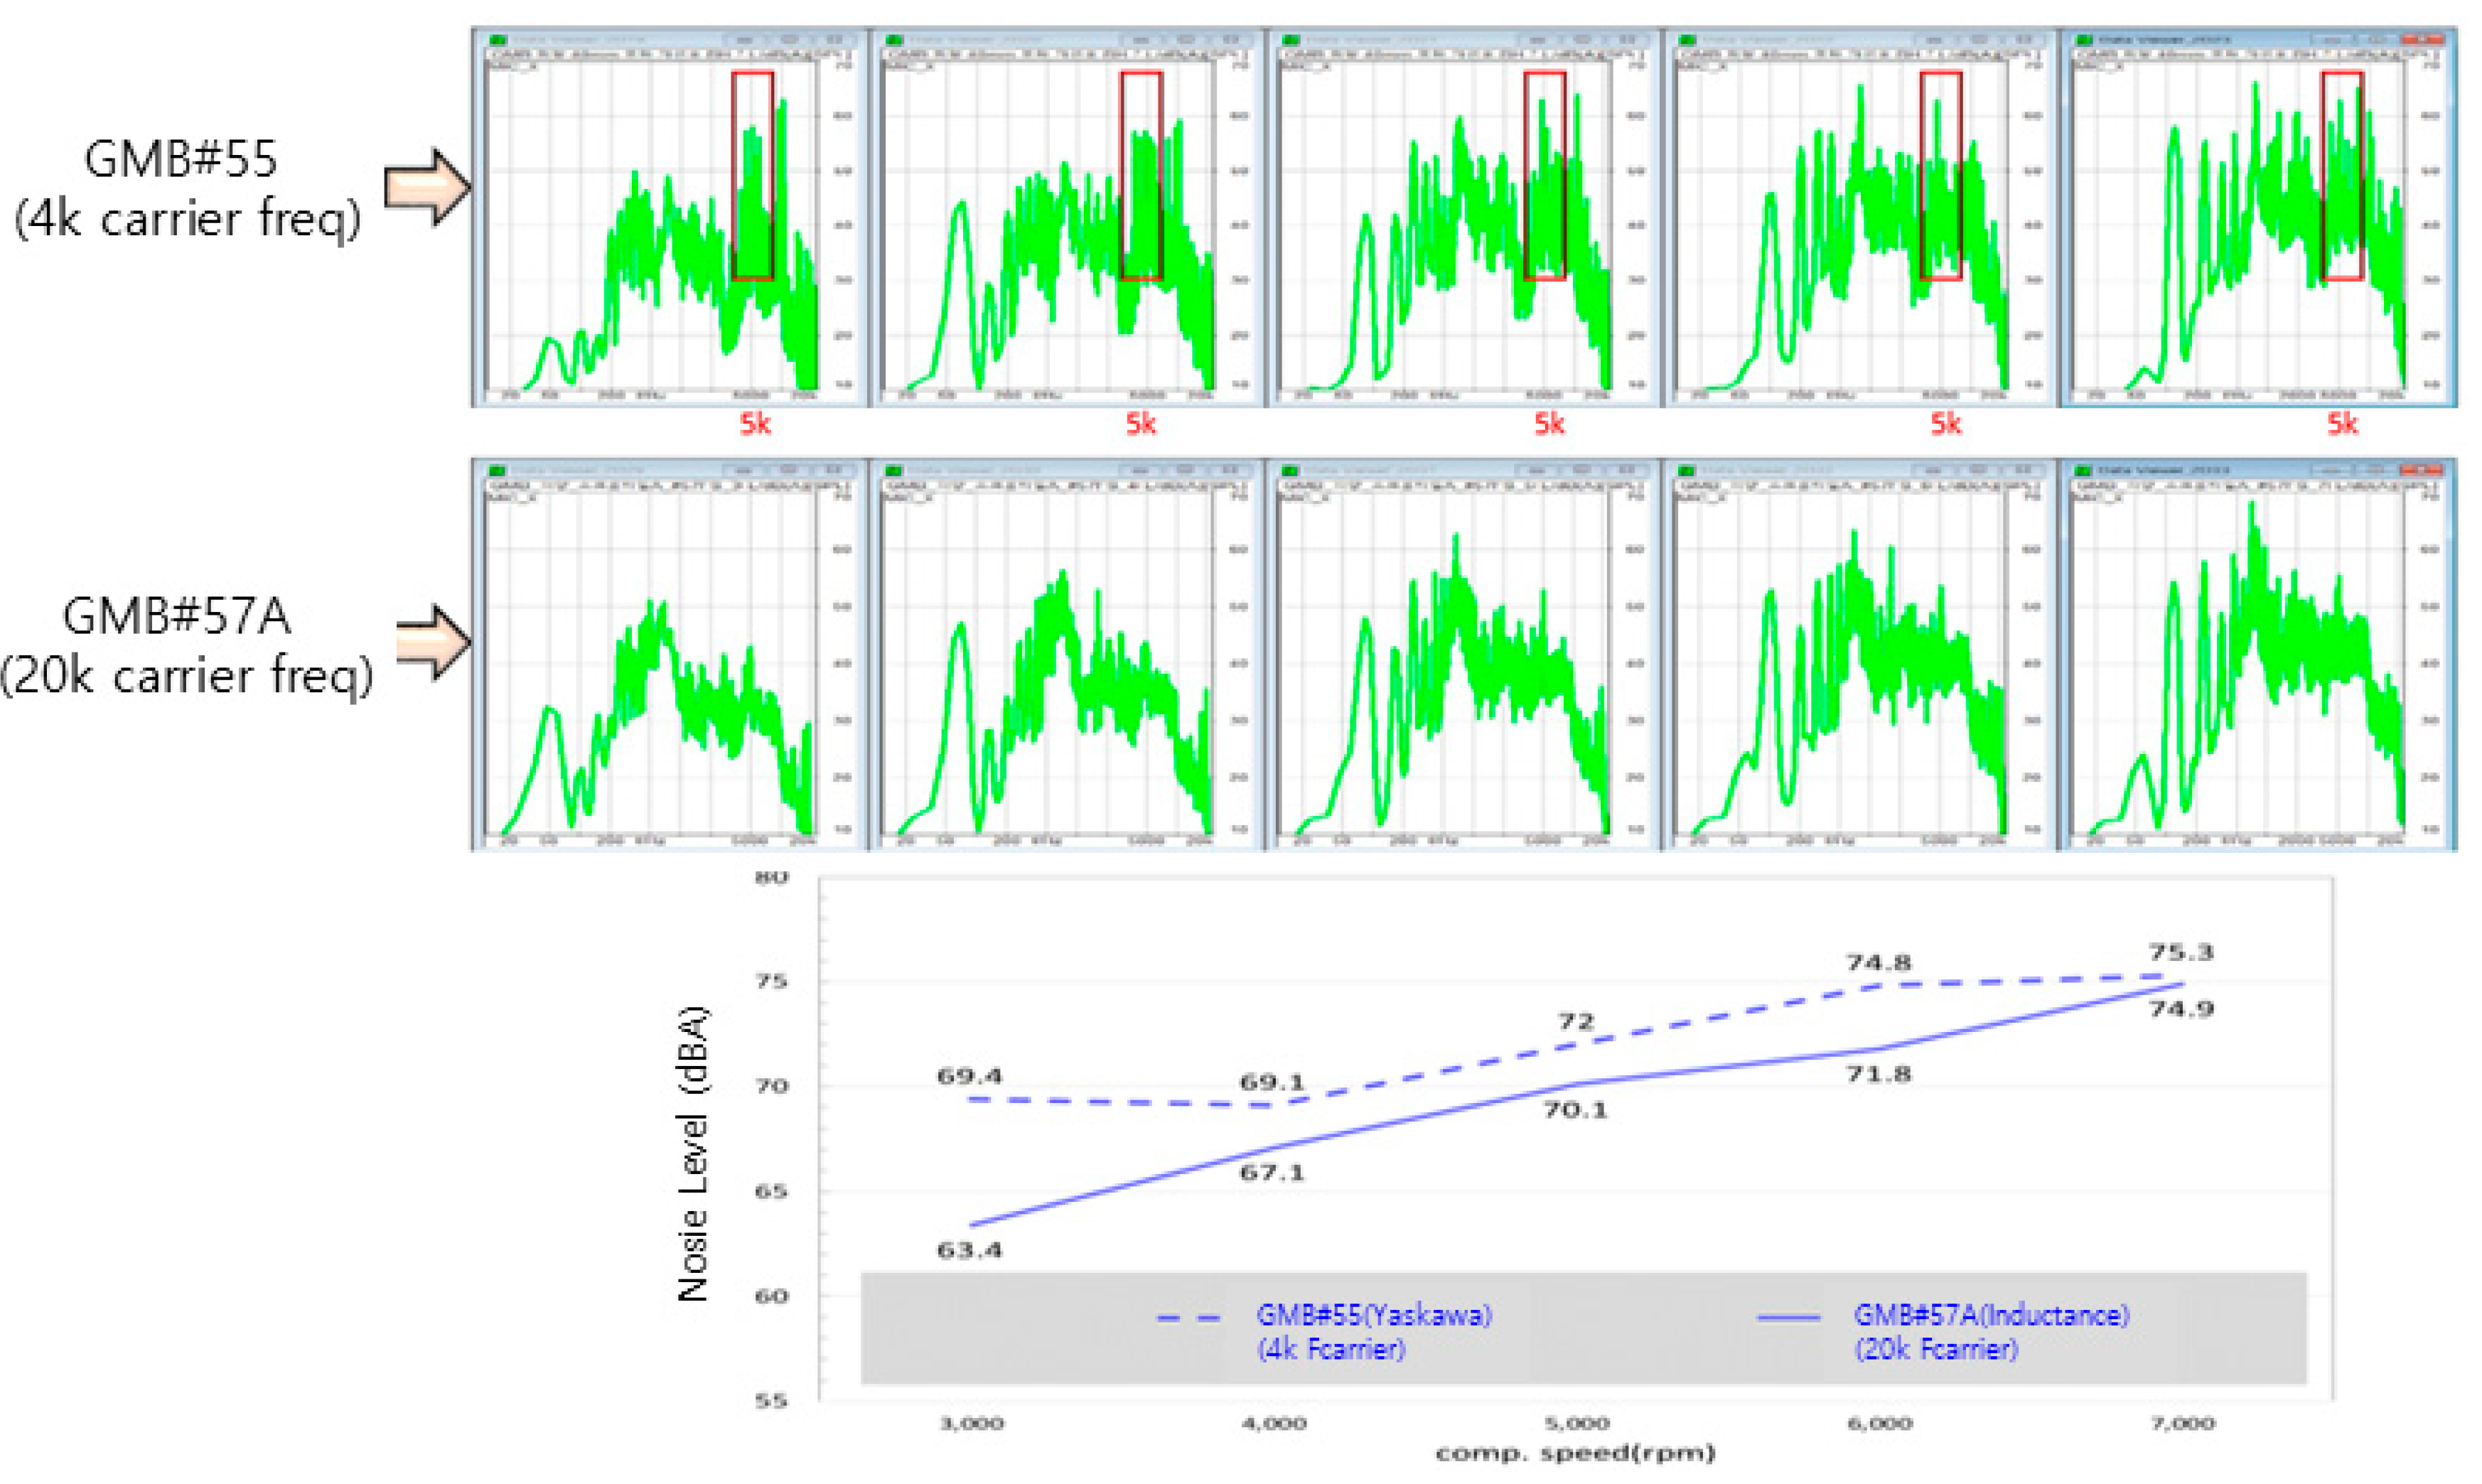
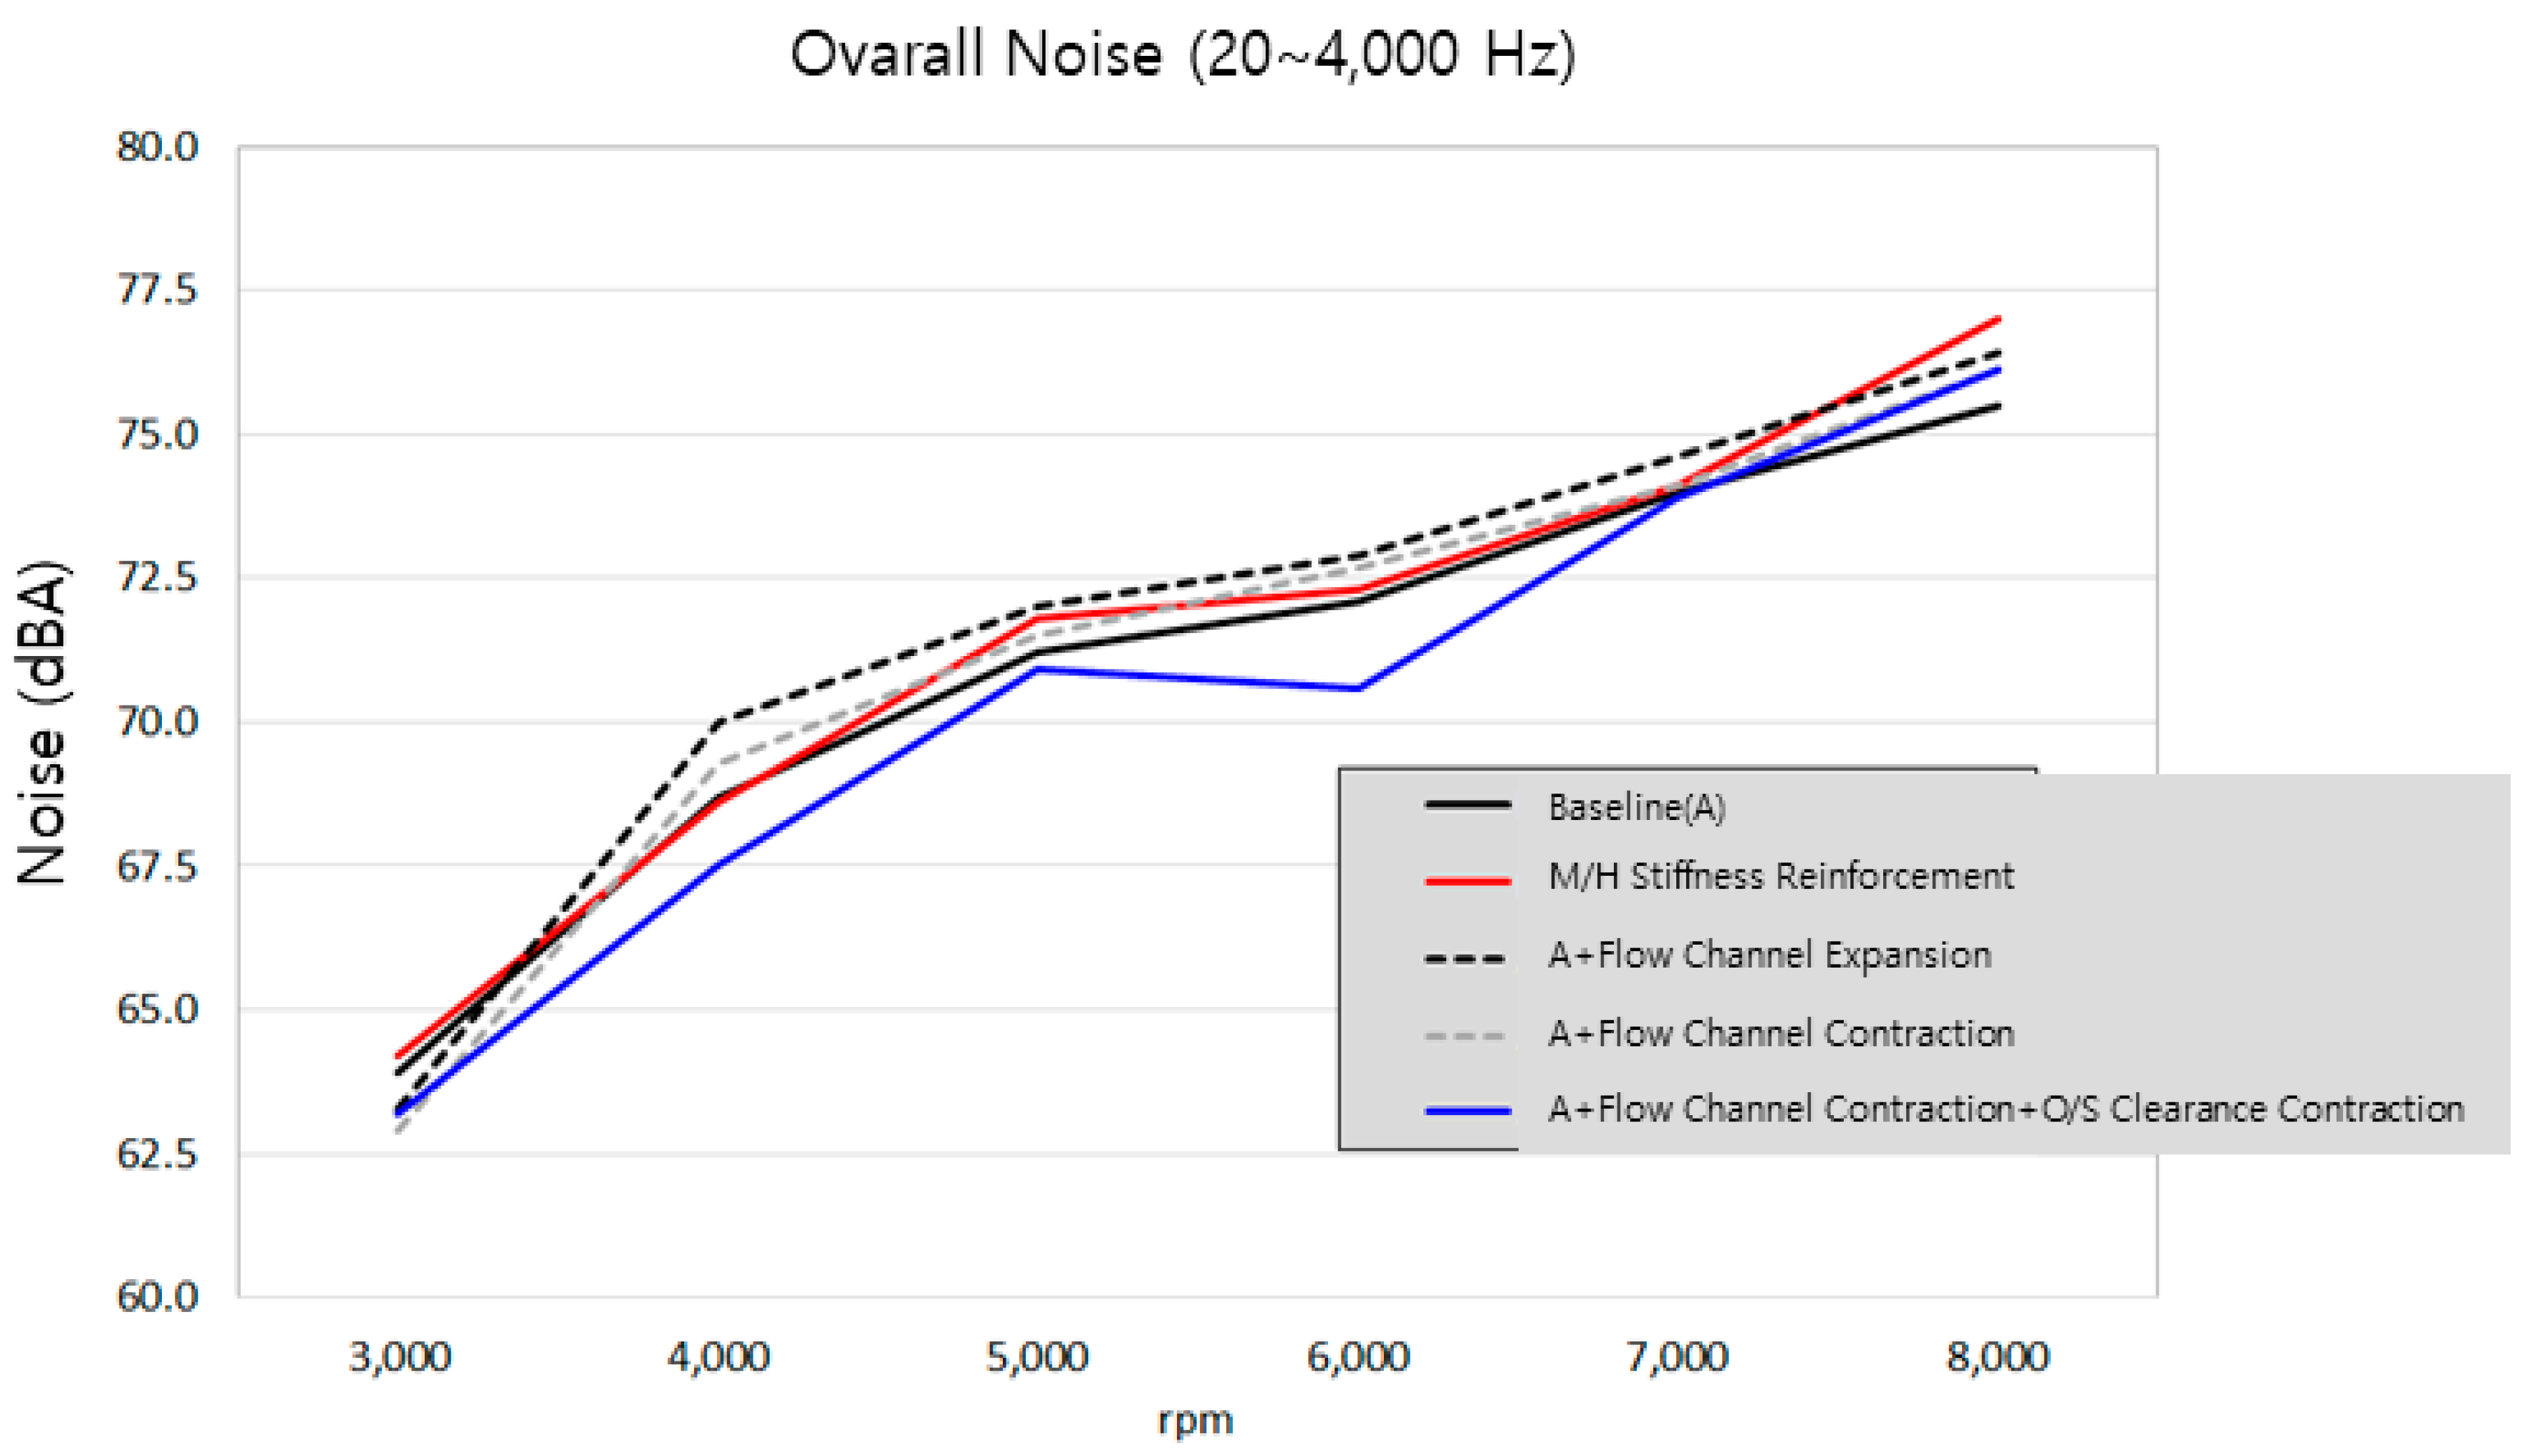
In this study, the causes of vibration and noise reduction occurring in electric compressors for electric vehicles are analyzed and a reduction plan is proposed. Firstly, after measuring the impact hammer modal on the housing of the electric compressor, it was compared and reviewed with the ANSYS Modal analysis. There was no significant difference between the analysis results of main housing, rear housing, and front housing and the measurement results, so the mode analysis was judged to be reliable. As a result of mode analysis of the single part status and assembly status of the part, it is judged that the natural frequency of the part is not the direct cause of the noise. The main noise sources were analyzed in the 600-800 Hz band, 4,000-5,000 Hz band, and 10,000 Hz band, and the 10,000 Hz band was able to reduce noise according to the change in the carrier frequency of the motor inverter, and the 4,000-5,000 Hz band showed a significant effect by adjusting the clearance at the time of discharge, and it was confirmed that noise in the 600-800 Hz band could be reduced to some extent by expanding the inner space of the rear housing.
Keywords:
1. Introduction
1.1. Electric Scroll Compressor
1.2. Struture and Working Principle of Electric Scroll Compressor
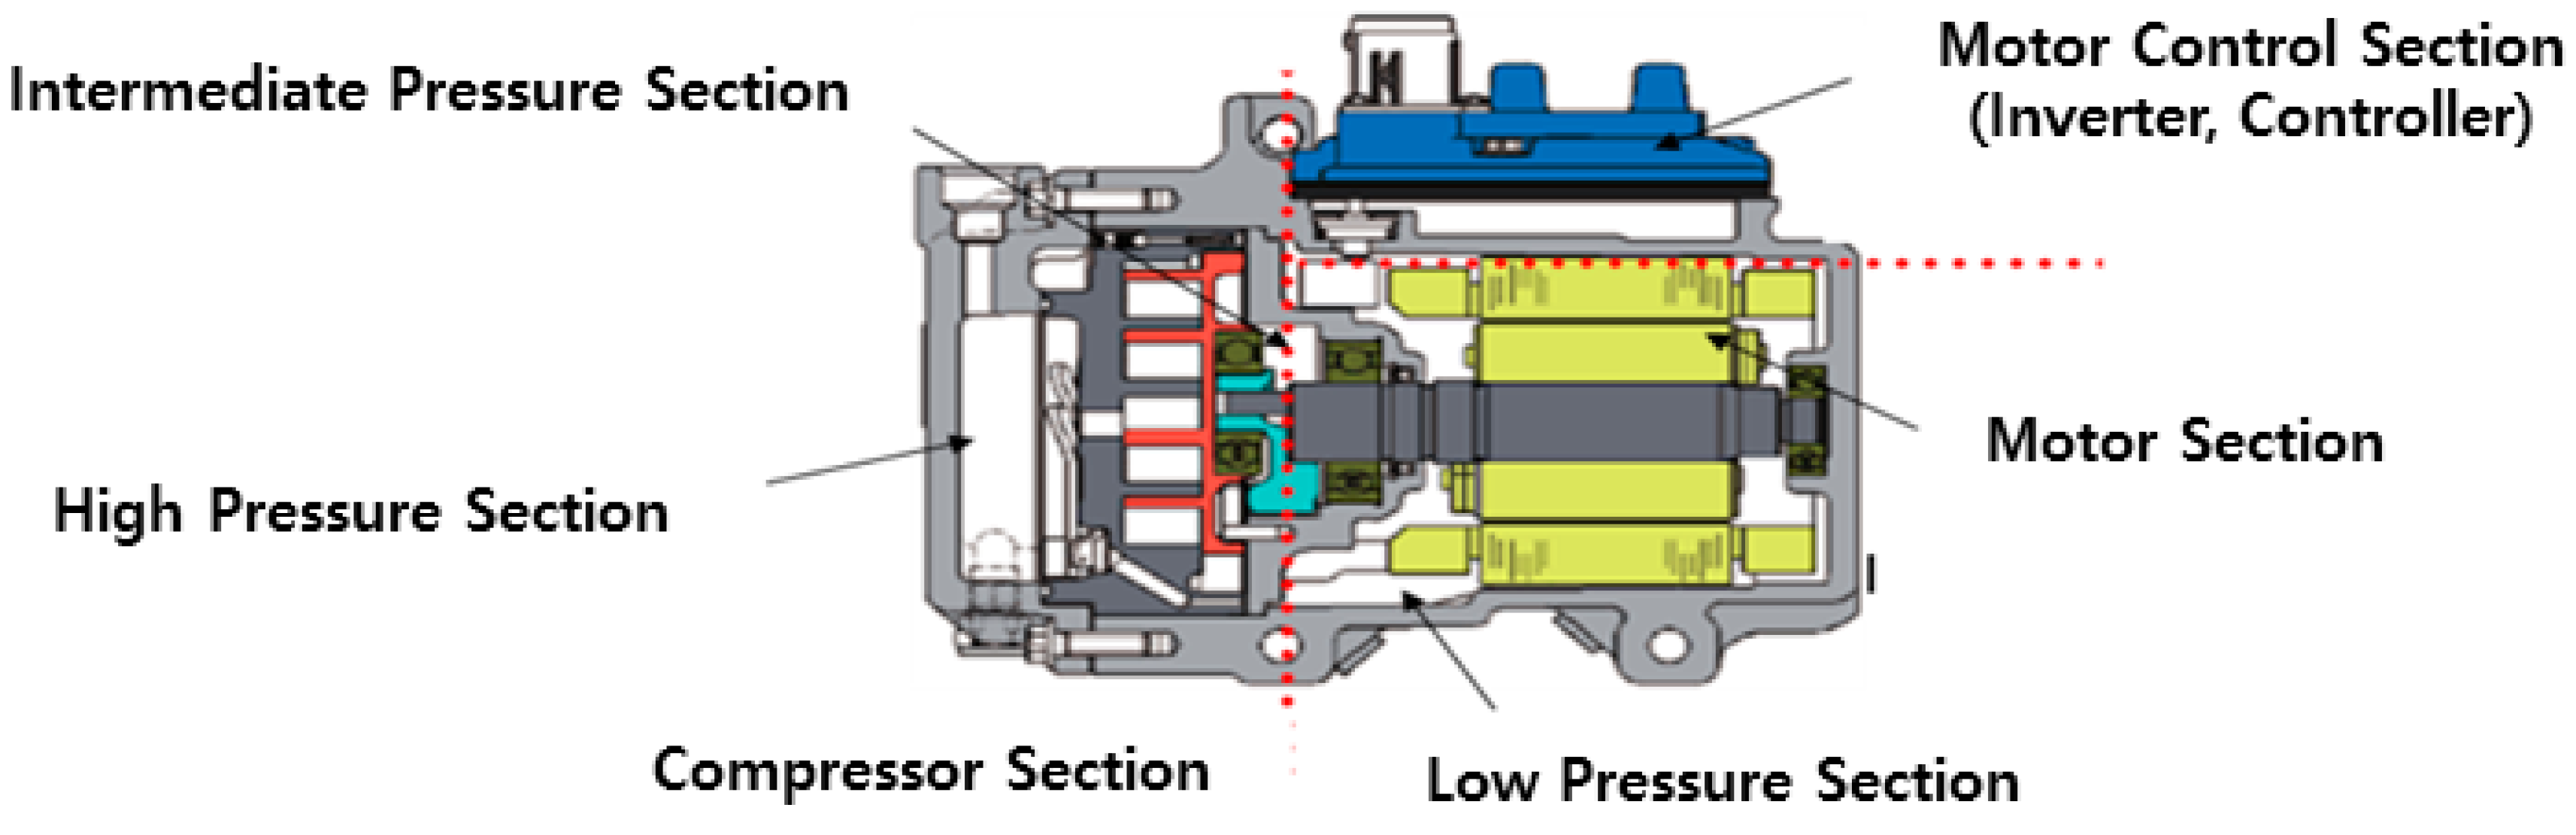
1.3. Features of Scroll Compressors
2. Materials and Methods
2.1. Materials

| Material | Density [kg/m^3] |
Young Modulus [GPa] |
Poisson’s Ratio |
|---|---|---|---|
| ADC12 | 2770 | 71 | 0.33 |
2.2. Methods
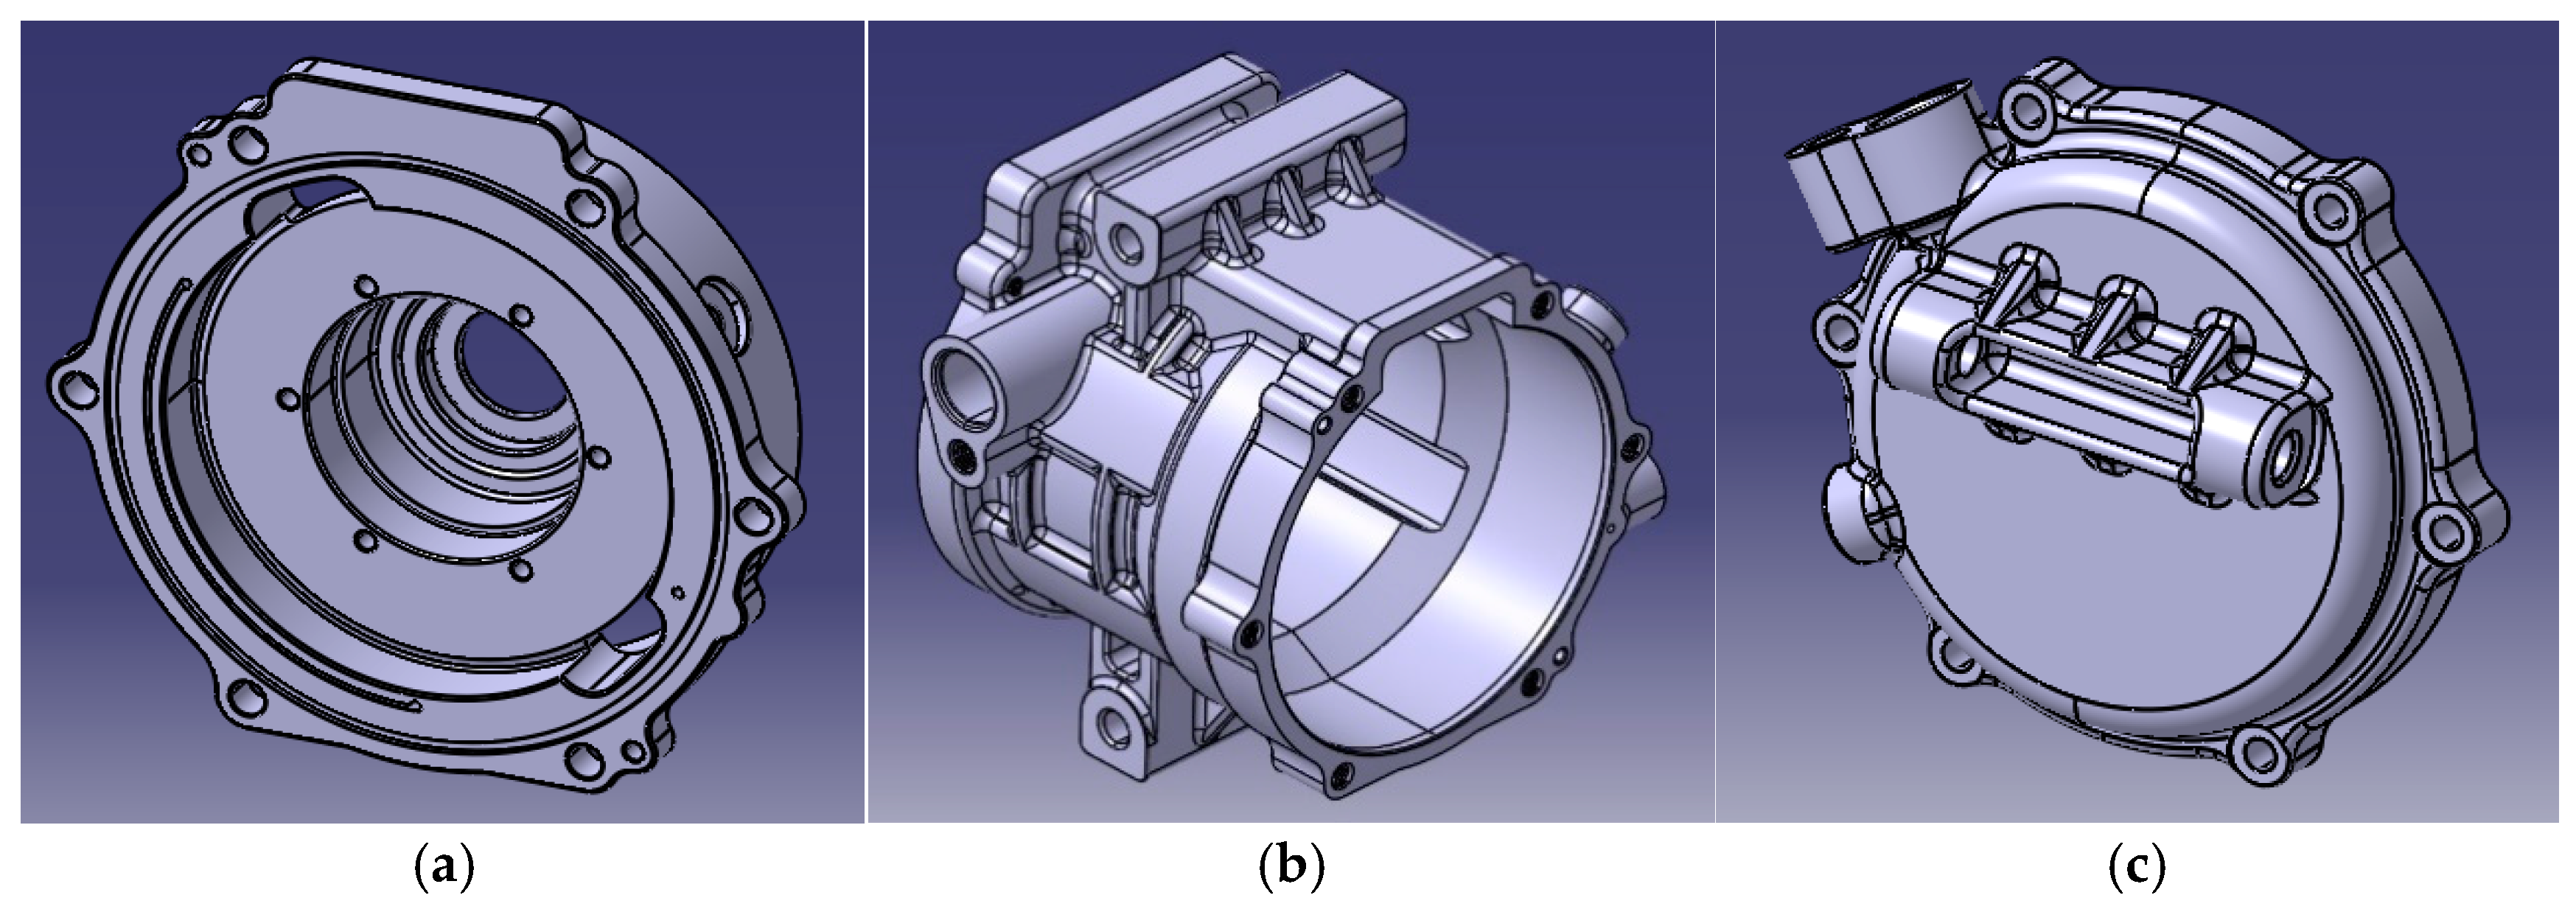
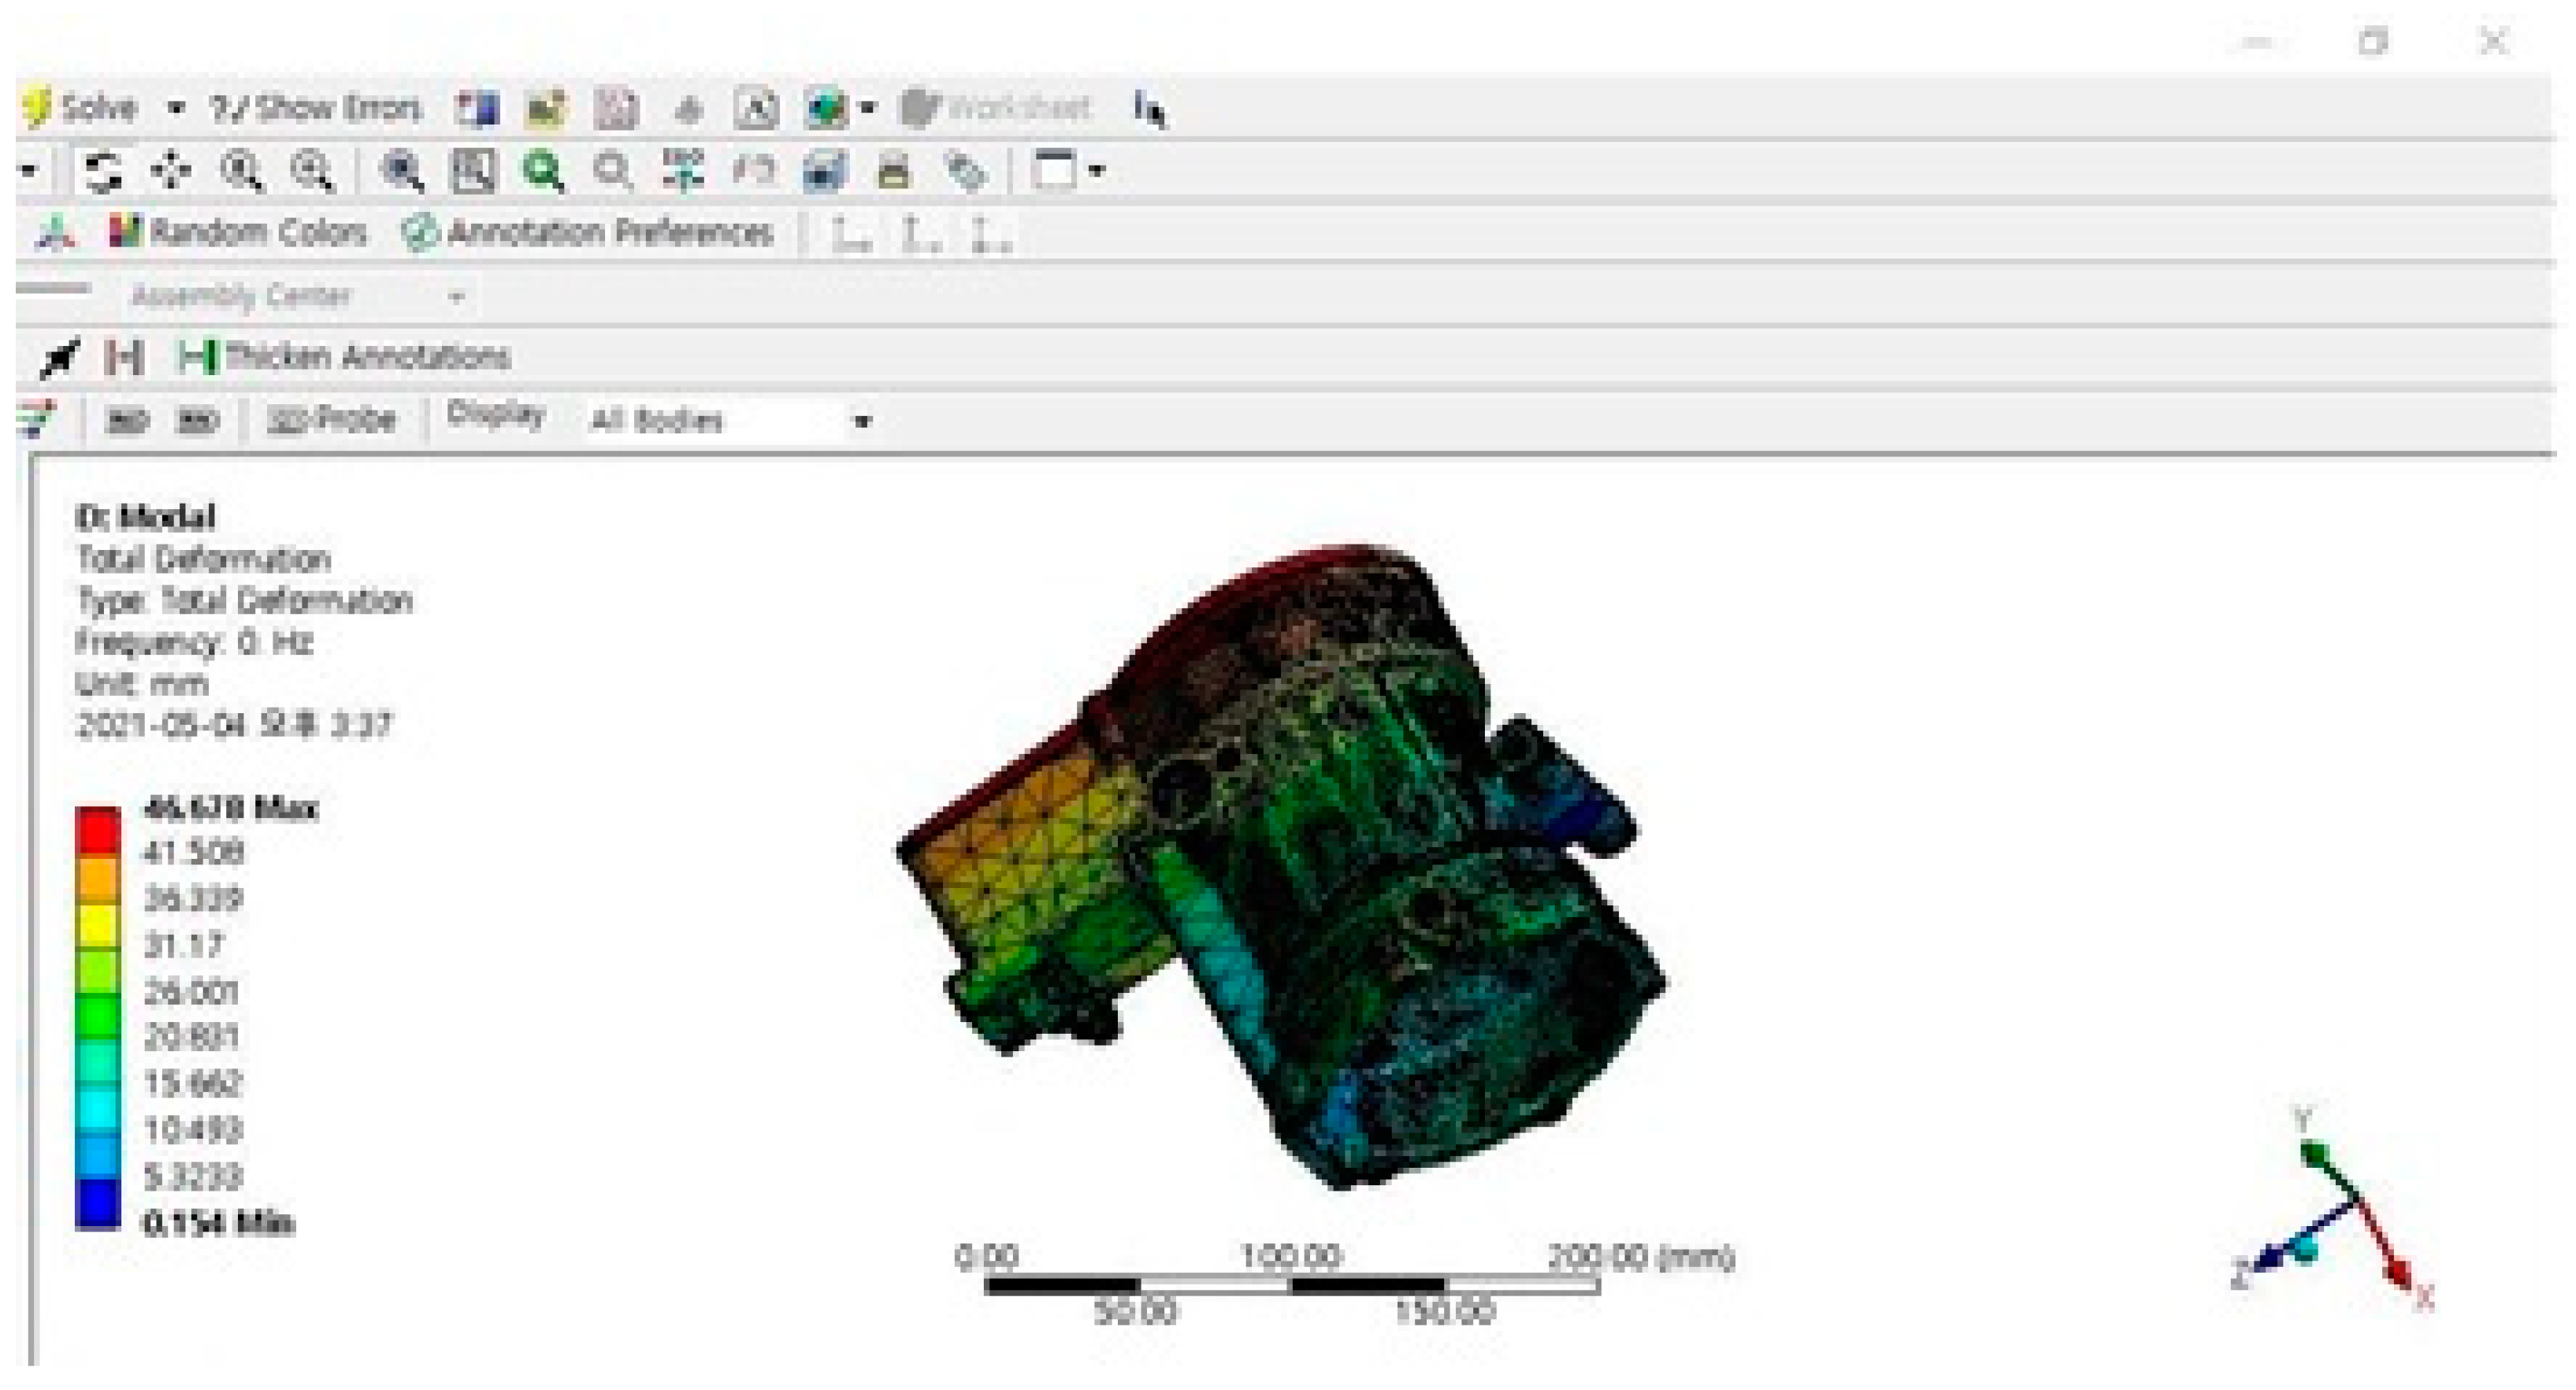
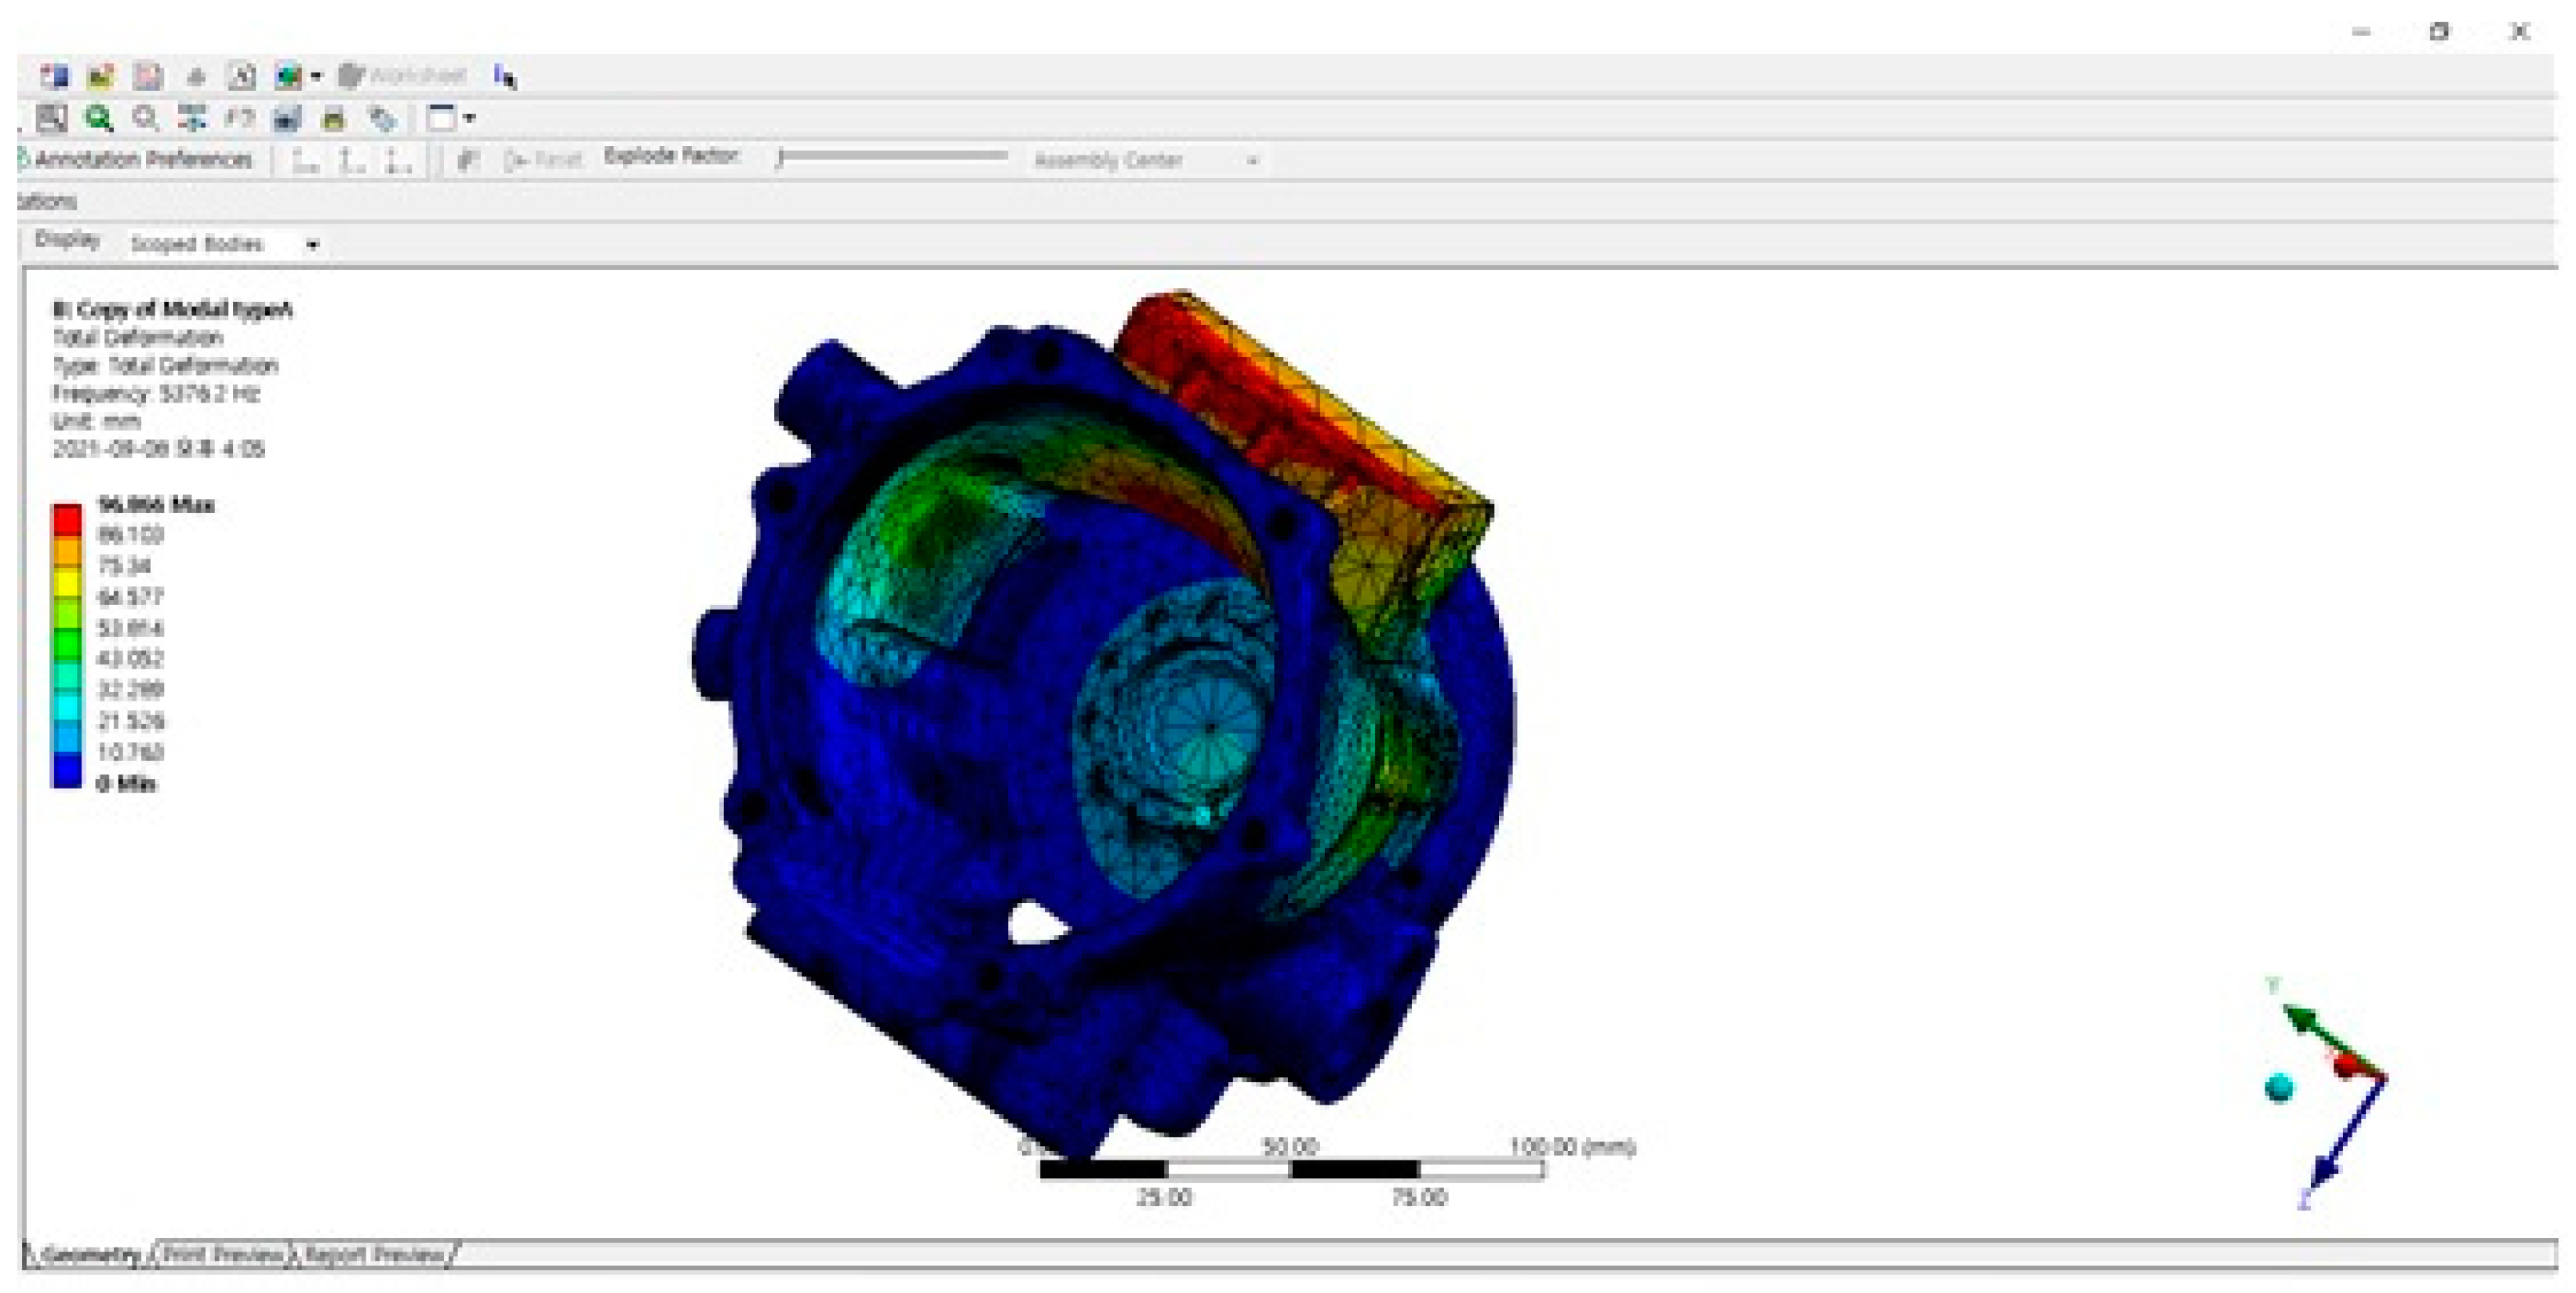
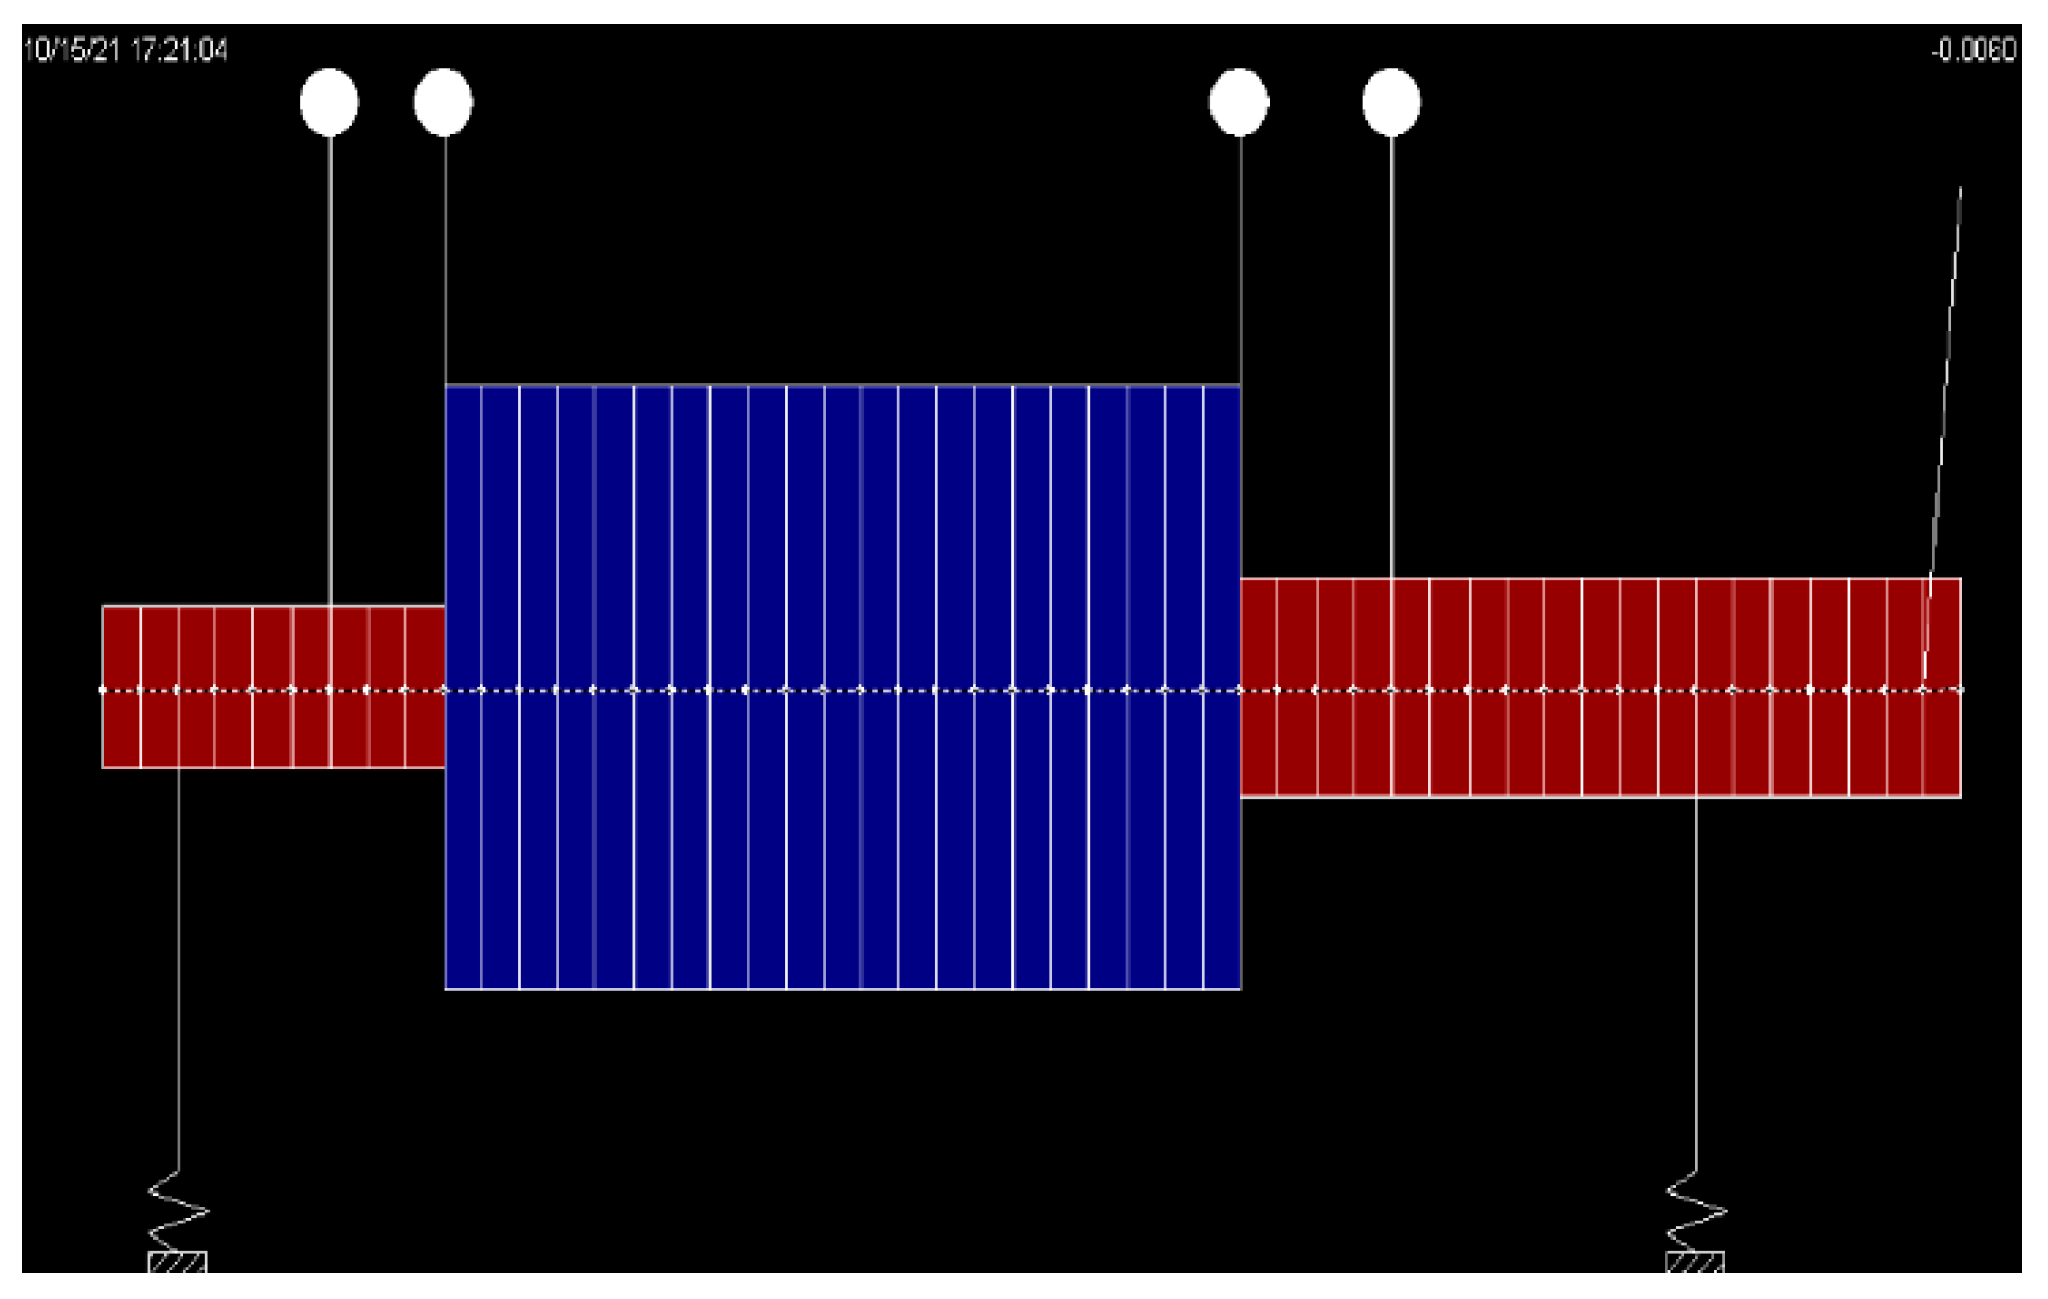
2.2.1. Housing Modal Analysis
2.2.2. Housing Impact Hammer Modal Measurement
2.2.3. Modal Analysis of the Single and Assembly Status of the Electric Compressor
2.2.4. Noise Measurement

2.2.5. Critical speed analysis using ARMD S/W
3. Results
3.1. Result of Housing Modal Analysis
| Mode Number | Frequency [Hz] |
|---|---|
| 1 | 0 |
| 2 | 0 |
| 3 | 3.9666E-3 |
| 4 | 350.64 |
| 5 | 516.74 |
| 6 | 2462.3 |
| 7 | 3498.6 |
| 8 | 5130.2 |
| 9 | 6986.3 |
| 10 | 7799 |
| Mode Number | Frequency [Hz] | Mode Number | Frequency [Hz] |
|---|---|---|---|
| 1 | 0 | 11 | 2727.5 |
| 2 | 1.47173E-3 | 12 | 3266.3 |
| 3 | 4.4004E-3 | 13 | 3331.5 |
| 4 | 230.92 | 14 | 3544.7 |
| 5 | 260 | 15 | 3692.6 |
| 6 | 705 | 16 | 4062.2 |
| 7 | 1275.1 | 17 | 4113.6 |
| 8 | 1654.6 | 18 | 4420.7 |
| 9 | 2010.1 | 19 | 4663.9 |
| 10 | 2188.6 | 20 | 4864 |
| Mode Number | Frequency [Hz] |
|---|---|
| 1 | 0 |
| 2 | 2.4247E-3 |
| 3 | 7.063E-3 |
| 4 | 2568.3 |
| 5 | 3595.9 |
| 6 | 6708.6 |
| 7 | 7037.6 |
| 8 | 7670.8 |
| 9 | 8788.9 |
| 10 | 9026.2 |
3.2. The Result of the Modal Analysis
| Strike Position Number |
Sensor Position Number |
Ave1 Frequency [Hz] |
Ave2 Frequency [Hz] |
Ave3 Frequency [Hz] |
Ave4 Frequency [Hz] |
Ave5 Frequency [Hz] |
Total Ave Frequency [Hz] |
|---|---|---|---|---|---|---|---|
| 1 | 1 | 3207 | 3431 | 3216 | 3217 | 3216 | 3257 |
| 2 | 3413 | 3416 | 3417 | 3417 | 3416 | 3415 | |
| 2 | 1 | 3223 | 3220 | 3219 | 3217 | 3215 | 3218 |
| 2 | 3418 | 3420 | 3420 | 3420 | 3418 | 3419 |
| Strike Position Number |
Sensor Position Number |
Ave1 Frequency [Hz] |
Ave2 Frequency [Hz] |
Ave3 Frequency [Hz] |
Ave4 Frequency [Hz] |
Total Ave Frequency [Hz] |
|---|---|---|---|---|---|---|
| 1 | 1 | 1566 4181 |
1565 2040 4178 |
1564 2040 4177 |
1656 2040 4177 |
1656 2040 4178 |
| 2 | - | - | - | - | - | |
| 2 | 1 | - | - | - | - | - |
| 2 | 1180 | 1180 | 1180 | 1180 | 1180 | |
| 1548 | 1548 | 1548 | 1548 | 1548 | ||
| 2022 | 2022 | 2022 | 2022 | 2022 | ||
| 2862 | 2862 | 2862 | 2862 | 2862 |
| Strike Position Number |
Sensor Position Number |
Ave1 Frequency [Hz] |
Ave2 Frequency [Hz] |
Ave3 Frequency [Hz] |
Ave4 Frequency [Hz] |
Total Ave Frequency [Hz] |
|---|---|---|---|---|---|---|
| 1 | 1 | 1878 | 1875 | 1875 | 1874 | 1875 |
| 2 | - | - | - | - | - | |
| 2 | 1 | - | - | - | - | - |
| 2 | 1795 | 1794 | 1795 | 1795 | 1795 |
3.3. Result of the Modal Analysis for the Single and Assembled Status of the Electric Compressor
| Mode Number | Case Number | Frequency with Mode No. [Hz] |
|---|---|---|
| Main Housing | 1 | 3498.6 (mode 7) |
| Front Housing | 1 | 1275 (mode 7) 1654 (mode 5) 2010 (mode 9) 2188 (mode 9) 2821 (mode 10) |
| 2 | ||
| Rear Housing | 1 | 1415 (mode 6) 2929 (mode 7) |
| 2 | - | |
| 3 (VDA + current base) |
2150 (mode 6) 6056 (mode 6) 3079 (mode 7) 4256 (mode 8) 6600 (mode 10) |
|
| 4 (VAD port angle change + 122 OD) |
2356 (mode 6) 4221 (mode 7) 6025 (mode 8) |
| Housing | Mode | Test 1 Frequency [Hz] |
Test 2 Frequency [Hz] |
|---|---|---|---|
| Main Housing | 1 | 7170 | 9385 |
| 2 | 8463 | 10544 | |
| 3 | 8981 | 12204 | |
| 4 | 9591 | 12302 | |
| 5 | 9837 | 12844 | |
| 6 | 11223 | 13312 | |
| 7 | 11339 | 14047 | |
| 8 | 11461 | 14378 | |
| 9 | 11777 | 14645 | |
| 10 | 12478 | 15357 | |
| Front Housing | 1 | 5376.2 | 5529.5 |
| 2 | 5460.5 | 5614.9 | |
| 3 | 6133.6 | 5882.2 | |
| 4 | 6791 | 6665.9 | |
| 5 | 7484.4 | 7072.2 | |
| 6 | 7609.5 | 7498.1 | |
| 7 | 8088.7 | 7620.3 | |
| 8 | 8238.8 | 8147.2 | |
| 9 | 8804.7 | 8896.2 | |
| 10 | 9520.9 | 9103.9 | |
| Rear Housing | 1 | 6096 | 6096 |
| 2 | 6281 | 6281 | |
| 3 | 7411 | 7411 | |
| 4 | 9491 | 9491 | |
| 5 | 10012 | 10012 | |
| 6 | 10873 | 10873 | |
| 7 | 11274 | 11274 | |
| 8 | 12215 | 12215 | |
| 9 | 12786 | 12786 | |
| 10 | 13520 | 13520 | |
| Fixed Scroll | 1 | 8458 | 5777 |
| 2 | 11342 | 6283 | |
| 3 | 11485 | 6763 | |
| 4 | 13563 | 8301 | |
| 5 | 13802 | 8671 | |
| 6 | 15564 | 10404 | |
| 7 | 15897 | 11599 | |
| 8 | 16777 | 11778 | |
| 9 | 16875 | 12591 | |
| 10 | 17076 | 12918 |
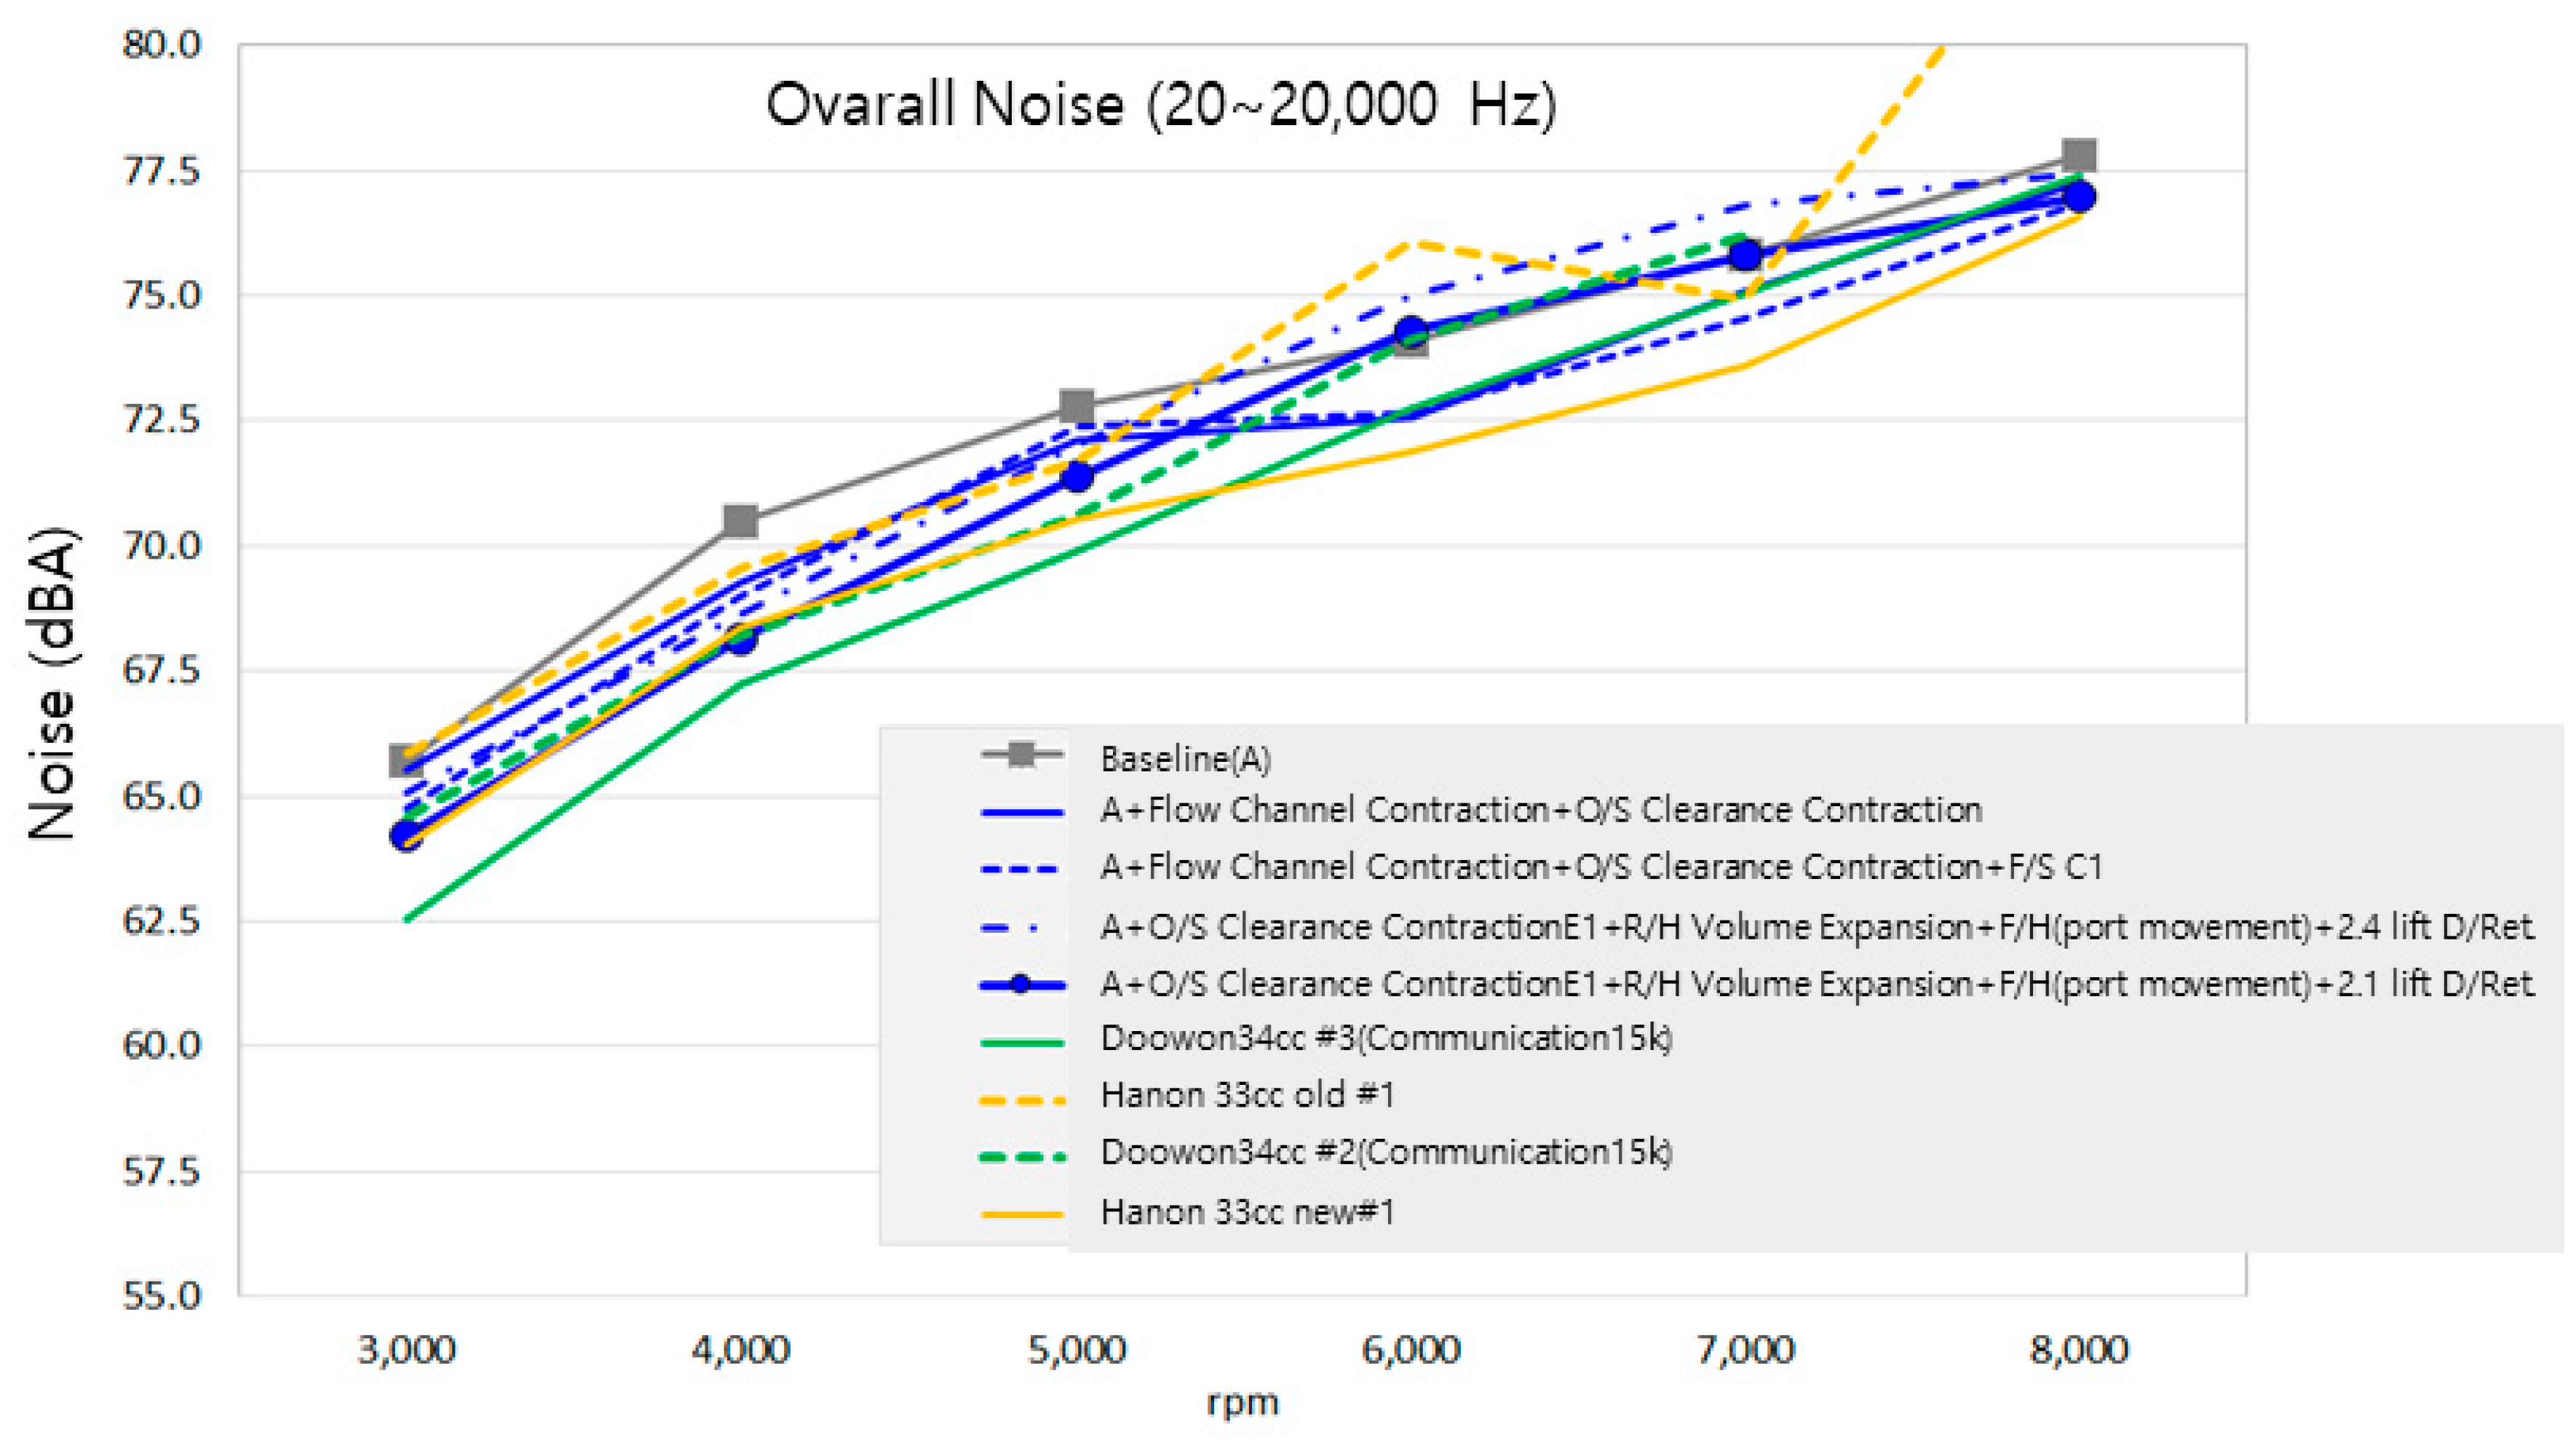
3.4. Result of the Noise Measurement
3.5. Result of Critical Speed Analysis Using ARMD S/W
| Mode Number | Frequency [Hz] |
|---|---|
| 1 | 97.23 |
| 2 | 2889.2 |
| 3 | 15911.8 |
| 4 | 31950.3 |
| 5 | 61220 |
| 6 | 829212 |
4. Discussion
5. Conclusion
References
- B. H. Ahn.; Y. S. Kim. A Study on Abnormal Noise Reduction of Scroll Compressor. 한국동력기계공학회지 제3권 제4호. 1999, 11, 28~35.
- Toyama, T.; Nishikawa, Y.; Yoshida, Y.; Hiodoshi, S.; and Shibamoto, Y., " Reduction Of Noise And Over-Compression Loss By Scroll Compressor With Modified Discharge Check Valve " (2002). International Compressor Engineering Conference. Paper 1587.
- Author Yanagisawa, M.; Uematsu, T.; Hiodoshi, S.; Saito, M.; and Era, S., " Noise Reduction Technology For Inverter Controlled Scroll Compressors " (2002). International Compressor Engineering Conference. Paper 1578.
- Rockwood, W. B., "Noise and Vibration Characterization and Statistical Energy Analysis of a Scroll Compressor" (1998). International Compressor Engineering Conference. Paper 1261.
- Jin. Kab. Lee. Identification of Noise Sources in Scroll Compressor for Air-Conditioner. KSME International Journal, Vol. 14, No. 6, 2000, 597~604.
- Motegi, Shuji and Nakashima, Shinji, "A Study on Noise Reduction in a Scroll Compressor" (1996). International Compressor Engineering Conference. Paper 1171.
- Chuang. Wang.; Zhen. Wang.; Weiguo. Yan.; Hongkun. Li.; Chunli. Yang. Study on Characteristics of the Vibration and Noise of High-Power Scroll Compressor. Hindawi Shock and Vibration Volume. 2021.
- Calhoun, John; Moore, James; and Forni, Ronald, "Stick-Slip Squeal in a Dry Scroll Vacuum Pump" (2016). International Compressor Engineering Conference. Paper 2470.
- Justin. Tharp. Moylan. Sound Reduction of Air Compressor Using a Systematic Approach. 2015.
- Miao. Qing.; Men. Yanru.; Wu. Jinxiang.; Gou. Xiang. Studies on Scroll Compressor Noise Improvement. Mechanics and Materials Vol. 694. 2014, 504~508.
Disclaimer/Publisher’s Note: The statements, opinions and data contained in all publications are solely those of the individual author(s) and contributor(s) and not of MDPI and/or the editor(s). MDPI and/or the editor(s) disclaim responsibility for any injury to people or property resulting from any ideas, methods, instructions or products referred to in the content. |
© 2024 by the authors. Licensee MDPI, Basel, Switzerland. This article is an open access article distributed under the terms and conditions of the Creative Commons Attribution (CC BY) license (http://creativecommons.org/licenses/by/4.0/).


