
Submitted:
05 December 2024
Posted:
05 December 2024
You are already at the latest version
Abstract
Continuing development of network technologies and the escalation of cyber threats have heightened the the requirement for IDS or Intrusion Detection System solutions. There are two issues that may remain a challenge for IDS techniques developed within the scope of traditional approaches: the accuracy of detection and applicability of measures.
the face of evolving threats. This paper focus on comparing ten machine learning algorithms (Artificial Neural Network (ANN), K-Nearest Neighbors (K-NN), Naive Bayes (NB), Random Forest (RF), Decision Tree (DT), Logistic Regression (LR), Support Vector Machine (SVM), Gradient Boosting (GB), AdaBoost (AB), and XGBoost) using the CICIDS2017 dataset, which represents a wide array of network intrusions in traditional network environments.
The main purpose of this research is to measure the efficiency of these algorithms from different learning attacks in order to develop a real-time intrusion detection system. The performance of each model is further evaluated by examining some metrics values. The results show that XGBoost, followed by other ensemble based models, that include Random Forest and Gradient Boosting, provide almost 100\% detection rates, making them some of the best models to tackle large and skewed data sets. These algorithms were able to achieve high accuracy across the board and also in identifying the minority attack classes that are so relevant in a good IDS.
On the other hand, there were under-performed algorithms such as Naive Bayes and AdaBoost to discover specific types of attacks suggesting their infeasibility when used for intricate intrusion detection problems without further enhancement. Traditional algorithms such as SVM and Logistic Regression showed good overall accuracy but faced challenges with minority classes, highlighting the need for advanced techniques to improve their performance.
This analysis underscores the strengths and limitations of different machine learning algorithms in detecting sophisticated cyber threats within traditional network architectures. The findings provide valuable insights for selecting optimal models in designing robust and scalable intrusion detection systems for current and next-generation networks. Future work should focus on addressing class imbalance and enhancing model generalization to improve detection rates for underrepresented attack types, thereby strengthening the overall security posture against emerging cyber threats.
Keywords:
Machine learning
; Intrusion detection
; Regression
1. Introduction
The proliferation of networked systems and the rapid advancement of communication technologies have significantly transformed the digital landscape. As organizations increasingly rely on interconnected networks to conduct business operations, the security of these networks has become a paramount concern. Cyber-attacks have evolved in complexity and frequency, exploiting vulnerabilities in network infrastructures to compromise sensitive data, disrupt services, and inflict financial losses. Traditional security measures, such as firewalls and antivirus software, are often insufficient to detect sophisticated intrusions, necessitating the development of more robust and intelligent defense mechanisms.
Intrusion Detection Systems (IDS) are very essential tools in the combat against unauthorized access to computer resources and networks since they identify threats in network traffic. Conventional IDS approaches, typically based on signature detection, struggle to keep pace with the dynamic nature of cyber threats, particularly zero-day attacks and polymorphic malware. This has led to the use of Machine learning (ML) techniques that has capability to learn patterns from data and make find out that which one is anomalous and likely to be attributed to malicious activities. The machine learning-based IDS can be categorized more broadly into two classes namely the anomaly detection systems and the misuse detection systems. Anomaly detection models create the normal profile of network activities and alarm when the activities viewed as new type of intrusions, whereas misuse detection models use known types of attacks. Unfortunately, the application of ML-based IDS has its own issues, including processing high-dimensional data, achieving real-time detection of threat, and the problem of class imbalance where traffic generated by the attackers is significantly smaller compared to the legitimate traffic in the network.
The CICIDS2017 dataset for IDS is one of the comprehensive benchmarks of performance for the Canadian Institute for Cybersecurity Intrusion Detection System 2017 (CICIDS2017). It encompasses a wide range of ordinary and cyber attacks from the current generation in network traffic. In its current form, the dataset covers such attack classes as DoS, DDoS, PortScan, Web Attacks, etc., which makes this database quite relevant to evaluate the effectiveness of the tested machine learning algorithms in detecting the maximum number of intrusions. In this paper, we present a comprehensive comparative analysis of ten machine learning algorithms on the CICIDS2017 dataset: The ten machine learning techniques that were used in this study include; K-Nearest Neighbors (K-NN), Artificial Neural Network (ANN), Naïve Bayes (NB), Decision Tree (DT), Random Forest (RF), Support Vector Machine (SVM), Logistic Regression (LR), AdaBoost (AB), Gradient Boosting (GB), and XGBoost. The primary objective is to assess the performance of these algorithms in detecting network intrusions, with a particular focus on their ability to identify both majority and minority attack classes.
The motivation for choosing these algorithms is based on the variety of their properties and the popularity of all of them in the intrusion detection area. Recent algorithms such as Random Forest, Gradient Boosting, and XGBoost classifiers have emerged as ideal because of the accuracy contribution they provide and the concerning nature of handling massive data. SVM and Logistic Regression, both are included because they are basic algorithms used in classification processes; Naive Bayes and K-NN are used to illustrate the probabilistic and instance learning methods respectively. ANN is included to capture the increasing importance of deep learning techniques in the Cybersecurity domain.
Evaluation of the proposed models is made using several measures of accuracy, precision, recall, and F1-score. Particular emphasis is put on the identification of the minority attack classes, which are, nevertheless, critical for security. This task is difficult because the creation of an algorithm involves class imbalance, where algorithms often overfit based on the majority class, while the overall accuracy can be high, attack detection will be low. Solving this problem is essential to the creation of sound IDS that can effectively identify a range of threats.
Our experimental findings show that the ensemble approaches yield better results than other algorithms where XGBoost, Random Forest, and Gradient Boosting gives nearly 100% detection rates. It is also evident from the results that these algorithms address the issue of class imbalance and identify complicated interactions from the network traffic data. Conversely, algorithms like Naive Bayes and AdaBoost exhibit limitations in detecting certain attack types, underlining the need for advanced techniques or algorithm enhancements.
The contributions of this paper are as follows:
Comprehensive Evaluation: We provide an in-depth assessment of ten machine learning algorithms on the CICIDS2017 dataset, offering insights into their strengths and weaknesses in intrusion detection tasks.
Focus on Minority Classes: By emphasizing the detection performance on minority attack classes, we highlight the importance of addressing class imbalance in IDS design.
Practical Recommendations: Based on our findings, we offer guidance on selecting appropriate algorithms and strategies for improving IDS effectiveness, including handling class imbalance and hyperparameter tuning.
Foundation for Future Research: The study lays the groundwork for future exploration into advanced machine learning and deep learning techniques for intrusion detection, encouraging the development of more resilient and adaptive IDS solutions.
The remainder of this paper is structured as follows: Section II reviews related work in machine learning-based intrusion detection. Section III describes the dataset used in the study. Section IV outlines the proposed methodology, including data preprocessing and model training. Section V presents the results and analysis of each algorithm’s performance. Section VI provides a comparative discussion of the algorithms, highlighting key observations and implications. Finally, Section VII concludes the paper and suggests directions for future research.
By systematically comparing a diverse set of algorithms, this study aims to advance the understanding of machine learning applications in network security and contribute to the development of more effective intrusion detection systems capable of safeguarding against the evolving landscape of cyber threats.
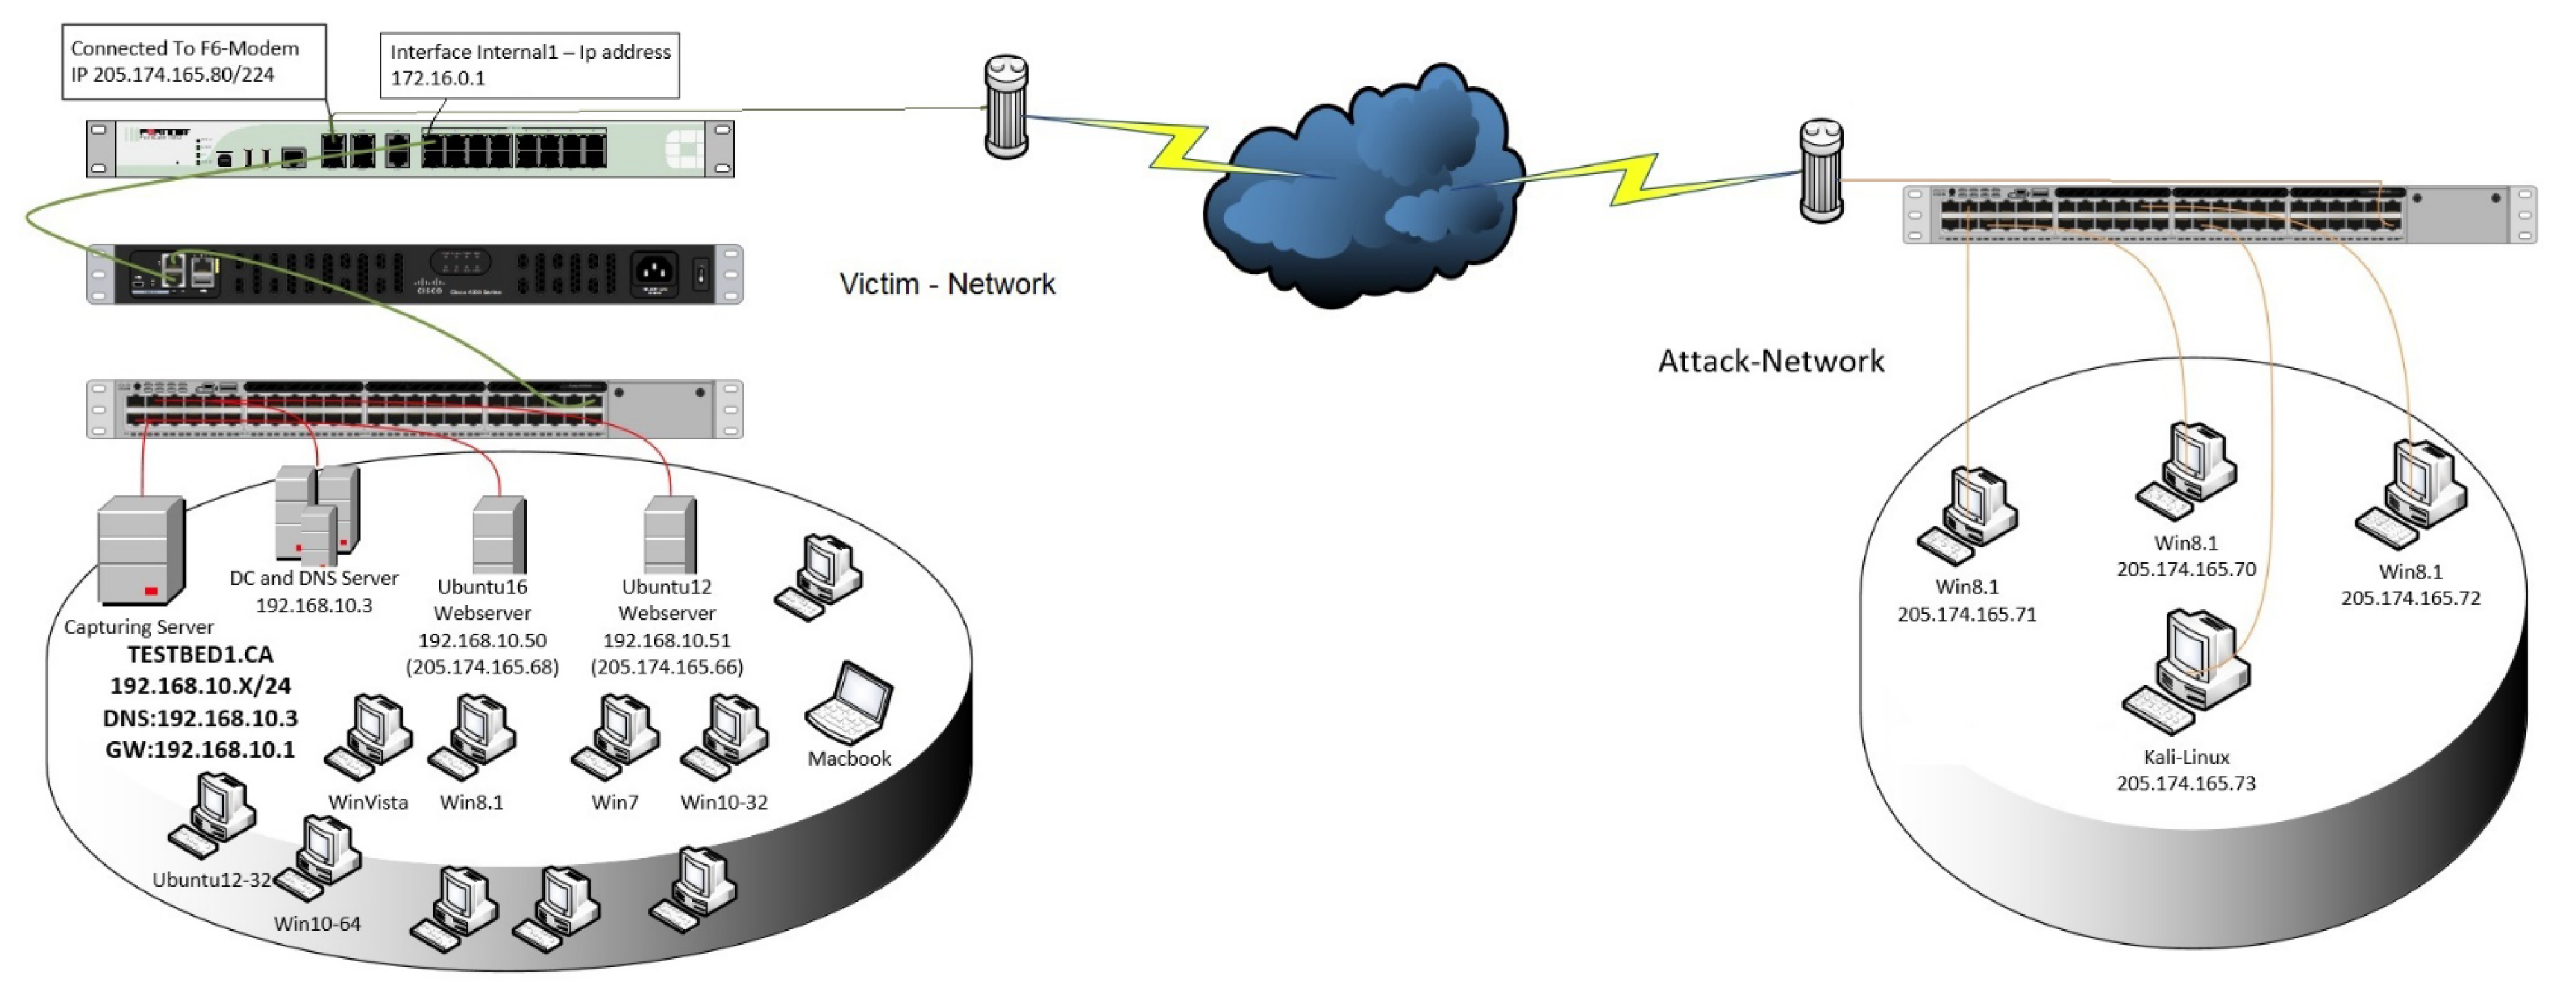
Figure 1.
CIC-IDS2017 Testbed Architecture [1].
Figure 1.
CIC-IDS2017 Testbed Architecture [1].
2. Related Work
The increasing complexity of cyber-attacks and the limitations of traditional intrusion detection systems (IDS) have driven significant advancements in machine learning (ML) and deep learning (DL)-based approaches for robust and adaptive IDS development. Recent research highlights the capabilities of various ML and DL algorithms in addressing the challenges posed by evolving threats and imbalanced datasets.[2,3,4,5,6,7,8,9,10,11]
Supervised ML algorithms such as K-Nearest Neighbors (K-NN), Decision Tree (DT), and Random Forest (RF) are widely adopted for their interpretability and efficiency in detecting known attack patterns. Studies like those by [12,13] emphasize feature selection techniques, such as Information Gain and Recursive Feature Elimination (RFE), to enhance the performance of these algorithms. RF consistently outperformed others, achieving detection rates of over 99% on the CICIDS2017 dataset.
While traditional models such as Naive Bayes (NB) and Logistic Regression (LR) offer simplicity, their effectiveness often diminishes in detecting minority attack classes. This limitation aligns with findings by [14,15], who demonstrated that ensemble methods such as Gradient Boosting (GB) and XGBoost significantly outperform simpler models in complex intrusion scenarios.
For enhancing the detection accuracy and computational efficiency of the models, researchers have worked with more than one machine learning technique simultaneously, either in a single architecture like PCA-RNN or using more than one filter like in the SMOTE – Ensemble classifier. CNNs, and more so Autoencoder models have proved extremely beneficial in dealing with the drawbacks of traditional ML models.
Arafah et al. in [16] designed a new approach known as AE-WGAN that address data imbalance and enhances anomaly detection performance. In a similar manner, authors in [17,18,19] used Deep Autoencoders with CNNs to almost perfect detection rates on the CICIDS2017 dataset.
These works underscore the performance of the DL algorithms in terms of capacity to work with high-dimensional big data and shapeshift to emerging attack models. EW with the emergence of the Internet of Things and Software Defined Networks, IDS faces certain challenges. Alsharif et al. (2023) [2] incorporated ML with the blockchain to secure IoTs with high accuracy rates of over 99.9%. Leaving a similar impression, Choobdar et al. (2021) [20]
utilized Stacked Autoencoders for intrusion detection in SDNs, addressing vulnerabilities inherent in centralized architectures.
Some of the open problems in IDS research are related to class imbalance, better identification of attacks belonging to the minority class, and achieving better generalization for new attacks. Some current approaches include oversampling with SMOTE algorithm for synthesizing data and improving the feature selection with the help of Pearson’s correlation coefficient for networking traffic processing [21,22].
Nevertheless, as the cyber threats evolve IDS needs to step up to the use better algorithm and introduce new technologies such as blockchain or adversarial machine learning. This body of research accords emphasis on the potential of transforming IDS with the help of ML and DL. Therefore, a combination of ensemble methods, hybrid models, and the proposed advanced DL architectures offer useful guidelines for the practical realization of robust, scalable, and adaptive IDS suitable for protecting both current and future generations of networks.
3. Dataset Description
In this study, we assess the comparative performance of various machine learning models employing the Canadian Institute for Cybersecurity Intrusion De-te ction System 2017 (CICIDS2017) dataset. Specifically, the CICIDS2017 dataset has fully corresponded to the real-world network traffic and provided a rich set of intrusion scenarios, which is suitable for IDS performance evaluation [1]. The CICIDS2017 dataset is characterized as a large set of labeled network traffic data that includes both normal traffic and types of Cyberattacks.
The Canadian Institute for Cybersecurity (CID) has also introduced the current dataset with the objective of correcting the assumed former intrusion detection sets since they fail to mimic the current sophisticated attack procedures in today’s complex networks. The data was collected for five days in a controlled Test Bed Network environment that featured 25 users and a typical wax-based office network traffic and has comprehensive logs at the packet and flow level.
3.1. Characteristics and Features
The dataset contains over 3 million instances and includes 80 features extracted from network flow data using CICFlowMeter, an open-source network traffic flow generator. These features capture a wide range of network traffic characteristics, including but not limited to:
- Basic Features: Such as flow duration, total forward/backward packets, and total length of forward/backward packets.
- Content Features: Including the number of packets with specific flags, average packet size, and header length.
- Time-Based Features: Such as flow inter-arrival times, active and idle times.
- Statistical Features: Including standard deviation, variance, and entropy of packet sizes and times.
The features are carefully selected to provide a rich representation of the network behavior, enabling machine learning algorithms to distinguish between normal and malicious activities effectively.
3.2. Attack Types Included
CICIDS2017 encompasses a variety of attack types that reflect contemporary cyber threats. The attacks are categorized into the following classes:
- Denial of Service (DoS) Attacks: Actions that are carried out with the purpose of denying a particular machine or an available network resource to its intended recipients. Some of them are DoS: (GoldenEye, Slowloris, Slowhttptest, and Hulk.
- Distributed Denial of Service (DDoS) Attacks: It works like DoS but comes from many sources, the attack is similar to DoS however it originated from several compromised systems. The dataset comprises several attacks out of which most are DDoS attacks that mimic real-life scenarios.
- Brute Force Attacks: Automated and unauthorized probing to find out which key or password opens the system. This includes SSH and FTP brute-force attacks.
- Botnet Traffic: Traffic produced by a botnet which describes a group of computer programs that are controlled by a single operator called botmaster.
- Web Attacks: These include cross-site scripting (XSS) attacks, SQL injection attacks, and brute force web application attacks all of these attacks targeting web applications.
- Infiltration Attacks: Internal threats from inside a company hacking into the company’s network systems.
- Port Scanning: An attempt to probe for opened ports and services in a connected system.
The CICIDS2017 dataset gives a more real-world and varied testing across intrusion types, which is important for testing machine learning algorithms for a diverse number of attacks. Its vast nature can differentiate between algorithms based not only on the general performance but also in terms of ability to recognize minority attack classes that are rare in other datasets. To improve the classification results’ clarity and avoid inconsistencies, attack labels were converted to numerical forms. In Table 1, the numeric values are matched with the attack labels identified in the paper.
By utilizing CICIDS2017, this study benefits from: Realistic Network Traffic: The dataset reflects genuine network behavior, including normal user activities and sophisticated attack patterns, providing a robust testbed for IDS evaluation. Rich Feature Set: The extensive set of features enables in-depth analysis and the opportunity to explore feature selection and engineering techniques to improve model performance. Diversity of Attacks: The inclusion of multiple attack types allows for a comprehensive assessment of an algorithm’s detection capabilities across different intrusion scenarios. Benchmarking Opportunities: As a widely used dataset in the research community, CICIDS2017 facilitates comparison with existing studies, enabling the positioning of this work within the broader context of IDS research.
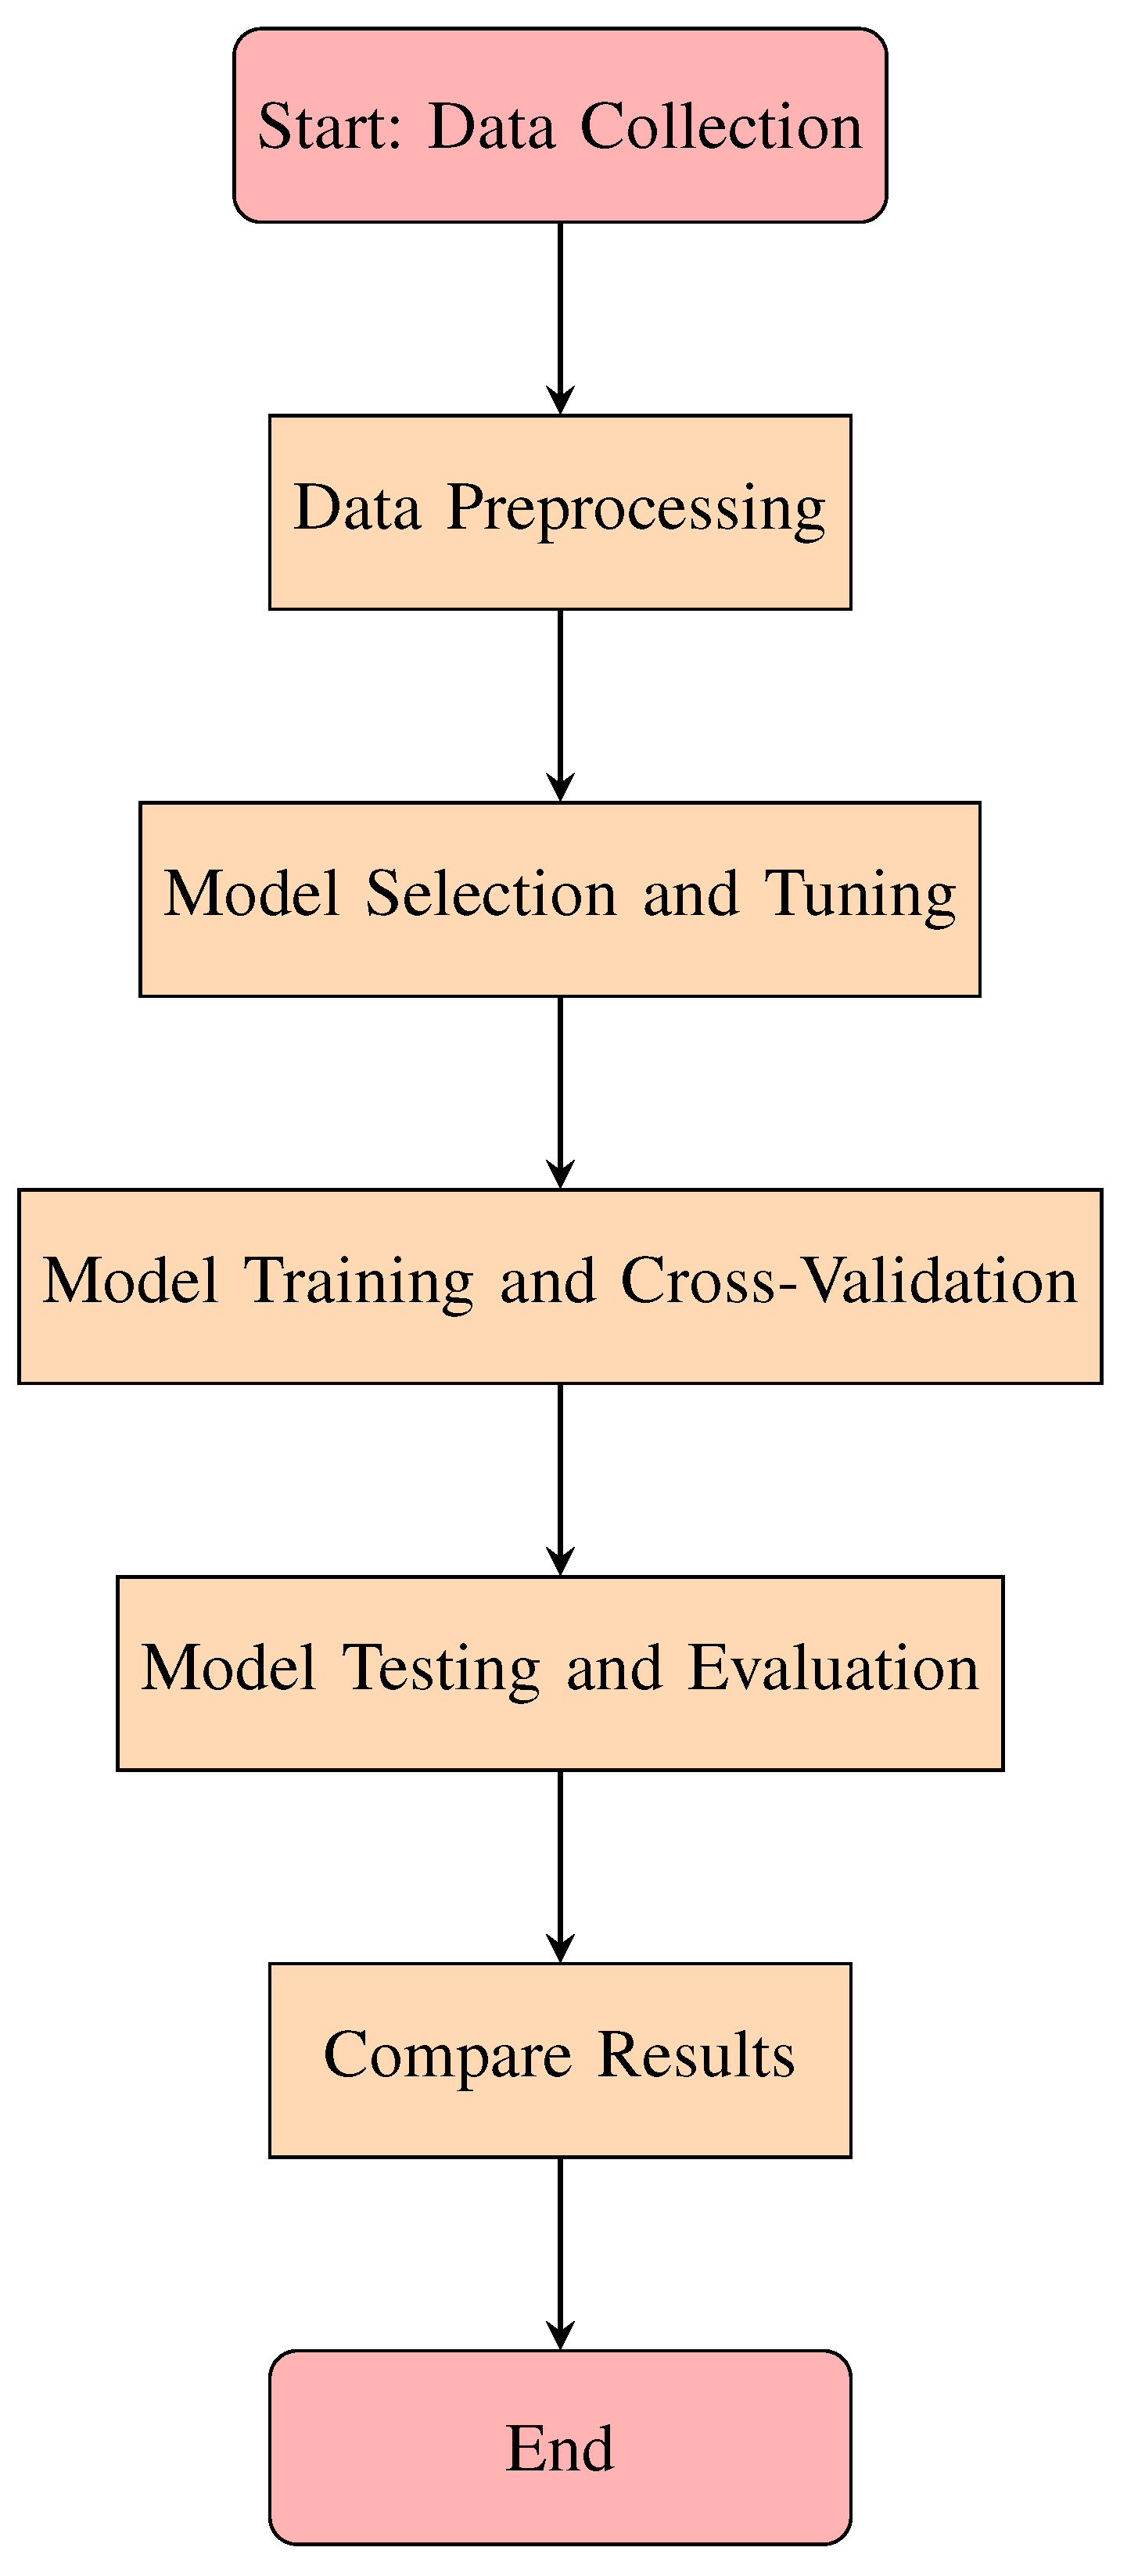
4. Proposed Methodology
This study compares the performance of ten machine learning algorithms for detecting intrusions in three distinct datasets, with a focus on providing a thorough and consistent evaluation methodology. The proposed approach consists of several key stages: preprocessing the data set, selection of features, model training, and performance evaluation. The aim is to understand how each algorithm performs under comparable conditions, ensuring that the results provide meaningful insights into the effectiveness of these machine learning algorithms in intrusion detection.
4.1. Algorithms
To thoroughly understand the performance of various algorithms on intrusion detection systems, it is essential to first delve into the fundamental principles and mechanisms of these algorithms. Each algorithm brings unique strengths and methodologies to classification tasks, especially in complex domains like cybersecurity. The following sections provide a concise explanation of ten machine learning algorithms: ANN, K-NN, NB, DT, RF, SVM, LR, AdaBoost, Gradient Boosting, and XGBoost. These descriptions highlight their core concepts, working mechanisms, and relevance to intrusion detection, setting the foundation for analyzing their results in both binary and multi-class scenarios across the selected datasets.
4.1.1. Artificial Neural Network (ANN)
Artificial Neural Networks are computational models developed to mimic the functionality of the brain. These contain laminated neurons and are of input layer hidden layer and output layer. Input in each neuron is weighed, connected, and activation functions to produce outputs with other neurons [23]. ANNs are highly effective for complex pattern recognition and learning non-linear relationships in data. In intrusion detection, ANNs can learn intricate patterns in network traffic to distinguish between normal and malicious behavior [24]. Their ability to generalize from training data makes them particularly suitable for multi-class classification tasks involving diverse attack types.
4.1.2. k-Nearest Neighbors (K-NN)
The k-Nearest Neighbors (K-NN) algorithm is a simple yet powerful instance-based learning method. It classifies a data point by comparing it to its k nearest neighbors in the feature space, using a distance metric such as Euclidean distance. The majority class among the neighbors determines the classification.[25] K-NN is non-parametric, making it flexible for datasets with irregular decision boundaries. However, it can struggle with scalability on large datasets. In intrusion detection, K-NN excels in detecting attack patterns that are similar to previously observed ones, making it useful for datasets with well-separated classes.[26]
4.1.3. Naive Bayes (NB)
Naive Bayes is a probabilistic classifier based on Bayes’ theorem, assuming independence between features. Despite its simplicity, it is effective for many classification tasks, particularly those involving text or categorical data. For intrusion detection, Naive Bayes is useful for detecting straightforward patterns in traffic data. [27] However, its performance can degrade in scenarios where the independence assumption does not hold [28] or where the dataset includes complex feature interactions. [29] Its computational efficiency makes it a good candidate for lightweight applications.
4.1.4. Decision Tree (DT)
Decision Trees (DTs) categorise data by continuously dividing data into subtrees that are based on feature values. In each node, there is feature selectivity and threshold selection, usually based on measurements such as Gini’s minimum opportunity or information gain. Decision Trees enable models to be explanation and can works with both numeric and nominal data[30]. In intrusion detection, they can identify distinct decision paths for various attack types. However, their tendency to overfit on training data can limit generalization if not pruned or regularized.[31]
4.1.5. Random Forest (RF)
Random Forest (RF) is an Ensemble learning method that builds various decision trees and aggregates them by voting in classification problems or averaging in Regression problems. Each tree is trained on a random subset of the data and features, improving robustness and reducing overfitting.[32] Random Forest excels in capturing complex patterns and is highly effective for intrusion detection due to its ability to handle high-dimensional data and multi-class classification tasks. Its built-in feature importance measures also aid in understanding key predictors of network anomalies.[33]
4.1.6. Support Vector Machine (SVM)
Support Vector Machines (SVMs) aim to find the optimal hyperplane that separates classes in the feature space with the maximum margin. For non-linearly separable data, SVMs use kernel functions (e.g., polynomial or radial basis function) to project the data into a higher-dimensional space where it becomes linearly separable.[34] SVMs are robust against overfitting in high-dimensional spaces and perform well in binary classification.[35] In multi-class intrusion detection, techniques such as one-vs-one or one-vs-all are employed to extend SVM’s capabilities, making it effective for distinguishing between attack types.[36]
4.1.7. Logistic Regression (LR)
LR is a statistical technique commonly used to determine the likelihood or chance of an event occurring based on the relationship between predictor and factors that generate the probability of the variable of interest.[37] In the case of the multiple class classification problems, variants like multinomial logistic regression are used. Prior to, LR assumes that the relationship between the features and the outcomes is linear with the log odds, which makes it less effective for non-linear data but highly interpretable and computationally efficient. In intrusion detection, LR is well-suited for datasets with linear separability and a clear distinction between attack and normal traffic.[38]
4.1.8. AdaBoost (AB)
AdaBoost (Adaptive Boosting) is such an ensemble method that enhances the classification ability by using multiple numbers of weak classifiers which might be decision stumps normally, into a strong classifier. It works iteratively, focusing on misclassified samples by assigning them higher weights in subsequent iterations. AdaBoost excels at improving accuracy by reducing bias and variance.[39] For intrusion detection, it is particularly useful when the dataset has imbalanced classes, as it emphasizes harder-to-classify samples. However, it can be sensitive to noisy data and outliers, which might limit its effectiveness in complex scenarios.
4.1.9. Gradient Boosting (GB)
Gradient Boosting is an ensemble method that builds models sequentially, with each model correcting the errors of its predecessor. Unlike AdaBoost, Gradient Boosting optimizes a loss function directly using gradient descent, making it more flexible and capable of handling complex data distributions.[40] Gradient Boosting is highly effective in intrusion detection tasks, especially for datasets with diverse attack types. It can model intricate feature interactions and deliver high accuracy, but its computational cost is higher compared to simpler algorithms.
4.1.10. XGBoost
XGBoost: This is the enhanced class of Gradient Boosting that overcomes some of the problems of the earlier one by adding the regularization technique. It is highly efficient, scalable, and supports parallel processing, making it a favorite for large-scale datasets. XGBoost uses advanced techniques like weighted quantile sketch and sparsity-aware learning. In intrusion detection, XGBoost excels in handling high-dimensional data and detecting subtle patterns, making it one of the most powerful algorithms for both binary and multi-class classification tasks.[41]
4.2. Data Aggregation
The first critical step in the methodology is data aggregation, where the datasets used in this study are initially loaded from multiple CSV files. Each dataset is carefully examined to ensure that it is structured correctly for machine learning applications.
Some of the initial requirements include removing any leading or trailing blanks from the names of the columns in a dataset as a way of standardizing the format of the different datasets.
An important part of the aggregation phase is the feature-target label split. In this study, the target vector, which represents the ’Label’ column that contains the normal/attack record, is isolated from the feature set. It is composed of 24 Input Features holding the values that the machine learning models will use, and ’Label ‘as the target variable.
4.3. Data Cleaning
Data cleaning follows data aggregation once the data is collected and compiled in one central location. Intrusion detection datasets come with noisy data, and NaN (Not a Number) or infinite values can lead to unreliable model predictions. Thus, before training the models, the issues are preprocessed on the given dataset. In this case any inputs that contain a mathematical infinite value are changed to a NaN, and any rows that contain a NaN value are discarded from both the feature set and the target label. This should ensure that the dataset is clean and more par for training purposes.
Secondly, dealing with the class imbalance is important in this phase as well. It is also important to note that intrusion detection data is usually unbalanced; this means that there are many more instances of normal traffic than of actual attacks and some types of attacks have more samples than others. In order to overcome this, the study adopts a stratified sampling technique, whereby the training and testing subsets will comprise a balance of attack and normal samples. This technique allows the models to be trained on a sample of this data that would give it the ability to make good predictions in real scenarios.
4.4. Feature Scaling
The following process after data cleaning is the preparation of data for model building and the most vital process is feature scaling. Almost all machine learning algorithms are scale-invariant and this means that for most algorithms the features whose numeric range is large have a disproportionate effect on the result of the models in its decision making. To eliminate this problem, the feature values are normalized using the StandardScaler in order. This helps in making all features at par with each other in the same proportion which is quite important in algorithms such as K- Nearest Neighbors (K-NN), Support Vector Machines (SVM), and many other algorithms for they perform their analysis depending on the magnitude of the feature values.
4.5. Model Training and Evaluation
The next step after preprocessing the data is to fit the training and other machine learning models. This study evaluates ten different algorithms.
For each model, the training process starts by fitting the model to the training data. This set of input features (X_train) and the set of target labels (y_train) are used to train the model and it learns how to make a prediction. In this process, the model acquires patterns or relationships within the data for use in segregating future traffic as either normal or an intrusion.
After training, the model is tested on the evaluation dataset (X_test) to determine its effectiveness in detecting intrusions. The performance of each model is assessed using essential metrics such as accuracy, precision, recall, and F1-score, all these metrics are available in the form of a classification report. These metrics are essential for understanding the effectiveness of each model in distinguishing between normal and attack traffic. Accuracy measures the overall percentage of correct predictions, while precision and recall provide more detailed insights into the model’s ability to correctly identify attacks (true positives) and minimize false positives (incorrectly classifying normal traffic as attacks). The F1-score combines precision and recall into a single metric, offering a balanced measure of performance.
An important factor when assessing the models is the fact that the ’Label’ column is categorical. Due to the fact that most machine learning algorithms work only with numeric data, then the target variable is then converted to numeric form using the label encoder. This encoding then converts the labels to a format that the models will accept while maintaining the class structure. After the models make their predictions then the predicted labels are converted back into its categorical form by applying the inverse of the label encoder. This enables the comparison of the predicted labels with the actual labels of the test set more fairly.
The other output that is used in the assessment of each model is the classification report. It will allow the study to evaluate how each of the models is separating the two classes of data based on the aforementioned values.
This methodology gives the complete measure of how well each machine learning algorithm handles intrusion detection in network traffic. Collecting the data from multiple sources and testing the models on consistent measures provided useful insights about the algorithms identifying the intrusions. Moreover, this work establishes a foundation for potential further refinements in the future – including hyperparameter optimization, or feature selection – which may bring further amelioration of these models.
The following section will present the experimental results obtained from applying these algorithms to the datasets, providing a deeper understanding of each model’s strengths and weaknesses in the context of intrusion detection.
5. Results and Discussion
This section discusses the results of the 10 machine learning algorithms on the given CICIDS2017 dataset. Classification metrics including multi-class are used to measure models’ performance to each type of attack namely; accuracy, precision, recall, and F1-score.
The CICIDS2017 dataset contains various attack types, so the classification is multi-class, where each instance in the dataset corresponds to one of these attack types.
5.1. Performance of ANN
The results for testing the Artificial Neural Network (ANN) algorithm showed an overall accuracy of 98.62% for intrusion detection tasks. Indeed, the model did a good job with a clear separation of benign traffic and different forms of attacks based on the results values in the majority of the classes as shown in Table 2.
Looking at the result on the BENIGN class, the model from the present study was perfectly precise with 1.00 and close to perfectly recall with 0.99, as well as F1-score of 1.00 which again proved the effectiveness of the model in identifying normal network traffic. The model was also able to identify other practical of significant attack types like DDoS, where even precise measures were 1.00, recall 1.00, and an F1-score of 1.00, DoS Hulk, which also had a precision of 0.98, a recall of 0.98 and an F1-score of 0.98.
The ANN model showed strong performance in detecting other attack types, such as DoS GoldenEye (F1-score = 0.95), DoS Slowhttptest (F1-score = 0.90), and PortScan (F1-score = 0.94). However, the model encountered challenges with certain minority classes. For the Bot class, which had only 8 instances, the precision was 0.80, recall was 0.50, and F1-score was 0.62, indicating some difficulty in accurately identifying botnet activities.
Similarly, the detection performance for Web Attack – Brute Force was lower, with a precision of 0.67, recall of 0.20, and F1-score of 0.31. The Web Attack – XSS class had precision and recall values of 0.00, resulting in an F1-score of 0.00, which suggests that the model did not correctly identify instances of this attack type. This could be due to the very small number of samples (support = 4), making it challenging for the model to learn meaningful patterns.
The macro-average F1-score of the proposed method is, 0.80 which is average score over all classes ignoring class imbalance, while the weighted-average F1-score is 0.99, indicating excellent overall performance when accounting for the prevalence of each class.
To improve detection of underrepresented attack types, future work could involve techniques such as data augmentation, oversampling of minority classes, or incorporating class weighting during training. Additionally, further tuning of the ANN architecture and hyperparameters may enhance the model’s ability to generalize across all attack types.
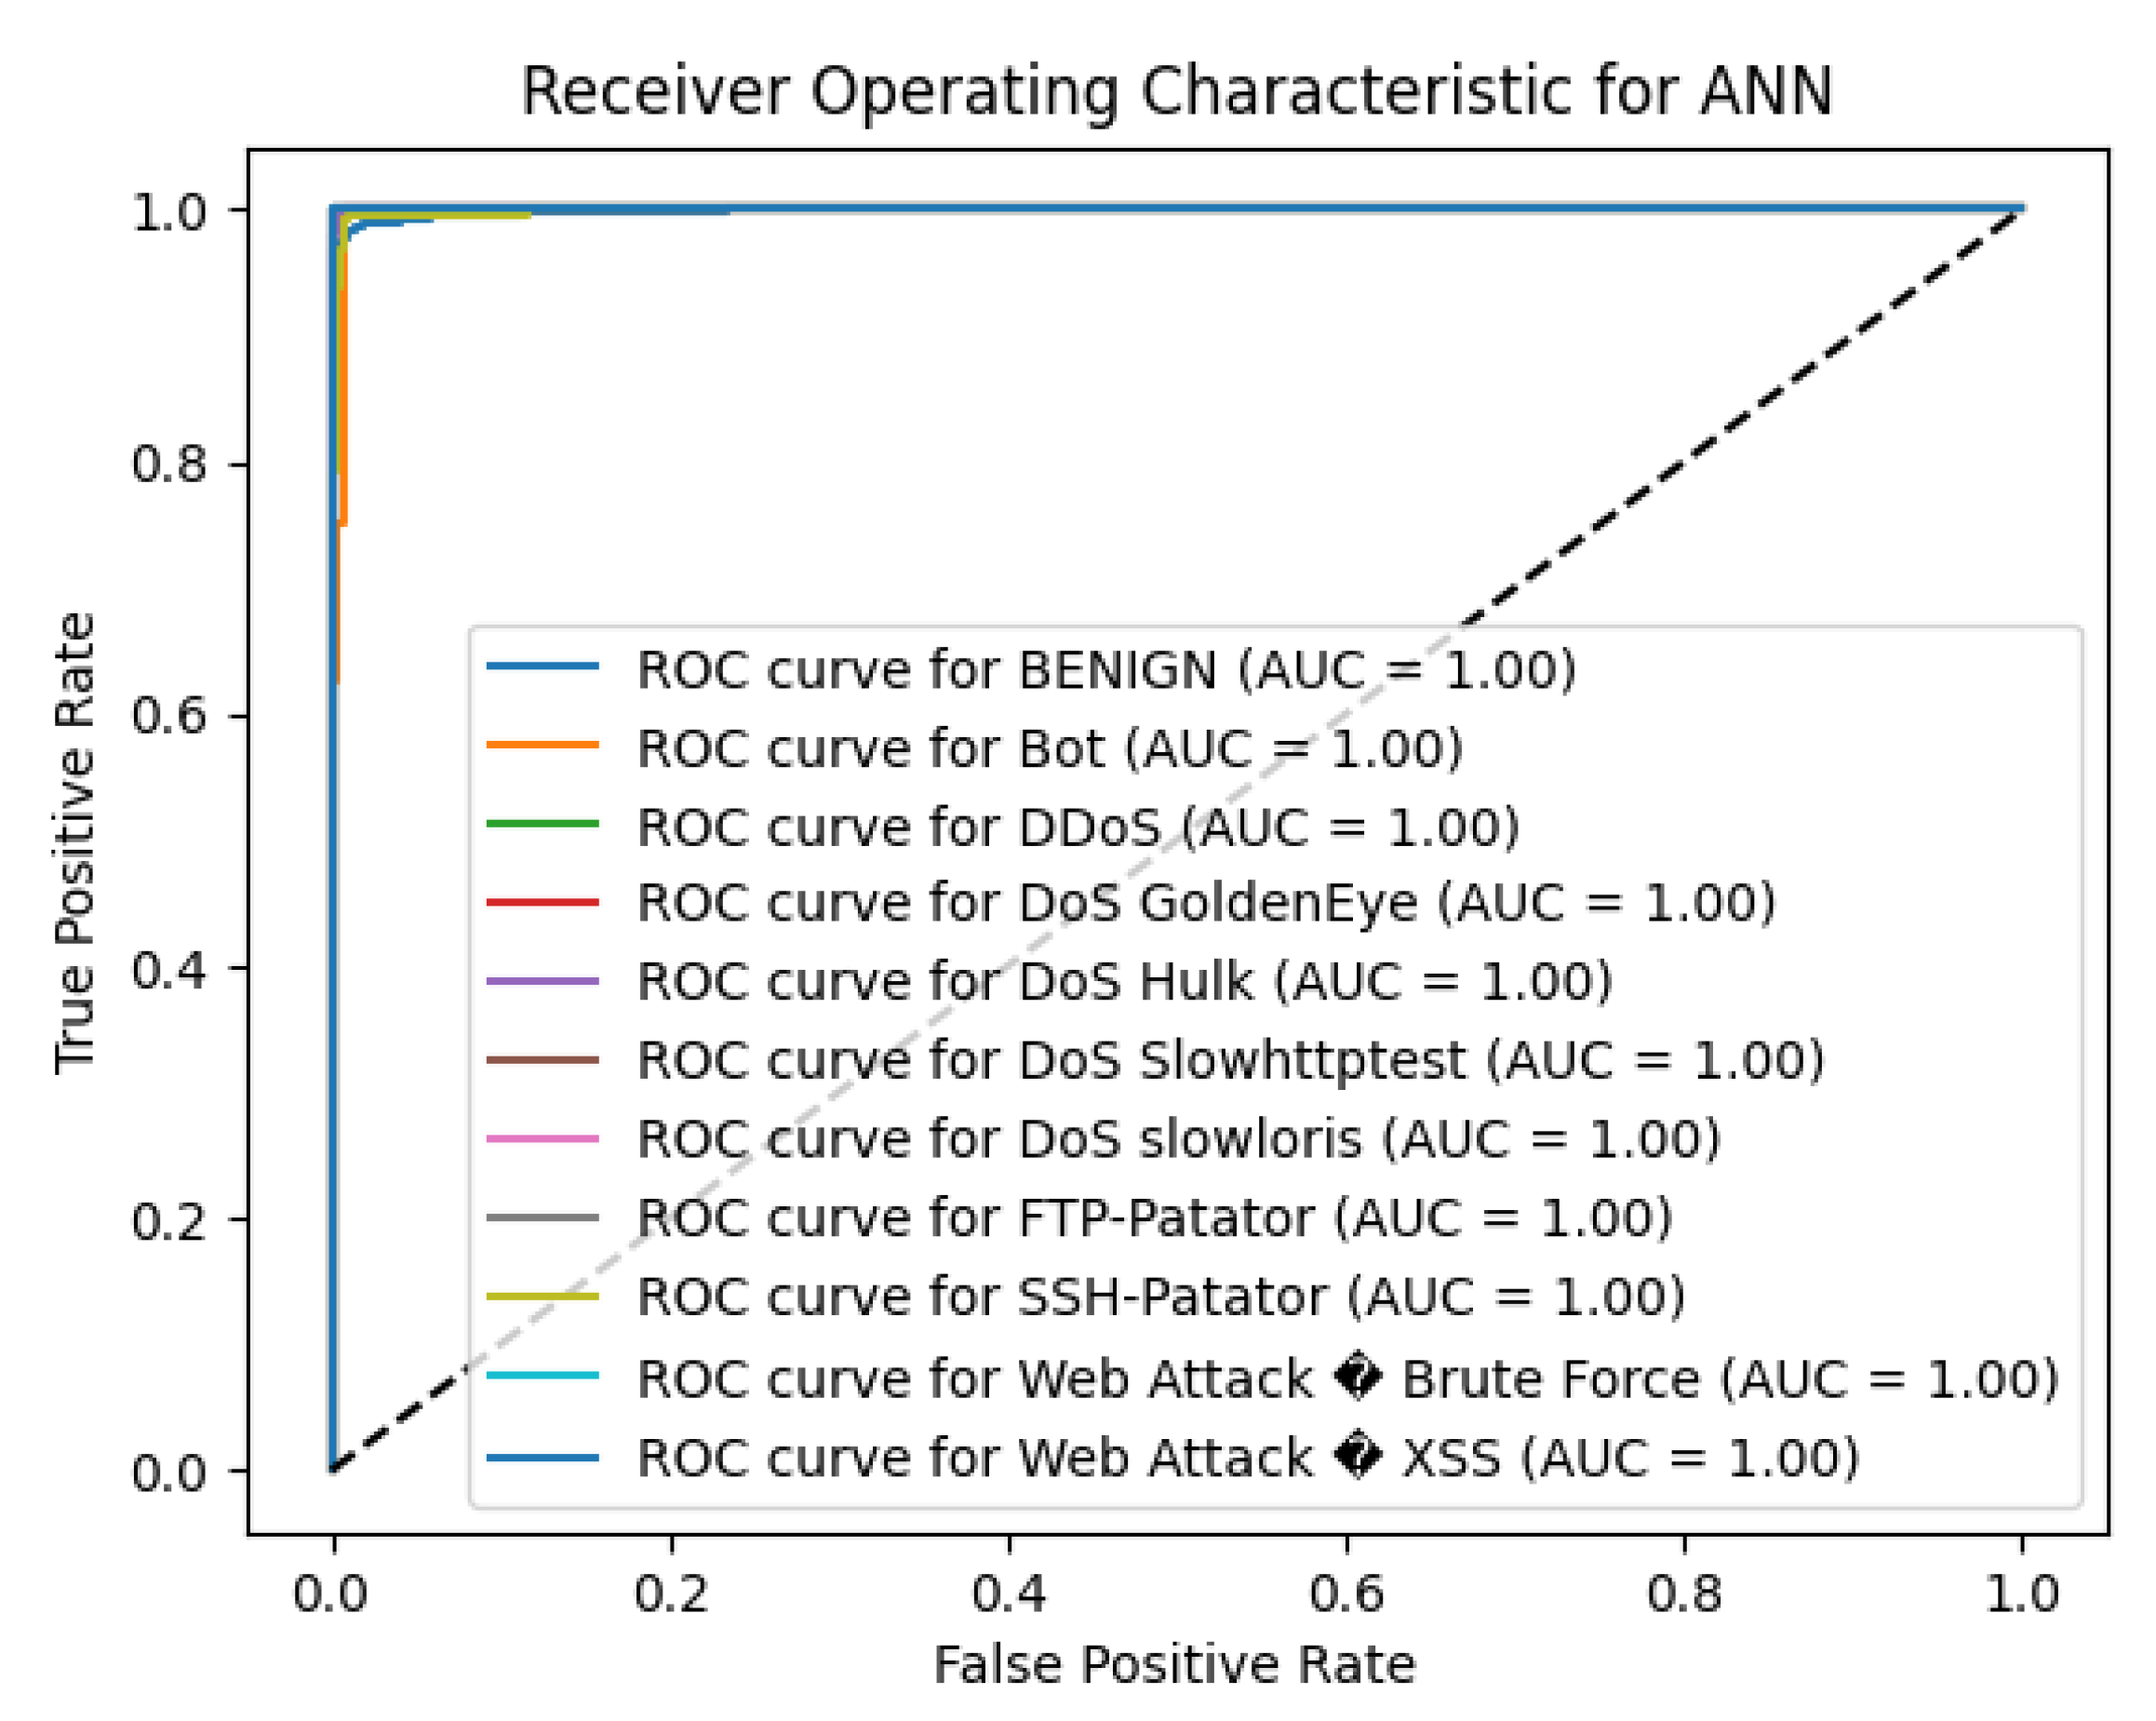
Figure 2.
ANN ROC curve.
5.2. Performance of K-NN
The K-Nearest Neighbors (K-NN) algorithm reached an overall accuracy of 99%, demonstrating strong performance in intrusion detection tasks. The model effectively distinguished between benign traffic and various attack types, with high precision and recall values for the majority of classes.
For the BENIGN class, K-NN attained a precision of 0.99, recall of 0.99, and an F1-score of 0.99, indicating reliable identification of normal network traffic. The algorithm also excelled in detecting prevalent attack types such as DDoS (precision = 1.00, recall = 0.99, F1-score = 0.99) and DoS Hulk (precision = 0.98, recall = 1.00, F1-score = 0.99), highlighting its effectiveness in identifying these significant threats.
However, the model faced challenges with minority classes, particularly those with limited sample sizes. For the Bot class, which had only 8 instances, the precision was 0.67, recall was 0.50, and F1-score was 0.57, indicating difficulty in correctly identifying botnet activities. Similarly, Web Attacks had lower F1-scores of 0.43 and 0.33, respectively, due to reduced recall rates. These lower scores suggest that the model struggled to detect these less frequent and possibly more complex attack types.
The macro-average F1-score of the proposed method is, 0.83 which is average score over all classes ignoring class imbalance, while the weighted-average F1-score is 0.99, indicating excellent overall performance when accounting for the prevalence of each class. The high weighted average underscores the model’s proficiency in identifying the majority of network traffic, which is crucial for practical intrusion detection systems.
To enhance detection of minority attack classes, future work could involve addressing class imbalance through techniques such as oversampling, synthetic data generation, or adjusting class weights during training. Additionally, fine-tuning the value of kk and incorporating feature selection or dimensionality reduction methods may improve the model’s ability to generalize across all attack types and enhance its performance on underrepresented classes.
Figure 3.
K-NN ROC curve.
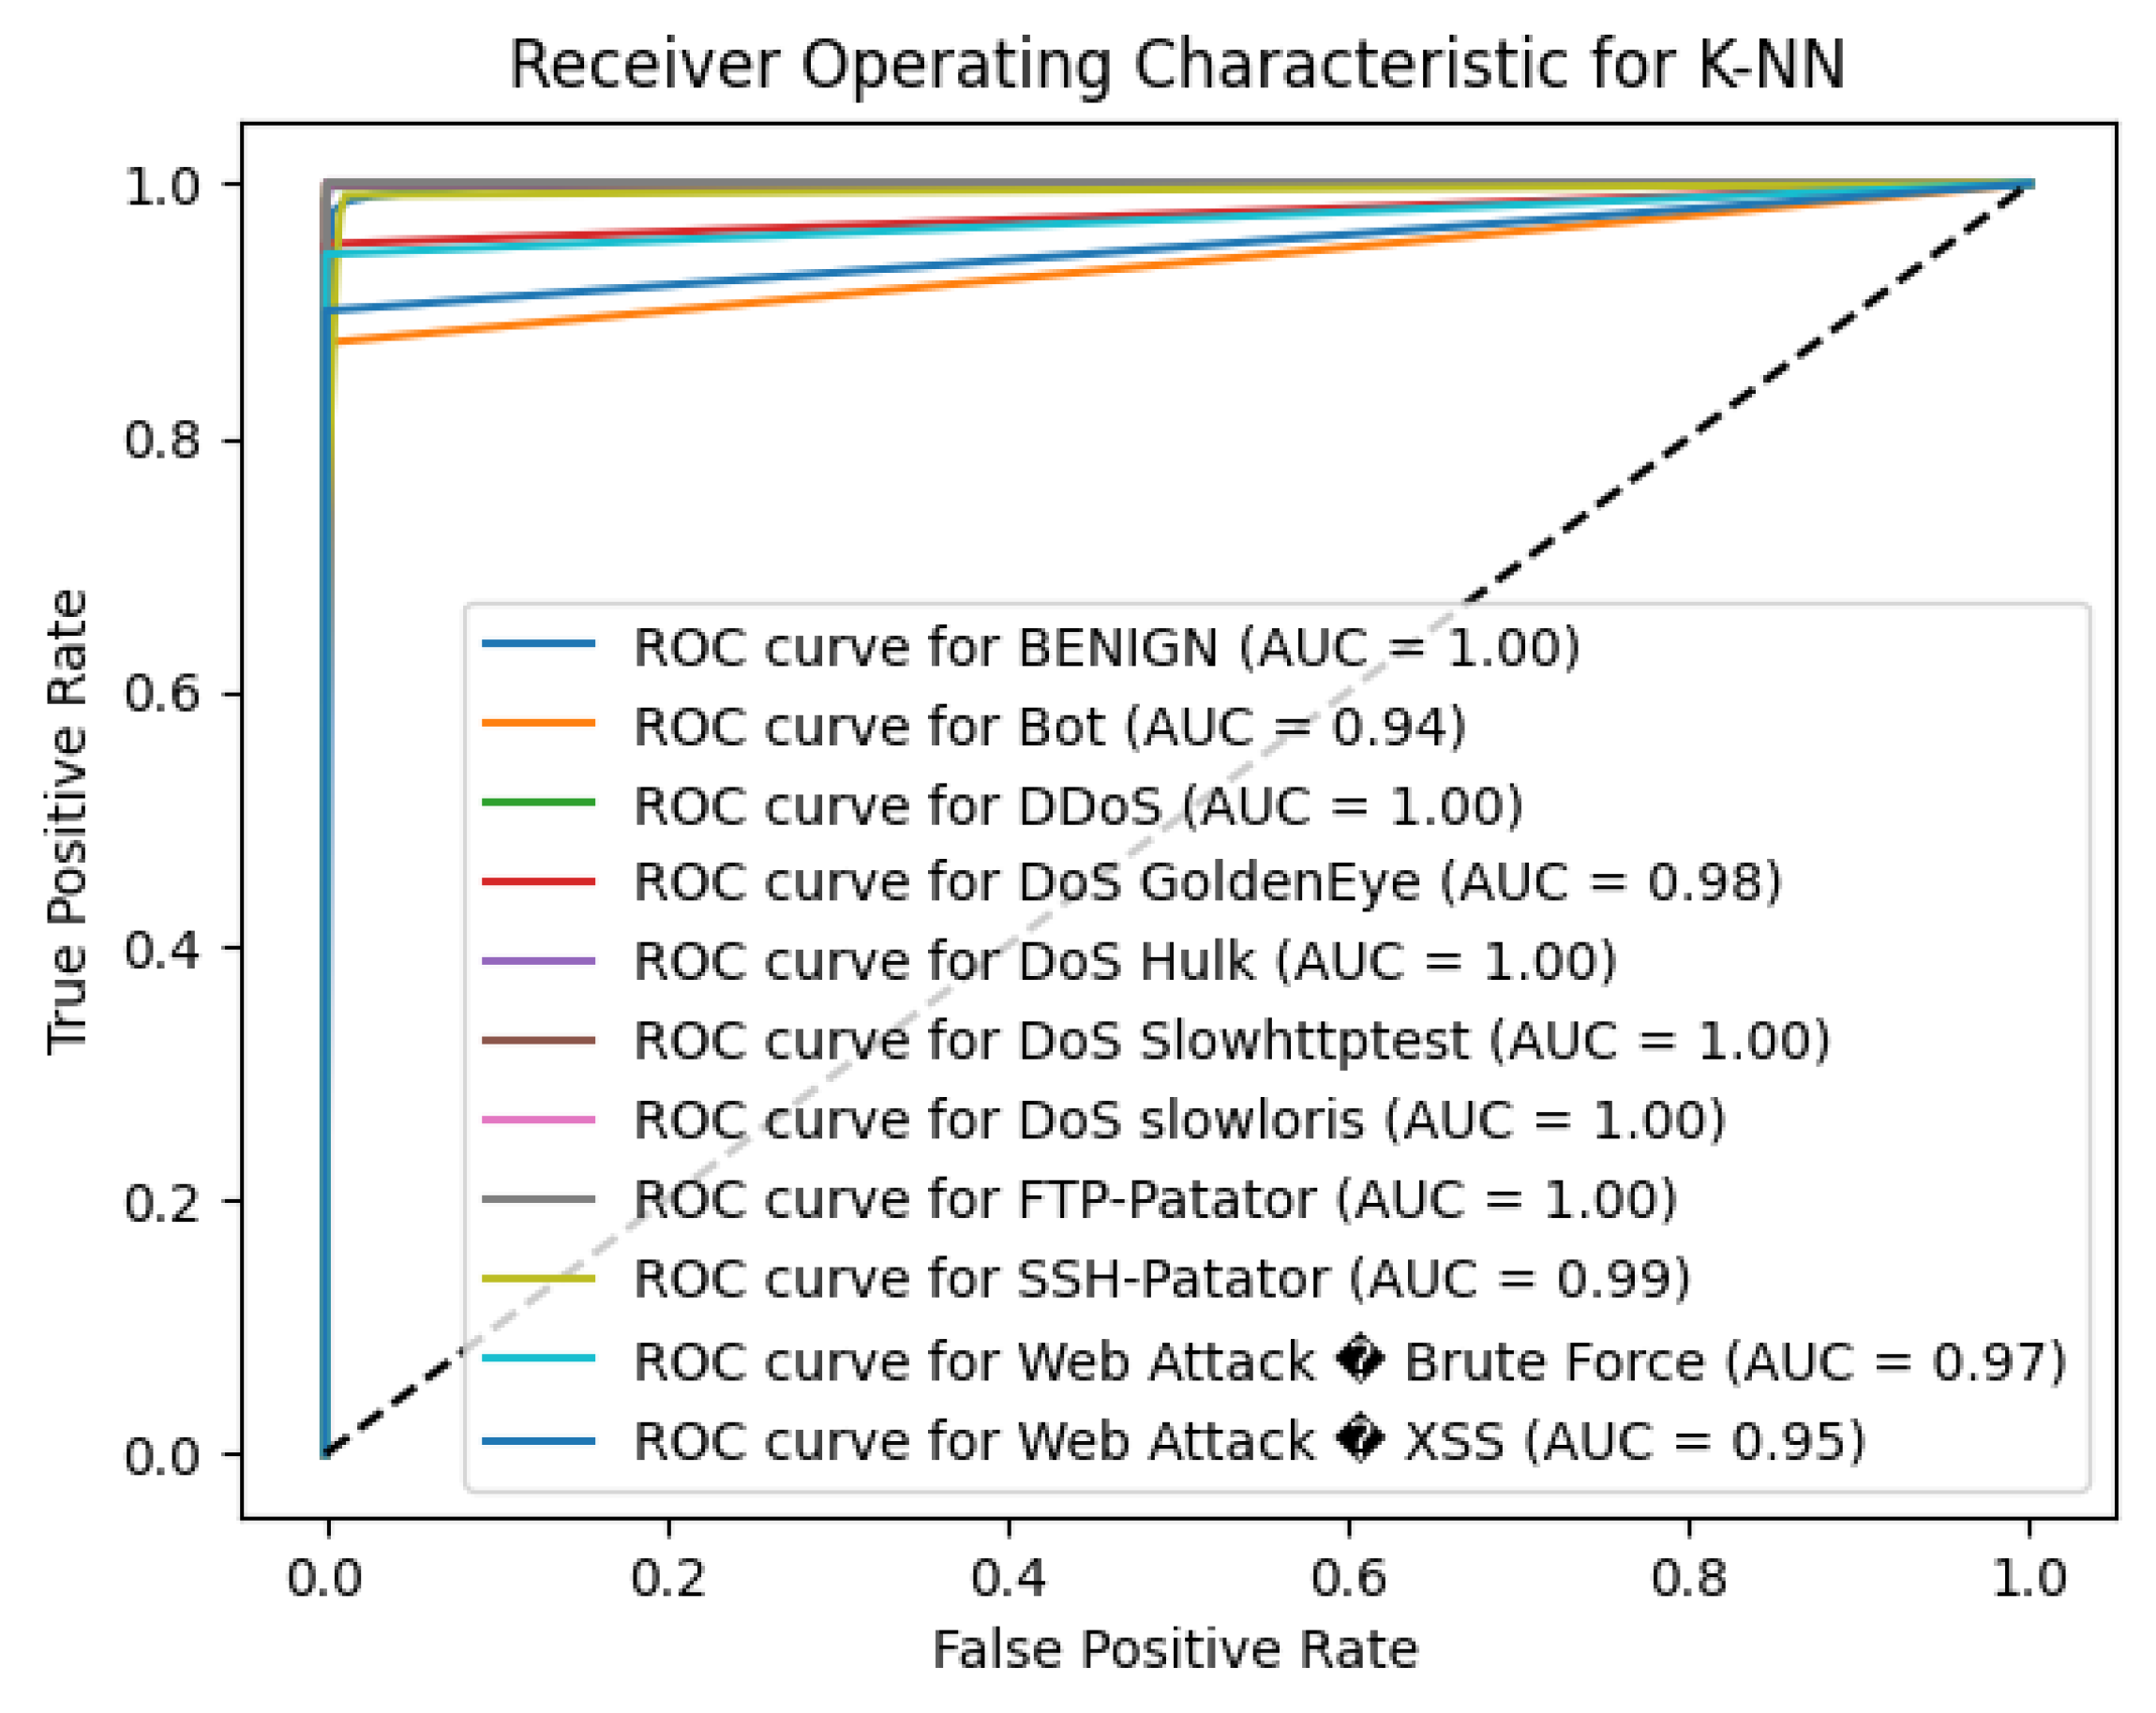

Table 3.
K-NN Classification Report on CICIDS2017 Dataset (Numeric Labels).
| Class (Numeric) | Precision | Recall | F1-Score | Support |
|---|---|---|---|---|
| 0 | 0.99 | 0.99 | 0.99 | 9,066 |
| 1 | 0.67 | 0.50 | 0.57 | 8 |
| 2 | 1.00 | 0.99 | 0.99 | 467 |
| 3 | 1.00 | 0.93 | 0.96 | 42 |
| 4 | 0.98 | 1.00 | 0.99 | 939 |
| 5 | 0.97 | 0.93 | 0.95 | 30 |
| 6 | 0.96 | 0.96 | 0.96 | 23 |
| 7 | 1.00 | 1.00 | 1.00 | 28 |
| 8 | 0.90 | 0.93 | 0.92 | 672 |
| 9 | 0.89 | 0.94 | 0.92 | 18 |
| 10 | 0.75 | 0.30 | 0.43 | 10 |
| 11 | 0.50 | 0.25 | 0.33 | 4 |
| Accuracy | 0.99 | 11,307 | ||
| Macro Avg | 0.88 | 0.81 | 0.83 | 11,307 |
| Weighted Avg | 0.99 | 0.99 | 0.99 | 11,307 |
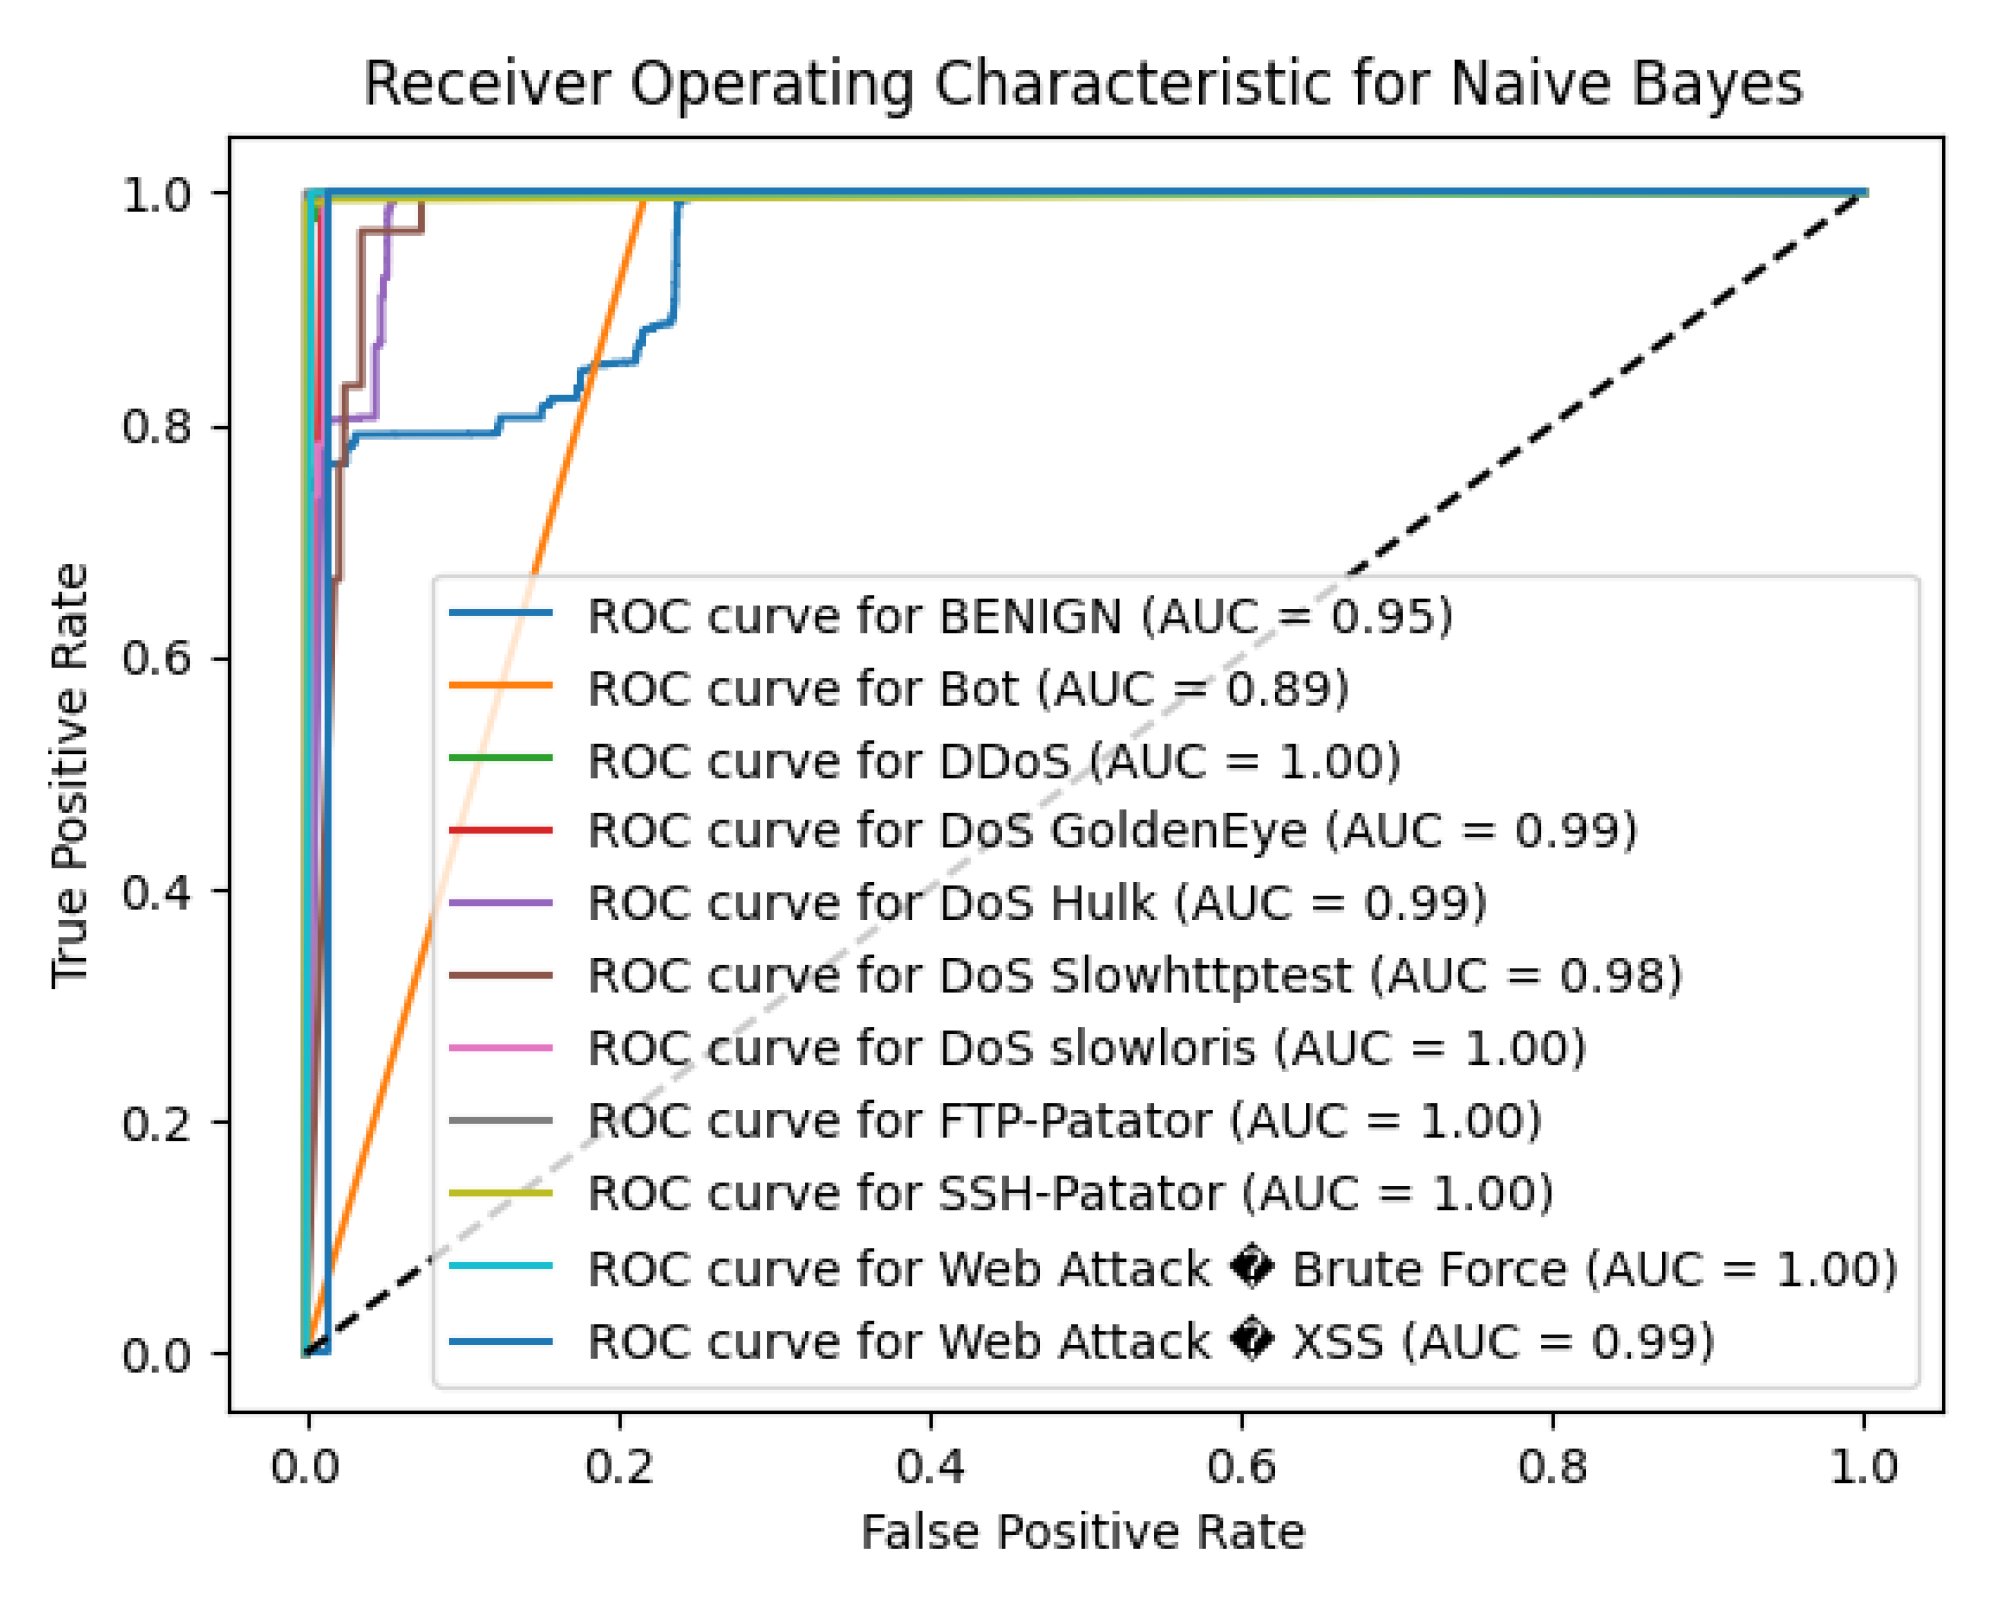
5.3. Performance of NB
The Naive Bayes (NB) algorithm achieved an overall accuracy of 70.61%, which is considerably lower compared to other algorithms evaluated. While NB showed high precision for certain attack types, it struggled significantly with recall for the majority class and several minority attack classes.
For the BENIGN class, which makes up the majority of the dataset, the NB model attained a precision of 1.00, indicating no false positives. However, the recall was 0.66, resulting in an F1-score of 0.79. This low recall implies that 34% of benign instances were incorrectly classified as attacks, leading to a high false alarm rate—an undesirable outcome in intrusion detection systems.
The model demonstrated strong performance in detecting certain attack types. Notably, DDoS attacks achieved a precision of 0.95, recall of 0.97, and F1-score of 0.96, indicating the model’s capability to accurately identify these attacks. Similarly, FTP-Patator and PortScan attacks had high precision and recall values (FTP-Patator: precision = 0.97, recall = 1.00, F1-score = 0.98; PortScan: precision = 0.99, recall = 0.99, F1-score = 0.99).
Table 4.
Naive Bayes Classification Report on CICIDS2017 Dataset (Numeric Labels).
| Class (Numeric) | Precision | Recall | F1-Score | Support |
|---|---|---|---|---|
| 0 | 1.00 | 0.66 | 0.79 | 9,066 |
| 1 | 0.00 | 1.00 | 0.01 | 8 |
| 2 | 0.95 | 0.97 | 0.96 | 467 |
| 3 | 0.17 | 1.00 | 0.29 | 42 |
| 4 | 0.85 | 0.80 | 0.82 | 939 |
| 5 | 0.08 | 0.67 | 0.15 | 30 |
| 6 | 0.17 | 0.78 | 0.29 | 23 |
| 7 | 0.97 | 1.00 | 0.98 | 28 |
| 8 | 0.99 | 0.99 | 0.99 | 672 |
| 9 | 0.28 | 1.00 | 0.43 | 18 |
| 10 | 0.00 | 0.00 | 0.00 | 10 |
| 11 | 0.23 | 0.75 | 0.35 | 4 |
| Accuracy | 0.71 | 11,307 | ||
| Macro Avg | 0.47 | 0.80 | 0.51 | 11,307 |
| Weighted Avg | 0.97 | 0.71 | 0.81 | 11,307 |
However, the NB algorithm faced significant challenges with other attack classes, particularly those with fewer instances. The Bot class, with only 8 instances, had a precision of 0.00 and recall of 1.00, resulting in an F1-score of 0.01. This indicates that while the model identified all Bot instances, it also incorrectly classified many other instances as Bot, leading to a high false positive rate. Similar issues were observed with DoS GoldenEye (precision = 0.17, recall = 1.00, F1-score = 0.29) and DoS slowloris (precision = 0.17, recall = 0.78, F1-score = 0.29), suggesting difficulty in correctly classifying these attacks without mislabeling other traffic.
The Web Attack classes showed particularly poor performance. Web Attack – Brute Force had both precision and recall of 0.00, indicating the model failed to identify any instances correctly. Web Attack – XSS fared slightly better with a precision of 0.23 and recall of 0.75, but the F1-score remained low at 0.35, reflecting inadequate detection capability.
The macro-average F1-score was 0.51, highlighting mediocre average performance across all classes, especially due to low scores in minority classes. The weighted average F1-score was 0.81, which, while higher, is influenced by the large number of benign instances and does not fully represent the model’s shortcomings in detecting less frequent attack types.
To sum up, we found that Naive Bayes has rather reasonable capabilities of the attacks’ classification, such as DDoS and PortScan, however, due to the low recall compared to precision while dealing with the benign traffic and inability to detect some of the attack classes. The conclusion of high false positive and false negative ratios are sensed to NB in detecting relationships within the network traffic to four classes on the CICIDS2017 dataset for reliable multi-class intrusion detection. It is likely that performance might improve with feature selection, class imbalance correction or decision to apply better algorithms.
Figure 4.
NB ROC curve.
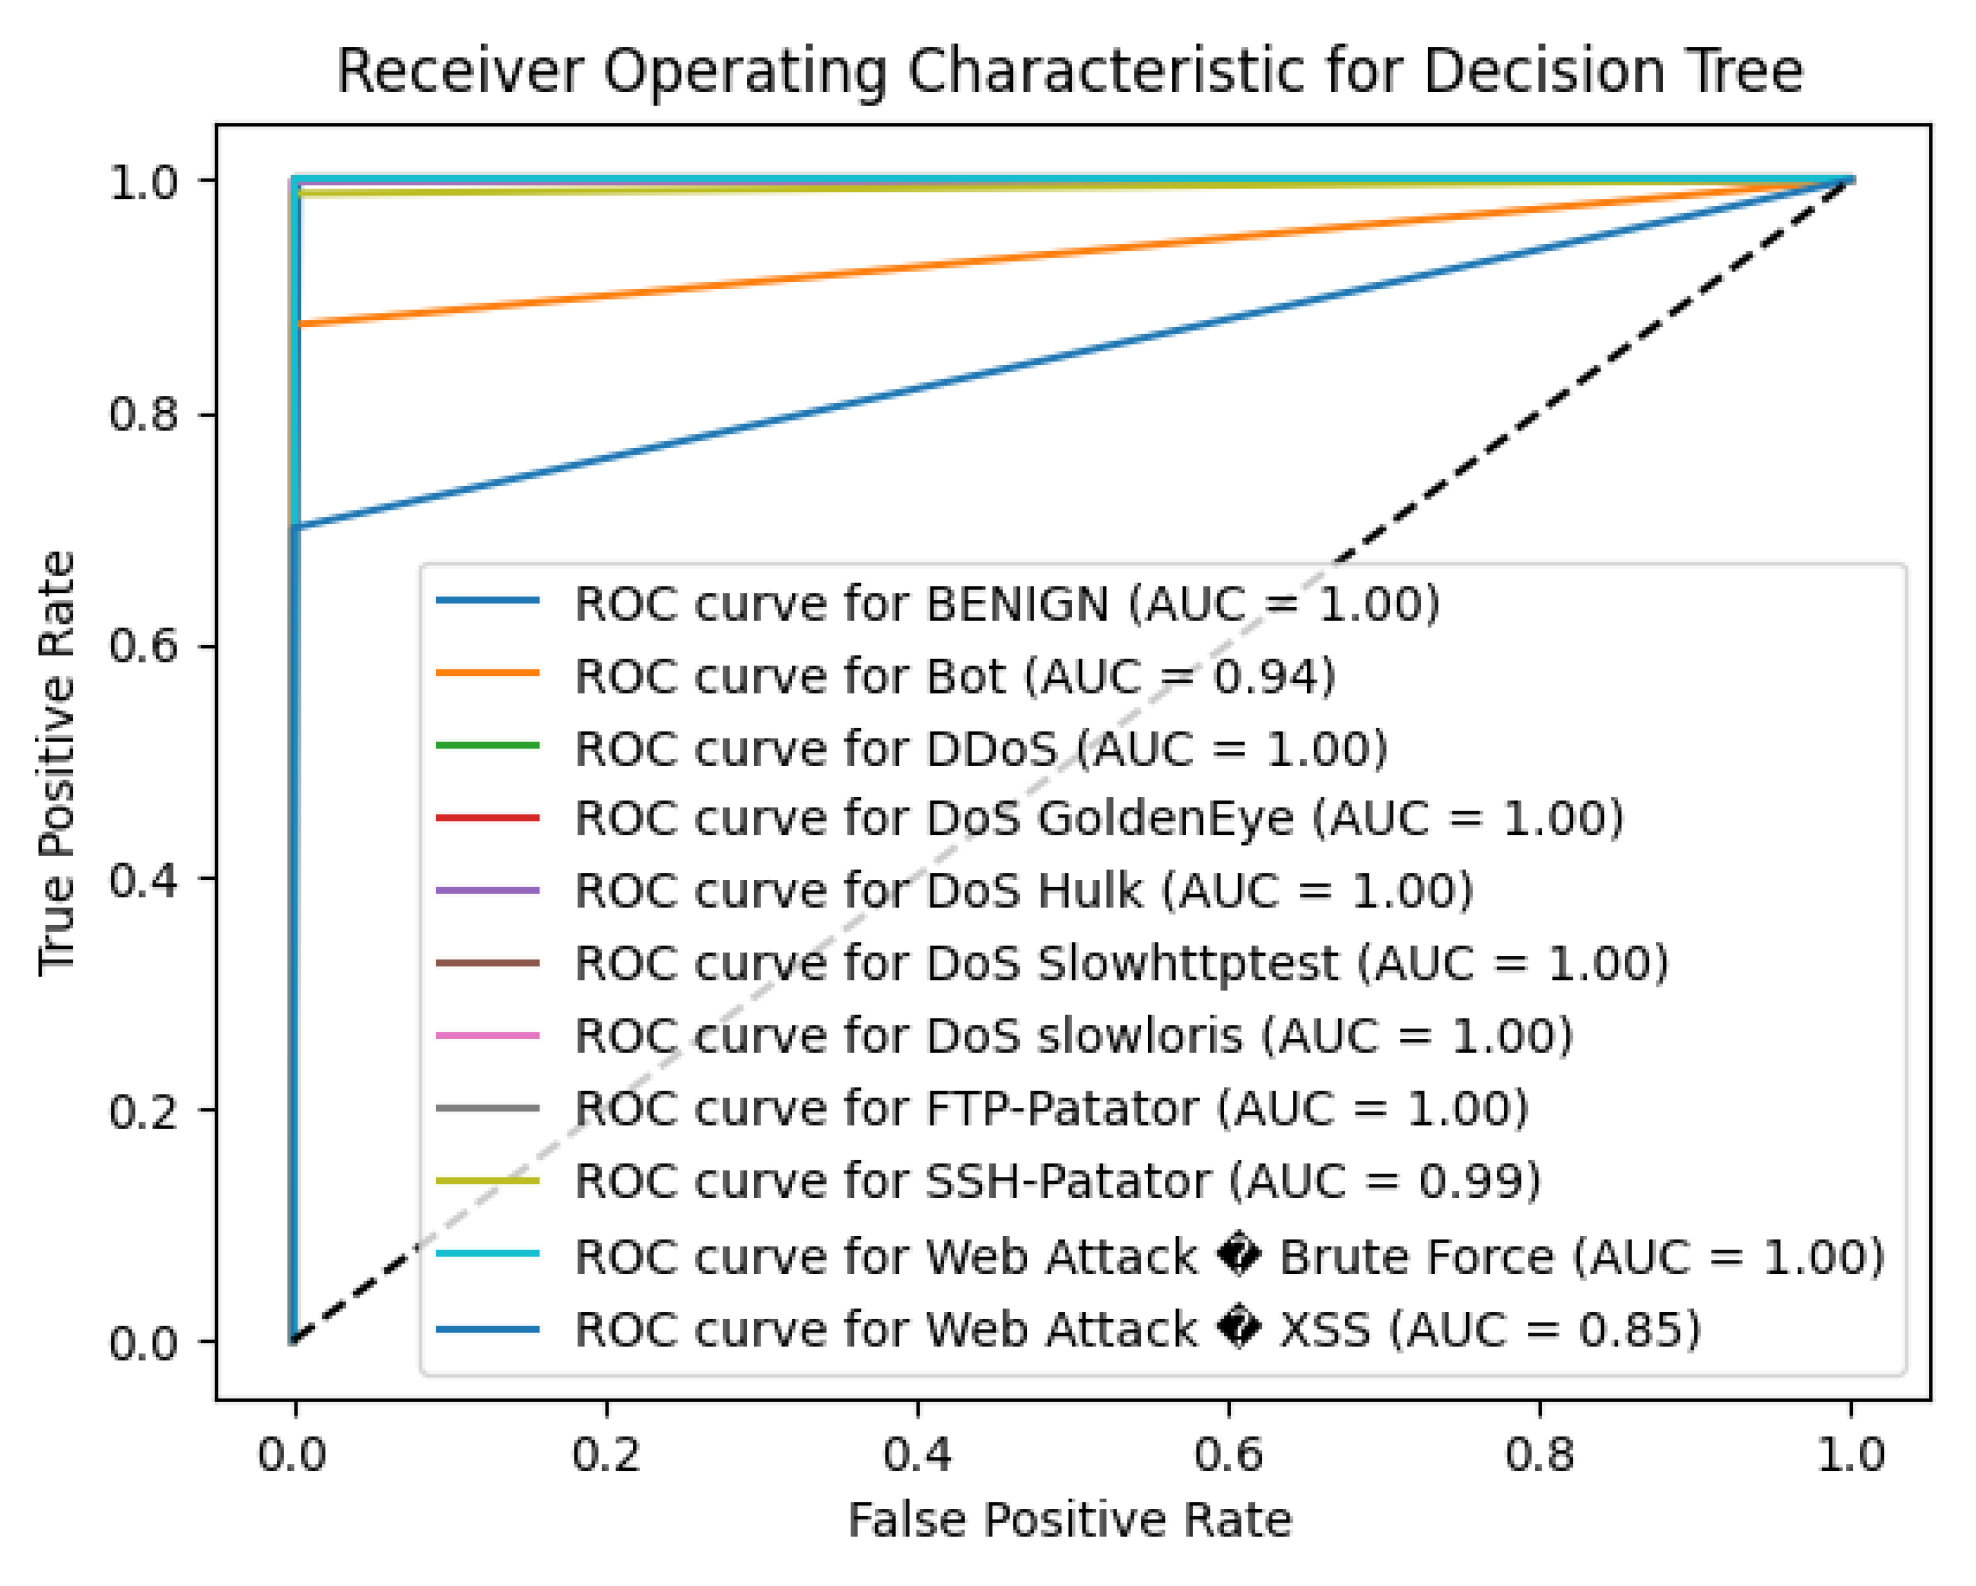
5.4. Performance of DT
The decision Tree (DT) algorithm exhibited excelent features predicting with an overall accuracy of 99.73% in the CICIDS2017 dataset. This high accuracy reveals the fact that the created model has a high potential to differentiate benign traffic and different kinds of attacks.
Table 5.
Decision Tree Classification Report on CICIDS2017 Dataset (Numeric Labels).
| Class (Numeric) | Precision | Recall | F1-Score | Support |
|---|---|---|---|---|
| 0 | 1.00 | 1.00 | 1.00 | 9,066 |
| 1 | 0.54 | 0.88 | 0.67 | 8 |
| 2 | 1.00 | 1.00 | 1.00 | 467 |
| 3 | 1.00 | 1.00 | 1.00 | 42 |
| 4 | 1.00 | 1.00 | 1.00 | 939 |
| 5 | 1.00 | 1.00 | 1.00 | 30 |
| 6 | 0.88 | 1.00 | 0.94 | 23 |
| 7 | 1.00 | 1.00 | 1.00 | 28 |
| 8 | 1.00 | 0.99 | 0.99 | 672 |
| 9 | 1.00 | 1.00 | 1.00 | 18 |
| 10 | 0.70 | 0.70 | 0.70 | 10 |
| 11 | 0.00 | 0.00 | 0.00 | 4 |
| Accuracy | 0.997 | 11,307 | ||
| Macro Avg | 0.84 | 0.88 | 0.86 | 11,307 |
| Weighted Avg | 1.00 | 1.00 | 1.00 | 11,307 |
For the BENIGN class, the model attained 1.00 for precision, recall, and F1-score which means that no normal network traffic is being misclassified. The DT algorithm was just as efficient at detecting several classes of attack types, with perfect precision, recall, and F1 scores of 1.000 for classifications of DDoS and DoS attacks,SSH-Patator and FTP-Patator. This shows that this model is quite effective in capturing these prevalent threats as evident in its predictions above.
With a highest accuracy of 1.00, it can be said that the model is highly reliable in identifying the PortScan attack with precision, recall, and F1 score evaluated at 0.99. For the DoS slowloris attack, the DT achieved a precision of 0.88, recall of 1.00, and F1-score of 0.94, showing strong detection capabilities despite a slightly lower precision.
However, the DT algorithm faced challenges with minority classes, particularly those with very few instances. For the Bot class, which had only 8 instances, the precision was 0.54, recall was 0.88, and F1-score was 0.67. While the high recall suggests the model correctly identified most Bot instances, the lower precision indicates a higher rate of false positives in this category. Similarly, for Web Attack – Brute Force, the model achieved a precision, recall, and F1-score of 0.70, reflecting moderate performance. The model struggled with the Web Attack – XSS class, with precision and recall both at 0.00, indicating it failed to detect any instances of this attack type. This could be attributed to the minimal number of samples (support = 4), making it difficult for the model to learn distinguishing features.
The macro-average F1-score was 0.86, while the F1-score was 1.00, highlighting the model’s excellent overall performance when accounting for class prevalence.
In summary, the Decision Tree algorithm exhibited high effectiveness in detecting the majority of attack types within the CICIDS2017 dataset. Its outstanding performance on most classes makes it a strong candidate for intrusion detection systems. To improve detection of underrepresented attack types, future work could involve techniques such as oversampling minority classes, adjusting class weights, or employing ensemble methods to make sure that the model is capable of generalizing to all types of attacks.
Figure 5.
DT ROC curve.
5.5. Performance of RF
The Random Forest (RF) algorithm demonstrated outstanding performance on the CICIDS2017 dataset, achieving an overall accuracy of 99.74%. This high accuracy reflects the model’s strong capability in distinguishing between benign traffic and various attack types.
For the BENIGN class, the RF model attained flawless scores with precision, recall, and F1-score all at 1.00, indicating flawless identification of normal network traffic. The model also exhibited excellent performance in detecting several attack types, attaining perfect precision, recall, and F1-scores of 1.00 for classes such as DDoS, DoS slowloris, FTP-Patator, and PortScan. This highlights the model’s robustness in accurately identifying these prevalent threats.
The RF algorithm performed well on the DoS Hulk attack, with a precision of 0.99, recall of 1.00, and F1-score of 1.00, demonstrating high reliability in detecting this type of attack. For DoS GoldenEye and DoS Slowhttptest, the model achieved high F1-scores of 0.98 and 0.97, respectively, indicating strong detection capabilities.
Figure 6.
RF ROC curve.
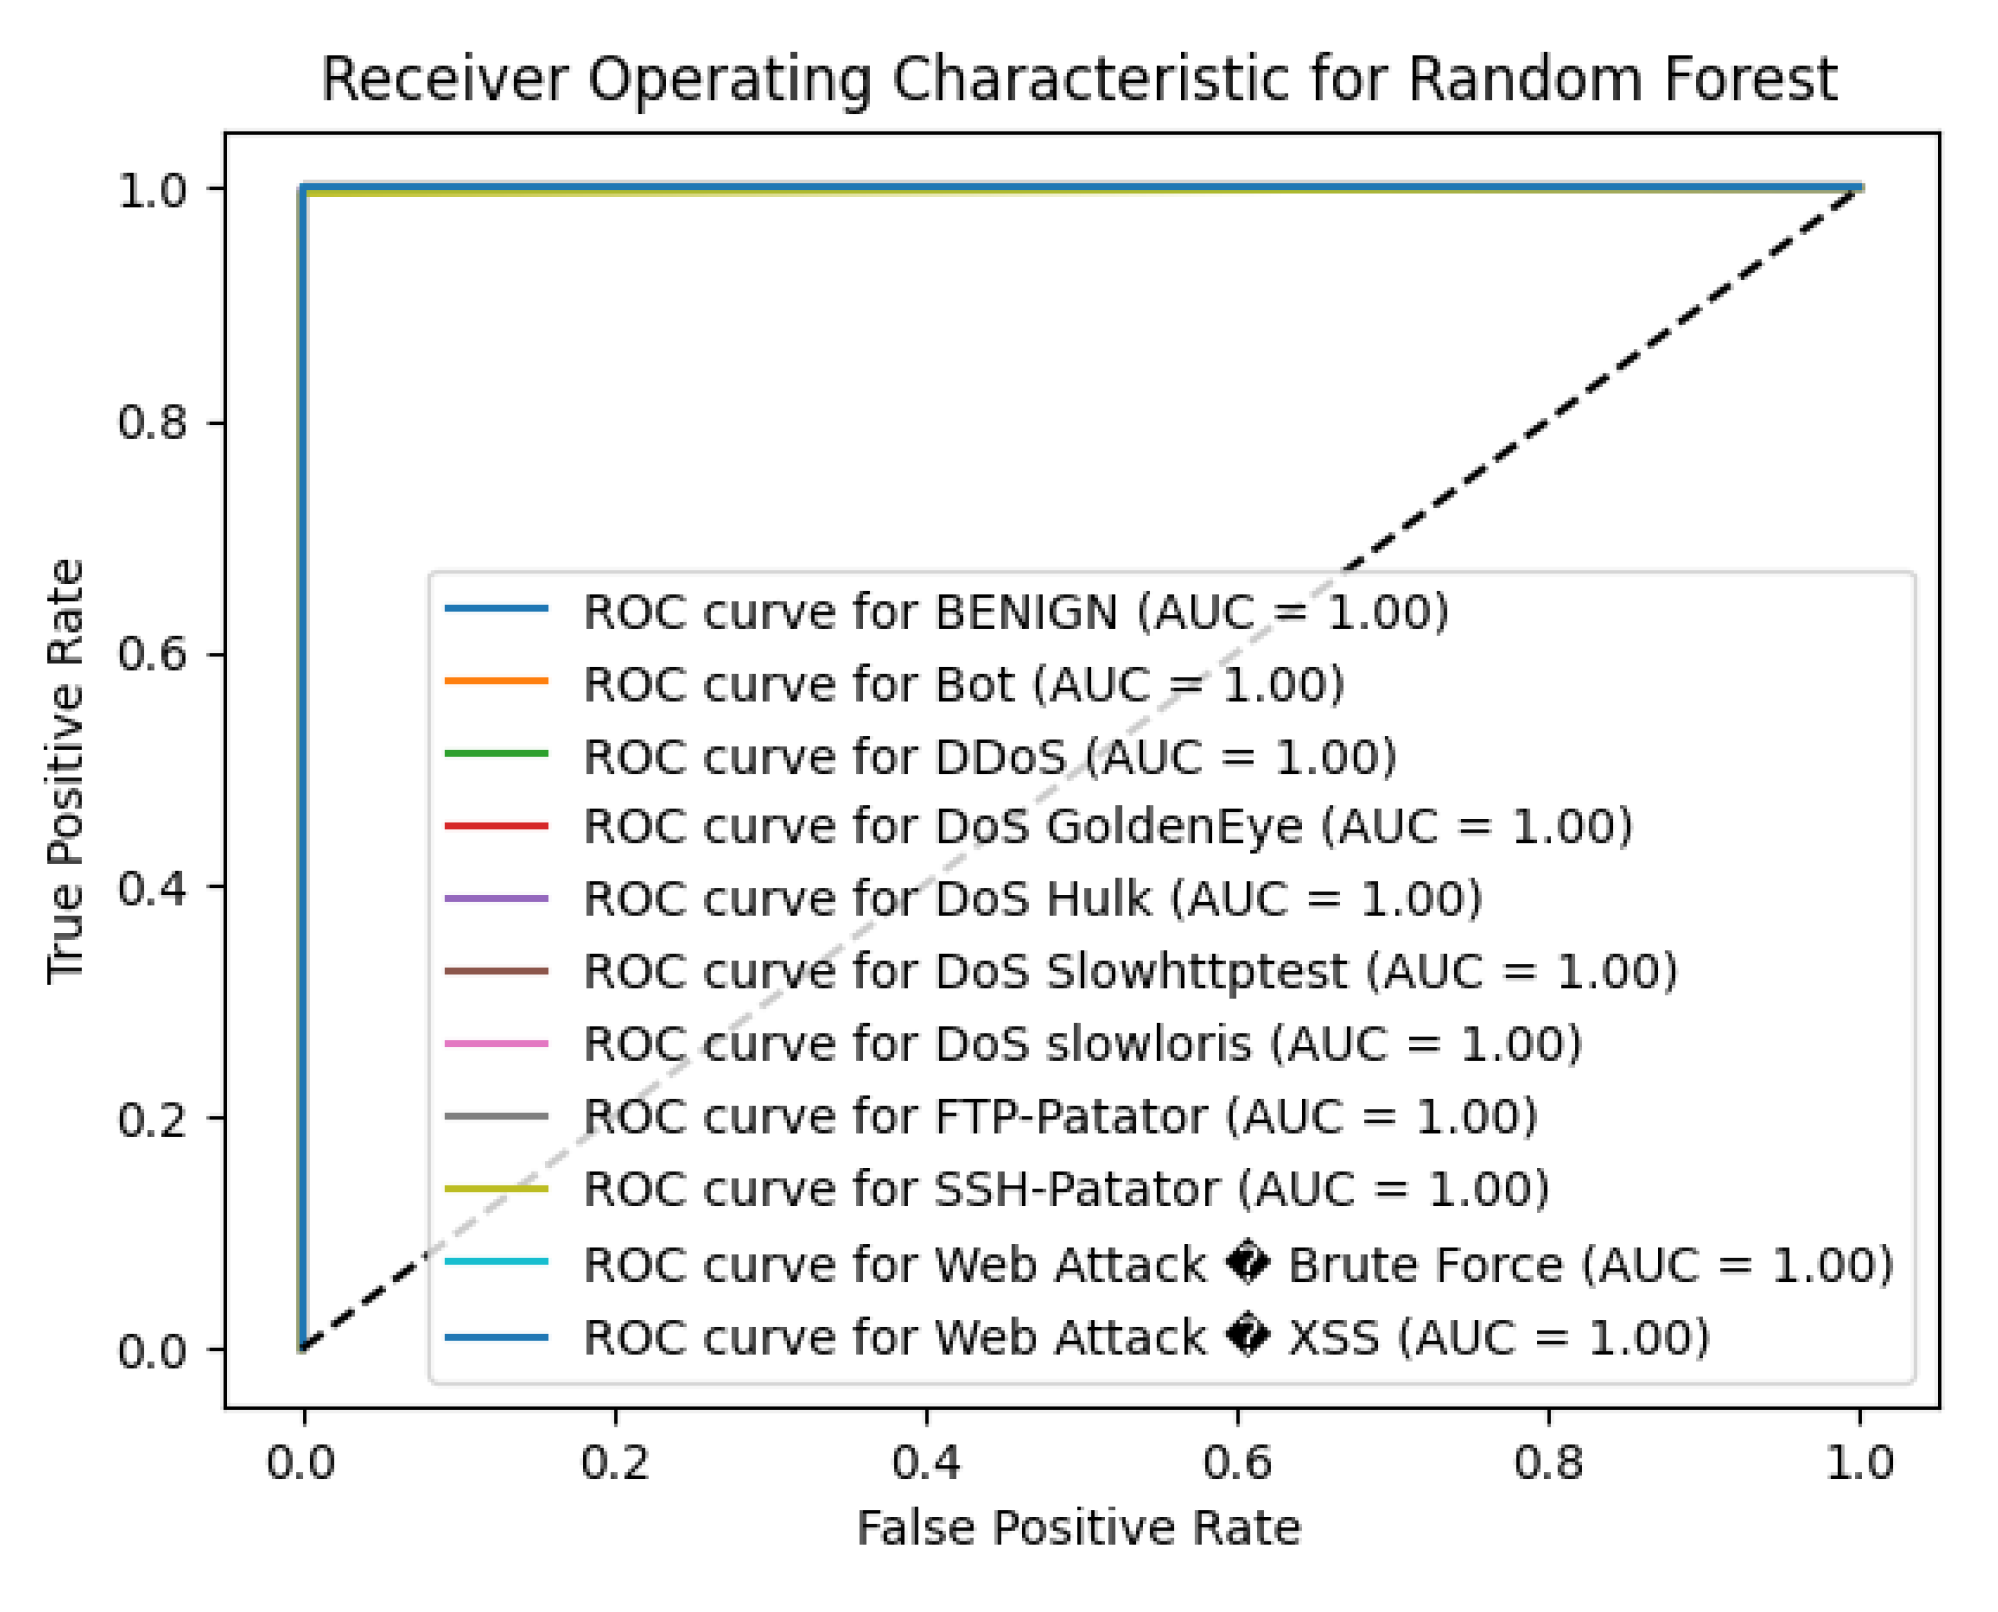
Table 6.
Random Forest Classification Report on CICIDS2017 Dataset (Numeric Labels).
| Class (Numeric) | Precision | Recall | F1-Score | Support |
|---|---|---|---|---|
| 0 | 1.00 | 1.00 | 1.00 | 9,066 |
| 1 | 0.50 | 0.25 | 0.33 | 8 |
| 2 | 1.00 | 1.00 | 1.00 | 467 |
| 3 | 1.00 | 0.95 | 0.98 | 42 |
| 4 | 0.99 | 1.00 | 1.00 | 939 |
| 5 | 1.00 | 0.93 | 0.97 | 30 |
| 6 | 1.00 | 1.00 | 1.00 | 23 |
| 7 | 1.00 | 1.00 | 1.00 | 28 |
| 8 | 1.00 | 1.00 | 1.00 | 672 |
| 9 | 1.00 | 0.94 | 0.97 | 18 |
| 10 | 0.75 | 0.60 | 0.67 | 10 |
| 11 | 0.25 | 0.25 | 0.25 | 4 |
| Accuracy | 0.997 | 11,307 | ||
| Macro Avg | 0.87 | 0.83 | 0.85 | 11,307 |
| Weighted Avg | 1.00 | 1.00 | 1.00 | 11,307 |
However, the model faced challenges with minority classes, particularly those with very few instances. For the Bot class, which had only 8 instances, the precision was 0.50, recall was 0.25, and F1-score was 0.33. This suggests difficulty in accurately identifying botnet activities due to the limited number of samples, leading to a higher rate of false positives and false negatives in this category. Similarly, the detection performance for Web Attack – Brute Force was moderate, with a precision of 0.75, recall of 0.60, and F1-score of 0.67. The Web Attack – XSS class had lower performance, with precision, recall, and F1-score all at 0.25, reflecting the model’s struggle to detect this attack type effectively.
The macro-average F1-score was 0.85, reflecting the average performance across all classes without considering class imbalance, while the weighted-average F1-score was 1.00, highlighting the model’s exceptional overall performance when accounting for class prevalence.
In summary, the Random Forest algorithm exhibited high effectiveness in detecting the majority of attack types within the CICIDS2017 dataset. Its ability to achieve near-perfect scores in most classes makes it a strong candidate for intrusion detection systems. To enhance detection of underrepresented attack types, in the future, oversampling, changing class weights, or incorporating more features can be done to increase the model’s overall ability across all attacking categories This is because some machine learning models struggle to identify minorities.
5.6. Performance of SVM
The SVM algorithm resulted in average accuracy measuring 96.30% of the CICIDS2017 dataset proving good results in categorizing the network traffic as normal or attack. The model according to this metric achieved high accuracy on the majority class and some attack types but did poorly on several minority classes.
Table 7.
SVM Classification Report on CICIDS2017 Dataset (Numeric Labels).
| Class (Numeric) | Precision | Recall | F1-Score | Support |
|---|---|---|---|---|
| 0 | 0.98 | 0.98 | 0.98 | 9,066 |
| 1 | 0.00 | 0.00 | 0.00 | 8 |
| 2 | 0.98 | 0.92 | 0.95 | 467 |
| 3 | 1.00 | 0.76 | 0.86 | 42 |
| 4 | 0.98 | 0.91 | 0.94 | 939 |
| 5 | 0.79 | 0.87 | 0.83 | 30 |
| 6 | 1.00 | 0.74 | 0.85 | 23 |
| 7 | 0.00 | 0.00 | 0.00 | 28 |
| 8 | 0.79 | 0.99 | 0.88 | 672 |
| 9 | 0.00 | 0.00 | 0.00 | 18 |
| 10 | 0.00 | 0.00 | 0.00 | 10 |
| 11 | 0.00 | 0.00 | 0.00 | 4 |
| Accuracy | 0.96 | 11,307 | ||
| Macro Avg | 0.54 | 0.51 | 0.52 | 11,307 |
| Weighted Avg | 0.96 | 0.96 | 0.96 | 11,307 |
For the BENIGN class taking up a large portion of the dataset the SVM model achieved a precision of 0.98, recall of 0.98 and the F- Score of 0.98 that suggests that the model works well for correctly identifying normal network traffic. The model also had quite considerable accuracy for detecting the class of DDoS attack with a precision value of 0.98, recall value of 0.92 and F1-Score value of 0.95. This indicates that the SVM was very useful in identifying patterns of distributed denial-of-service attack origin.
The SVM algorithm performed reasonably well on other attack types such as DoS GoldenEye (F1-score = 0.86), DoS Hulk (F1-score = 0.94), and DoS Slowhttptest (F1-score = 0.83), indicating moderate success in detecting these types of denial-of-service attacks. However, the model faced significant challenges with several minority classes.
However, the proposed SVM did not classify any instance of the Bot, FTP-Patator, SSH-Patator, Web Attack – Brute Force, and Web Attack – XSS classes with precision, recall, and even F1-scores of 0.00 as highlighted in the tables. This means that several samples from the above attack types were not classified correctly by the model or were not mapped to any at all presumably due to their complex patterns and the small numbers of instances in the dataset (e.g., Bot with support = 8, Web Attack – XSS with support = 4).
The PortScan class had a lower precision of 0.79 but a high recall of 0.99, resulting in an F1-score of 0.88. This indicates that while the model was able to identify most instances of port scanning activities, there was a higher rate of false positives, misclassifying other traffic as PortScan.
The macro-average F1-score was 0.52, reflecting the average performance across all classes without considering class imbalance. This low score underscores the model’s inability to generalize well across all attack types, particularly the minority classes. The weighted-average F1-score was 0.96, heavily influenced by the model’s strong performance on the majority class and more prevalent attack types.
In summary, while the SVM algorithm demonstrated effectiveness in detecting the majority class and certain attacks like DDoS and DoS variants, its overall performance is limited by poor detection of several critical attack types. The problem of identifying the existence of minority classes is a major challenge for intrusion detection systems since it can lead to the possibility of these threats escaping unnoticed. Furthermore, the accuracy of this model could be increased in future work and explored through methods such as oversampling the data of the two minority classes or through the proper selection of kernel functions for the data. Moreover, feature selection, or dimensionality reduction can also be used where it attempts to bring the most important features to the Light when doing the classification of such complicated attacks.
5.7. Performance of LR
The Logistic Regression (LR) algorithm achieved an overall accuracy of 96.14% on the CICIDS2017 dataset, indicating solid performance in classifying network traffic as benign or malicious. The model performed well on the majority class and certain attack types but faced challenges with several minority classes.
Figure 7.
LR ROC curve.
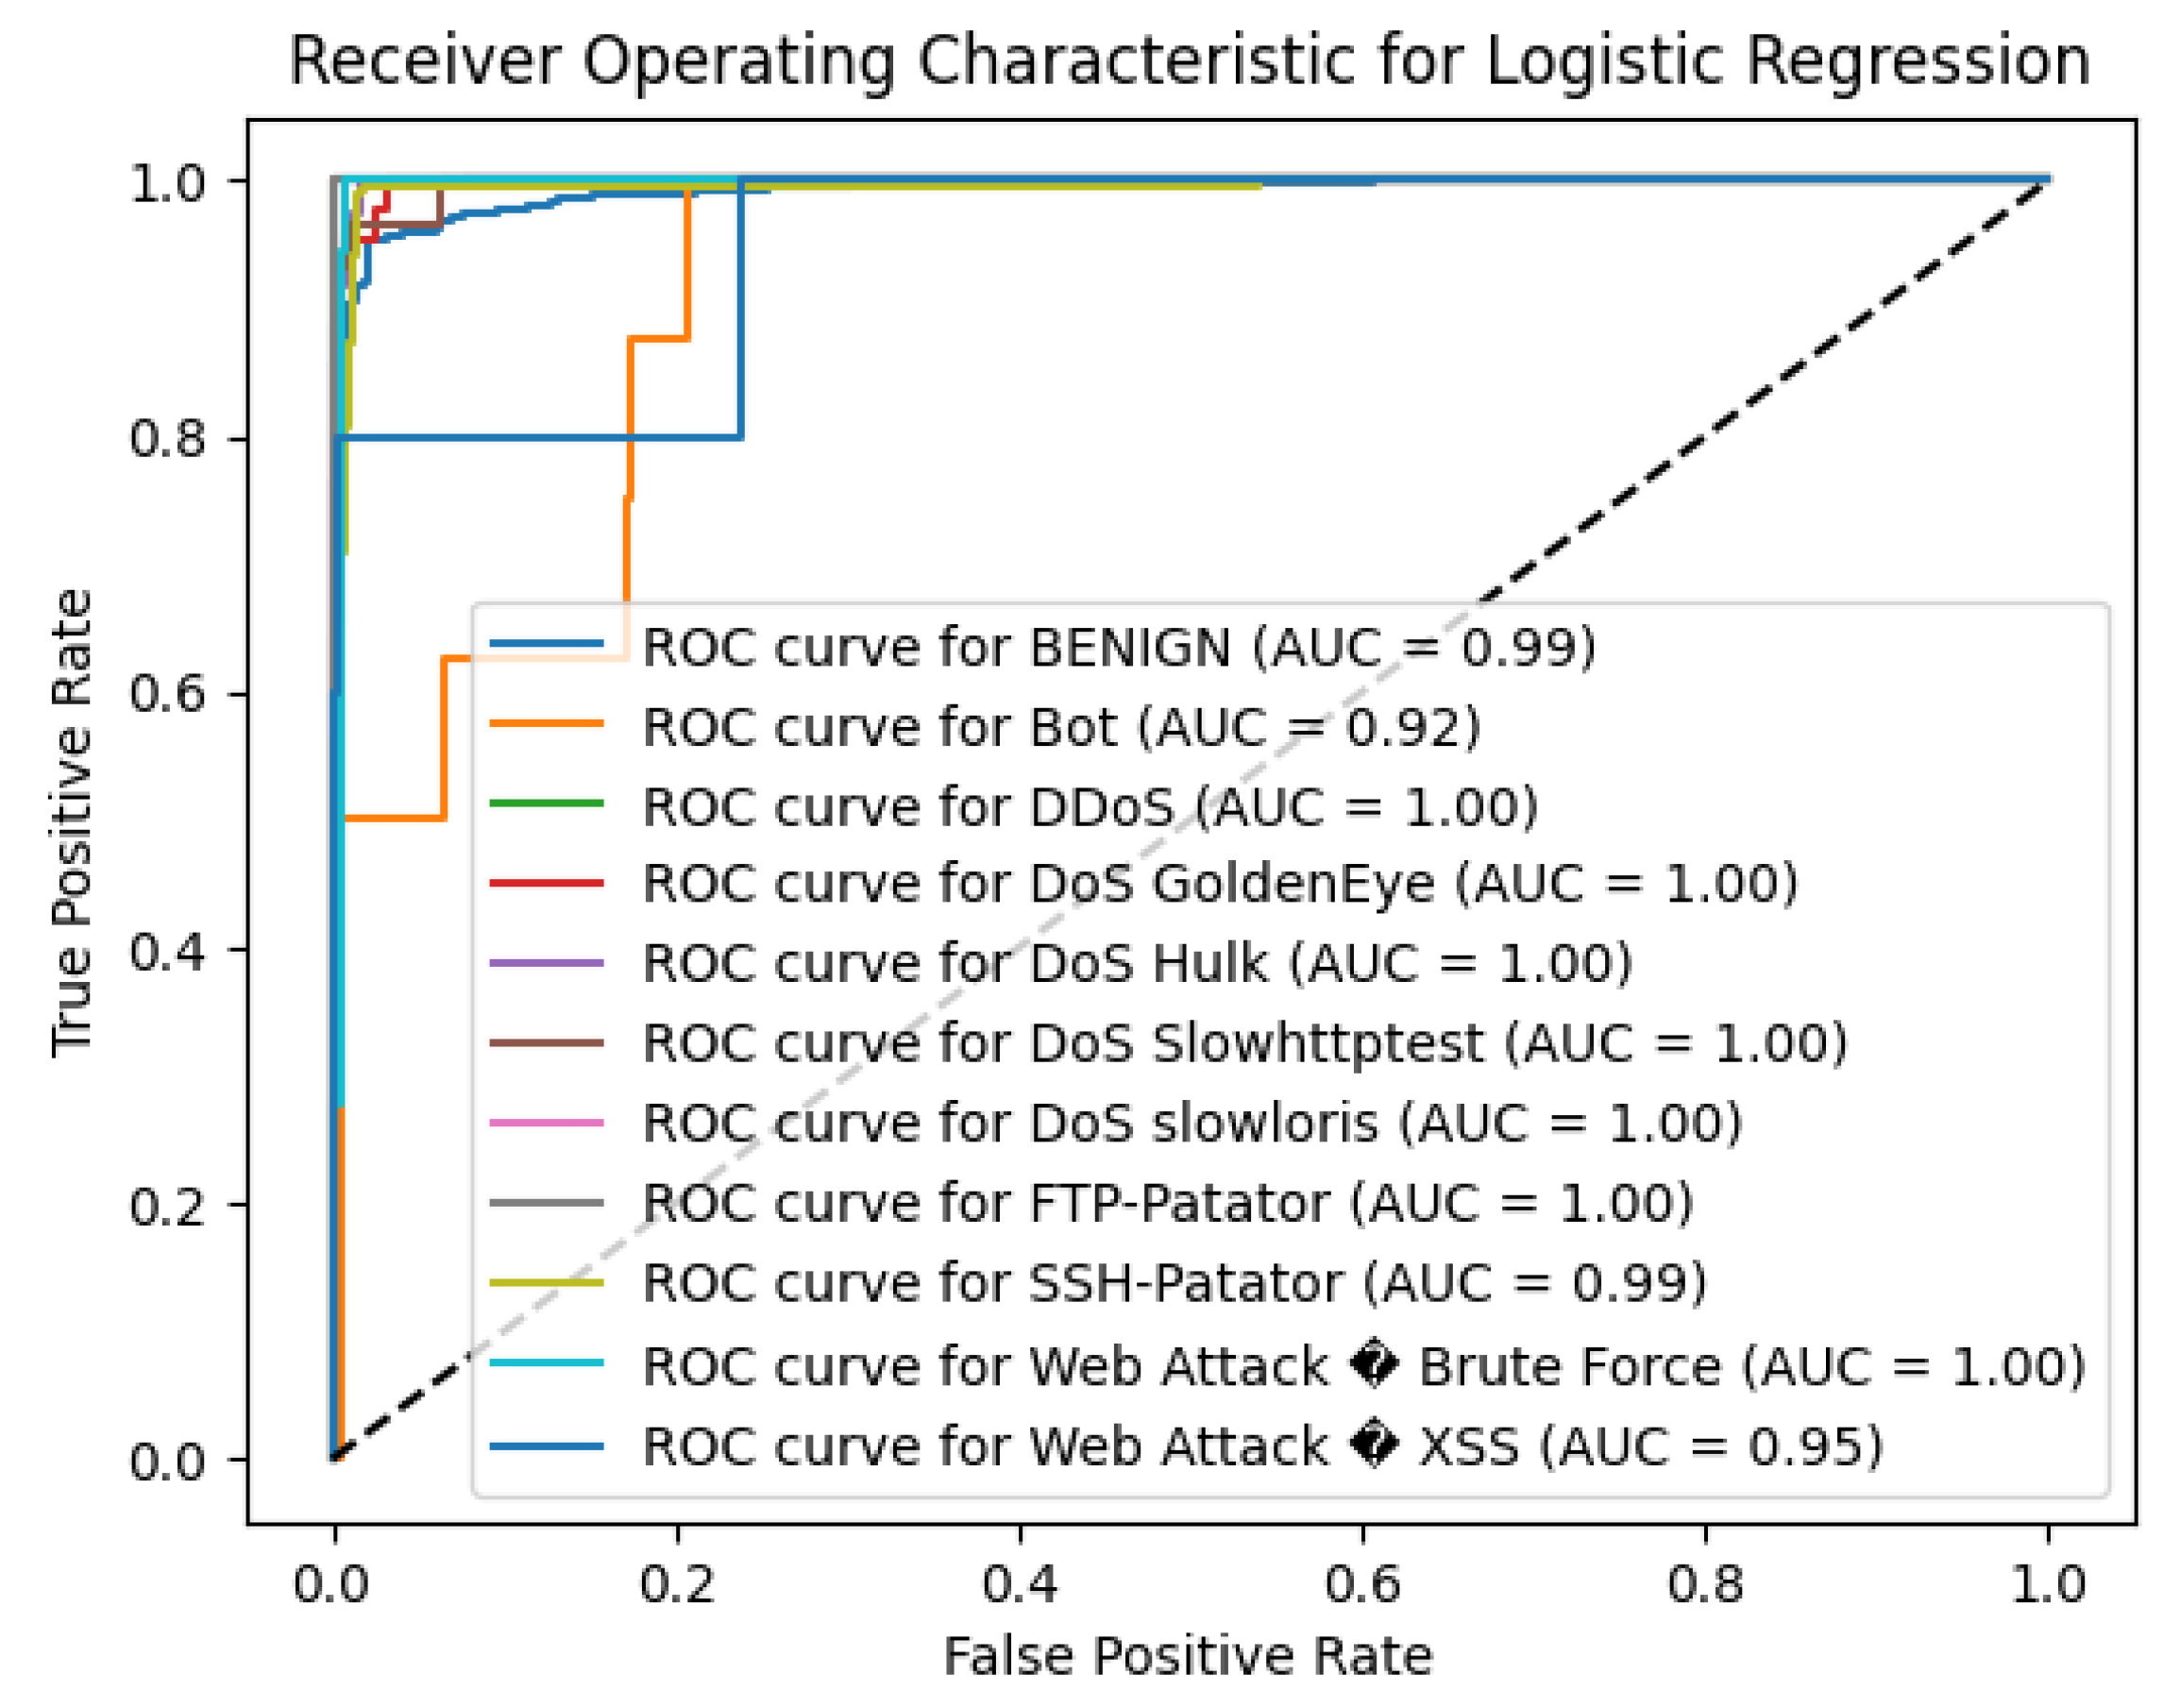
For the BENIGN class, which refers to the majority of presented instances, the LR model achieved precision of 0.98 and recall of 0.97 with the F1-measure of 0.98 meaning that the model accurately classified normal network traffic. The model also revealed promising in terms of detecting the DDoS attack class, the precision rate of 0.98 and the recall rate of 0.94 as well as the F1- score of equal to 0.96 which means the model successfully recognize pattern corresponding to the distributed denial-of-service attacks.
The LR algorithm performed reasonably well on other attack types such as DoS GoldenEye (precision = 0.92, recall = 0.79, F1-score = 0.85), DoS Hulk (precision = 0.90, recall = 0.96, F1-score = 0.93), and DoS Slowhttptest (precision = 0.72, recall = 0.70, F1-score = 0.71), reflecting moderate success in detecting these denial-of-service attacks. However, the model encountered a couple of challenges when working with some minority classes.
Table 8.
Logistic Regression Classification Report on CICIDS2017 Dataset (Numeric Labels).
| Class (Numeric) | Precision | Recall | F1-Score | Support |
|---|---|---|---|---|
| 0 | 0.98 | 0.97 | 0.98 | 9,066 |
| 1 | 0.00 | 0.00 | 0.00 | 8 |
| 2 | 0.98 | 0.94 | 0.96 | 467 |
| 3 | 0.92 | 0.79 | 0.85 | 42 |
| 4 | 0.90 | 0.96 | 0.93 | 939 |
| 5 | 0.72 | 0.70 | 0.71 | 30 |
| 6 | 0.81 | 0.74 | 0.77 | 23 |
| 7 | 0.91 | 0.36 | 0.51 | 28 |
| 8 | 0.79 | 0.99 | 0.88 | 672 |
| 9 | 0.00 | 0.00 | 0.00 | 18 |
| 10 | 0.00 | 0.00 | 0.00 | 10 |
| 11 | 0.00 | 0.00 | 0.00 | 4 |
| Accuracy | 0.96 | 11,307 | ||
| Macro Avg | 0.59 | 0.54 | 0.55 | 11,307 |
| Weighted Avg | 0.96 | 0.96 | 0.96 | 11,307 |
Notably, the LR failed to detect any instances of the Bot, SSH-Patator, Web Attack – Brute Force, and Web Attack – XSS classes, as indicated by precision, recall, and F1-scores of 0.00 for these categories. This implies that the model did not correctly classify any samples from these attack types, potentially due to the limited number of instances (e.g., Bot with support = 8, Web Attack – XSS with support = 4) and the complex patterns associated with these attacks.
The PortScan class had a precision of 0.79 and a high recall of 0.99, resulting in an F1-score of 0.88. This indicates that while the model was able to identify most instances of port scanning activities, there was a higher rate of false positives, misclassifying other traffic as PortScan.
The macro-average F1-score was 0.55, reflecting the average performance across all classes without considering class imbalance. This relatively low score underscores the model’s difficulty in generalizing across all attack types, particularly the minority classes. The weighted-average F1-score was 0.96, heavily influenced by the model’s strong performance on the majority class and more prevalent attack types.
In summary, while the Logistic Regression algorithm demonstrated effectiveness in detecting the majority class and certain attacks like DDoS and DoS variants, its overall performance is limited by poor detection of several critical attack types. The inability to identify minority classes poses a significant concern for intrusion detection systems, as it could allow these threats to go unnoticed. To improve the model’s performance, future work could involve addressing class imbalance through techniques such as oversampling minority classes, adjusting class weights, or incorporating more complex features to better capture the characteristics of these attacks.
Figure 8.
AB ROC curve.
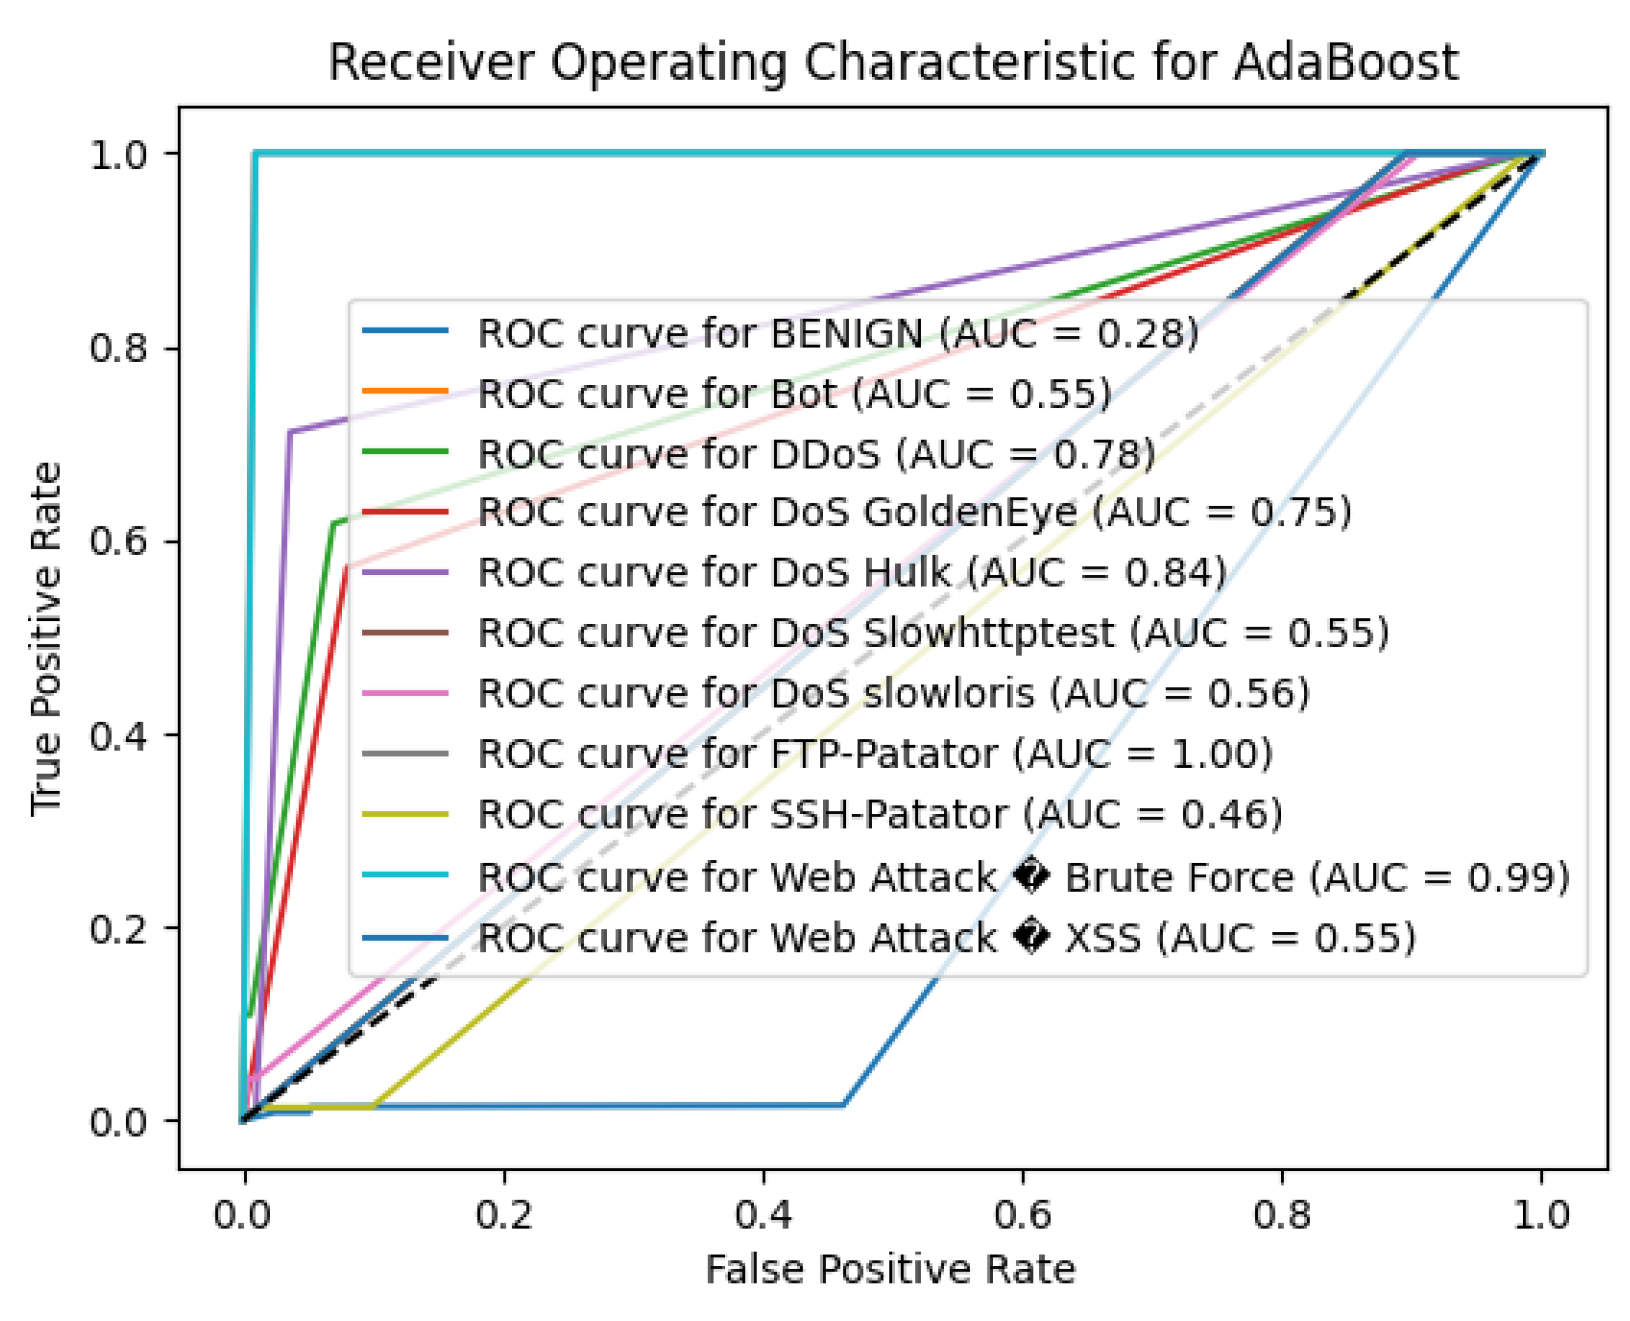
5.8. Performance of AB
The AdaBoost algorithm achieved an overall accuracy of 85.98% on the CICIDS2017 dataset, which is significantly lower compared to the other algorithms evaluated. While the model performed exceptionally well on the BENIGN class, it struggled considerably with detecting the majority of attack classes.
For the BENIGN class, AdaBoost attained a precision of 0.88, recall of 1.00, and an F1-score of 0.93. This indicates that the model correctly identified all benign instances but also misclassified a substantial number of attack instances as benign, as reflected by the precision being less than 1.00.
However, the model’s performance on attack classes was notably poor. For several attack types—including Bot, DDoS, DoS GoldenEye, DoS Slowhttptest, DoS slowloris, FTP-Patator, PortScan, SSH-Patator, Web Attack – Brute Force, and Web Attack – XSS—the precision, recall, and F1-scores were all 0.00. This indicates that the model failed to correctly identify any instances of these attack types, likely misclassifying them as benign.
Table 9.
AdaBoost Classification Report on CICIDS2017 Dataset (Numeric Labels).
| Class (Numeric) | Precision | Recall | F1-Score | Support |
|---|---|---|---|---|
| 0 | 0.88 | 1.00 | 0.93 | 9,066 |
| 1 | 0.00 | 0.00 | 0.00 | 8 |
| 2 | 0.00 | 0.00 | 0.00 | 467 |
| 3 | 0.00 | 0.00 | 0.00 | 42 |
| 4 | 0.67 | 0.71 | 0.69 | 939 |
| 5 | 0.00 | 0.00 | 0.00 | 30 |
| 6 | 0.00 | 0.00 | 0.00 | 23 |
| 7 | 0.00 | 0.00 | 0.00 | 28 |
| 8 | 0.00 | 0.00 | 0.00 | 672 |
| 9 | 0.00 | 0.00 | 0.00 | 18 |
| 10 | 0.00 | 0.00 | 0.00 | 10 |
| 11 | 0.00 | 0.00 | 0.00 | 4 |
| Accuracy | 0.86 | 11,307 | ||
| Macro Avg | 0.13 | 0.14 | 0.14 | 11,307 |
| Weighted Avg | 0.76 | 0.86 | 0.81 | 11,307 |
The only attack class with non-zero performance metrics was DoS Hulk, where the model achieved a precision of 0.67, recall of 0.71, and an F1-score of 0.69. While these metrics are moderate, they are still inadequate for reliable intrusion detection.
The macro-average precision, recall, and F1-score were 0.13, 0.14, and 0.14, respectively, reflecting the average performance across all classes and highlighting the model’s inadequacy in detecting attack types. The weighted-average precision was 0.76, recall was 0.86, and F1-score was 0.81, heavily influenced by the model’s performance on the BENIGN class, which dominates the dataset.
Consequently, the findings of this work indicate that the AdaBoost approach in its current setup is not optimally suitable for the multi-class intrusion detection on the CICIDS2017 dataset. The failure by the model to classify most of the attack classes highlights the problem of class imbalance and the weakness of the weak learners used in AdaBoost, for this complex task. Nonetheless, the client has done a very good work in developing the model, and in order to increase the model performance, the following recommendations must be adopted; First, there is a problem with the class imbalanced and must be addressed.
As we previously indicated resampling (oversampling of minority classes or undersampling of the majority class), modification of class weights, or utilization of more elaborate base estimators with the capacity to identify intricate patterns might improve the model’s capacity to identify attacks. Besides, more significant adjustments of the parameters and the use of more discriminative features may enhance the impact of AdaBoost for the detection of intrusions.
Figure 9.
GB ROC curve.
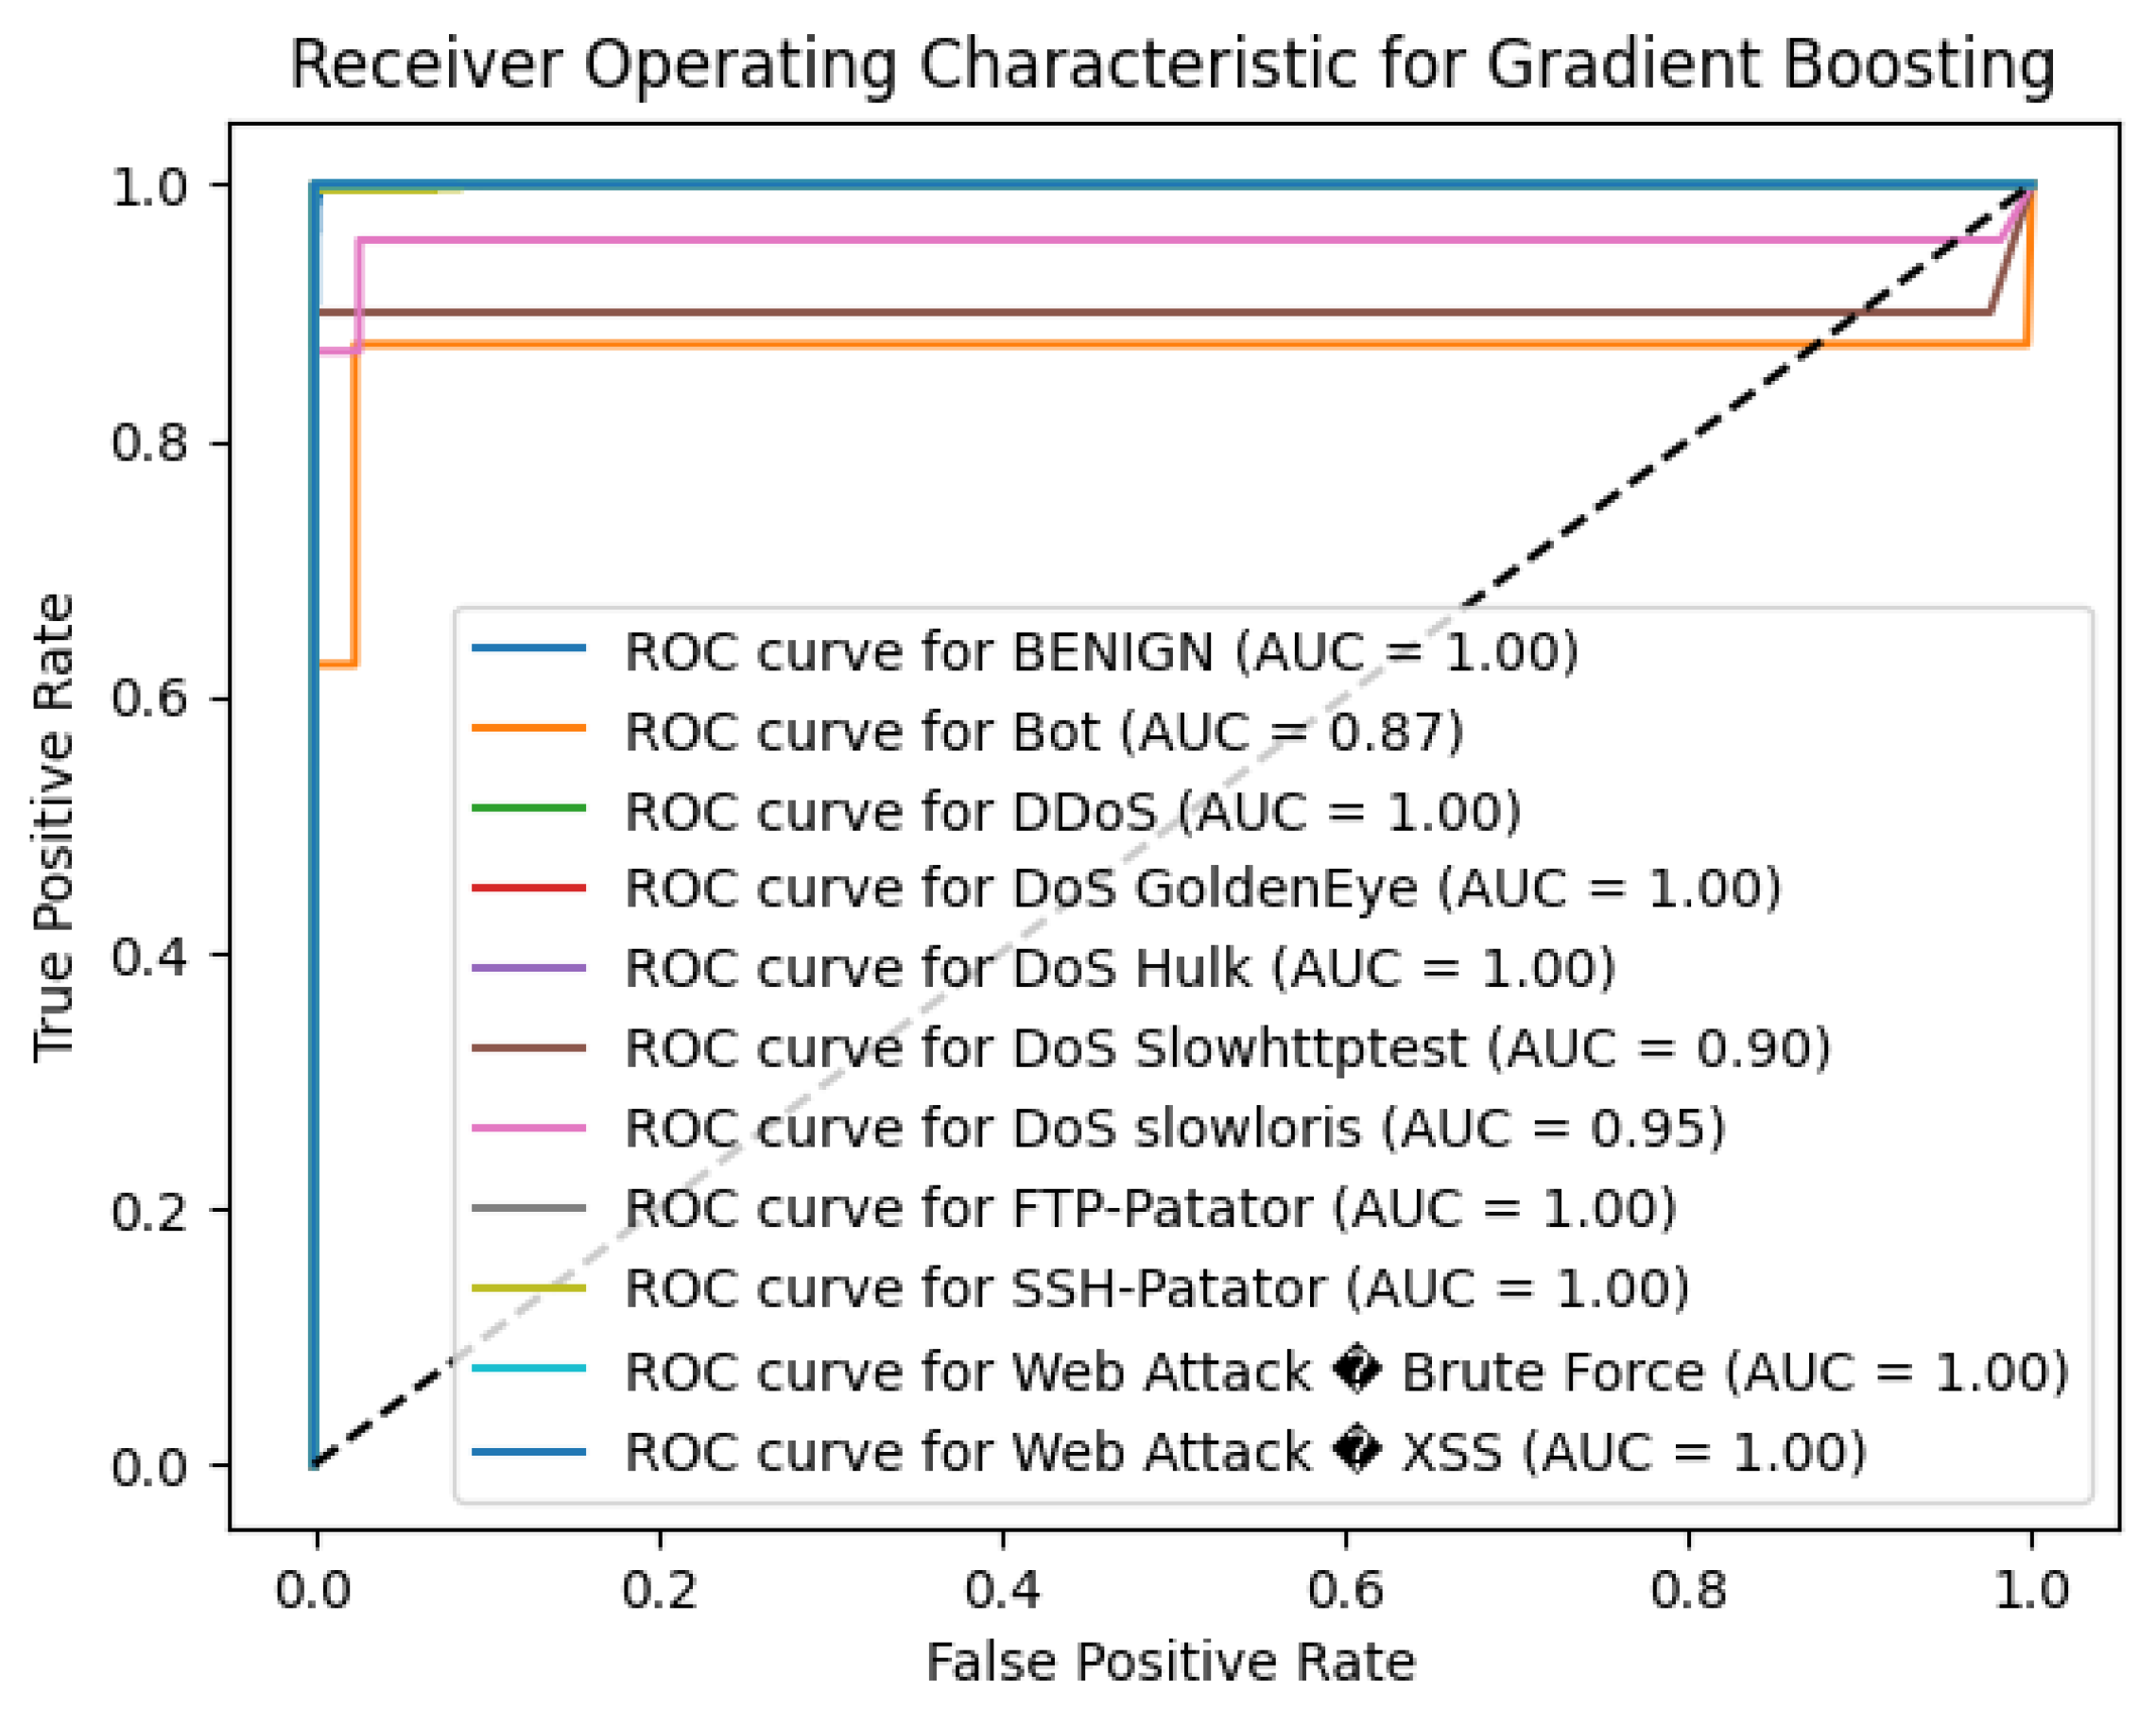
5.9. Performance of GB
The Gradient Boosting (GB) algorithm shows an excellent result on the benchmark, the CICIDS2017 dataset with an accuracy of 99.69%. This high accuracy prescribes a higher understanding of the model in differentiating between benign traffic and different attack types, this ability of the model is supported by the use of ensemble learning to enhance the classification outcome.
Table 10.
Gradient Boosting Classification Report on CICIDS2017 Dataset (Numeric Labels).
| Class (Numeric) | Precision | Recall | F1-Score | Support |
|---|---|---|---|---|
| 0 | 1.00 | 1.00 | 1.00 | 9,066 |
| 1 | 0.60 | 0.38 | 0.46 | 8 |
| 2 | 1.00 | 1.00 | 1.00 | 467 |
| 3 | 0.98 | 0.95 | 0.96 | 42 |
| 4 | 0.99 | 1.00 | 1.00 | 939 |
| 5 | 0.96 | 0.87 | 0.91 | 30 |
| 6 | 0.91 | 0.87 | 0.89 | 23 |
| 7 | 1.00 | 1.00 | 1.00 | 28 |
| 8 | 1.00 | 1.00 | 1.00 | 672 |
| 9 | 1.00 | 1.00 | 1.00 | 18 |
| 10 | 0.67 | 1.00 | 0.80 | 10 |
| 11 | 0.00 | 0.00 | 0.00 | 4 |
| Accuracy | 0.997 | 11,307 | ||
| Macro Avg | 0.84 | 0.84 | 0.83 | 11,307 |
| Weighted Avg | 1.00 | 1.00 | 1.00 | 11,307 |
For the BENIGN class the GB model got the best score of 1 in all three parameters, that is precision, recall and F1-score showing that the model is capable of identifying normal traffic on the network without any errors. The model also performed well in identifying several attack types with perfect precision, recall, and F1-scores of the order of 1.00 for classes including DDoS, FTP-Patator, PortScan and SSH-Patator. This goes further to show exactly how resilient the model is in correctly identifying these prevalent threats.
The GB algorithm provided promising results on attacking DoS Hulk, with accuracy of 0.99, recall of 1, and F1 score of 1, which indicates its high reliability in identifying this kind of attack. For DoS GoldenEye, DoS Slowhttptest, and DoS slowloris, the model had high F1-scores of 0.96, 0.91, and 0.89 respectively which makes it highly effective for detecting these attack types with very minimal compromise on the F1 scores as observed in the other classes.
However, the model faced challenges with minority classes that have very few instances. For the Bot class, which had only 8 instances, the precision was 0.60, recall was 0.38, and F1-score was 0.46. This suggests difficulty in accurately identifying botnet activities due to the limited number of samples, leading to a higher rate of false positives and false negatives in this category. The detection performance for Web Attack – Brute Force was moderate, with a precision of 0.67, recall of 1.00, and F1-score of 0.80, indicating that while the model correctly identified all instances of this attack (high recall), there were some false positives (precision less than 1.00).
The Web Attack – XSS class had precision, recall, and F1-score all at 0.00, reflecting the model’s inability to detect any instances of this attack type. This could be attributed to the minimal number of samples (support = 4), making it challenging for the model to learn distinguishing features for this class.
Table 11.
XGBoost Classification Report on CICIDS2017 Dataset (Numeric Labels).
| Class (Numeric) | Precision | Recall | F1-Score | Support |
|---|---|---|---|---|
| 0 | 1.00 | 1.00 | 1.00 | 9,066 |
| 1 | 0.75 | 0.75 | 0.75 | 8 |
| 2 | 1.00 | 1.00 | 1.00 | 467 |
| 3 | 1.00 | 1.00 | 1.00 | 42 |
| 4 | 1.00 | 1.00 | 1.00 | 939 |
| 5 | 1.00 | 0.97 | 0.98 | 30 |
| 6 | 1.00 | 1.00 | 1.00 | 23 |
| 7 | 1.00 | 1.00 | 1.00 | 28 |
| 8 | 1.00 | 0.99 | 0.99 | 672 |
| 9 | 1.00 | 1.00 | 1.00 | 18 |
| 10 | 0.78 | 0.70 | 0.74 | 10 |
| 11 | 0.40 | 0.50 | 0.44 | 4 |
| Accuracy | 1.00 | 11,307 | ||
| Macro Avg | 0.91 | 0.91 | 0.91 | 11,307 |
| Weighted Avg | 1.00 | 1.00 | 1.00 | 11,307 |
The macro-average precision, recall, and F1-score were 0.84, 0.84, and 0.83, respectively, reflecting the average performance across all classes without considering class imbalance. The weighted-average precision, recall, and F1-score were all 1.00, highlighting the model’s exceptional overall performance when accounting for class prevalence.
Consequently, the Gradient Boosting algorithm was highly effective in identifying most of the attack types in the CICIDS2017 set. Because it can actually score nearly a hundred percent on most of the classes, it is suitable for intrusion detection systems. To improve the accuracy of identifying less prevalent attack types in future work, oversampling of the minority classes, changing the class weights, or including more features could be implemented to improve the generality of the detection model. Changing the values of hyper- parameters of the GB model may also contribute to improving the recognition of the patterns associated with rare attack classes.
5.10. Performance of XGBoost
In this work, the XGBoost algorithm has shown very high accuracy with 99.84% on the average for the CICIDS2017 dataset. This high accuracy signals the model’s stability in differentiating normal traffic from different types of attacks while using gradient boosting to improve the classification outcomes.
XGBoost model classified all the network traffic of BENIGN class accurately, with precision, recall, and F1-score values of 1.00 without misclassification. The specific classes in which the model was perfectly precise, recall and F1-scores of 1.00 were DDoS, DoS GoldenEye, DoS Hulk, DoS slowloris, FTP-Patator, and SSH-Patator. This goes to affirm the efficiency of the model in detecting these commonplace risks as mentioned earlier in the paper.
The DoS Slowhttptest class had a slightly lower recall of 0.97 and therefore F-measure of 0.98 that still indicates good detection abilities. PortScan class was accurate as it had precision of 1.00 Recal of 0.99 and F1-score of 0.99, therefore it has high reliability to detect port scan activities.
In the case of the smallest classes, the number of which is significantly less than the number of the other classes, for instance, Bot and Web Attack types, the XGBoost model outperformed other models. The Bot class received the accuracy of 0.75, which means the model distinguished the instances of this class in most cases. In the case of Web Attack – Brute Force the model received a precision of 0.78, recall of 0.70, and F1-score of 0.74, which can be considered reasonable. The Web Attack – XSS class achieved slightly worse results with having 0.40 precision, 0.50 recall, and F1-score of 0.44, which indicates the some challenge in the detection of this type of attack due to its rare occurrence (support = 4). The macro-average precision, recall, and F1-score were all 0.91, reflecting balanced performance across all classes without considering class imbalance. The weighted-average precision, recall, and F1-score were all 1.00, highlighting the model’s exceptional overall performance when accounting for class prevalence.
To in sum, the XGBoost algorithm showed a high level of effectiveness for the detection of both, frequent and some less frequent types of attacks present in the CICIDS2017 data set. That lets it rate near perfect on most classes making it a great candidate to use in intrusions detection systems. To improve the detection of underrepresented attack types, future work may include oversampling minor classes or increasing the corresponding class weight or fine tuning the model hyperparameters.
6. Comparison
The evaluation of various machine learning algorithms on the CICIDS2017 dataset provides comprehensive insights into their effectiveness for intrusion detection tasks. The algorithms tested include K-Nearest Neighbors (K-NN), Artificial Neural Network (ANN), Naive Bayes (NB), Decision Tree (DT), Random Forest (RF), Support Vector Machine (SVM), Logistic Regression (LR), AdaBoost (AB), Gradient Boosting (GB), and XGBoost. Their performance is assessed based on overall accuracy, macro-average precision, recall, F1-score, and their ability to detect minority attack classes.
Random Forest, XGBoost, and Gradient Boosting composed a distinctive ensemble were identified as the most effective in overall accuracy rates that proved to be over 99%. From the results above, XGBoost had the best accuracy of 99.84% which shows that outperforms the other algorithms in classifying between benign and malicious network traffic. All these algorithms were able to handle the patterns within the dataset thus being able to accommodate for the characteristics of the majority and the minor class.
Figure 10.
XGBoost ROC curve.
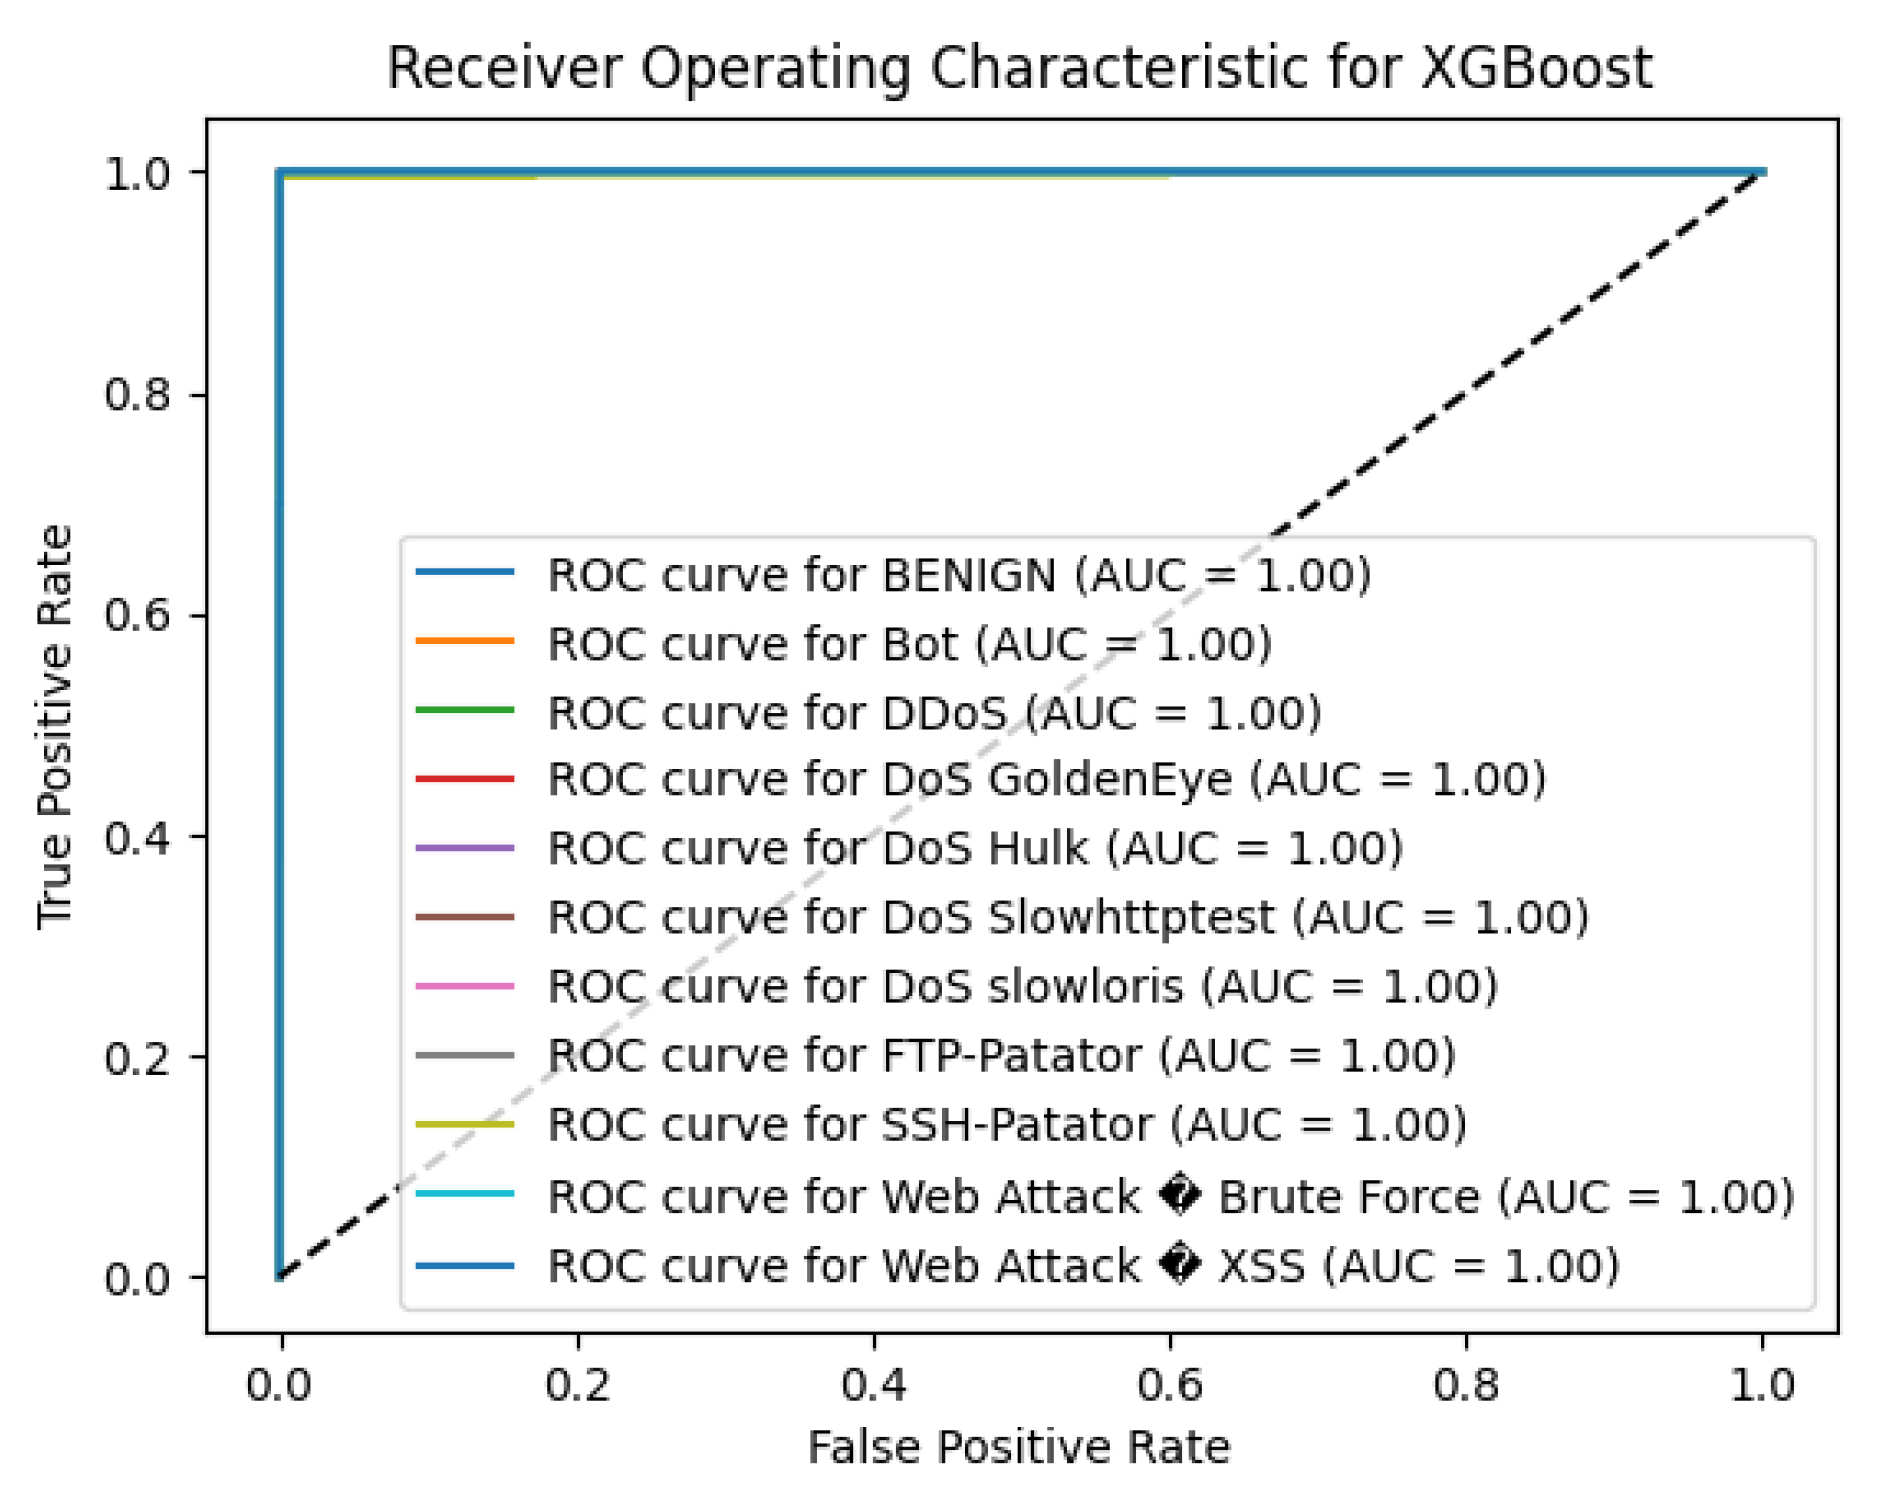
Figure 11.
Overall Accuracy Comparison of Algorithms on CICIDS2017 Dataset.
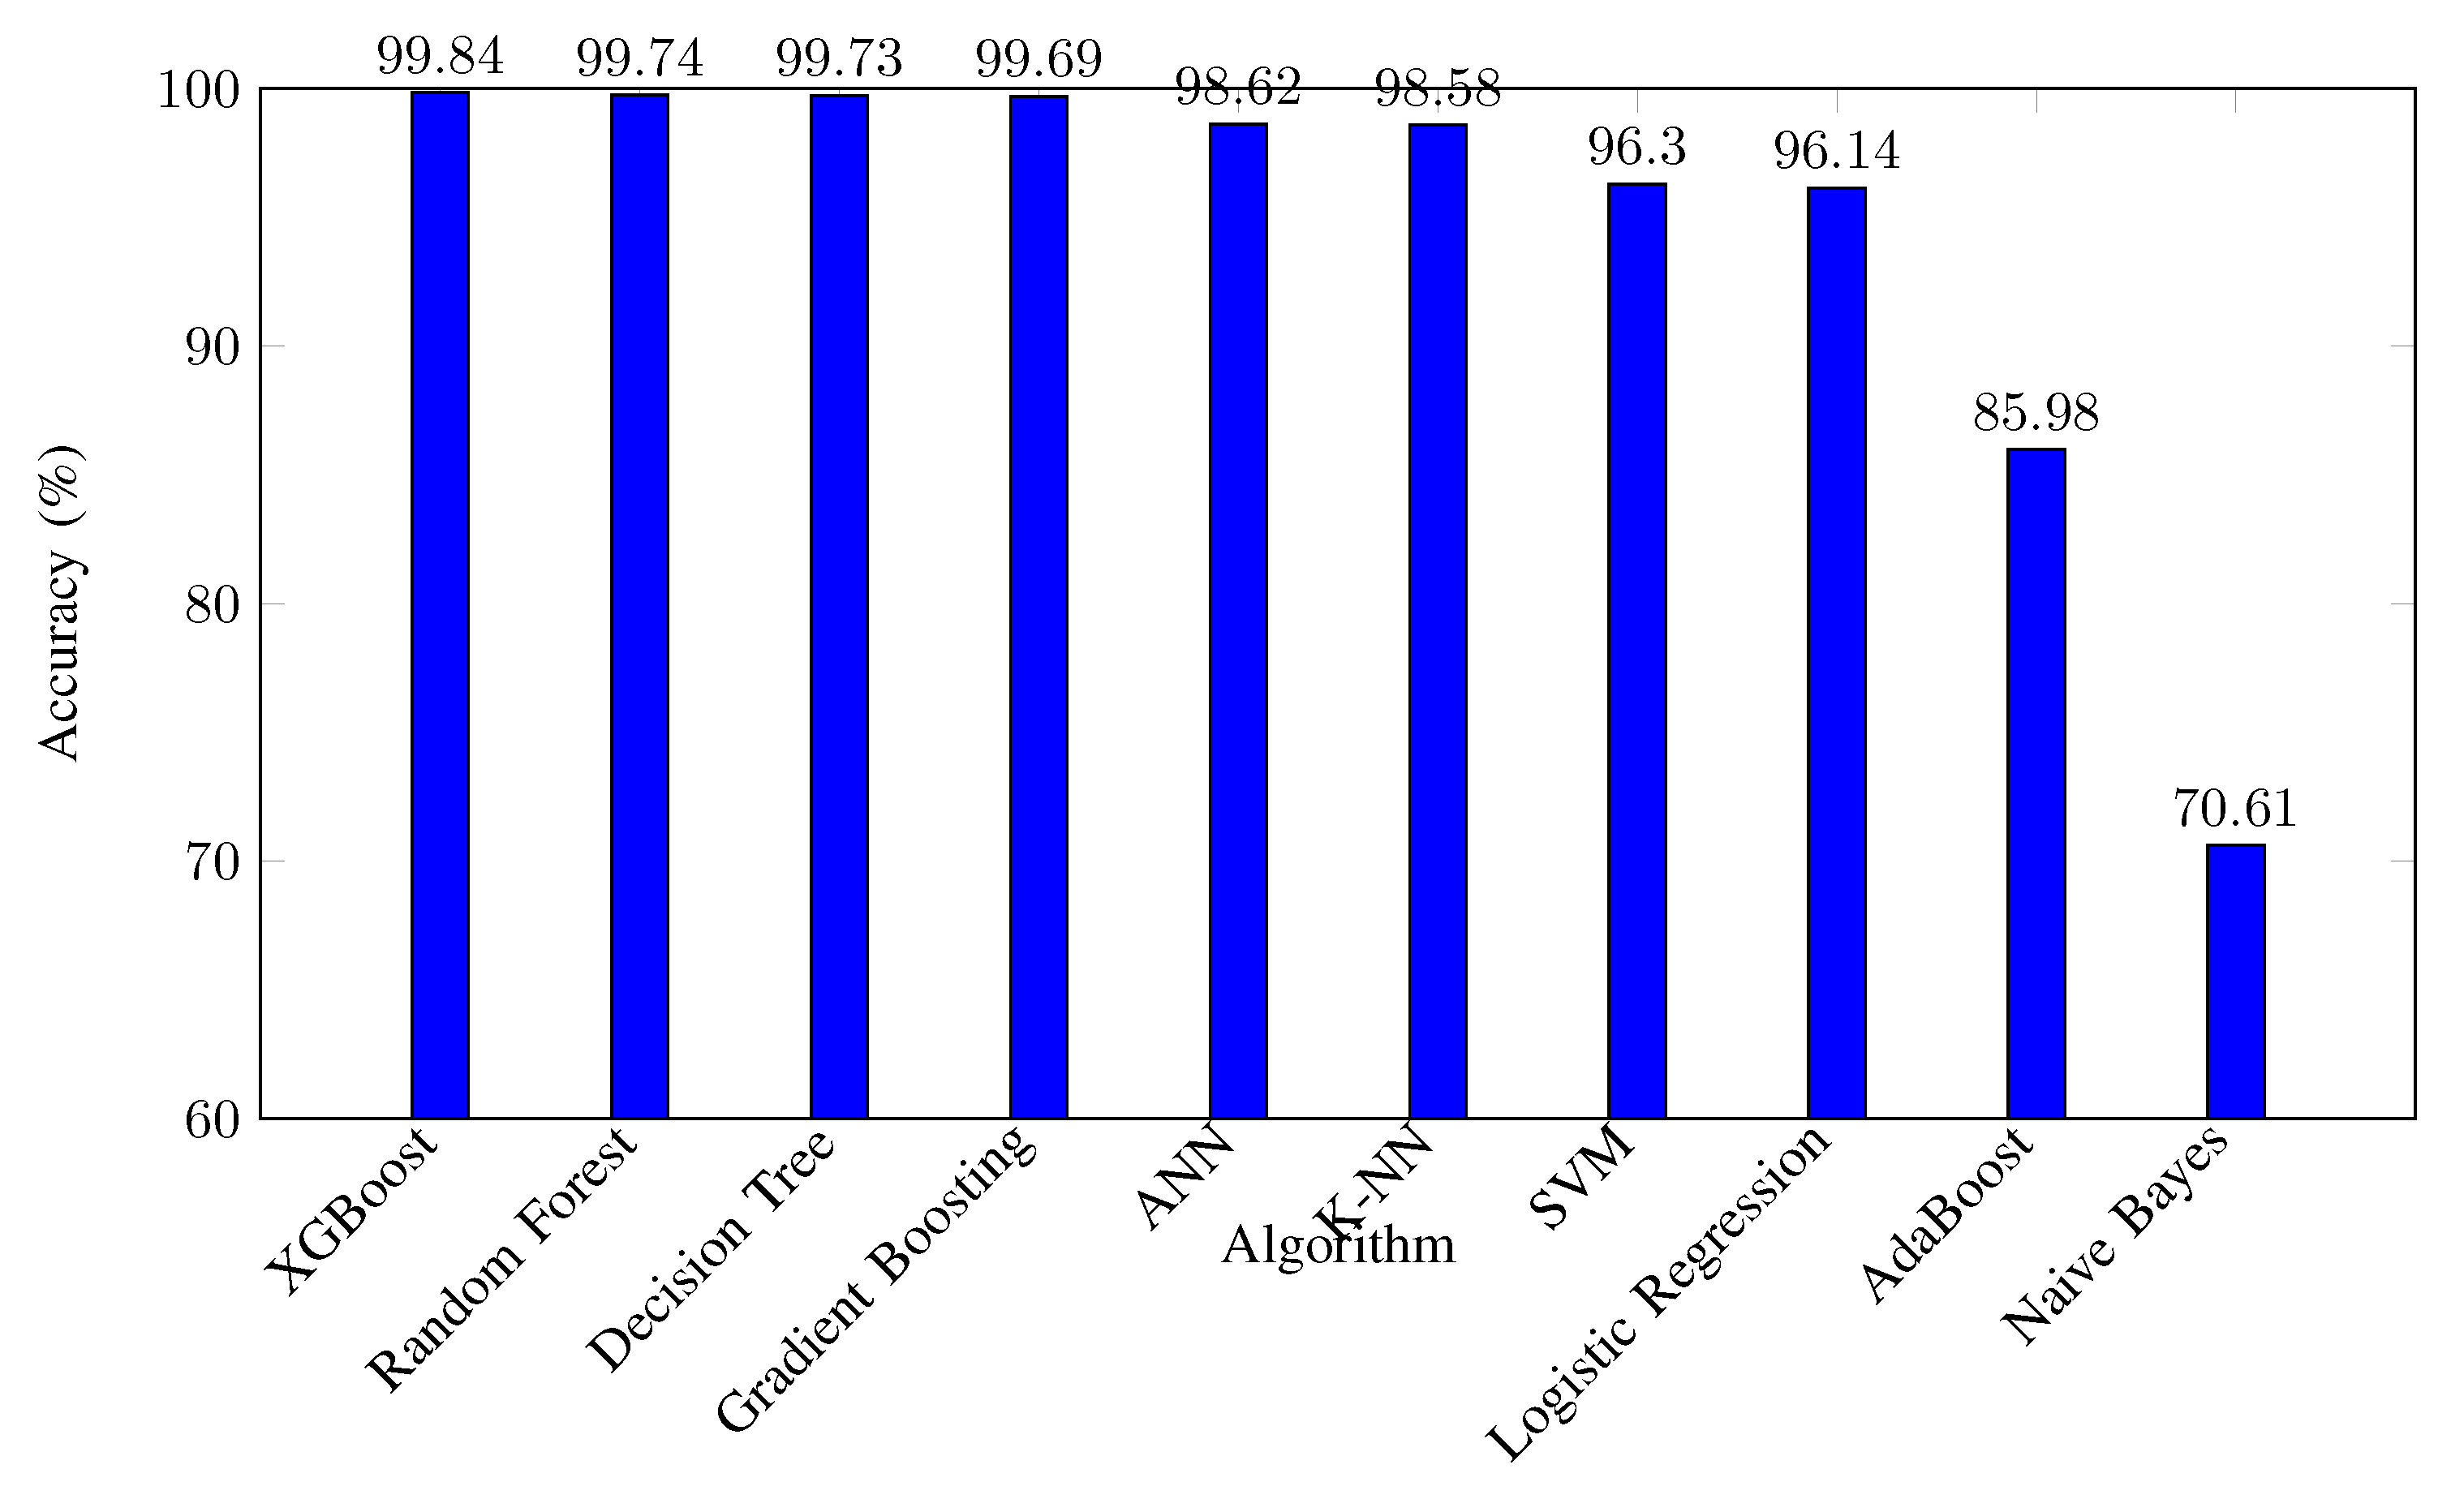
Both Artificial Neural Network and K-NN were also ranked high, with their accuracies sitting at 98.62% and 98.58% respectively. It marked relatively successful identification of attack flow classes and benign traffic while making underrepresented attack classes. For example, the ANN faced difficulties when learning the ”Web Attack – XSS” class, owing to sample samples, and thus obtained an F1-score of null.
Table 12.
Summary of Algorithm Performance on CICIDS2017 Dataset.
| Algorithm | Accuracy (%) | Macro Avg Precision | Macro Avg Recall | Macro Avg F1-Score |
|---|---|---|---|---|
| XGBoost | 99.84 | 0.91 | 0.91 | 0.91 |
| Random Forest | 99.74 | 0.87 | 0.83 | 0.85 |
| Decision Tree | 99.73 | 0.84 | 0.88 | 0.86 |
| Gradient Boosting | 99.69 | 0.84 | 0.84 | 0.83 |
| ANN | 98.62 | 0.84 | 0.80 | 0.80 |
| K-NN | 98.58 | 0.88 | 0.81 | 0.83 |
| SVM | 96.30 | 0.54 | 0.51 | 0.52 |
| Logistic Regression | 96.14 | 0.59 | 0.54 | 0.55 |
| AdaBoost | 85.98 | 0.13 | 0.14 | 0.14 |
| Naive Bayes | 70.61 | 0.47 | 0.80 | 0.51 |
Previous techniques for classification included Support Vector Machines and Logistic Regression both of which squarely got fair overall accuracies of 96.30% and 96.14% respectively. But they had smaller macro-average precision, recall rates, and F1 tests indicating problems in identifying minority classes of attacks. As highlighted in Table VI, the SVM had precision and recall values of 0.00 for some attack types including ”Bot” and ”Web Attack – Brute Force” owing to missed interpretation of such attacks.
The worst result was obtained by Naive Bayes with 70.61% of accuracy followed by AdaBoost with 85.98% of accuracy. Naive Bayes struggled with the majority class, achieving a recall of only 0.66 for the "BENIGN" class, leading to a high false alarm rate. AdaBoost showed poor detection of attack classes, failing to correctly identify instances of most attack types, which indicates a strong bias towards the majority class due to class imbalance.
The ability to detect minority attack classes is crucial for an intrusion detection system’s effectiveness. Ensemble methods like XGBoost and Gradient Boosting not only achieved high overall accuracy but also demonstrated improved performance on minority classes. XGBoost, for example, achieved an F1-score of 0.75 for the "Bot" class and 0.74 for "Web Attack – Brute Force," which is significant given the small number of instances for these classes.
In contrast, algorithms like Random Forest and Decision Tree, while achieving high overall accuracies, showed limitations in detecting certain minority classes. Random Forest had an F1-score of 0.33 for the "Bot" class and 0.25 for "Web Attack – XSS," indicating that even high-accuracy models can struggle with underrepresented attack types without proper handling of class imbalance.
To provide a comprehensive overview, Table 12 summarizes the key performance metrics for each algorithm. The table also provides four metrics: overall accuracy, macro-average precision, macro-average recall, as well as macro-average F1-score because it permits for the direct comparison of the efficiency of the employed algorithms.
7. Conclusions
This research compared and assessed several machine learning techniques for intrusion detection systems based on the CICIDS2017 dataset. The evaluated algorithms used were: Artificial Neural Network (ANN), K-Nearest Neighbors (K-NN), Naive Bayes (NB), Random Forest (RF), Decision Tree (DT), Logistic Regression (LR), Support Vector Machine (SVM), Gradient Boosting (GB), AdaBoost (AB), and XGBoost. Originally, the goal of the experiments was to assess which algorithm allows identifying network intrusions with high accuracy of minority attack classes and accurate rate of majority attack classes.
The results showed that ensemble methods, particularly XGBoost, Random Forest and Gradient Boosting, achieved significantly higher over- all accuracy and better detection of the minority attack classes than conventional machine learning algorithms. The overall accuracy of XGBoost model was 99.84% which proved its higher efficiency in the cases of complicated and unbalanced data set. The use of these ensemble algorithms provided a good ability for learning complex such patterns in the network traffic data and hence achieved high detection rate for both the frequently occurred and low incidence of attacks.
Artificial Neural Network and K-NN also exhibited strong performance, with overall accuracies of 98.62% and 98.58%, respectively. While these algorithms effectively detected the majority of attack classes, they faced challenges in identifying certain minority classes, such as "Web Attack – XSS" and "Bot." This highlights the need for strategies to address class imbalance and improve model generalization to enhance detection rates for underrepresented attack types.
Traditional algorithms like SVM and Logistic Regression achieved good overall accuracies of 96.30% and 96.14%, respectively. However, they struggled significantly with minority attack classes, as evidenced by low macro-average precision, recall, and F1-scores. Their inability to detect several critical attack types suggests limitations in capturing the nuanced patterns associated with these classes, which is a critical concern for robust intrusion detection systems.
Naive Bayes and AdaBoost underperformed relative to the other algorithms, with overall accuracies of 70.61% and 85.98%, respectively. These algorithms showed poor detection capabilities for both majority and minority classes, indicating they may not be suitable for intrusion detection tasks involving complex and imbalanced datasets like CICIDS2017 without significant modifications or enhancements.
The comparative analysis also draws attention to the appropriate selection of the algorithm and the application of machine learning techniques for handling the issue of class imbalance to IDS. Ensemble methods, particularly XGBoost and Random Forest, emerged as the most effective algorithms, offering high accuracy and better detection rates for both majority and minority classes. Their ability to combine multiple weak learners contributes to their robustness and superior performance.
For practical deployment, it is crucial to consider not only overall accuracy but also the ability to detect a wide range of attack types, including those that are less frequent but potentially more damaging. Addressing class imbalance through techniques such as oversampling minority classes, undersampling the majority class, or applying synthetic data generation methods (e.g., SMOTE) can enhance the models’ ability to detect underrepresented attack types. Additionally, feature engineering and selection can improve the discriminatory power of the models by focusing on the most informative attributes.
Hyperparameter tuning is another critical factor that can significantly impact model performance. Fine-tuning parameters for algorithms like ANN and K-NN may improve their ability to generalize across all attack types, particularly for minority classes. Adjusting network architectures, learning rates, and other hyperparameters can lead to better detection rates and overall model effectiveness.
In conclusion, this study provides valuable insights into the performance of various machine learning algorithms for intrusion detection on the CICIDS2017 dataset. The findings highlight the efficacy of ensemble methods, especially XGBoost and Random Forest, in handling complex and imbalanced datasets. These algorithms demonstrated superior performance in both overall accuracy and the detection of minority attack classes, making them strong candidates for practical intrusion detection systems.
Future work should focus on exploring advanced techniques to enhance detection rates for underrepresented attack types further. This may include integrating deep learning architectures, developing hybrid models that combine the strengths of multiple algorithms, and implementing real-time intrusion detection systems capable of adapting to evolving network threats. Additionally, continuously updating the models with new data and attack patterns will be essential to maintain their effectiveness in the face of increasingly sophisticated cyber threats.
The study emphasizes the importance of a holistic approach in intrusion detection, where robust detection capabilities across all attack classes complement high overall accuracy. By addressing the challenges identified and building on the strengths of the top-performing algorithms, it is possible to develop intrusion detection systems that provide comprehensive protection against a wide array of network attacks.
References
- Sharafaldin, I.; Lashkari, A.H.; Ghorbani, A.A. Toward Generating a New Intrusion Detection Dataset and Intrusion Traffic Characterization. Proceedings of the 4th International Conference on Information Systems Security and Privacy. SCITEPRESS - Science and Technology Publications, 2018, Vol. 2018-January, pp. 108–116. [CrossRef]
- Alsharif, N.A.; Mishra, S.; Alshehri, M. IDS in IoT using Machine Learning and Blockchain. Engineering, Technology and Applied Science Research 2023, 13, 11197–11203. [CrossRef]
- Elmrabit, N.; Zhou, F.; Li, F.; Zhou, H. Evaluation of Machine Learning Algorithms for Anomaly Detection. 2020 International Conference on Cyber Security and Protection of Digital Services (Cyber Security). IEEE, 2020, pp. 1–8. [CrossRef]
- Alhayali, R.A.; Aljanabi, M.; Ali, A.H.; Mohammed, M.A.; Sutikno, T. Optimized machine learning algorithm for intrusion detection. Indonesian Journal of Electrical Engineering and Computer Science 2021, 24, 590–599. [CrossRef]
- Halbouni, A.; Gunawan, T.S.; Habaebi, M.H.; Halbouni, M.; Kartiwi, M.; Ahmad, R. Machine Learning and Deep Learning Approaches for CyberSecurity: A Review, 2022. [CrossRef]
- Chindove, H.; Brown, D. Adaptive Machine Learning Based Network Intrusion Detection. Proceedings of the International Conference on Artificial Intelligence and its Applications. ACM, 2021, pp. 1–6. [CrossRef]
- Latif, S.; Dola, F.F.; Afsar, M.M.; Esha, I.J.; Nandi, D. Investigation of Machine Learning Algorithms for Network Intrusion Detection. International Journal of Information Engineering and Electronic Business 2022, 14, 1–22. [CrossRef]
- Logeswari, G.; Bose, S.; Anitha, T. An Intrusion Detection System for SDN Using Machine Learning. Intelligent Automation and Soft Computing 2023, 35, 867–880. [CrossRef]
- Hidayat, I.; Ali, M.Z.; Arshad, A. Machine Learning-Based Intrusion Detection System: An Experimental Comparison. Journal of Computational and Cognitive Engineering 2023, 2, 88–97. [CrossRef]
- Amanoul, S.V.; Abdulazeez, A.M. Intrusion Detection System Based on Machine Learning Algorithms: A Review. 2022 IEEE 18th International Colloquium on Signal Processing and Applications, CSPA 2022 - Proceeding. Institute of Electrical and Electronics Engineers Inc., 2022, pp. 79–84. [CrossRef]
- Singh, A.P.; Kumar, S.; Kumar, A.; Usama, M. Machine Learning based Intrusion Detection System for Minority Attacks Classification. Proceedings of International Conference on Computational Intelligence and Sustainable Engineering Solution, CISES 2022. Institute of Electrical and Electronics Engineers Inc., 2022, pp. 256–261. [CrossRef]
- Kurniabudi.; Stiawan, D.; Darmawijoyo.; Idris, M.Y.B.B.; Bamhdi, A.M.; Budiarto, R. CICIDS-2017 Dataset Feature Analysis with Information Gain for Anomaly Detection. IEEE Access 2020, 8, 132911–132921. [CrossRef]
- Abdallah, E.E.; Eleisah, W.; Otoom, A.F. Intrusion Detection Systems using Supervised Machine Learning Techniques: A survey. Procedia Computer Science. Elsevier B.V., 2022, Vol. 201, pp. 205–212. [CrossRef]
- Pelletier, Z.; Abualkibash, M. Evaluating the CIC IDS-2017 Dataset Using Machine Learning Methods and Creating Multiple Predictive Models in the Statistical Computing Language R. International Research Journal of Advanced Engineering and Science 2020, 5, 187–191.
- Yulianto, A.; Sukarno, P.; Suwastika, N.A. Improving AdaBoost-based Intrusion Detection System (IDS) Performance on CIC IDS 2017 Dataset. Journal of Physics: Conference Series. Institute of Physics Publishing, 2019, Vol. 1192. [CrossRef]
- Arafah, M.; Phillips, I.; Adnane, A.; Hadi, W.; Alauthman, M.; Al-Banna, A.K. Anomaly-based network intrusion detection using denoising autoencoder and Wasserstein GAN synthetic attacks. Applied Soft Computing 2024, 168, 112455. [CrossRef]
- Yang, L.; Shami, A. IDS-ML: An open source code for Intrusion Detection System development using Machine Learning[Formula presented]. Software Impacts 2022, 14. [CrossRef]
- Musleh, D.; Alotaibi, M.; Alhaidari, F.; Rahman, A.; Mohammad, R.M. Intrusion Detection System Using Feature Extraction with Machine Learning Algorithms in IoT. Journal of Sensor and Actuator Networks 2023, 12. [CrossRef]
- Bajpai, S.; Sharma, K.; Chaurasia, B.K. A Hybrid Meta-heuristics Algorithm: XGBoost-Based Approach for IDS in IoT. SN Computer Science 2024, 5. [CrossRef]
- Choobdar, P.; Naderan, M.; Naderan, M. Detection and Multi-Class Classification of Intrusion in Software Defined Networks Using Stacked Auto-Encoders and CICIDS2017 Dataset. Wireless Personal Communications 2022, 123, 437–471. [CrossRef]
- Jabbar, A.F.; Mohammed, I.J. Development of an Optimized Botnet Detection Framework based on Filters of Features and Machine Learning Classifiers using CICIDS2017 Dataset. IOP Conference Series: Materials Science and Engineering 2020, 928, 032027. [CrossRef]
- Jairu, P.; Mailewa, A.B. Network Anomaly Uncovering on CICIDS-2017 Dataset: A Supervised Artificial Intelligence Approach. 2022 IEEE International Conference on Electro Information Technology (eIT). IEEE, 2022, Vol. 2022-May, pp. 606–615. [CrossRef]
- Kariri, E.; Louati, H.; Louati, A.; Masmoudi, F. Exploring the Advancements and Future Research Directions of Artificial Neural Networks: A Text Mining Approach. Applied Sciences 2023, 13, 3186. [CrossRef]
- Maseer, Z.K.; Yusof, R.; Bahaman, N.; Mostafa, S.A.; Foozy, C.F.M. Benchmarking of Machine Learning for Anomaly Based Intrusion Detection Systems in the CICIDS2017 Dataset. IEEE Access 2021, 9, 22351–22370. [CrossRef]
- Halder, R.K.; Uddin, M.N.; Uddin, M.A.; Aryal, S.; Khraisat, A. Enhancing K-nearest neighbor algorithm: a comprehensive review and performance analysis of modifications. Journal of Big Data 2024, 11, 113. [CrossRef]
- Mohy-eddine, M.; Guezzaz, A.; Benkirane, S.; Azrour, M. An efficient network intrusion detection model for IoT security using K-NN classifier and feature selection. Multimedia Tools and Applications 2023, 82, 23615–23633. [CrossRef]
- Vishwakarma, M.; Kesswani, N. A new two-phase intrusion detection system with Naïve Bayes machine learning for data classification and elliptic envelop method for anomaly detection. Decision Analytics Journal 2023, 7. [CrossRef]
- Liu, X.Q.; Wang, X.C.; Tao, L.; An, F.X.; Jiang, G.R. Alleviating conditional independence assumption of naive Bayes. Statistical Papers 2024, 65, 2835–2863. [CrossRef]
- Gan, S.; Shao, S.; Chen, L.; Yu, L.; Jiang, L. Adapting hidden naive bayes for text classification. Mathematics 2021, 9. [CrossRef]
- Costa, V.G.; Pedreira, C.E. Recent advances in decision trees: an updated survey. Artificial Intelligence Review 2023, 56, 4765–4800. [CrossRef]
- Amro, A.; Al-Akhras, M.; Hindi, K.E.; Habib, M.; Shawar, B.A. Instance Reduction for Avoiding Overfitting in Decision Trees. Journal of Intelligent Systems 2021, 30, 438–459. [CrossRef]
- Iranzad, R.; Liu, X. A review of random forest-based feature selection methods for data science education and applications. International Journal of Data Science and Analytics 2024. [CrossRef]
- Farsi, A.A.; Khan, A.; Bait-Suwailam, M.M. A Practical Evaluation of Intrusion Detection in IoT Networks Using Random Forest and Network Intrusion Detection Dataset. 2nd International Conference on Computing and Data Analytics (ICCDA- 2024), 2024.
- Li, Y.; Xia, J.; Zhang, S.; Yan, J.; Ai, X.; Dai, K. An efficient intrusion detection system based on support vector machines and gradually feature removal method. Expert Systems with Applications 2012, 39, 424–430. [CrossRef]
- Krebs, R.; Bagui, S.S.; Mink, D.; Bagui, S.C. Applying Multi-CLASS Support Vector Machines: One-vs.-One vs. One-vs.-All on the UWF-ZeekDataFall22 Dataset. Electronics (Switzerland) 2024, 13. [CrossRef]
- Gupta, N.; Jindal, V.; Bedi, P. LIO-IDS: Handling class imbalance using LSTM and improved one-vs-one technique in intrusion detection system. Computer Networks 2021, 192. [CrossRef]
- Cornilly, D.; Tubex, L.; Aelst, S.V.; Verdonck, T. Robust and sparse logistic regression. Advances in Data Analysis and Classification 2023. [CrossRef]
- Besharati, E.; Naderan, M.; Namjoo, E. LR-HIDS: logistic regression host-based intrusion detection system for cloud environments. Journal of Ambient Intelligence and Humanized Computing 2019, 10, 3669–3692. [CrossRef]
- Ding, Y.; Zhu, H.; Chen, R.; Li, R. An Efficient AdaBoost Algorithm with the Multiple Thresholds Classification. Applied Sciences (Switzerland) 2022, 12. [CrossRef]
- He, Z.; Lin, D.; Lau, T.; Wu, M. Gradient Boosting Machine: A Survey 2019.
- Abdulganiyu, O.H.; Tchakoucht, T.A.; Saheed, Y.K.; Ahmed, H.A. XIDINTFL-VAE: XGBoost-based intrusion detection of imbalance network traffic via class-wise focal loss variational autoencoder. The Journal of Supercomputing 2025, 81, 16. [CrossRef]
Table 1.
Mapping of Attack Labels to Numeric Values.
| Numeric Value | Attack Label |
|---|---|
| 0 | BENIGN |
| 1 | Bot |
| 2 | DDoS |
| 3 | DoS GoldenEye |
| 4 | DoS Hulk |
| 5 | DoS Slowhttptest |
| 6 | DoS slowloris |
| 7 | FTP-Patator |
| 8 | PortScan |
| 9 | SSH-Patator |
| 10 | Web Attack - Brute Force |
| 11 | Web Attack - XSS |
Table 2.
ANN Classification Report on CICIDS2017 Dataset (Numeric Labels).
| Class (Numeric) | Precision | Recall | F1-Score | Support |
|---|---|---|---|---|
| 0 | 1.00 | 0.99 | 0.99 | 9,066 |
| 1 | 0.80 | 0.50 | 0.62 | 8 |
| 2 | 1.00 | 1.00 | 1.00 | 467 |
| 3 | 0.93 | 0.98 | 0.95 | 42 |
| 4 | 0.98 | 0.98 | 0.98 | 939 |
| 5 | 0.81 | 1.00 | 0.90 | 30 |
| 6 | 1.00 | 1.00 | 1.00 | 23 |
| 7 | 1.00 | 1.00 | 1.00 | 28 |
| 8 | 0.89 | 0.98 | 0.94 | 672 |
| 9 | 1.00 | 0.94 | 0.97 | 18 |
| 10 | 0.67 | 0.20 | 0.31 | 10 |
| 11 | 0.00 | 0.00 | 0.00 | 4 |
| Accuracy | 0.99 | 11,307 | ||
| Macro Avg | 0.84 | 0.80 | 0.80 | 11,307 |
| Weighted Avg | 0.99 | 0.99 | 0.99 | 11,307 |
Disclaimer/Publisher’s Note: The statements, opinions and data contained in all publications are solely those of the individual author(s) and contributor(s) and not of MDPI and/or the editor(s). MDPI and/or the editor(s) disclaim responsibility for any injury to people or property resulting from any ideas, methods, instructions or products referred to in the content. |
© 2024 by the authors. Licensee MDPI, Basel, Switzerland. This article is an open access article distributed under the terms and conditions of the Creative Commons Attribution (CC BY) license (http://creativecommons.org/licenses/by/4.0/).
Copyright: This open access article is published under a Creative Commons CC BY 4.0 license, which permit the free download, distribution, and reuse, provided that the author and preprint are cited in any reuse.


