Submitted:
04 December 2024
Posted:
05 December 2024
You are already at the latest version
Abstract
This study aimed to examine the hydrogen sorption characteristics of a Li-Mg ribbon under 100 bar H2 using reactive milling, ex/in-situ X-ray diffraction (XRD), differential scanning calorimetry (DSC), and thermogravimetric analysis (TGA). Direct hydrogenation was achieved after 1 hour of milling, forming a powder containing LiH, MgH2 and Li-Mg phases. Hydrogenation of the as-received ribbon occurred within ~5 hours under 3 bar H2 at 200 ˚C. In-situ XRD confirmed MgH2 decomposition to Mg and H2 at ~150 ˚C. DSC analysis revealed diverse thermal events for as received and milled samples, with the milled sample showing a single endothermic peak at ~193 ˚C associated with hydride desorption. TGA demonstrated a hydrogen release of 0.19 wt. %, improving upon previous reports by achieving higher efficiency at lower temperatures (250 ˚C vs 450 ˚C). No ternary Li-Mg-H phases were identified. Rietveld refinement showed thermal expansion trends and potential Li substitution in the Mg phase. This study highlights the potential of Li-Mg alloys for lower temperature hydrogen storage, revealing promising hydrogenation pathways. However, further optimization is necessary to enhance hydrogen storage capacity for practical applications.
Keywords:
hydrogen storage
; sorption characteristics.
; hydrogen potential
; Li-Mg Alloy
1. Introduction
With increasing global energy demands and pressing need for sustainable energy solutions, hydrogen has emerged as a clean fuel with potential for a low-carbon energy economy. However, the challenge of storing hydrogen safely and efficiently remains a significant barrier to its widespread adoption [1,2,3]. Current hydrogen storage methods, such as high pressure gas and cryogenic liquid storage, present issues in terms of energy efficiency, cost and safety. Solid state hydrogen storage, particularly through metal hydrides, offers a promising alternative due to its high volumetric and gravimetric hydrogen density, reversibility and stability [4].
Among various metal hydrides, magnesium (Mg) has gained attention due to its high hydrogen storage capacity, theoretically reaching up to 7.6 wt% in MgH2, as well as its availability and low cost [5]. Despite these advantages, pure magnesium hydrides face several limitations such as high desorption temperatures (typically above 300 ˚C) and slow absorption/desorption kinetics [6,7,8,9]. These factors reduce the efficiency and feasibility of Mg-based hydrides in practical applications [10,11,12,13]. Recently, technology has focus on alloying magnesium with lithium (Li) to improve its hydrogen storage characteristics. Lithium, with its relatively low atomic mass and high reactivity, has been found to reduce the thermal stability of Mg-based hydrides, thereby lowering desorption temperatures and improving kinetic performance [14,15,16].
Li-Mg alloys have demonstrated considerable potential in addressing the thermodynamic challenges inherent to pure Mg. Alloying lithium with magnesium forms phases that facilitate faster hydrogen absorption and release due to enhanced diffusion rates and catalytic effects from lithium [17,18]. The formation of intermetallic compounds can alter the hydrogen storage mechanisms and create more favorable pathways for hydrogen uptake and release. Studies have predicted the formation of two possible phases LiMgH3 and Li2MgH4 hydrides as potential candidates for hydrogen storage due to their high theoretical gravimetric density [19,20]. Cheng et al. [21] through computational methods predicted the thermodynamic stability of LiMgH3 and Li2MgH4 mixtures at room temperature. Ikeda et al. [22] attempted experimentally to synthesize Li-Mg-H hydrides via mechanical milling LiH and MgH2 under hydrogen for 20 h. However, no traces of the ternary hydride were found. Later, [19,23,24] predicted from computational methods an orthorhombic structure with a Pbam space group (Na2MgCl4 –type) for Li2MgH4 hydride and a trigonal structure with an R3c space group (LiTaO3 –type) for the LiMgH3 ternary hydride. Where synthesis from MgH2 and LiH resulted not stable nor energetically favorable.
Further research by Li et al. [20] trying to synthesize Li-Mg-H by inserting H atoms into the ordered sites of Mg-Li phases was not successful. Smith et al. [25] suggested that Li doping may enhance the hydrogen diffusion to a certain extent conditioned to the stability of the doped phase and determined by an optimal dopant concentration. Moreover, Guo [26] studied the sorption properties of Li-Mg ribbon (97 at% Li and 3 at% Mg) into LiH and Mg(1-x)LixH2 (x=~0.04), decomposition was described and hydrogen desorption temperature decreased from 900 to 470 ˚C.
Despite these promising results, several limitations remain, a thorough understanding of hydrogen sorption and desorption in Li-Mg alloys is essential to optimize their performance for applications, such as stationary storage, fuel portable energy solutions.
The insights gained from this research aim to investigate the sorption characteristics and hydrogen storage potential of Li-Mg alloys as viable material for efficient hydrogen storage, contributing to the awareness of hydrogen as a sustainable energy carrier.
2. Materials and Methods
The Li-Mg alloy was obtained from Ilika plc in ribbon form. Due to its highly reactive nature, it was stored in an argon-filled glove box to prevent oxidation. Prior to milling the ribbon was gently polished with a silicon carbide grinding paper (P800) to eliminate surface defects or oxides. The alloy (~1g) was placed into a high-pressure stainless steel milling pot with 10 mm stainless steel balls at a ball-to-powder ratio of 50:1. The pot was degassed, hydrogenated over five cycles, and pressurized with 100 bar H2. Milling was conducted using a planetary ball mill instrument (Planetary Ball Mill PM400, Retsch, Birmingham, UK) operating at 100 rpm bias rotation. Samples were milled for 15, 30 and 60 minutes in intervales of 10-minutes of milling followed by a 10-minutes rest to prevent overheating.
The resulting samples were handled in an argon-filled glove box, mounted in a dome-shaped holder, and analyzed with an ex-situ XRD instrument (Bruker D8 Advance diffractometer, Birmingham, UK) using Cu Kα (0.154 nm) radiation, controlled by Diffract software (4.0 version) for analysis. For In-situ XRD, structural transformations were studied using an Anton Paar XRK 900 reactor chamber (Bruker, Birmingham, UK). Patterns were recorded from 30 ˚C to 250 ˚C under 3 bar He at 10 mL/min, with a heating rate of 2 ˚C/min. A boron nitride (BN) sample holder was employed for this process, with phase determination conducted over a 2θ range of 5˚ to 90 ˚. Data from ex-situ and in-situ XRD was analyzed using EVA software, with reference structures derived from PDF-2 and ICSD databases [27,28]. Refinements were performed with TOPAS academic software (version 4.0) [29] with the Pseudo-Rietveld refinement, and data determination references obtained from the Inorganic Crystal Structure Database [28]. Background modeling was performed utilizing Chebyshev functions and Pseudo-Voigt functions were employed for peak fitting. Lattice parameters were refined by excluding points below 25˚ 2θ for improved accuracy.
Thermogravimetric analysis (TGA) was conducted using a TG209 Netzsch instrument (Birmingham, UK) under argon (Ar) flow (40 mL/min) at a heating rate of 2 ˚C/min. Differential Scanning Calorimetry (DSC) data was collected using a 204 HP Phoenix instrument (Netzsch, Birmingham, UK) within a temperature range of 25 to 250 ˚C, under 3 bar of Ar flowing at 100 mL/min, with a heating rate of 2 ˚C/min. All thermal analyses were performed in an argon-filled glove box to maintain oxygen levels below 5 ppm. Samples were placed in alumina containers sealed with lids for these measurements.
3. Results and Discussion
3.1. Structural Analysis of As-Received and Milled Materials
X-ray diffraction XRD analysis of the as-received and 1 hour-milled Li-Mg ribbon are presented in Figure 1. The XRD patterns confirm the as received alloy’s solid solution composition (space group lm-3m). Rietveld refinement of the difraction data (Figure 2) revealed lattice parameters consistent with stoichiometric composition of Li-Mg for the as received Li-Mg ribbon. No significant compositional changes were observed after milling the sample for 15 and 30 min under 100 bar H2, therefore no further characterization was performed. Upon milling for 1 h, the Li-Mg alloy transformed into a fine powder with a light grey appearance. Rietveld analysis of the powder (Figure 3) revealed the presence of Li-Mg phase (21.33 wt. %), hydrogenated LiH (75.61 wt. %), and residual Mg (2.99 wt. %). A minor trace of MgH2 phase (<0.1 wt. %) was also detected.
Interestingly, an unidentified diffraction peak appeared at approximately 26.15 2θ˚. This peak does not correspond to any known oxides, hydroxides or hydrides associated with Li, Mg or Fe, nor to theoretical phases such as LiMgH3 and Li2MgH4. A similar feature was reported in [26] suggesting a consistent but uncharacterized phase.
These results demonstrate rapid hydrogenation of the Li-Mg alloy under relatively mild milling conditions (1 h at 100 bar H2), achieving significant hydride formation with lower energy input compared to previous studies.
Refinement of the lattice parameters (Table 1) indicates a contraction of the as-received Li-Mg lattice after 1 hour of milling. The lattice parameters of LiH derived from Rietveld analysis were marginally larger than those reported in the literature, which may suggest subtle differences in hydrogenation dynamics or microstructural effects. Particularly, the Mg phase exhibited an increase in lattice parameters post-milling, resulting in an enlarged c/a ratio and unit cell volume compared to literature values. This expansion is attributed to the segregation of Li atoms from the alloy during hydride formation, leaving a Li depleted Mg solid solution.
Due to the weak intensity of MgH2 diffraction peaks, detailed refinement of this phase was not feasible. However, the observed changes in lattice parameters across active phases are consistent with significant structural reorganization during milling, as highlighted in Table 1.
3.2. Analysis of Hydrogen Storage Capacity
3.2.1. Thermal Analysis Performed by DSC, TGA and In-Situ XRD
To investigate the decomposition temperatures and weight changes of Li-Mg samples during thermal processing under controlled atmospheres DSC and TGA measurements were performed (Figure 4 and Figure 5). Furthermore, to understand the compositional changes and phase transitions in-situ measurements were conducted.
The decomposition behavior of as-received and mechanically milled for 1 h in H2 Li-Mg ribbon was analyzed under 100 bar H2 and Ar atmospheres, with results summarized in Table 2 and compared to previously reported data. Representative DSC traces were plotted focusing on temperature range (≥ 180 ˚C) where reactions were detected.
For the as-received Li-Mg sample under Ar, a sequence of thermal events was observed, first, an exothermic reaction initiated at 188 ˚C and concluded at 197 ˚C, with a peak at 192 ˚C. This reaction is attributed to the melting of Li-Mg ribbon and confirmed by phase change observations in Figure 6. After, an endothermic reaction is followed from 197 ˚C to 200 ˚C, peaking at 198 ˚C, likely representing additional phase transitions.
In contrast, the 1h milled Li-Mg, exhibited a single endothermic reaction between 189 ˚C and 210 ˚C, with the primary inflection at 194 ˚C. The absence of exothermic reactions in the milled sample suggests that this reaction corresponds to hydrogen desorption from MgH2 formed during reactive milling.
Under a H2 atmosphere, the thermal decomposition patterns shifted to slightly lower temperatures. For the as received Li-Mg sample, an exothermic reaction was observed between 187 ˚C and 195 ˚C, peaking at 190 ˚C, likely associated with the melting of the Li-Mg. This was followed by an endothermic reaction from 195 ˚C to 199 ˚C, peaking at 197 ˚C.
For the 1 h milled Li-Mg sample, a single endothermic peak centered at 193 ˚C was detected, which is attributed to the decomposition of MgH2. This decomposition temperature is significantly lower than that reported for milled MgH2 [30].
The TGA measurement performed on the 1 h milled Li-Mg sample shown in Figure 5 revealed a total hydrogen release of 0.19 wt. % H2 up to 250 ˚C. This value aligns well with previously reported results (0.17 wt. % of H2 released between 240 and 450 ˚C). The current study demonstrates that dehydrogenation occurs at lower temperatures.
These findings underscore the influence of milling and hydrogenation on the thermal decomposition pathways of Li-Mg materials. The observed reduction in decomposition temperatures, particularly for the 1 h milled sample, aligns with the literature while offering novel insights into hydrogen storage mechanisms and thermal stability improvements. This knowledge contributes to advancing the design of Li-Mg based hydrogen storage systems with enhanced performance characteristics.
In situ XRD was conducted to monitor compositional changes in as-received and 1 h milled in 100 bar H2 Li-Mg samples during heating. XRD patterns were recorded isothermally every 25 ˚C from room temperature (RT, ~ 30 ˚C) to 250 ˚C, followed by cooling to RT. Scans were acquired over 30 minutes under controlled atmospheres of 3 bar He or 3 bar H2 at a flow rate of 100 mL/min.
The XRD diffractions for the as-received Li-Mg ribbon under 3 bar H2 are shown in Figure 6. Patterns corresponding to the Li-Mg phase peaking at 36.13 (2θ˚) were present up to 100 ˚C. At 200 ˚C, Li-Mg peaks were replaced by formation of new diffractions related to the LiH phase, demonstrating hydrogenation of Li from the solid solution. Moreover, Li2O peaks were also observed at this temperature showing partial oxidation of the material. On heating to 250 ˚C, peaks related to the formation of MgH2 were observed, showing the facile hydrogenation of Mg under relatively low conditions of temperature and pressure. On cooling to RT, phases of hydrogenated Li and Mg are present in the sample along with Li oxide.
The in-situ XRD patterns of the 1 h milled (100 bar H2) Li-Mg sample are presented in Figure 7. At room temperature, the diffractions for Li-Mg, LiH, MgH2 and Mg phases were observed. As temperature increased, the intensity of Li-Mg and MgH2 peaks diminished, while those of LiH and Mg increased, suggesting lattice reordering. By 150 ˚C, Li-Mg and MgH2 reflections showed a further weakening, accompanied by a shift to higher angles (inset Figure 7), showing thermal expansion. Concurrently, Li2O diffractions emerged, likely due to minor instrument leaks. Between 200 and 250 ˚C, the reduction in MgH2 intensity peaks became pronounced, indicating partial decomposition into Mg and the release of H2. Furthermore, LiH and Mg peaks continue to intensify. These observations align closely with the DSC results (Figure 4b), supporting the phase transitions and hydrogen desorption observed thermally. Upon cooling to RT, diffractions for LiH, Mg and Li2O remained, confirming the presence of these phases post-heating.
Cell volumes of the 1h milled sample (100 bar H2) are plotted in Figure 8. Phases of Li-Mg, LiH and MgH2 phases exhibited near linear increases up to 250 ˚C due to thermal expansion. Interestingly, the cell volume of MgH2 from the 1 h milled sample was larger than that of as-received MgH2. This is attributed to partial substitution of Mg2+ (rionic = 0.72 Å) with larger Li+ ions (rionic = 0.76 Å) [31], forming a bct-Mg(Li)H2 solid solution. Using Vegard’s law, the Li content was estimated as x ≈ 0.04 [32].
In contrast, cell volume of Mg phase showed different behavior as shown in Figure 9. While both parameters a and c expanded linearly up to 200 ˚C, parameter c decreased sharply above 210 ˚C, resulting in cell volume contraction. This suggests the decomposition of Mg(1-x)LixH2 with the liberated Li (r = 1.56 Å) dissolving into α-Mg (r = 1.60 Å) to form an hcp Mg(Li) solid solution. With further heating, the Li content increased rapidly until reaching the maximum solubility (~ 17 atom% Li at 450 ˚C) [33], triggering a transformation to the bcc phase.
The in-situ XRD results provide detailed insights into the thermal and compositional evolution of Li-Mg samples under various conditions. The observed phase transformations, particularly the formation of hydrogenated phases (LiH and MgH2) and the decomposition pathways, corroborate the DSC-TGA findings and highlight the influence of mechanical milling and hydrogen atmosphere on thermal stability. The detection of bct-Mg(Li)H2 and its subsequent transformation to Mg(Li) solid solutions further elucidates the potential of these materials for hydrogen storage applications. Nevertheless, the amount of H2 desorbed remains insufficient for practical applications. To enhance the material’s potential for real world use, further investigations into the sorption kinetics and reversibility are necessary. Future studies should explore the effects of higher H2 back pressures specifically at 10, 20 and 50 bar, to determine optimal conditions for improved hydrogen storage performance.
5. Conclusions
The hydrogenation behavior of a Li-Mg ribbon was investigated using reactive milling under 100 bar H2. Direct hydrogenation occurs after just 1 h of milling, producing a powder containing LiH, MgH2, and Li-Mg phases. Under 3 bar H2 flowing at 100 mL/ min, hydrogenation of the as-received ribbon was achieved within ~5 hours at 200 ˚C. In- situ XRD patterns confirmed the decomposition of MgH2 into Mg and H2 starting at 150 ˚C, aligning with DSC data, although complete dehydrogenation was not achieved at 250 ˚C. The DSC traces revealed distinct thermal behavior: two reactions (exothermic at ~190 ˚C and endothermic at ~197 ˚C) for the as-received sample, and a single endothermic reaction at ~193 ˚C for the milled sample, corresponding to hydride desorption. TGA measurement showed a hydrogen release of 0.19 wt. %, slightly exceeding literature values (0.17 wt.% at 425 ˚C), with a significantly lower decomposition temperature (250 ˚C compared to 425 ˚C). Despite attempts to form Li-Mg-H ternary phases (LiMgH3, Li2MgH4) no evidence of these phases was observed. Rietveld refinement indicated that milling enhances the formation of LiH (75.6 wt.%) and Mg (2.9 wt.%), while lattice parameter analysis highlighted thermal expansion trends with exception in the Mg phase. This work demonstrates that while the Li-Mg alloy exhibits a lower temperature hydrogenation and dehydrogenation pathways than previously reported, further improvements in hydrogen storage capacity and kinetics are needed to meet practical application requirements.
Author Contributions
Conceptualization, L.F. and D.B.; methodology, L.F. and D.B; validation, D.B. and A.T.; formal analysis, L.F. and R.M.; investigation, L.F., M.L. and F.S. and R.M.; resources, A.T., M.L and F.S.; writing—original draft preparation, L.F.; writing—review and editing, R.M., M.L, A.T., F.S. and D.B; visualization, R.M.; supervision, D.B; All authors have read and agreed to the published version of the manuscript.
Funding
The authors thank the Technical University of Ambato, Research and Development Directorate, for the financial support of this research.
Data Availability Statement
The data presented in this study are available on request from the corresponding author.
Conflicts of Interest
The authors declare no conflicts of interest.
References
- Zhang J, Li J (2024) Revolution in Renewables: Integration of Green Hydrogen for a Sustainable Future. Energies (Basel) 17:4148. [CrossRef]
- Mokrzycki E, Gawlik L (2024) The Development of a Green Hydrogen Economy: Review. Energies (Basel) 17:3165. [CrossRef]
- Aslam S, Rani S, Lal K, et al (2023) Electrochemical hydrogen production: sustainable hydrogen economy. Green Chemistry 25:9543–9573. [CrossRef]
- Falcone PM, Hiete M, Sapio A (2021) Hydrogen economy and sustainable development goals: Review and policy insights. Curr Opin Green Sustain Chem 31:100506. [CrossRef]
- Baran A, Polański M (2020) Magnesium-Based Materials for Hydrogen Storage—A Scope Review. Materials 13:3993. [CrossRef]
- Shang Y, Pistidda C, Gizer G, et al (2021) Mg-based materials for hydrogen storage. Journal of Magnesium and Alloys 9:1837–1860. [CrossRef]
- Li Q, Lu Y, Luo Q, et al (2021) Thermodynamics and kinetics of hydriding and dehydriding reactions in Mg-based hydrogen storage materials. Journal of Magnesium and Alloys 9:1922–1941. [CrossRef]
- Li X, Yuan Z, Liu C, et al (2024) Research progress in improved hydrogen storage properties of Mg-based alloys with metal-based materials and light metals. Int J Hydrogen Energy 50:1401–1417. [CrossRef]
- Ding X, Chen R, Zhang J, et al (2022) Recent progress on enhancing the hydrogen storage properties of Mg-based materials via fabricating nanostructures: A critical review. J Alloys Compd 897:163137. [CrossRef]
- Guo Z, Zhao S, Li T, et al (2020) Recent Advances in Rechargeable Magnesium-Based Batteries for High-Efficiency Energy Storage. Adv Energy Mater 10:. [CrossRef]
- Ouyang L, Liu F, Wang H, et al (2020) Magnesium-based hydrogen storage compounds: A review. J Alloys Compd 832:154865. [CrossRef]
- Xie X, Hou C, Chen C, et al (2020) First-principles studies in Mg-based hydrogen storage Materials: A review. Energy 211:118959. [CrossRef]
- Hitam CNC, Aziz MAA, Ruhaimi AH, Taib MR (2021) Magnesium-based alloys for solid-state hydrogen storage applications: A review. Int J Hydrogen Energy 46:31067–31083. [CrossRef]
- Kumar D, Phanden RK, Thakur L (2021) A review on environment friendly and lightweight Magnesium-Based metal matrix composites and alloys. Mater Today Proc 38:359–364. [CrossRef]
- Xiao F, Wu T, Yang Y (2024) Research progress in hydrogen production by hydrolysis of magnesium-based materials. Int J Hydrogen Energy 49:696–718. [CrossRef]
- Lesz S, Hrapkowicz B, Karolus M, Gołombek K (2021) Characteristics of the Mg-Zn-Ca-Gd Alloy after Mechanical Alloying. Materials 14:226. [CrossRef]
- Liu J, Yuan Q, Huang W, Song X (2022) A novel nanoporous Mg-Li material for efficient hydrogen generation. Journal of Magnesium and Alloys 10:3054–3063. [CrossRef]
- Pęska M, Czujko T, Polański M (2020) Hydrogenation Ability of Mg-Li Alloys. Energies (Basel) 13:2080. [CrossRef]
- Vajeeston P, Ravindran P, Kjekshus A, Fjellvåg H (2008) First-principles investigations of the MMgH3 (, Na, K, Rb, Cs) series. J Alloys Compd 450:327–337. [CrossRef]
- Li D, Zhang T, Yang S, et al (2011) Ab initio investigation of structures, electronic and thermodynamic properties for Li–Mg–H ternary system. J Alloys Compd 509:8228–8234. [CrossRef]
- Cheng F, Tao Z, Liang J, Chen J (2012) Efficient hydrogen storage with the combination of lightweight Mg/MgH2 and nanostructures. Chemical Communications 48:7334–7343. [CrossRef]
- Ikeda K, Kogure Y, Nakamori Y, Orimo S (2007) Formation region and hydrogen storage abilities of perovskite-type hydrides. Progress in Solid State Chemistry 35:329–337. [CrossRef]
- Pfrommer B, Elsässer C, Fähnle M (1994) Possibility of Li-Mg and Al-Mg hydrides being metallic. Phys Rev B 50:5089–5093. [CrossRef]
- Al S, Kurkcu C, Yamcicier C (2020) High pressure phase transitions and physical properties of Li2MgH4; implications for hydrogen storage. Int J Hydrogen Energy 45:4720–4730. [CrossRef]
- Smith KC, Fisher TS, Waghmare U V., Grau-Crespo R (2010) Dopant-vacancy binding effects in Li-doped magnesium hydride. Phys Rev B 82:134109. [CrossRef]
- Guo S (2015) Light metal borohydrides and Mg-based hydrides for hydrogen storage. University of Birmingham.
- Bruker (2024) DIFFRAC.SUITE EVA - XRD Software | Bruker. https://www.bruker.com/products/x-ray-diffraction-and-elemental-analysis/x-ray-diffraction/xrd-software/eva.html. Accessed 19 Nov 2024.
- ICSD (2024) Inorganic Chemical Database Service. http://icsd.cds.rsc.org/search/basic.xhtml;jsessionid=82761CD648F766CC9CA76BDA84933E21?cdsrdr=3. Accessed 19 Nov 2024.
- Bruker (2024) DIFFRAC.SUITE TOPAS - XRD Software, X-ray diffraction - XRD Software | Bruker. https://www.bruker.com/products/x-ray-diffraction-and-elemental-analysis/x-ray-diffraction/xrd-software/topas.html. Accessed 19 Nov 2024.
- Varin RA, Czujko T, Wronski Z (2006) Particle size, grain size and γ-MgH2 effects on the desorption properties of nanocrystalline commercial magnesium hydride processed by controlled mechanical milling. Nanotechnology 17:3856–3865. [CrossRef]
- Shannon RD (1976) Revised effective ionic radii and systematic studies of interatomic distances in halides and chalcogenides. Acta Crystallographica Section A 32:751–767. [CrossRef]
- Denton AR, Ashcroft NW (1991) Vegard’s law. Phys Rev A (Coll Park) 43:3161–3164. [CrossRef]
- Nayeb-Hashemi AA, Clark JB, Pelton AD (1984) The Li-Mg (Lithium-Magnesium) system. Bulletin of Alloy Phase Diagrams 5:365–374. [CrossRef]
Figure 1.
Ex-situ XRD patterns of as-received and 1 h milled under 100 bar H2 Li-Mg ribbon in argon.
Figure 1.
Ex-situ XRD patterns of as-received and 1 h milled under 100 bar H2 Li-Mg ribbon in argon.
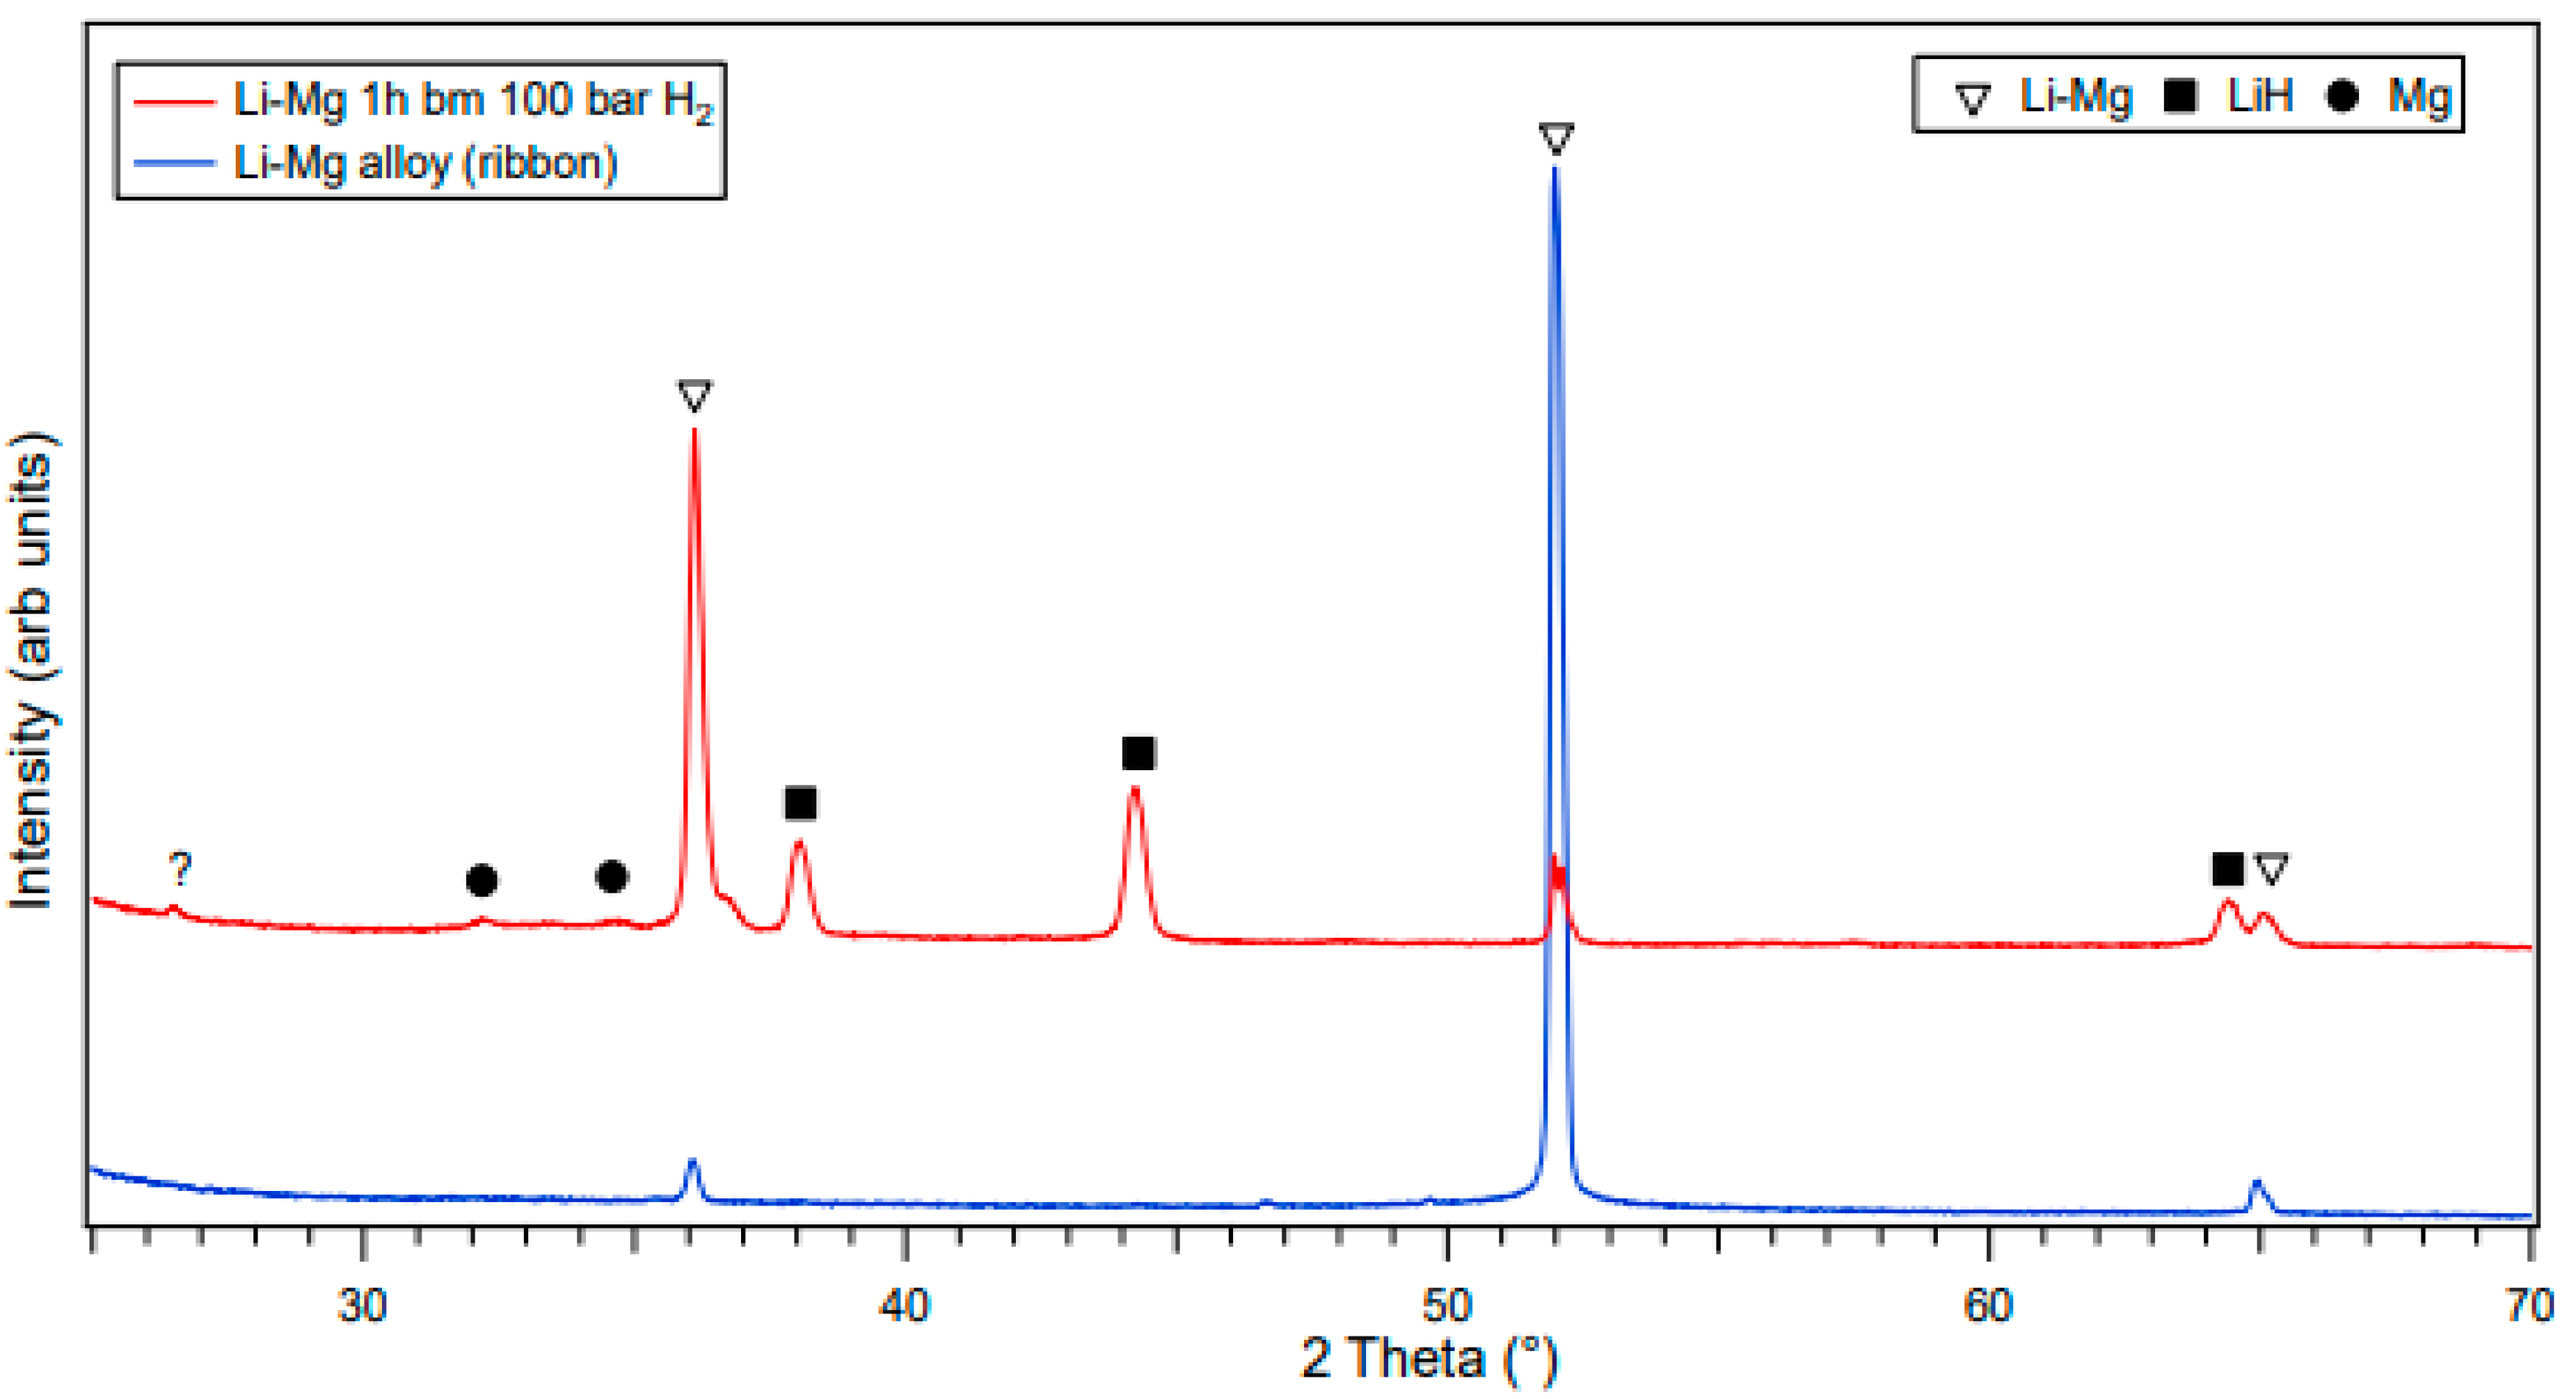
Figure 2.
Rietveld refinement of as received Li-Mg ribbon values before 25 were not considered for the refinement as no representative diffractions were detected. (Observed data is shown by blue lines, calculated data is represented by the red lines and the difference is plotted below in grey). Goodness of fit 2.013.
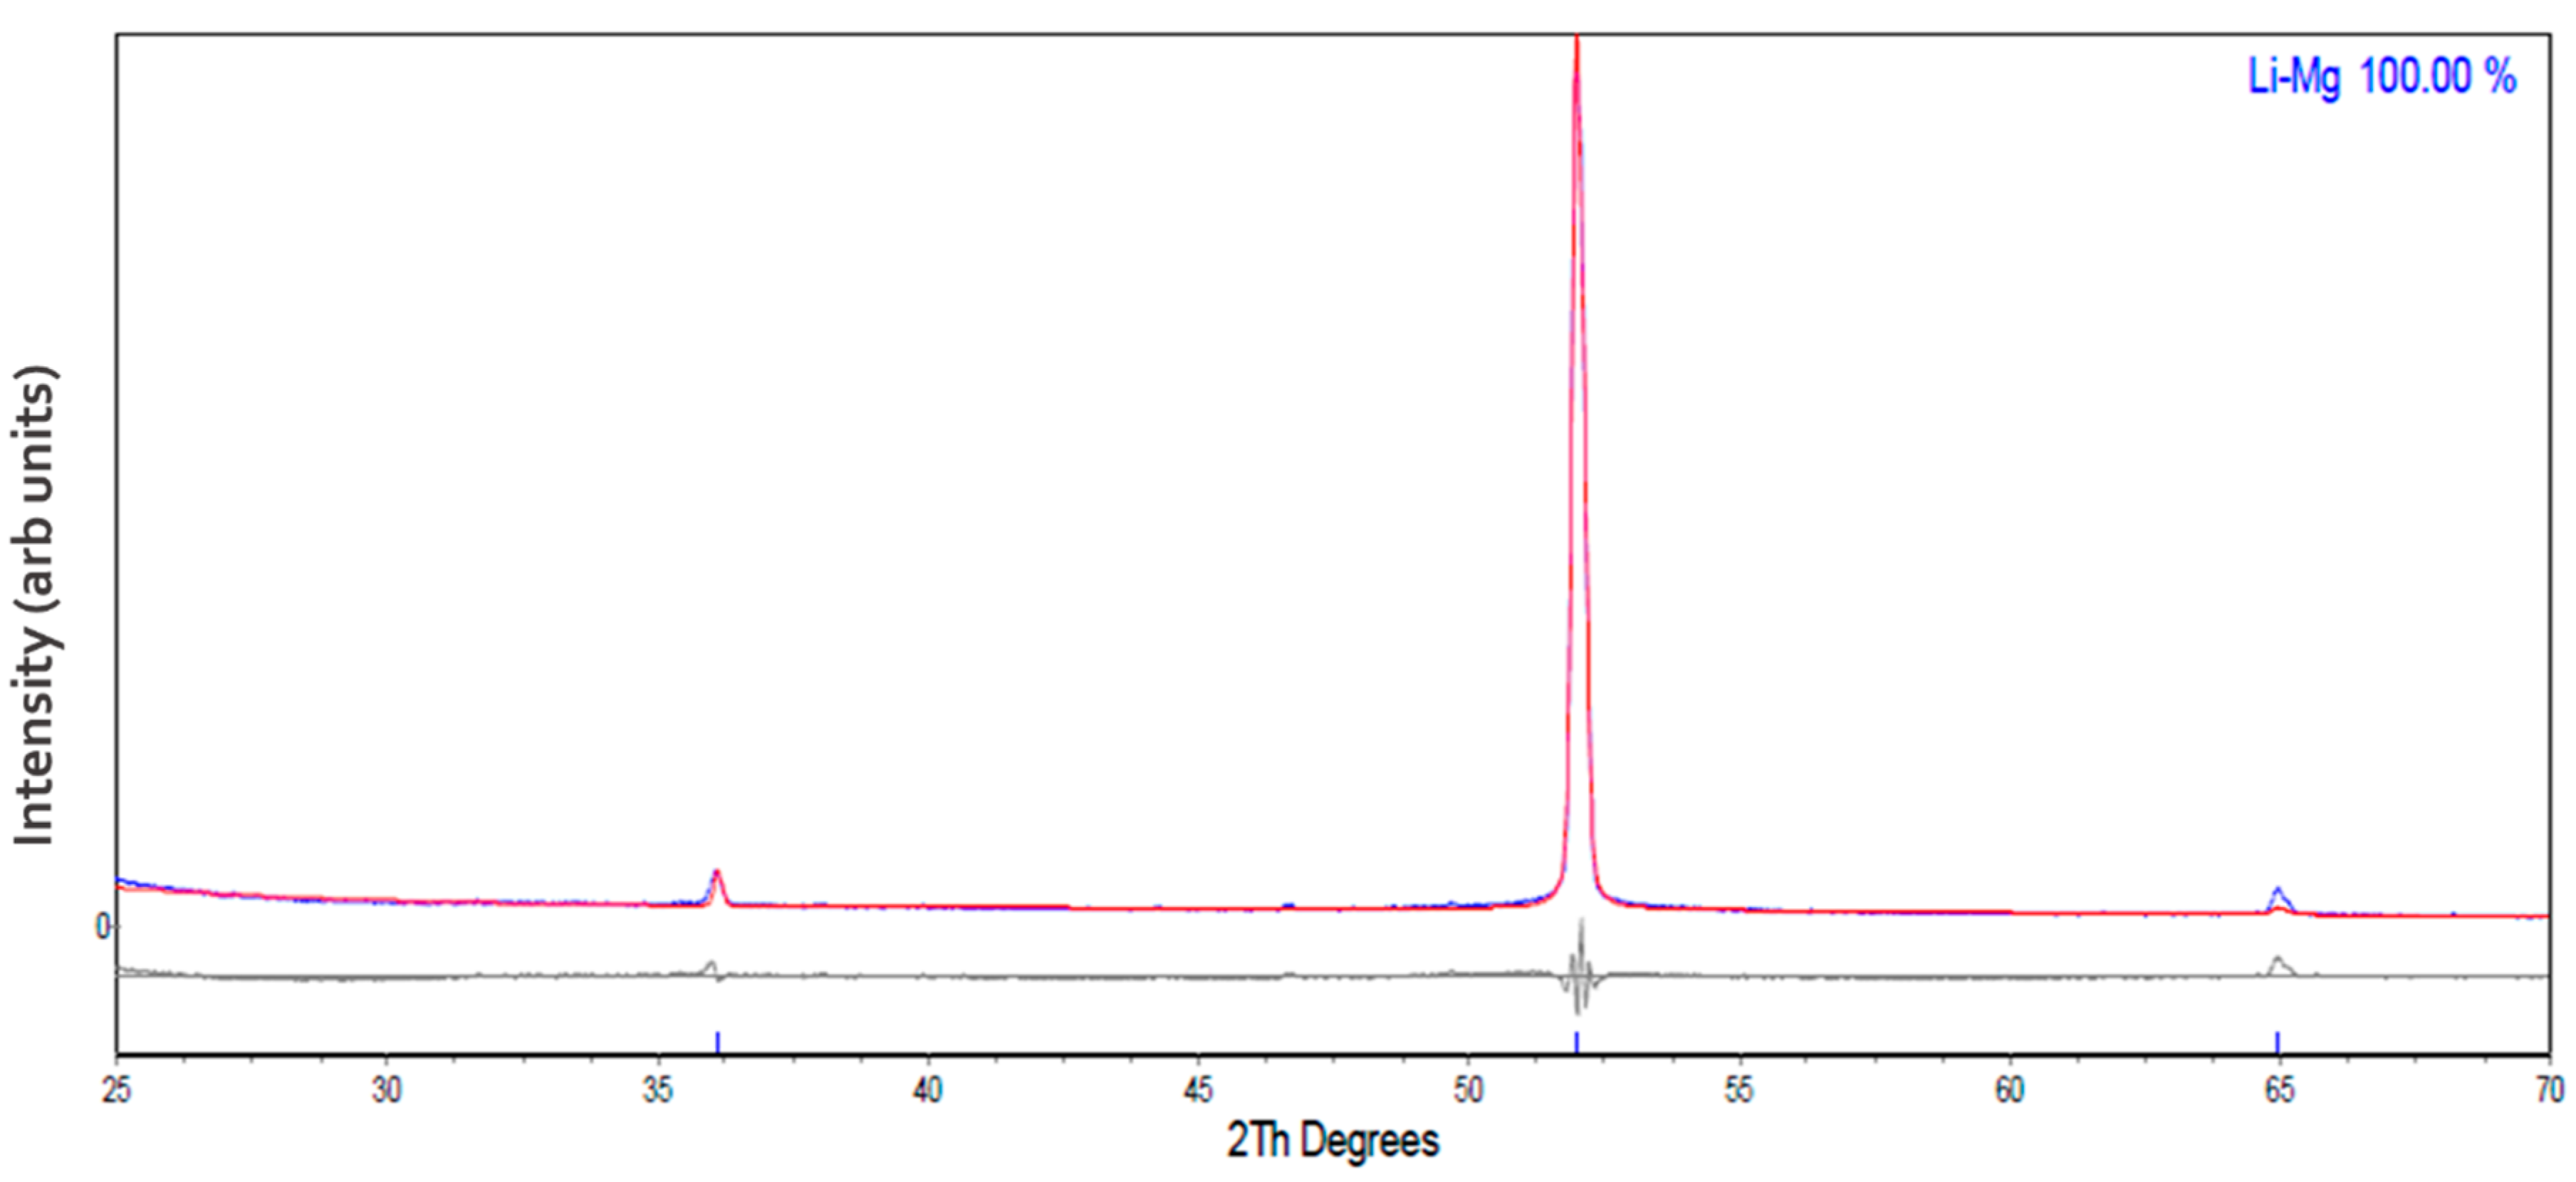
Figure 3.
Rietveld refinement of 1 hour milled under 100 bar H2 Li-Mg ribbon values before 25 were not considered for the refinement as no representative diffractions were detected. (Observed data is shown by blue lines, calculated data is represented by the red lines and the difference is plotted below in grey). Goodness of fit 2.137.
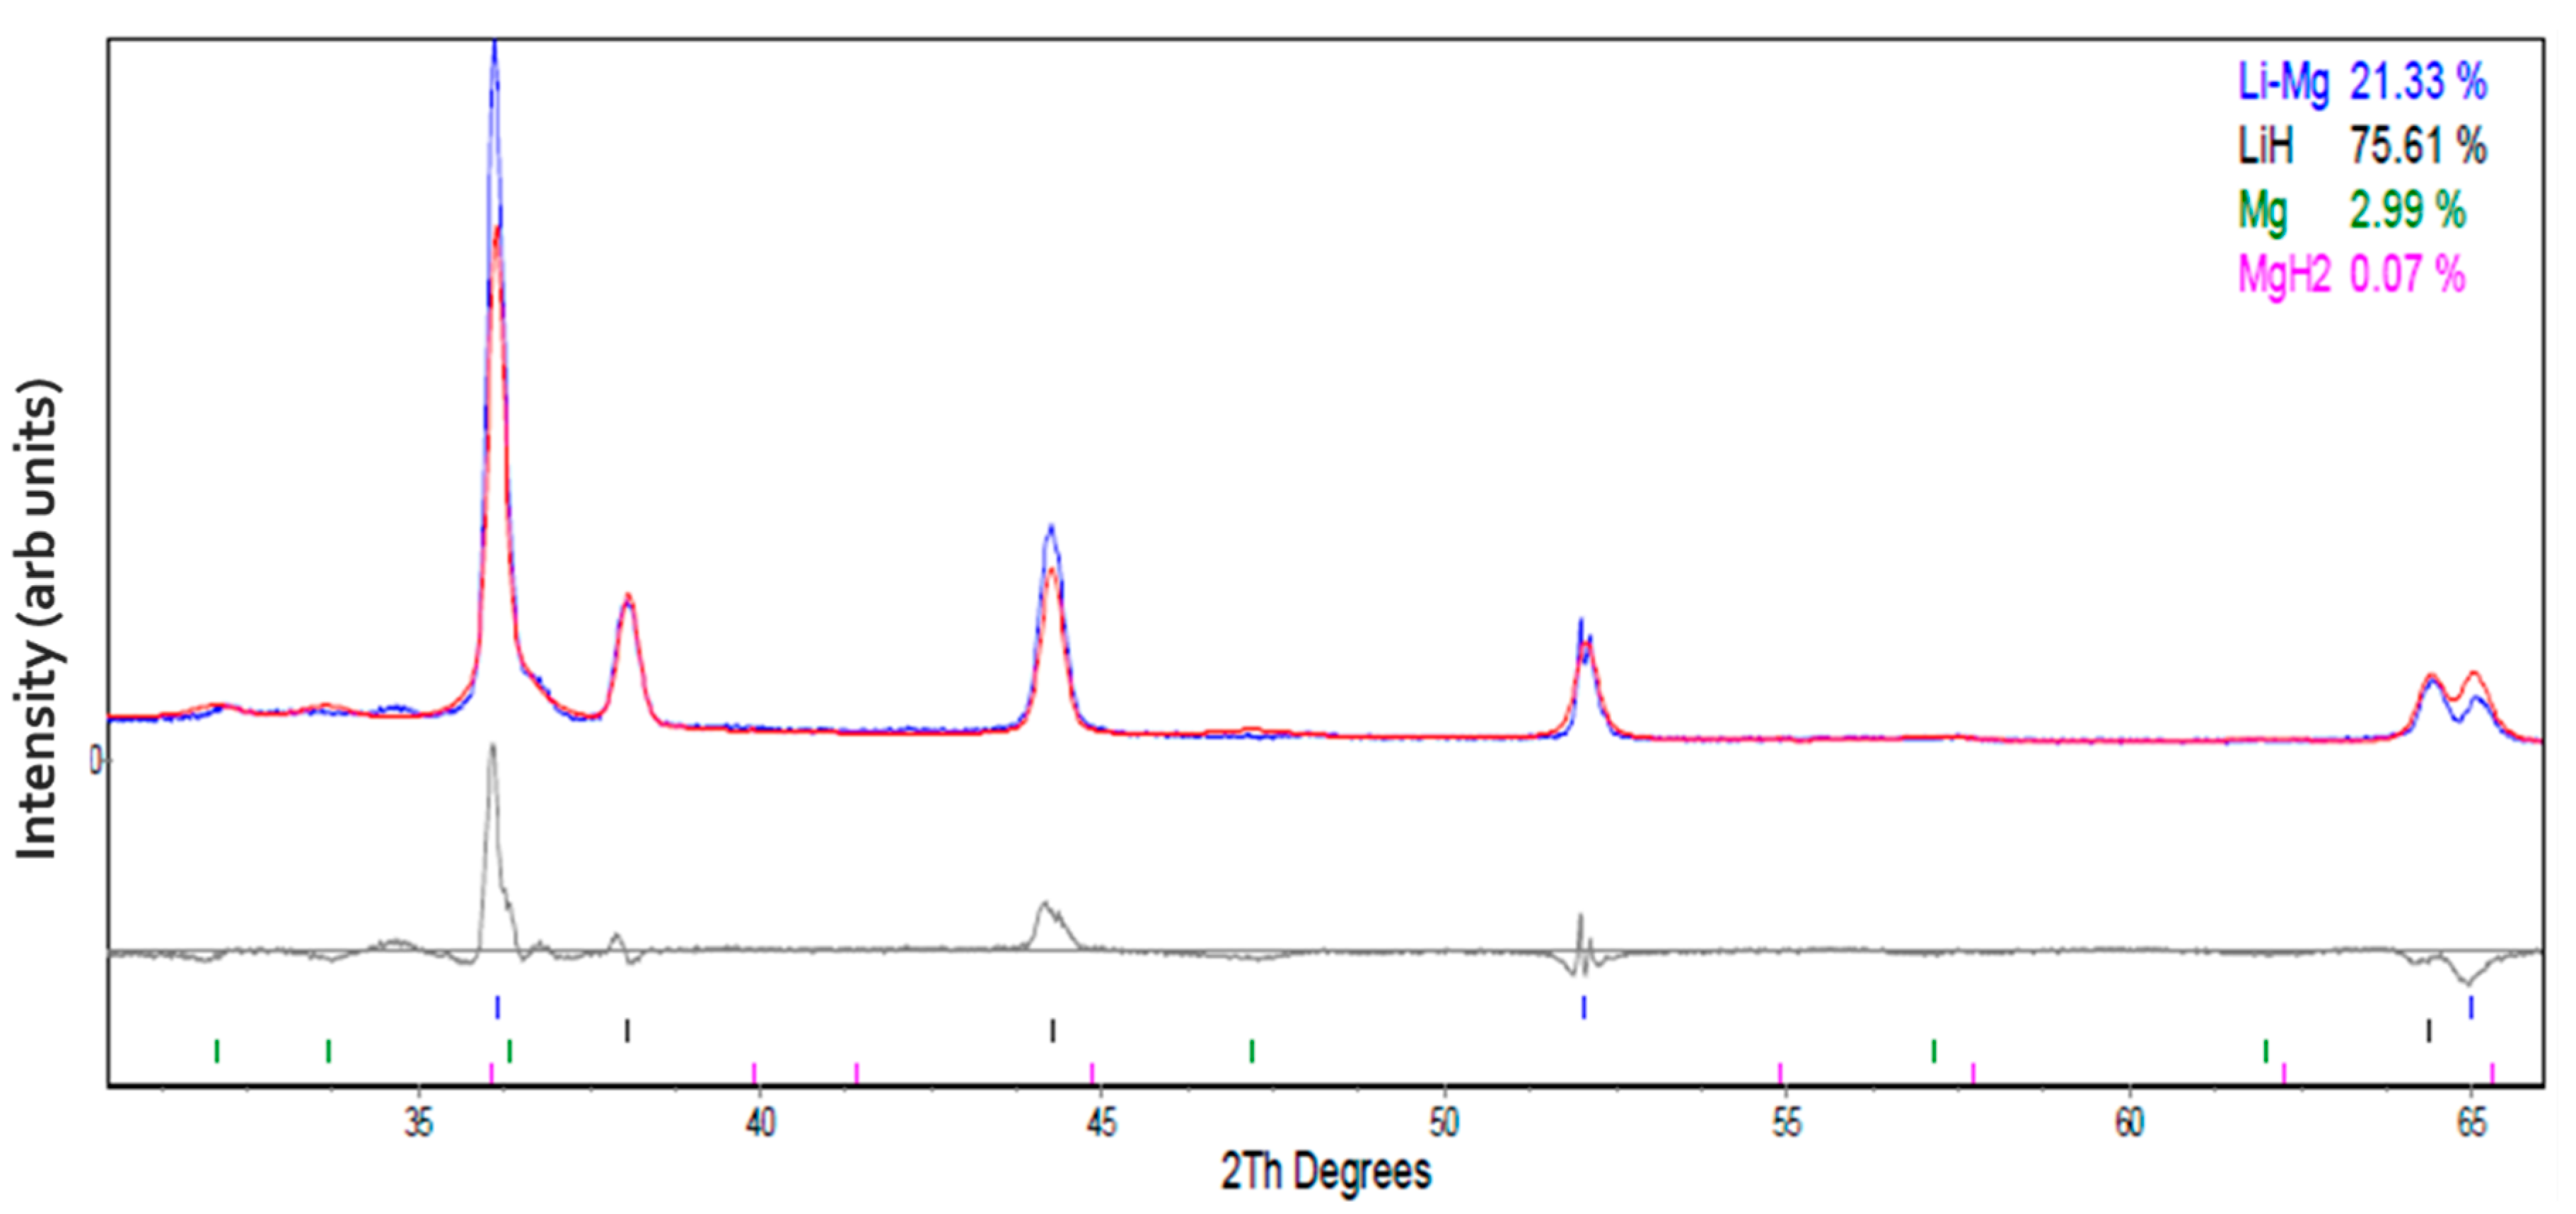
Figure 4.
DSC curves of the as received and 1h milled (100 bar H2) Li-Mg alloy (a) under 3 bar Ar at 100mL/min and 2 °C/min heating rate, (b) under 3 bar H2 flowing at 100 mL/min and a heating rate of 2 °C/min.
Figure 4.
DSC curves of the as received and 1h milled (100 bar H2) Li-Mg alloy (a) under 3 bar Ar at 100mL/min and 2 °C/min heating rate, (b) under 3 bar H2 flowing at 100 mL/min and a heating rate of 2 °C/min.
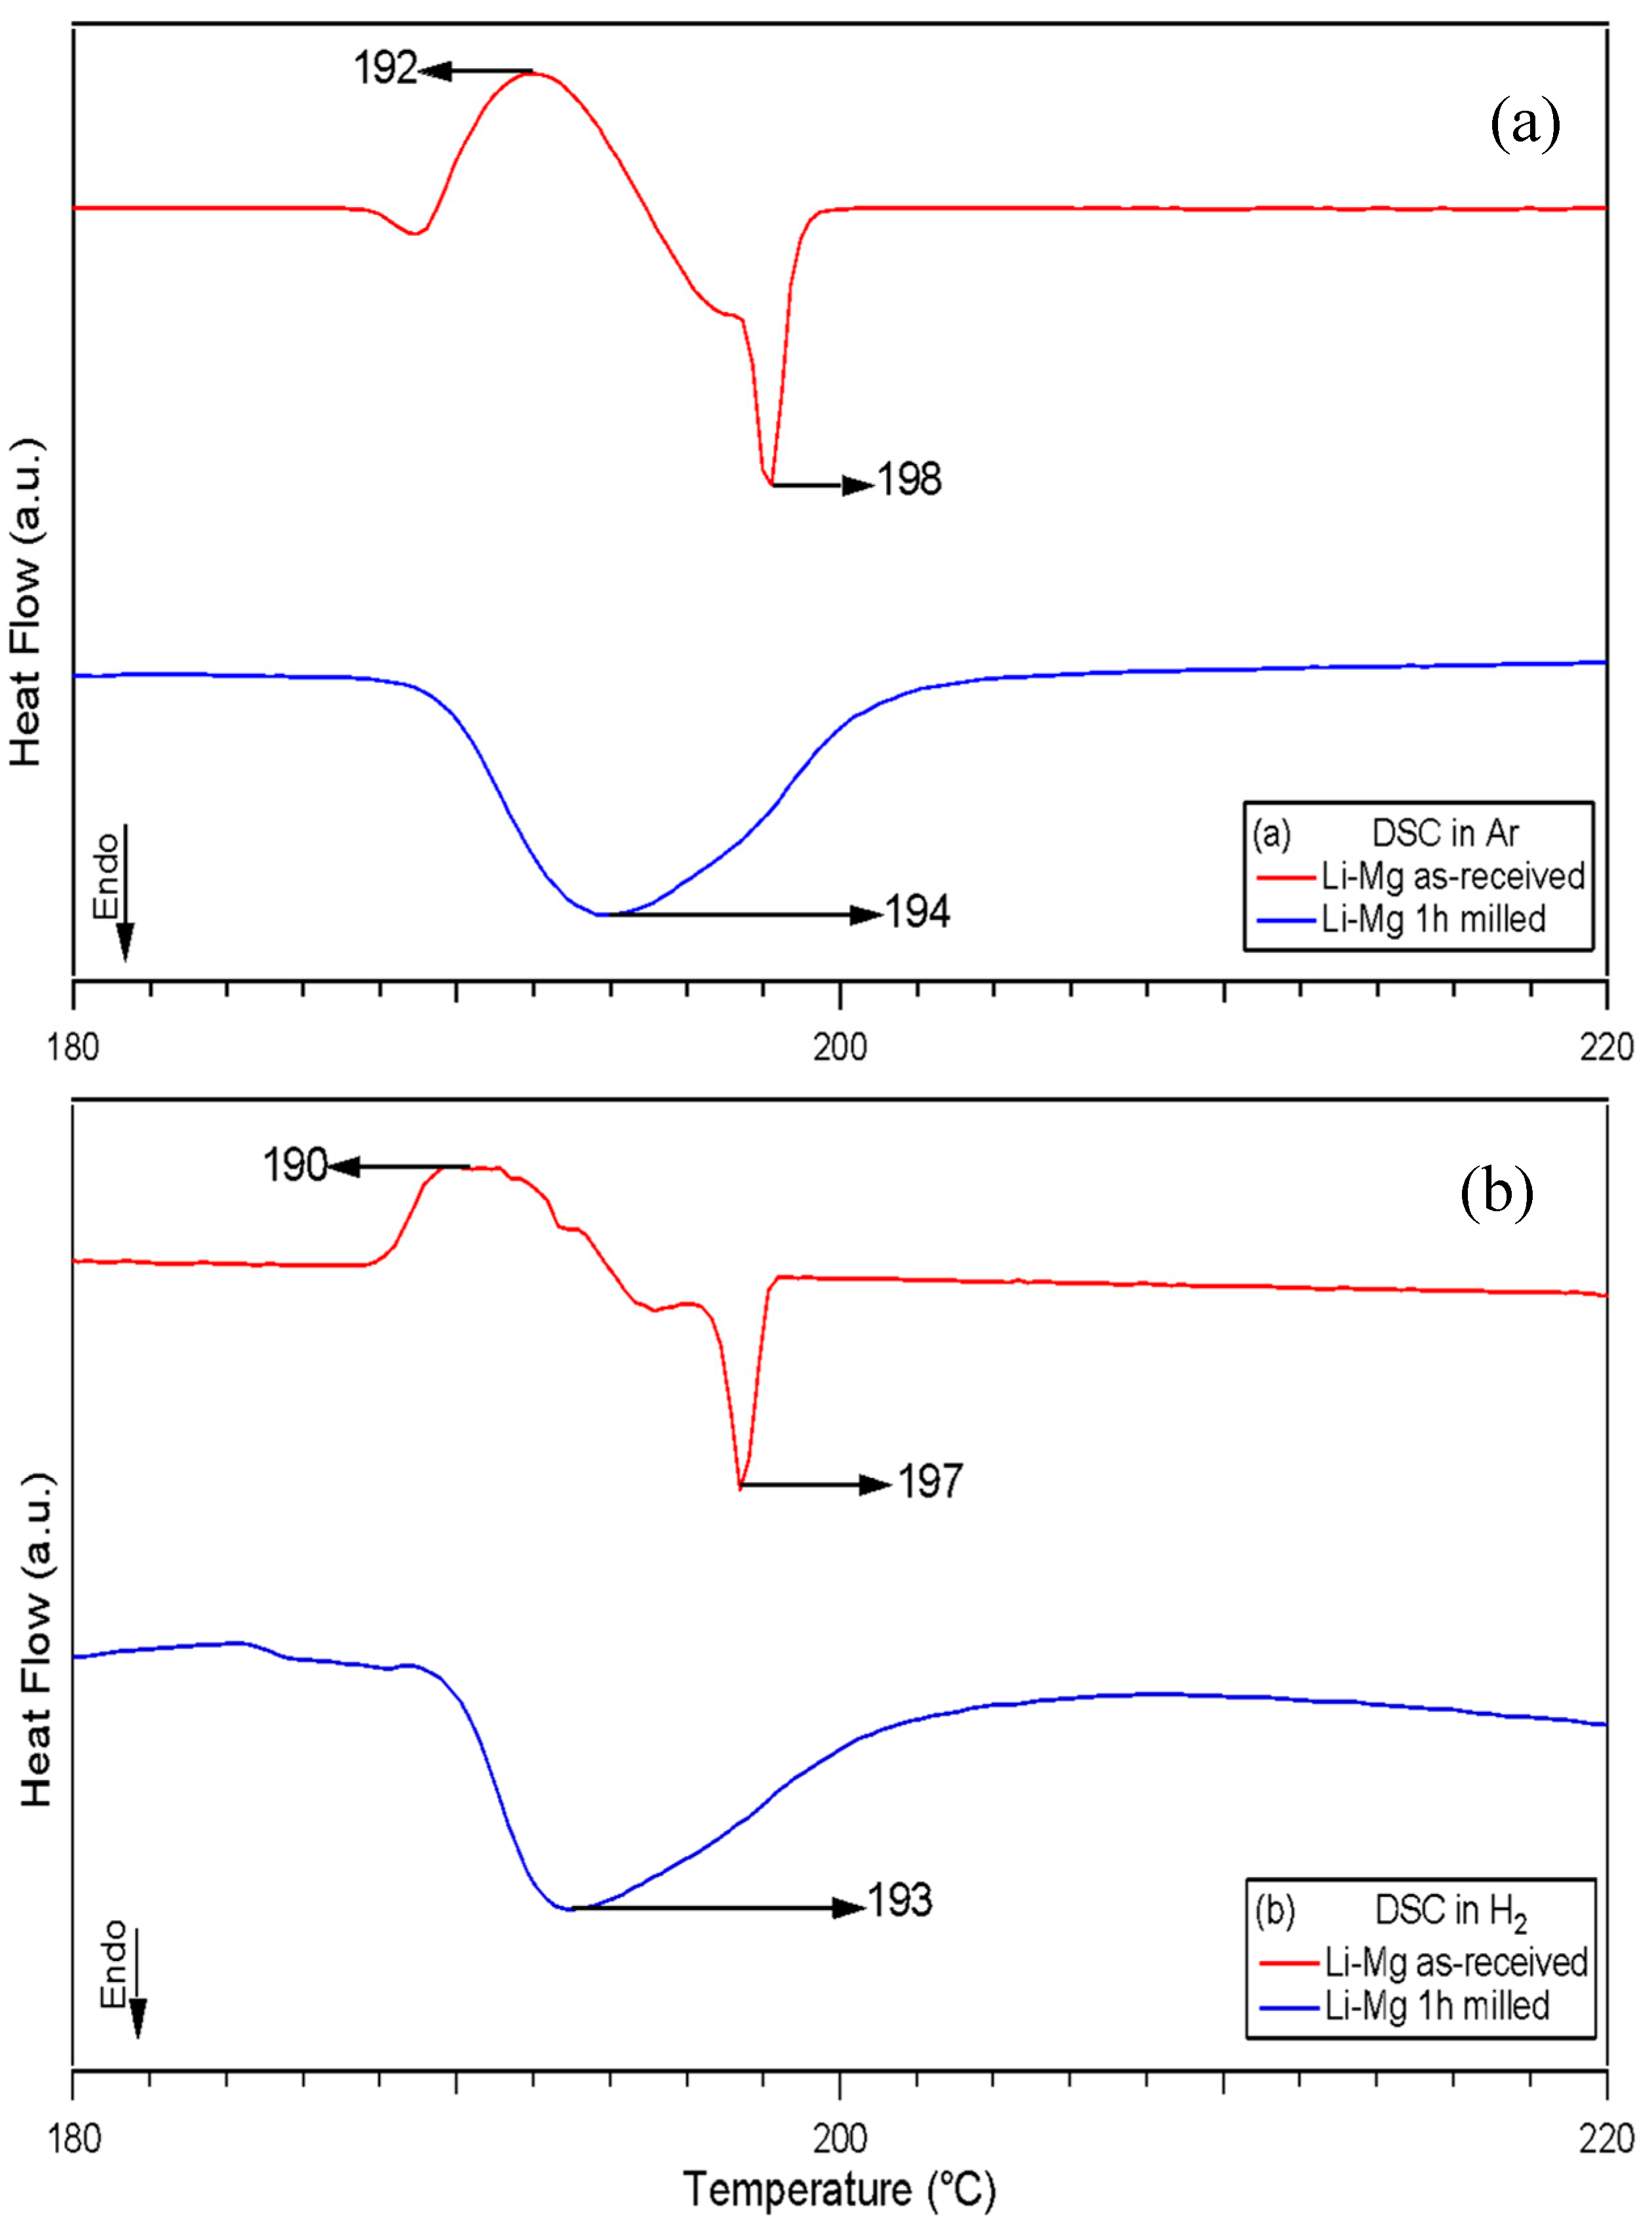
Figure 5.
TGA of 1 h milled (100 bar H2) Li-Mg sample. Measurement was conducted at a heating rate of 2 ˚C /min from 30 to 250 ˚C under 1 bar Ar flowing at 40 mL/min.
Figure 5.
TGA of 1 h milled (100 bar H2) Li-Mg sample. Measurement was conducted at a heating rate of 2 ˚C /min from 30 to 250 ˚C under 1 bar Ar flowing at 40 mL/min.
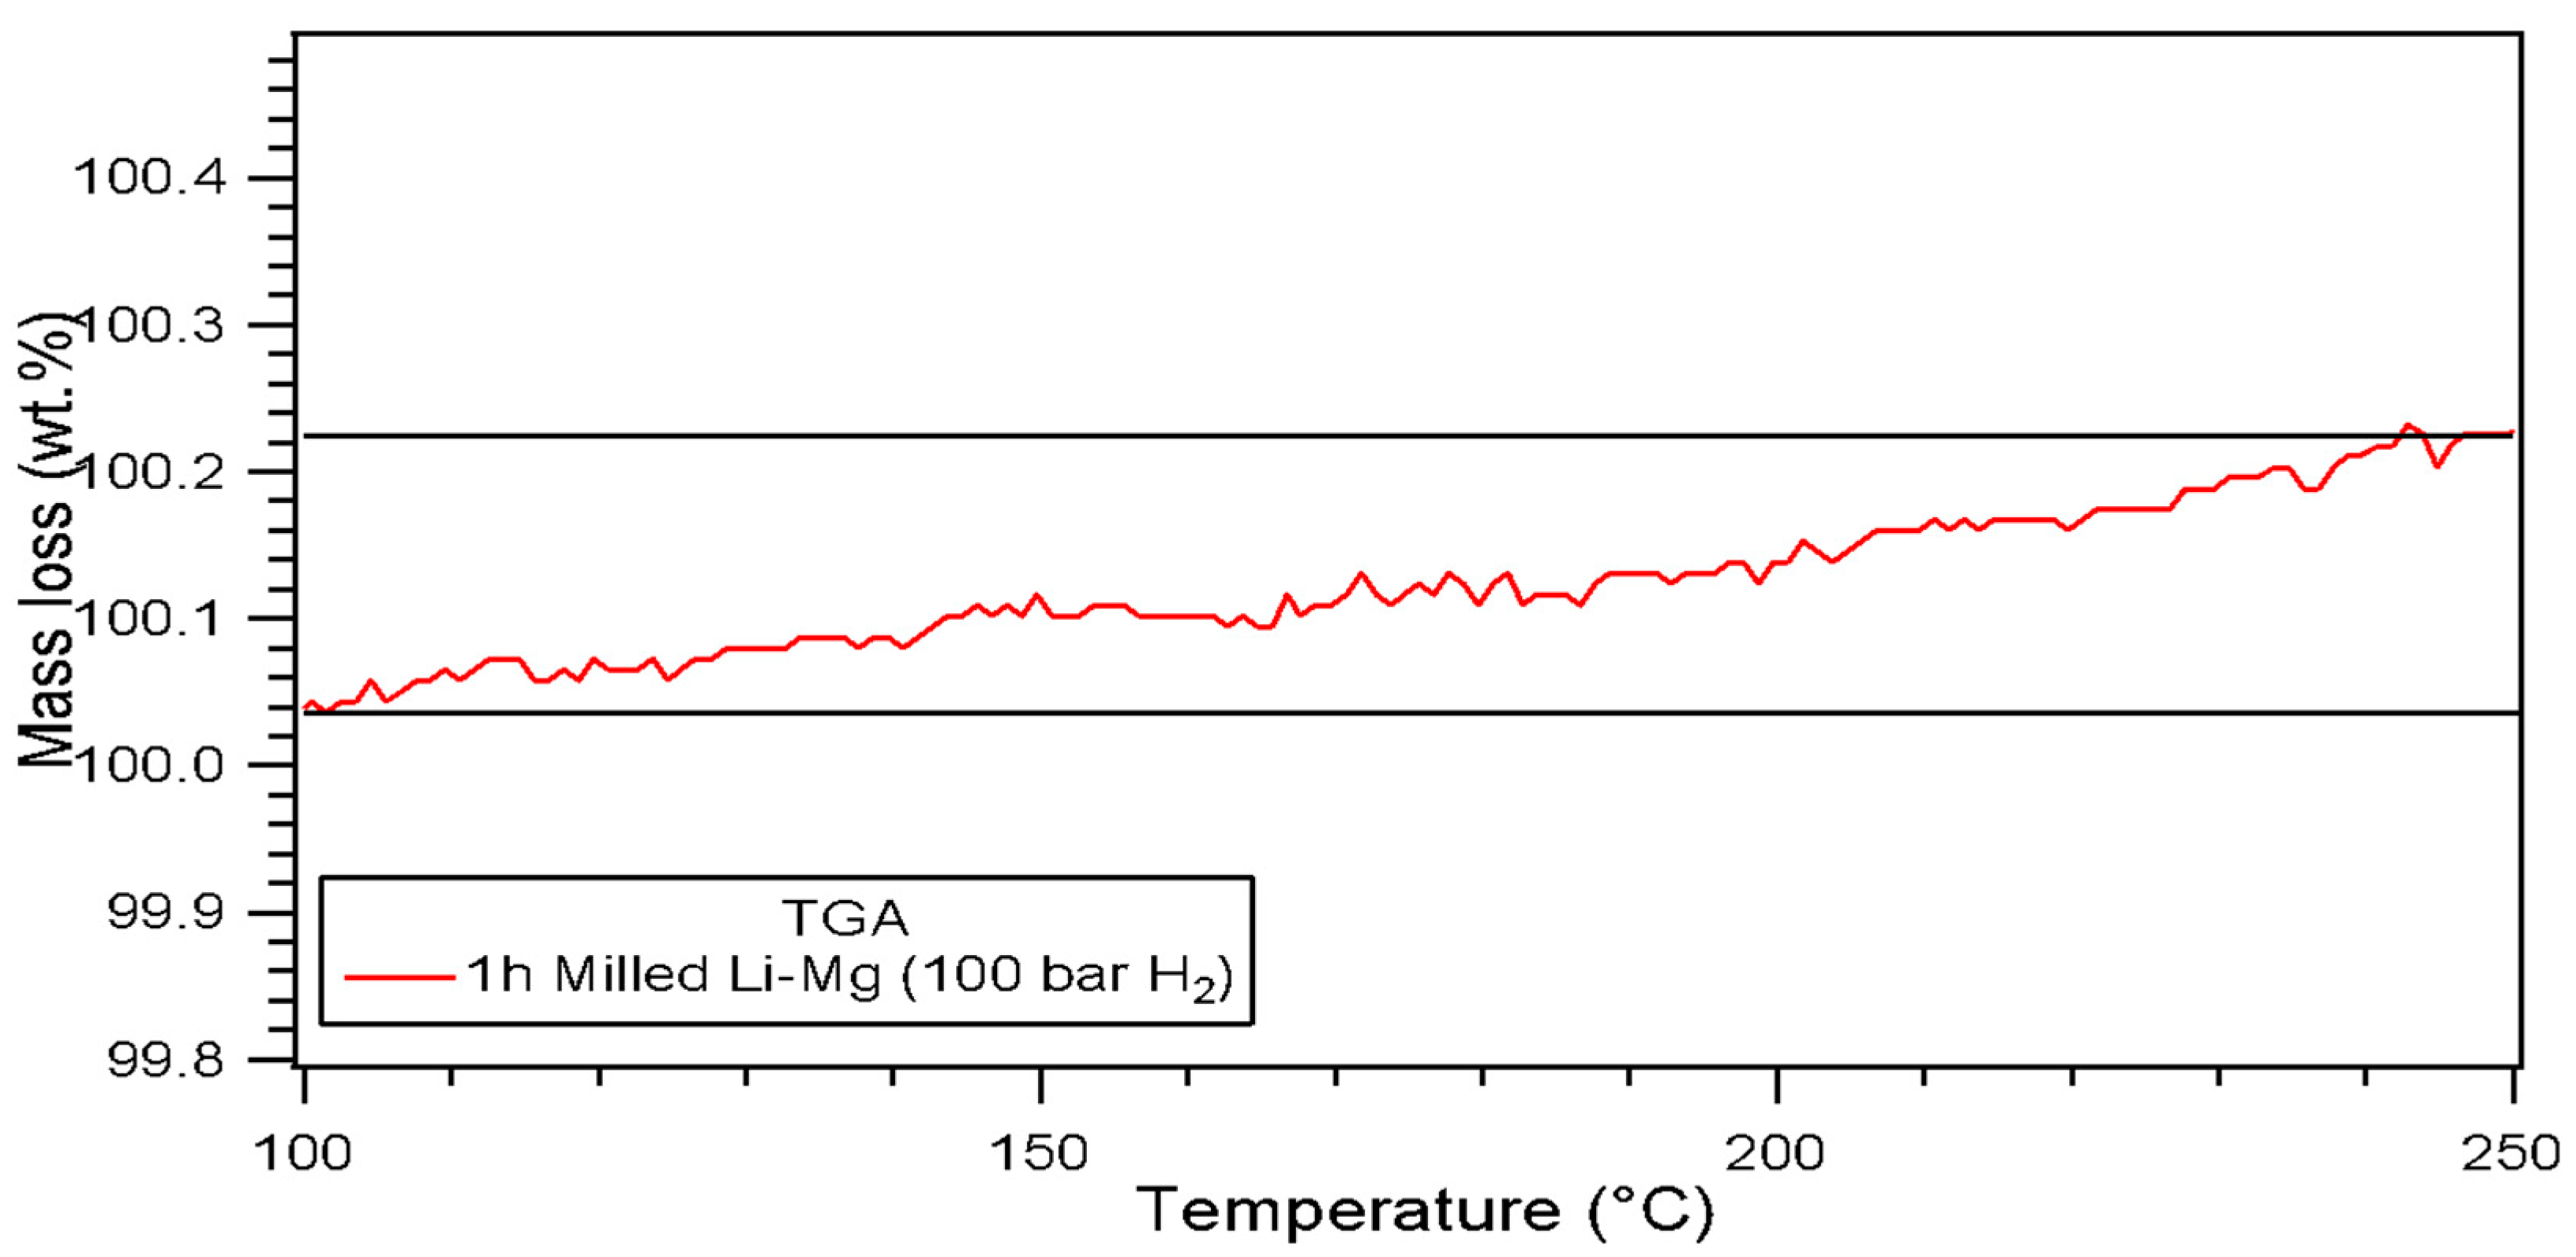
Figure 6.
Compositional changes shown by in-situ XRD of the as-received Li-Mg Ribbon under 3 bar flowing H2 at 100 mL/min. Measurements taken from 30 ˚C to 250 ˚C.
Figure 6.
Compositional changes shown by in-situ XRD of the as-received Li-Mg Ribbon under 3 bar flowing H2 at 100 mL/min. Measurements taken from 30 ˚C to 250 ˚C.
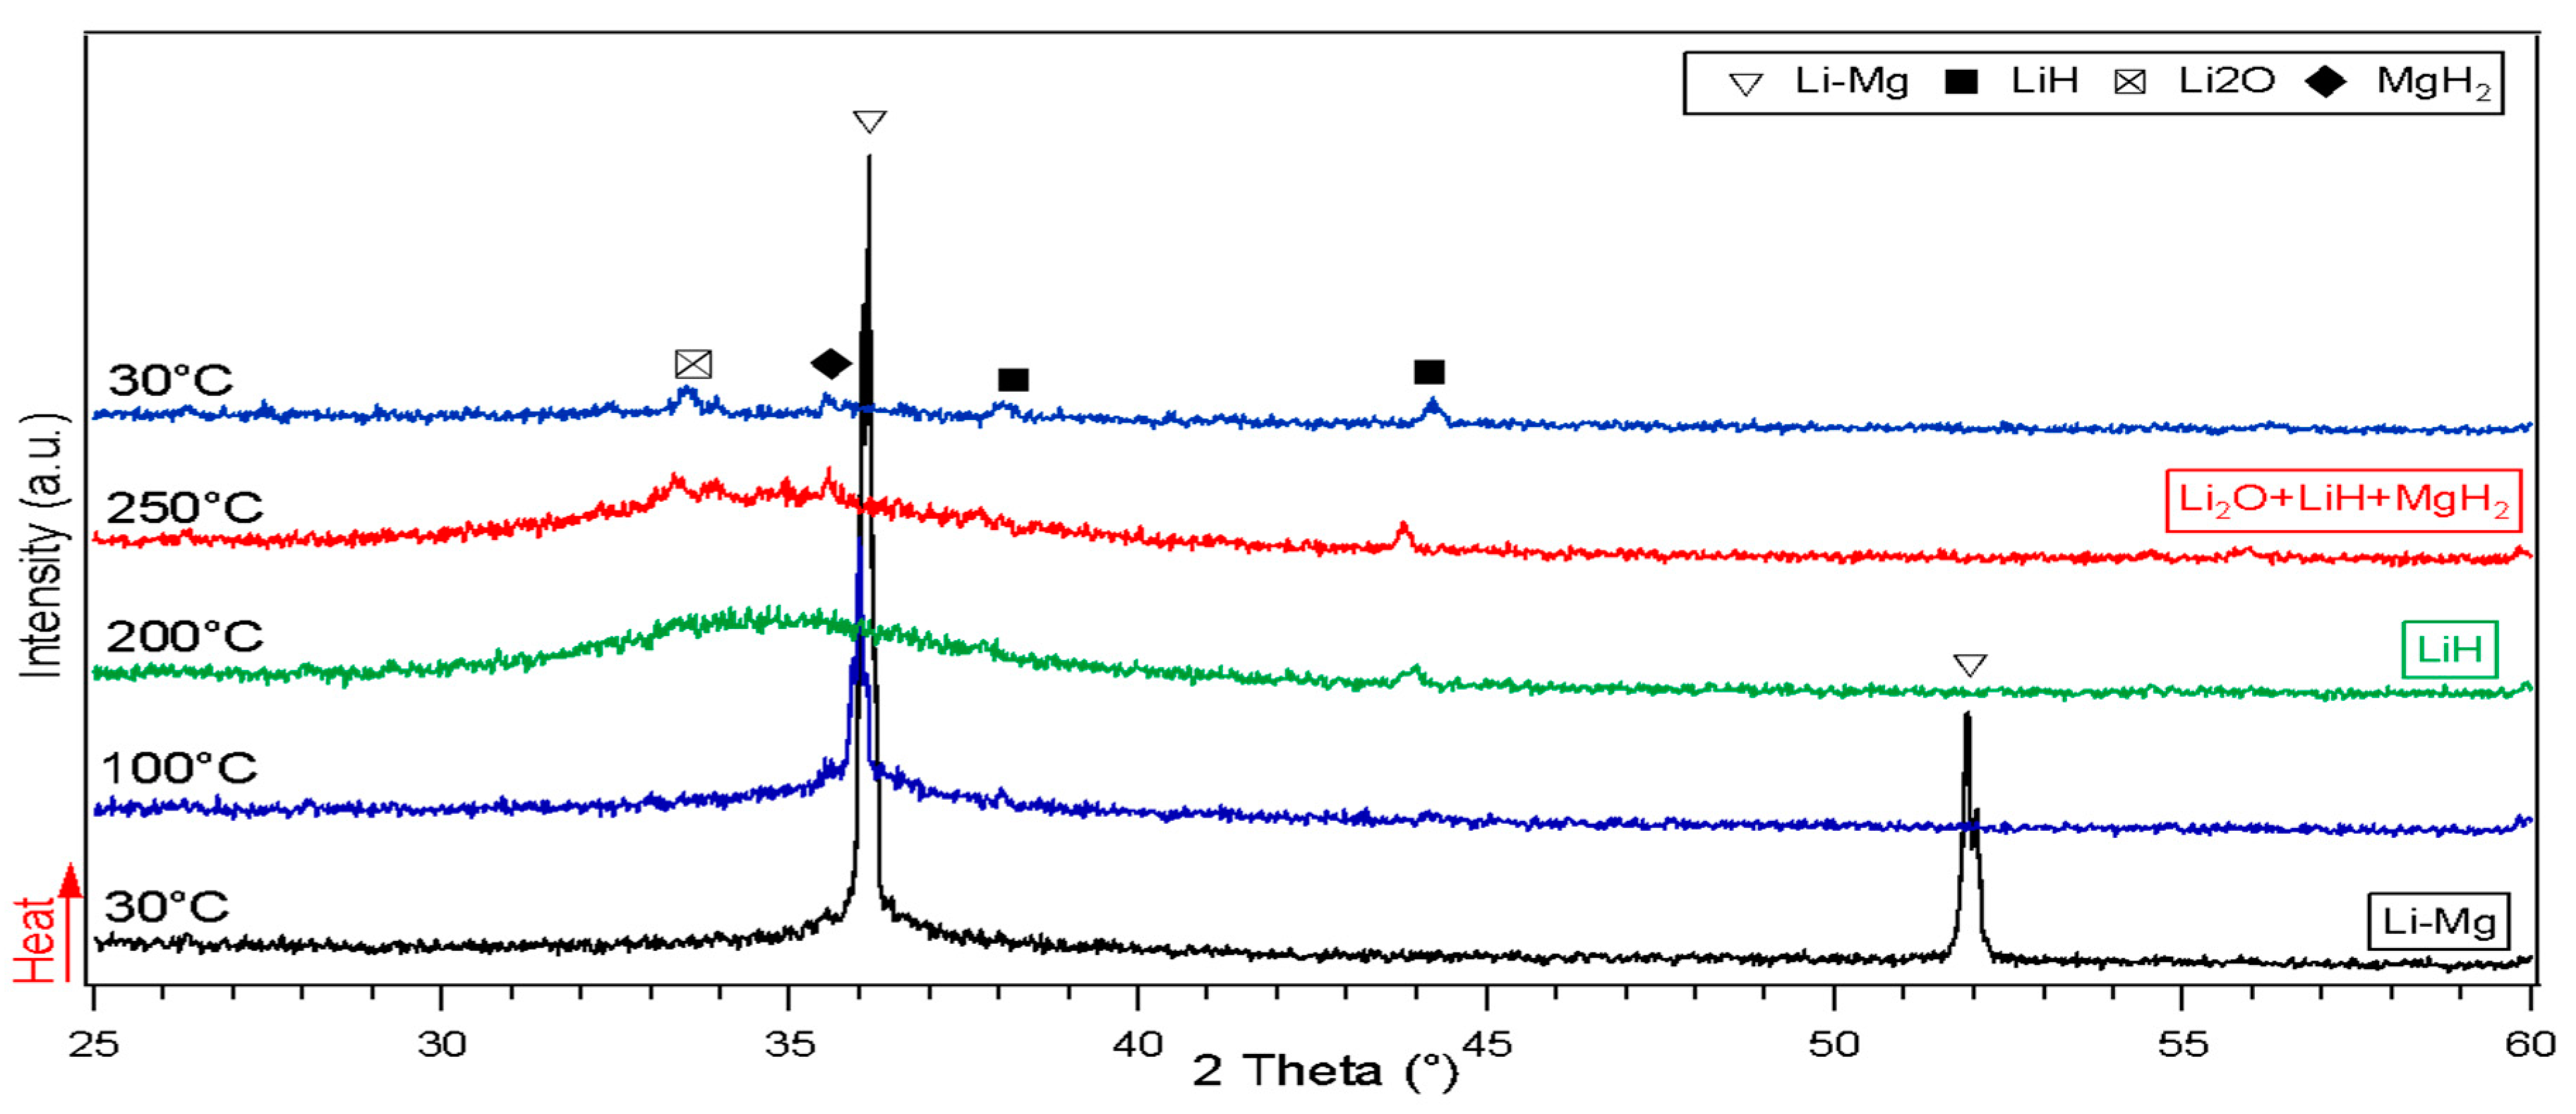
Figure 7.
Decomposition reactions observed after in-situ XRD of the 1 h milled (100 bar H2) Li-Mg under 3 bar H2 flowing at 100 mL/min. Measurements taken from 30 ˚C to 250 ˚C. Inset shows the shift in the Li-Mg phase.
Figure 7.
Decomposition reactions observed after in-situ XRD of the 1 h milled (100 bar H2) Li-Mg under 3 bar H2 flowing at 100 mL/min. Measurements taken from 30 ˚C to 250 ˚C. Inset shows the shift in the Li-Mg phase.
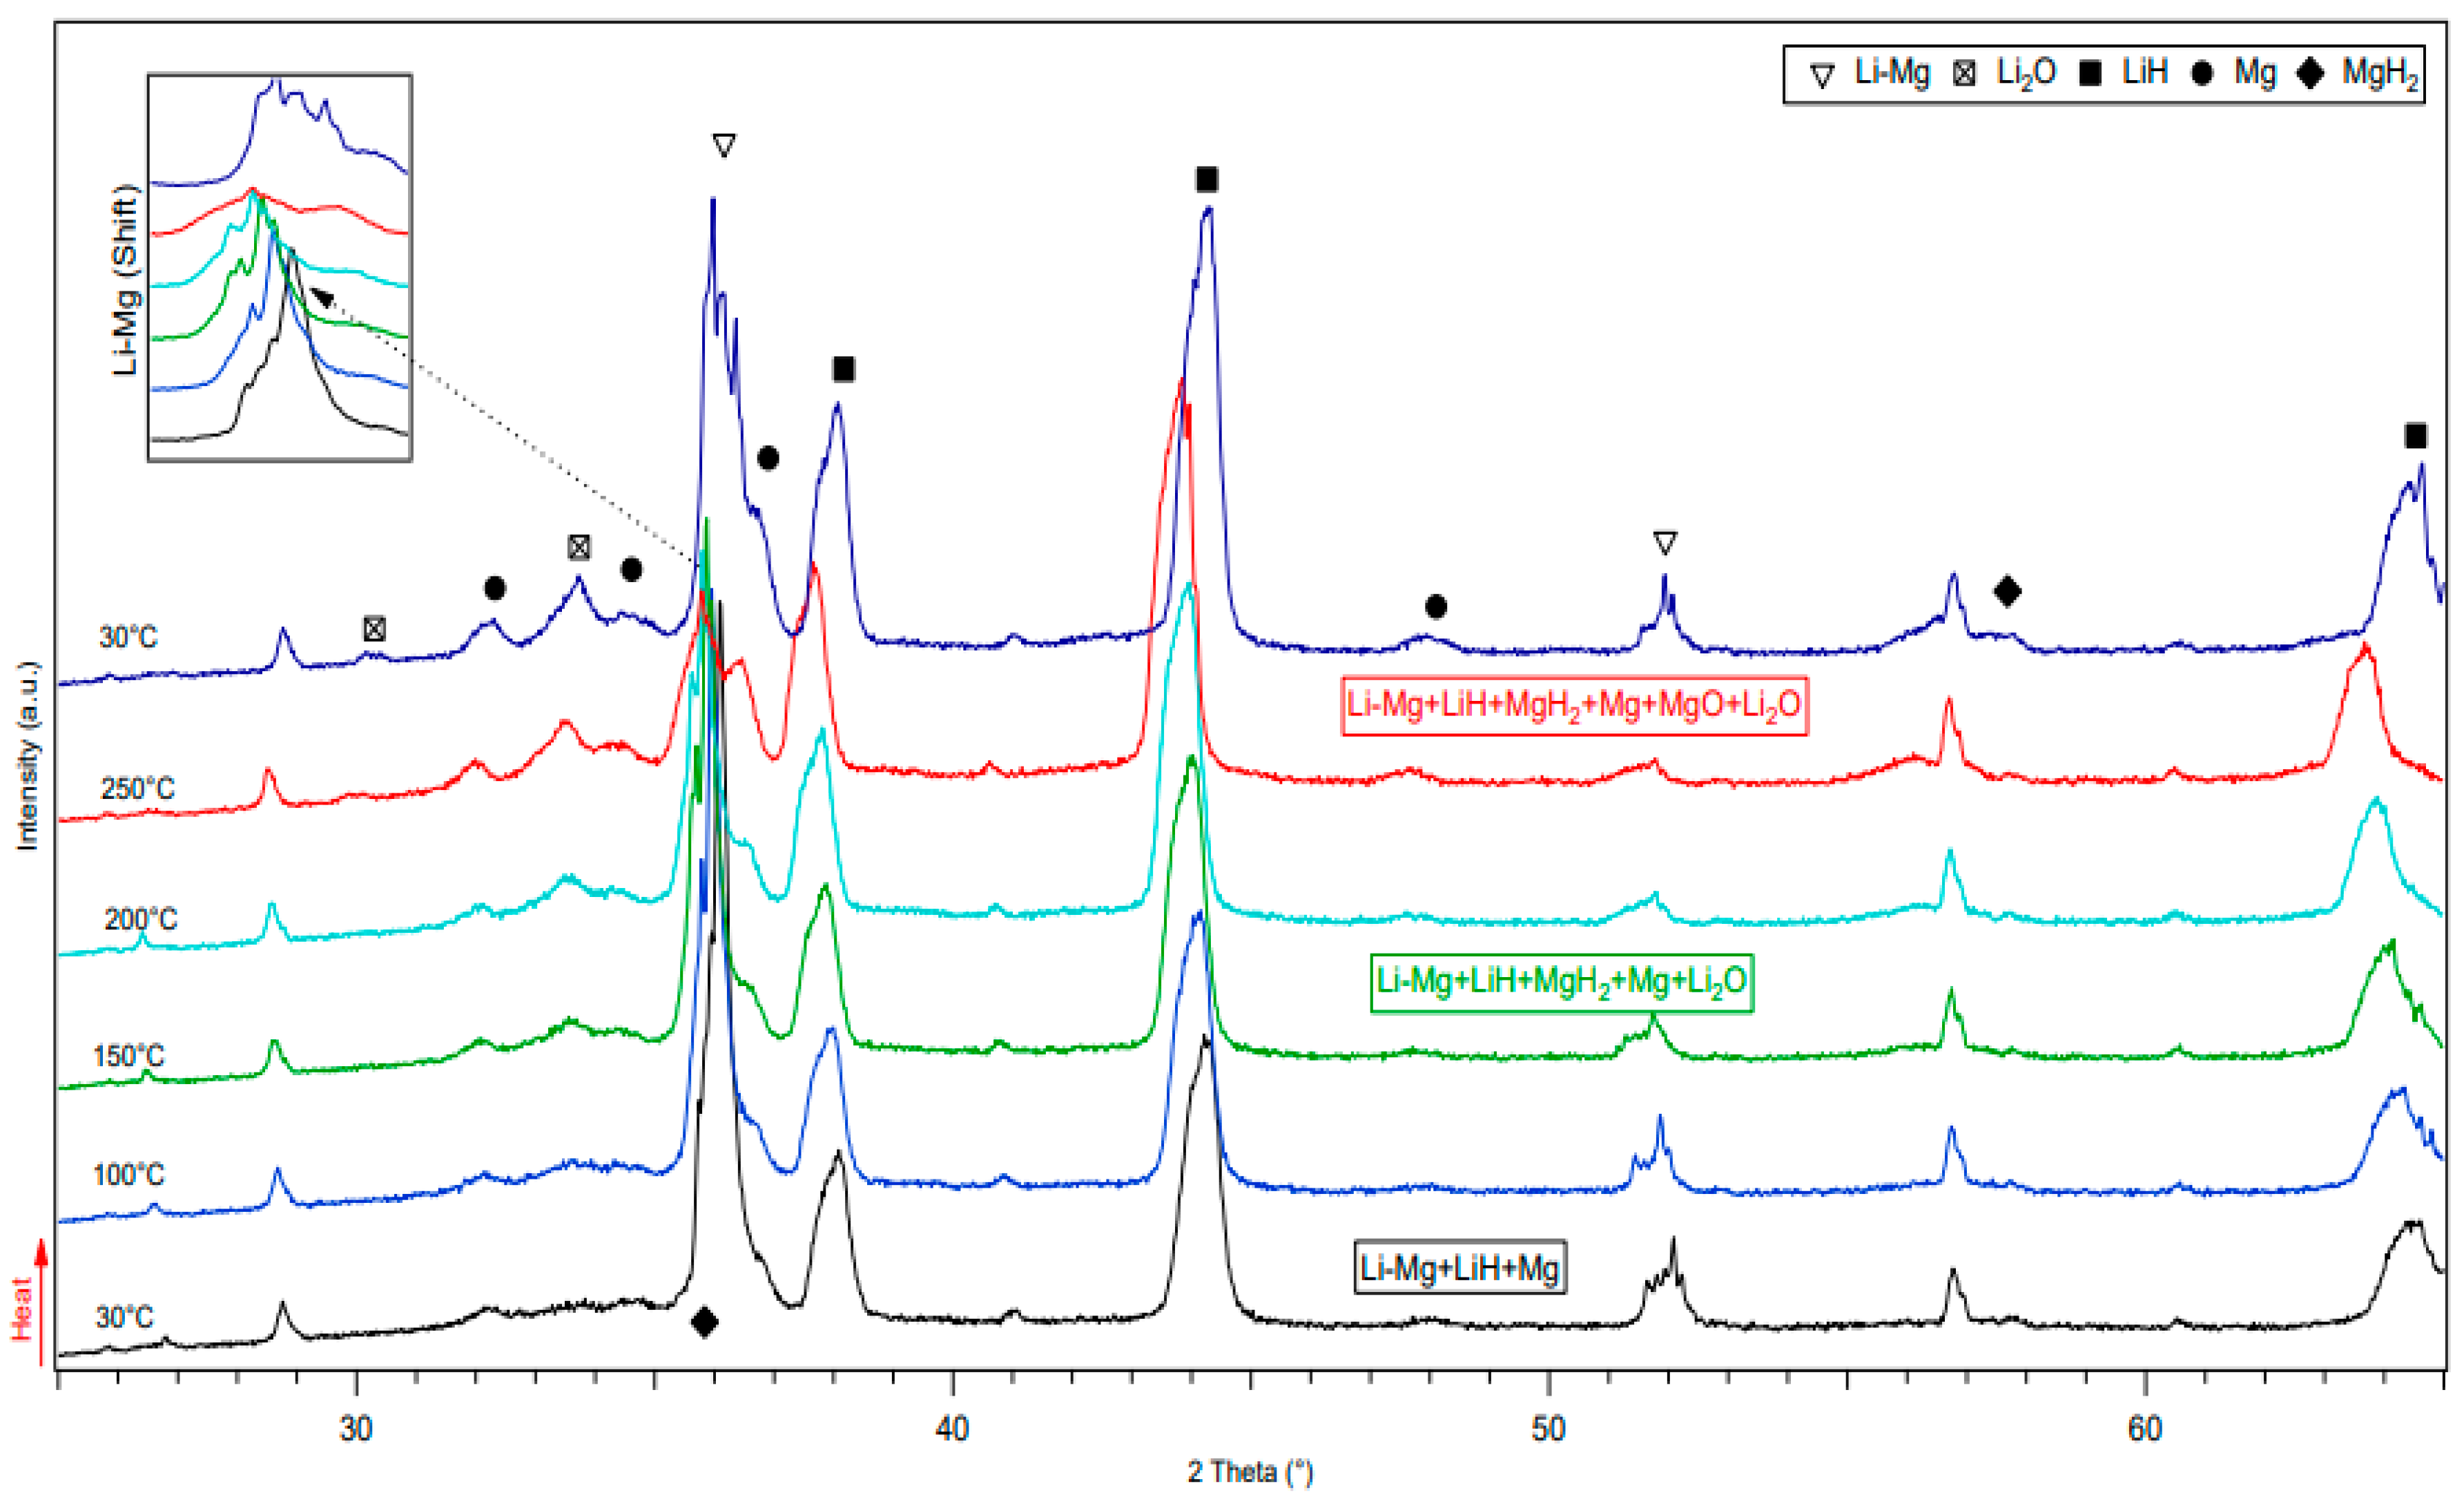
Figure 8.
Unit cell volumes in function of temperature for Li-Mg (green line), LiH (red line), Mg (black line) and MgH2 (blue line) phases of Li-Mg sample milled for 1 h (100 bar H2). Error bars that are not displayed are smaller than data symbols.
Figure 8.
Unit cell volumes in function of temperature for Li-Mg (green line), LiH (red line), Mg (black line) and MgH2 (blue line) phases of Li-Mg sample milled for 1 h (100 bar H2). Error bars that are not displayed are smaller than data symbols.
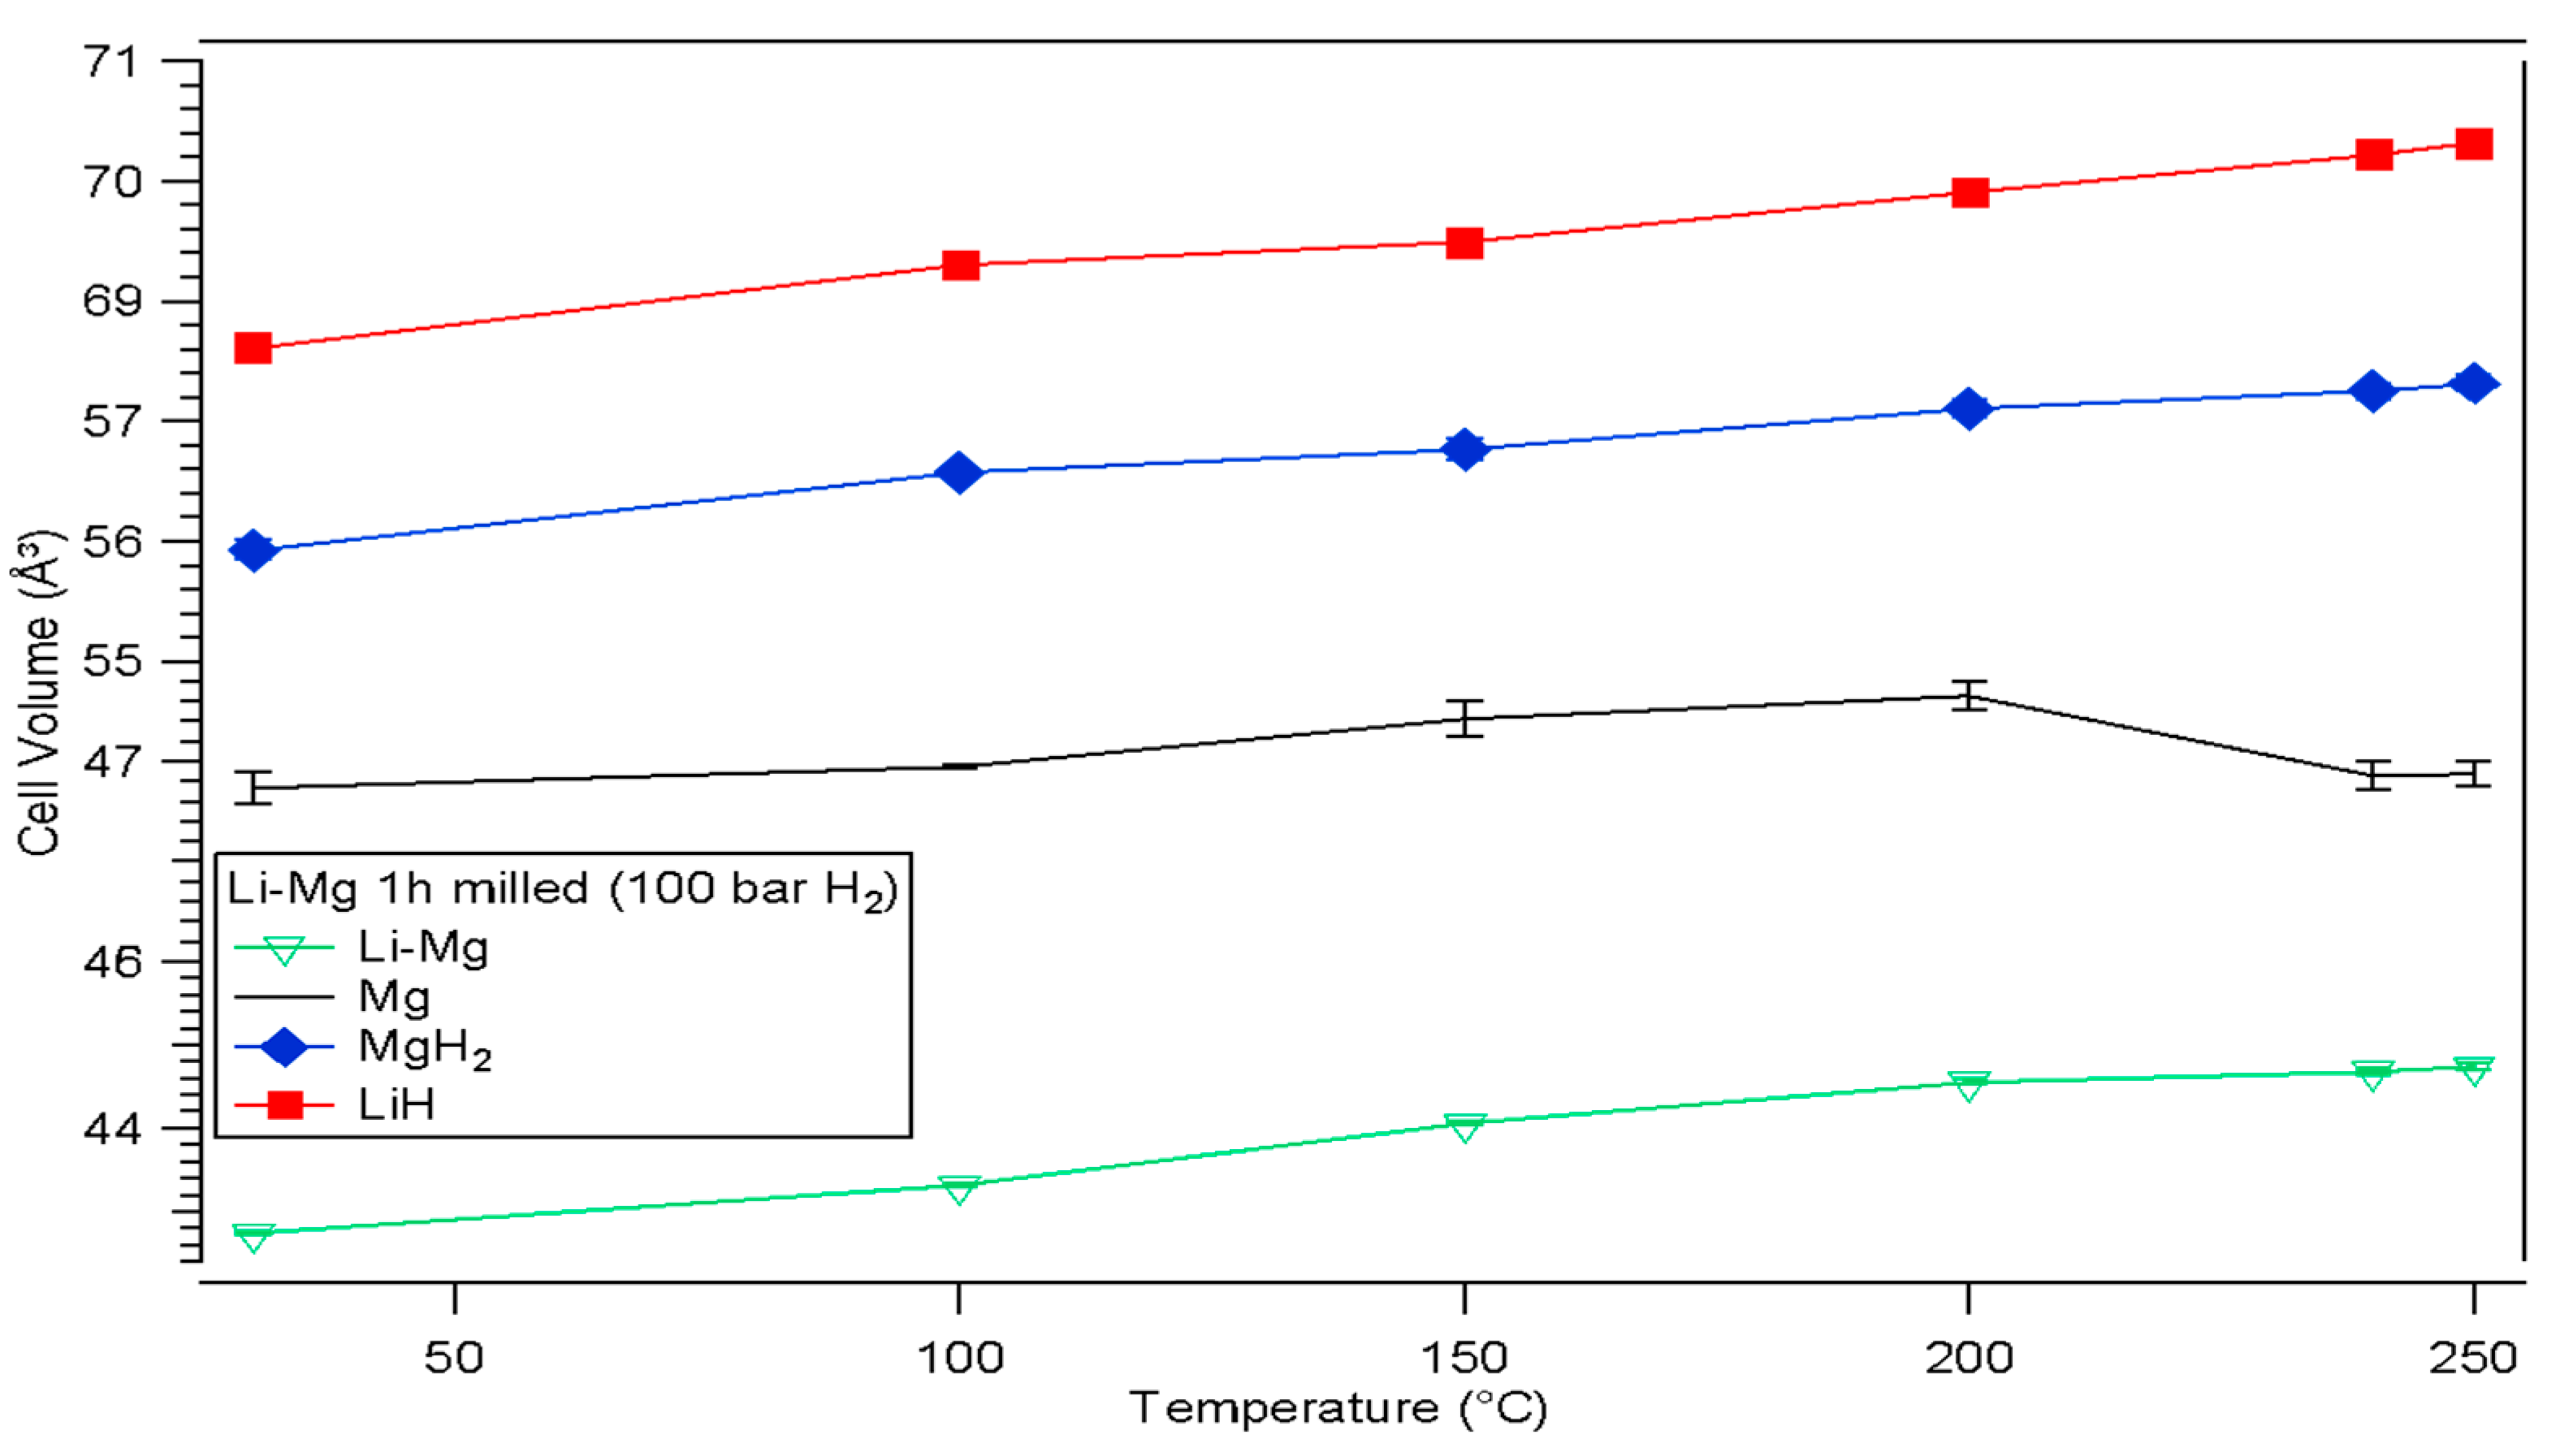
Figure 9.
Unit cell parameters a (red line), c (blue line) of 1 h milled (100 bar H2) Li-Mg sample in function of temperature.
Figure 9.
Unit cell parameters a (red line), c (blue line) of 1 h milled (100 bar H2) Li-Mg sample in function of temperature.
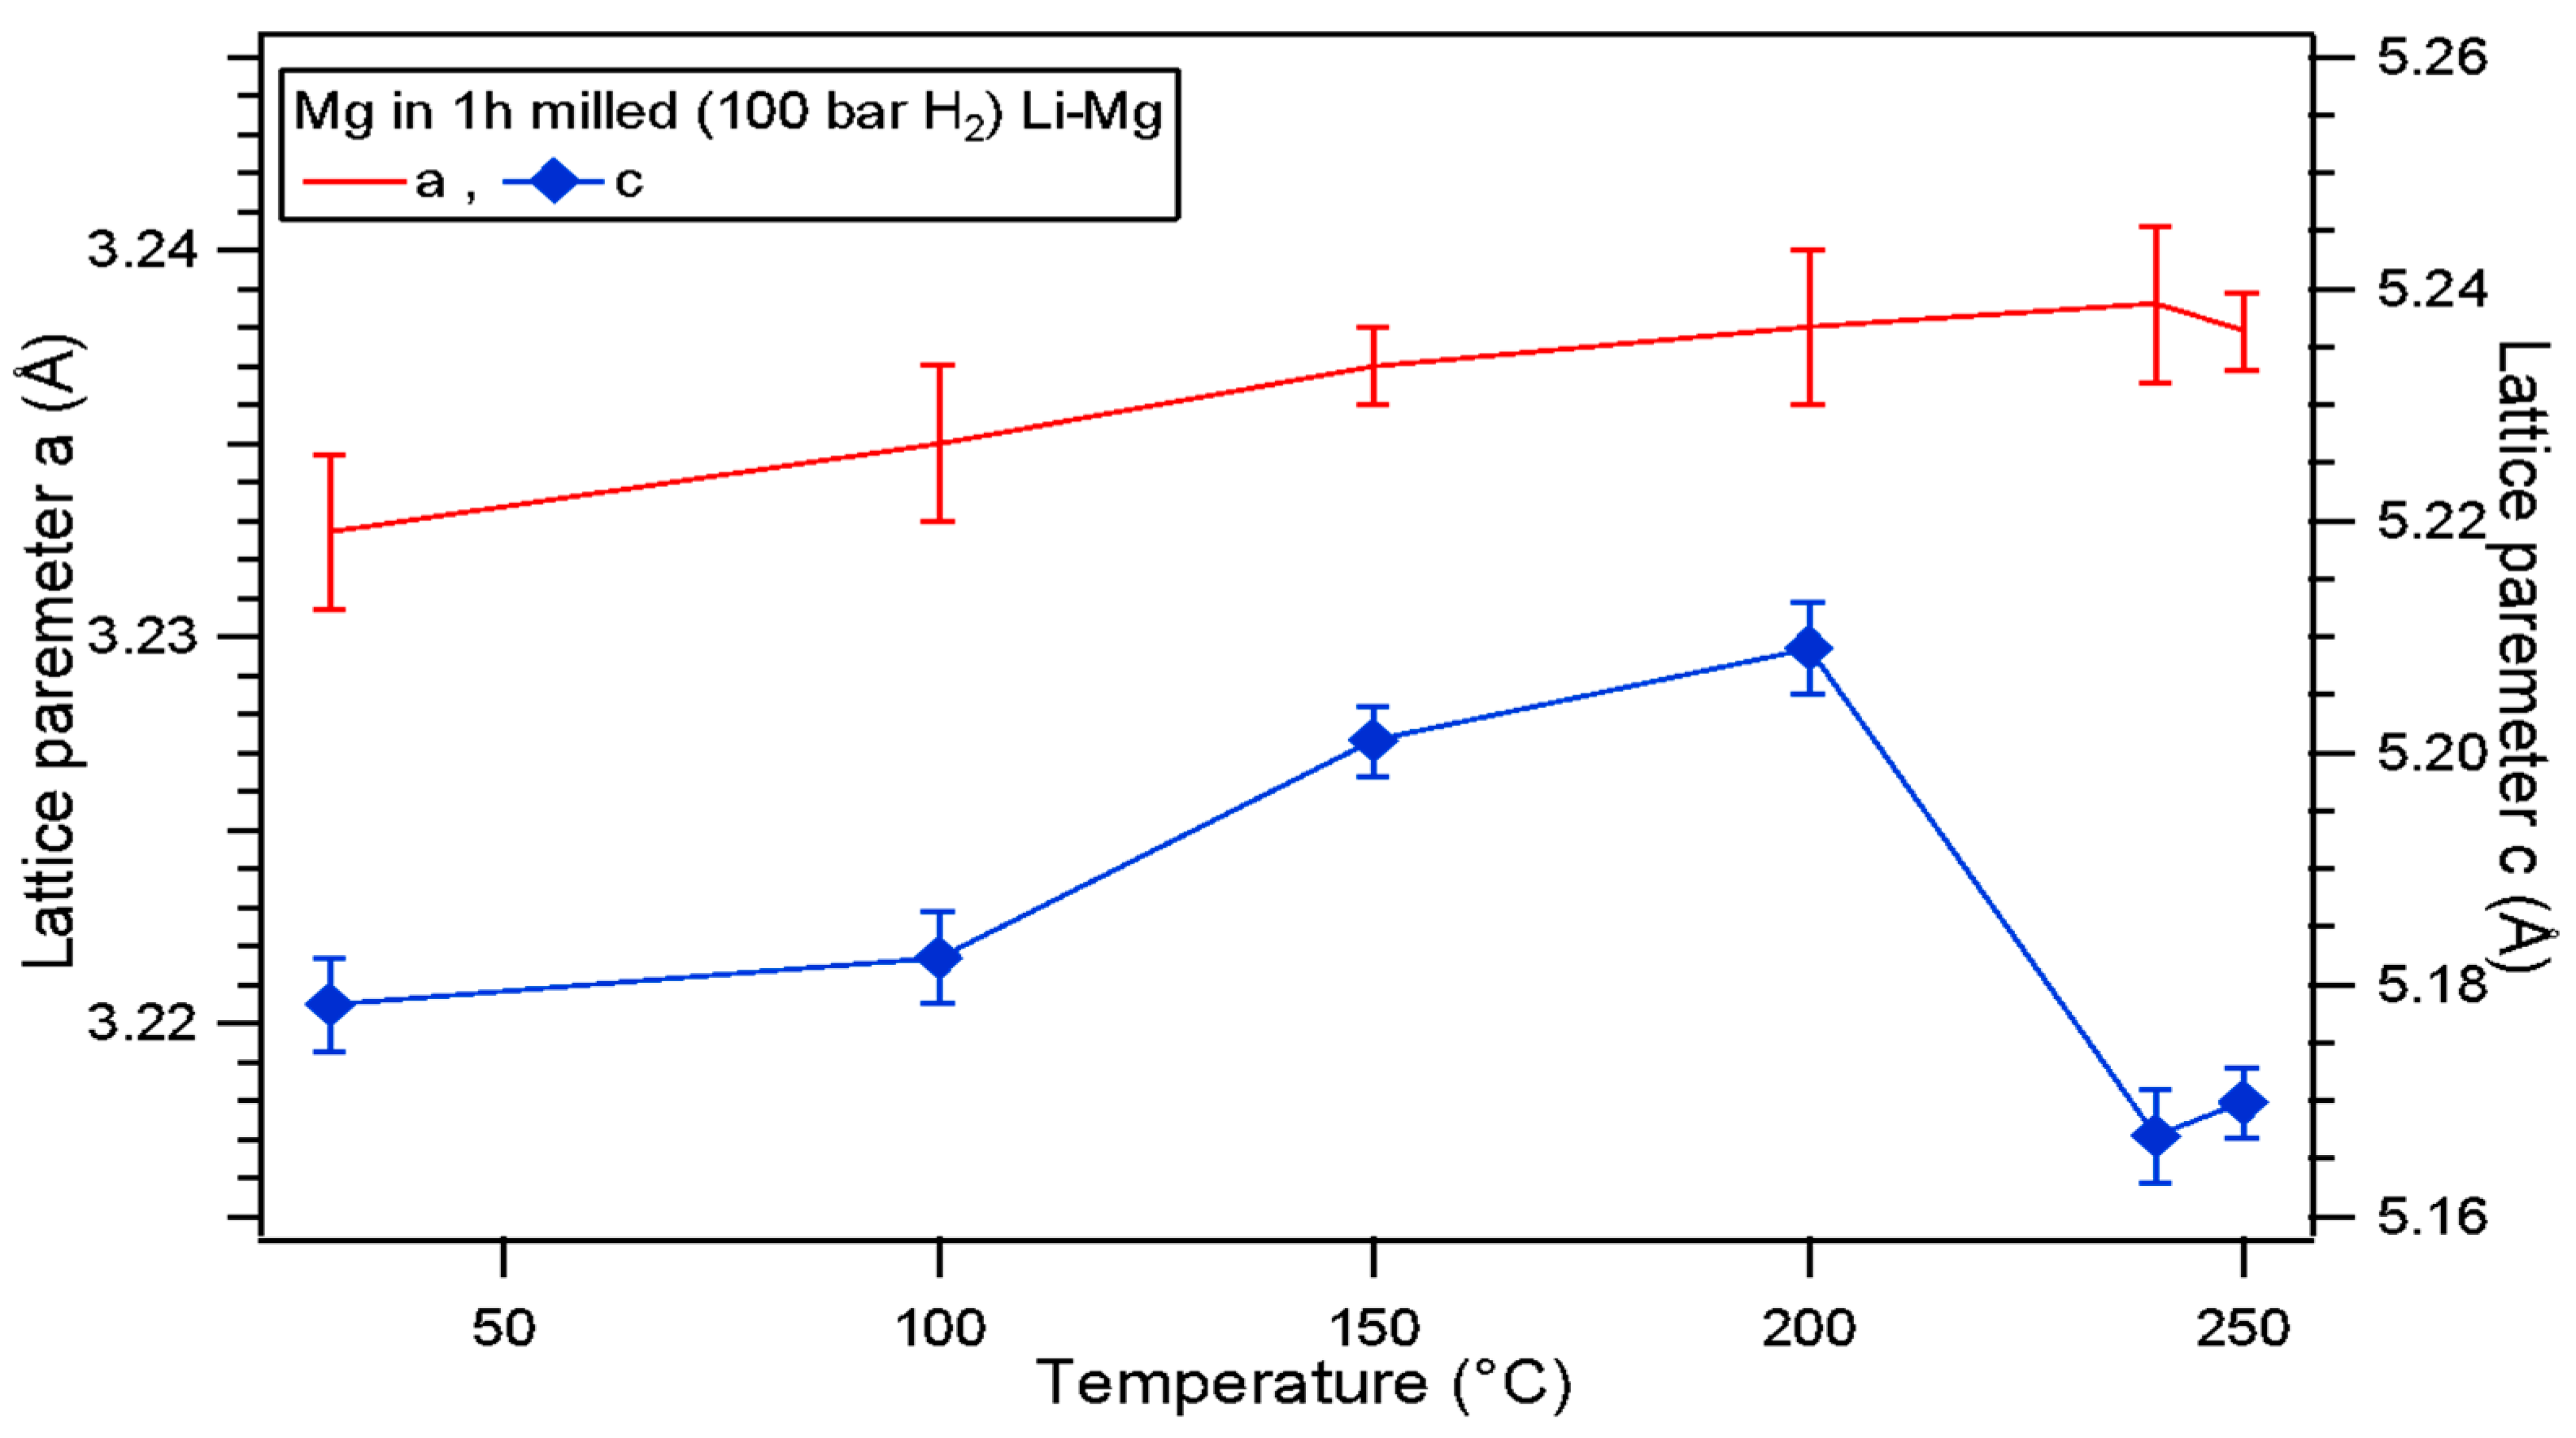

Table 1.
Lattice parameters and cell volume of as received and 1 h milled Li-Mg.
| Atmosphere | Li-Mg ribbon (This Work) | |||||||
| 100 bar H2 | Milling Time (h) | Lattice parameters (Å) | Cell Volumes V (Å3) | |||||
| Li-Mg Ribbon | Mg | LiH | Li-Mg Ribbon | Mg | LiH | |||
| (a) | (a) | (c) | (a) | |||||
| 0 | 3.52±0.01 | N/A | N/A | N/A | 43.4±0.1 | N/A | N/A | |
| 1 | 3.51±0.01 | 3.22±0.01 | 5.3±0.1 | 4.09±0.01 | 43.3±0.1 | 47.8±0.1 | 68.5±0.1 | |
| Literature [26] | ||||||||
| Lattice parameters (Å) | Cell Volumes V (Å3) | |||||||
| Li-Mg Ribbon | Mg | LiH | Li-Mg Ribbon | Mg | LiH | |||
| 3.51(6) | 3.20(2) | 5.20(4) | 4.08(3) | - | 46.2(1) | 68.0(1) | ||
Table 2.
Desorption temperatures (onset, peak and end) and hydrogen release from as-received and milled Li-Mg samples.
Table 2.
Desorption temperatures (onset, peak and end) and hydrogen release from as-received and milled Li-Mg samples.
| Atmosphere | Milling Time (h) | DSC | TGA | ||
|---|---|---|---|---|---|
| Ton(°C) | Tpk(°C) | Tend(°C) | wt (%) H2 | ||
| Ar | Li-Mg (exo) | 188 | 192 | 197 | N/A |
| Li-Mg (endo) | 197 | 198 | 200 | ||
| 1 (100 bar H2) Li-Mg | 189 | 194 | 210 | 0.19 | |
| Literature | 1 (100 bar H2) Li-Mg | 284 | 0.17 | ||
Disclaimer/Publisher’s Note: The statements, opinions and data contained in all publications are solely those of the individual author(s) and contributor(s) and not of MDPI and/or the editor(s). MDPI and/or the editor(s) disclaim responsibility for any injury to people or property resulting from any ideas, methods, instructions or products referred to in the content. |
© 2024 by the authors. Licensee MDPI, Basel, Switzerland. This article is an open access article distributed under the terms and conditions of the Creative Commons Attribution (CC BY) license (http://creativecommons.org/licenses/by/4.0/).
Copyright: This open access article is published under a Creative Commons CC BY 4.0 license, which permit the free download, distribution, and reuse, provided that the author and preprint are cited in any reuse.


