
Submitted:
26 July 2023
Posted:
27 July 2023
You are already at the latest version
Abstract
In this study, we successfully obtained a 2Mg-Fe mixture through mechanical alloying (MA) and processed it via accumulative roll bonding (ARB) (MA+ARB). Our primary focus was to analyze the impact of ambient air exposure while also evaluating the processing route. Some powder samples were exposed to air for 12 months before undergoing ARB processing. The Mg samples obtained after ARB processing exhibited a (002)-type texture. Our results demonstrate that all samples, including those processed via ARB, could rapidly absorb hydrogen within a matter of minutes, despite considerable differences in surface area between powders and rolled samples. ARB-processed samples reached approximately 60% of their maximum acquired capacity within just 24 minutes, compared to powders stored for a year which took 36 minutes. Also, the desorption temperatures were lower than those of MgH2. The absorption and desorption kinetics remained fast even after prolonged exposure to air. Although there were minor variations in capacities, our overall findings are promising since scalable techniques such as ARB have the potential to produce hydrogen storage materials that are both safe and cost-effective in a highly competitive market.
Keywords:
2MgFe
; complex hydride
; oxidation
; accumulative roll bonding (ARB)
; texture
1. Introduction
The use of Mg-based hydrides as hydrogen storage materials is quite promising. These materials are reversible and cost-effective with high volumetric and gravimetric capacities (MgH2: 7.6 wt.% of H, Mg2FeH6: 5.5 wt.% of H). However, their use has some drawbacks, such as slow kinetic rates and high hydrogen absorption/desorption temperatures. Additionally, Mg-based hydrides are prone to oxidation in air, and surface oxides can decrease their hydrogenation kinetics and capacities. Fortunately, developing nanostructures through mechanical alloying (MA) or severe plastic deformation (SPD) methods has significantly improved their kinetics.
When it comes to creating alloys and metallic nanocomposites, mechanical alloying has proven to be a highly effective method [1,2]. Research conducted by Schulz et al. has demonstrated that ball milling can significantly reduce the activation energy required from 156 kJ.mol-1 to 120 kJ.mol-1 [3]. Reactive milling, whereby additives like Fe are introduced under a hydrogen atmosphere, has been shown to enable the formation of the Mg2FeH6 complex hydride. This hydride has a lower dissociation pressure than MgH2 and displays good cyclability due to the insolubility of Mg and Fe [4,5,6,7,8]. Adding Fe can lower the temperature required for H-desorption in MgH2 and the activation energy for MgH2 decomposition [7,8,9]. Furthermore, it prevents agglomeration during mechanical alloying. It should be noted, however, that the MA process can be costly, and the resulting powders may display poor air resistance (i.e., high reactivity) [10].
Nanostructures and defects in Mg-based compounds or hydrides can be produced through Severe Plastic Deformation (SPD) methods [10,11,12,13,14,15]. Accumulative Roll Bonding (ARB) is a promising SPD method to upscale Mg-based hydrogen storage materials. This method not only refines the microstructure but also enables the production of bulk samples from powders that are less reactive to air than the precursor powders. It is important to note that cold rolling (CR) can also produce bulks, despite not undergoing refinement. While ball milling is an option, ARB offers several benefits, such as creating a sub-micrometer-ordered structure or even a nanostructure. ARB and CR make a high density of defects, such as dislocations, stacking faults, twining, texture, or preferred orientation along the (002) plan of Mg parallel to the rolling direction. These characteristics in the structure improve the diffusion/kinetics of reactions and lower H-desorption temperature [13].
Numerous studies conducted by various authors [10,11,12,13,16,17,18,19,20,21] have explored the impact of rolling methods on enhancing the initial hydrogenation (activation) properties. It has been observed that the (002) texture in Mg facilitates faster activation without incubation periods [22,23]. The presence of dislocations, vacancies, stacking faults, preferred orientation and twining in the sub-micrometer substructures of Mg results in improved kinetics and a lower temperature required for H-desorption. Although the bulk form of the as-rolled sample exhibits a lower surface/volume ratio compared to its powdered counterparts, this could be advantageous for scaling up Mg materials as it reduces the adverse effects of contact with air, resulting in better air resistance (reduced oxide/metal content) [11,13].
In a study by Lang and Huot [10], MgH2 powders were analyzed after being processed through cold rolling (5 passes) and ball milling (30 min). The results showed that the H-absorption kinetics of the as-rolled and as-milled samples were almost comparable. However, excessive passes (more than 25 passes) decreased kinetics and capacities due to the formation of oxides, which slowed down the process. Therefore, limiting the number of passes is recommended if the procedure is performed in the air.
Research shows that combining various processing methods can enhance activation kinetics through synergistic effects. In a study by Lima-Andreani et al. [19], a 2Mg-Fe nanocomposite sample produced through ball milling (MA), hot extrusion (EX), and ARB (MA+EX+ARB) exhibited improved hydrogenation properties compared to the precursor milled powder. In a subsequent study [20], the researchers examined the effect of adding CNT (1, 2, and 5 wt. %) to the 2Mg-Fe nanocomposite and using different processing routes (MA, MA+EX, MA+EX+ARB, and MA+ARB)—the sample with 5 wt.% CNT processed through the MA+ARB route demonstrated the best results, achieving 73% of the theoretical capacity of Mg2FeH6.
In a study by Floriano et al. [21], pure Mg powders were processed through 40 passes of CR under an inert atmosphere, followed by a short 20-minute ball milling step (CR+HEBM combination). The microstructure of the resulting samples was significantly refined to 4-7 nm. These samples were then activated at 623 K (350°C) under a hydrogen pressure of 2 MPa for absorption. The Mg-CR sample absorbed 1.2 wt.% after 12 hours. In contrast, Mg-CR+HEBM achieved 5.7 wt.% (80.3% of its total capacity) after only 3 hours, indicating a remarkable improvement in absorption rate. Moreover, Mg’s (002) texture was preserved after ball milling. As a result, the activation kinetic curves did not show any incubation times, suggesting that the samples’ surfaces were free or had minimal oxide contamination, which is one of the advantages of the (002) texture [22,23].
Several researchers have examined Mg-based hydrides that were deliberately exposed to air. These hydrides are vulnerable to air and moisture, and it would be challenging to prevent air contamination during processing, handling, or storage in large-scale production. In 2011, Vincent and Huot [24] conducted an experiment involving MgH2 powder. They cold-rolled it five times and ball-milled it for 30 minutes to 10 hours, all while exposed to air (which they called a “worst-case scenario”). They discovered that the formation of MgO was the primary reason for reduced hydrogen capacity. However, they also noted that air-milled and argon-milled samples exhibited similar H-sorption kinetics for short milling times (30 min). Air contamination did not significantly impact kinetics and capacities [24].
In 2018, Jung et al. [25] conducted experiments on 2Mg-Fe (molar ratio) powder mixtures by cold rolling in air, with varying numbers of passes (0, 10, 30, and 50 times). The hydrogenation measurements were taken at 673 K under a hydrogen pressure of 60 bar for 6 hours. The formation of both MgH2 and Mg2FeH6 was only detected in samples rolled 30 and 50 times. As the number of passes increased, microstructures were refined, and the layers of Mg and Fe became thinner, resulting in a more extensive interface area, contributing to the kinetic of hydride formation. However, with more passes, the amount of MgO increased, resulting in less unreacted Mg available to form MgH2, leading to fewer hydrides forming. In 2016, Suarez-Alcantara et al. [26] prepared Mg-Fe (Fe: 3 and 6 wt.%) by MA and studied the intentional storage in air exposition for 12 hours. Capacities were measured by gravimetric methods at 623 K (350°C) and 3 MPa of H2. Pure Mg, Mg-Fe (3 wt.%), and Mg-Fe (6 wt.%) had capacities of 5.3, 5.6, and 6.2 wt.% of H, respectively.
According to Czerwinski [27], the growth of oxide in Mg alloys depends on the duration and temperature of exposure in oxidizing environments. When formed, MgO has an amorphous structure at room temperature, which provides better protection than a crystalline one. The initial MgO formed has a higher ratio of Mg to O than bulk MgO due to an oxygen deficiency. Reaching the full stoichiometric MgO requires more prolonged exposure to high temperatures.
Our study examined how storage and processing in the air affect the hydrogenation properties of an as-milled powder mixture. Specifically, we prepared a 2Mg-Fe (molar %) nanocomposite through MA and stored the as-milled powders in the air for one year. The samples were then subjected to ARB processing in the air. We thoroughly characterized all samples regarding their structure, H-absorption (activation), and H-desorption properties.
2. Materials and Methods
Pure elemental powders of Mg (+4–30 mesh, 99.95%, Sigma Aldrich) and Fe (325 mesh, 97.35%, Höganäs) were mixed to produce a stoichiometric 2Mg–Fe composite by mechanical alloying (MA) in a high-energy planetary ball mill (Fritsch P5). The ball-to-powder ratio was 40:1, milling was carried out under an argon atmosphere for 20 h, and 2 wt.% of stearic acid was used as a process control agent (PCA). The powders were afterward sieved using a 180-mesh sieve.
As-milled samples (powders) were intentionally stored in the ambient atmosphere (in a glass desiccator), aiming to evaluate the effect of the exposition on the ambient atmosphere. An extended period of one year of exposition was used. These samples were named MA(y).
The samples MA(y) were cold-pressed to produce cylindrical pre-forms and then placed between two plates of electrolytic copper. The resulting “sandwiches” were subjected to ARB processing using a homemade rolling machine with a 50% reduction in each pass. In order to minimize oxide formation during rolling, 20 passes were made, as recommended in references [10,25]. The ARB process was intentionally carried out in the air. Following procedures for ARB, the as-rolled specimens were cut in half after each pass of deformation, superposed, and reinserted between the copper foils to maintain the form. The final product was MA(y)+ARB samples.
The hydrogen absorption properties were measured in a homemade Sieverts-type apparatus at 623 K (350°C) under a hydrogen pressure of 2 MPa, aiming for the formation of MgH2 and Mg2FeH6 [5]. The hydrogen desorption behavior of the samples was investigated by simultaneous differential scanning calorimetry–thermogravimetry–STA apparatus (TG-DSC; Netzsch, STA 449C) in an argon overflow regime.
The structural characterization was done by X-ray diffraction using monochromatic Cu Kα radiation (XRD; Rigaku, Ultima IV). The XRD profiles were treated by Rietveld refinement using the MAUD software [28,29]. Crystallite size and phase abundance were extracted from the Rietveld refinement analyses.
Microstructures were observed by scanning electron microscopy (SEM; FEI, INSPECT; Backscattered-Electron - BSE). In this analysis, we observed as-milled powders and as-rolled small plates (flakes) directly on their surface without any sample preparation.
3. Results and Discussions
In Figure 1, XRD patterns of samples MA(y) and MA(y)+ARB are shown after being exposed to air for one year, which is the most severe scenario for oxidation. Based on the XRD patterns, it was observed that all samples, including MA(y) and MA(y)+ARB, exhibited only the peaks of Mg (76145-ICSD) and αFe (64795-ICSD). Magnesium oxide may be identified, as expected for Mg oxidation at room temperature [27], by a shallow amorphous halo at around 2θ=42o (9863- ICSD), indicated in the Figure by a blue ellipse, and more intense in the rolled condition. Such a low intensity is likely due to the relatively small volume fraction of these phases (expected mainly in the sample’s surface) and the possible lack of fully-developed long-range order in these oxides under these conditions. The increased intensity of the oxide halo in the as-rolled sample may be explained by its breaking and concentration on the surface, as seen in Figure 2b. Jung et al. [25] did not detect any MgO in their XRD diffraction patterns, even after cold rolling (10X to 50X) 2Mg-Fe composites in an ambient air atmosphere. However, the diminishing intensity of the Mg peaks with each pass led them to conclude that the amorphous MgO formed consumed the magnesium.
Comparing XRD patterns of MA(y) and MA(y)+ARB (Figure 1), this later as-rolled sample showed a strong preferential orientation along the (002) diffraction peak of Mg, indicating that the c-axis of the Mg-hcp crystal structure is oriented perpendicularly to the rolling direction. This preferred orientation is favorable to hydrogen absorption during activation, and this texture is expected to develop in Mg alloys processed by rolling processes [11,12,13,16,19,20,24].
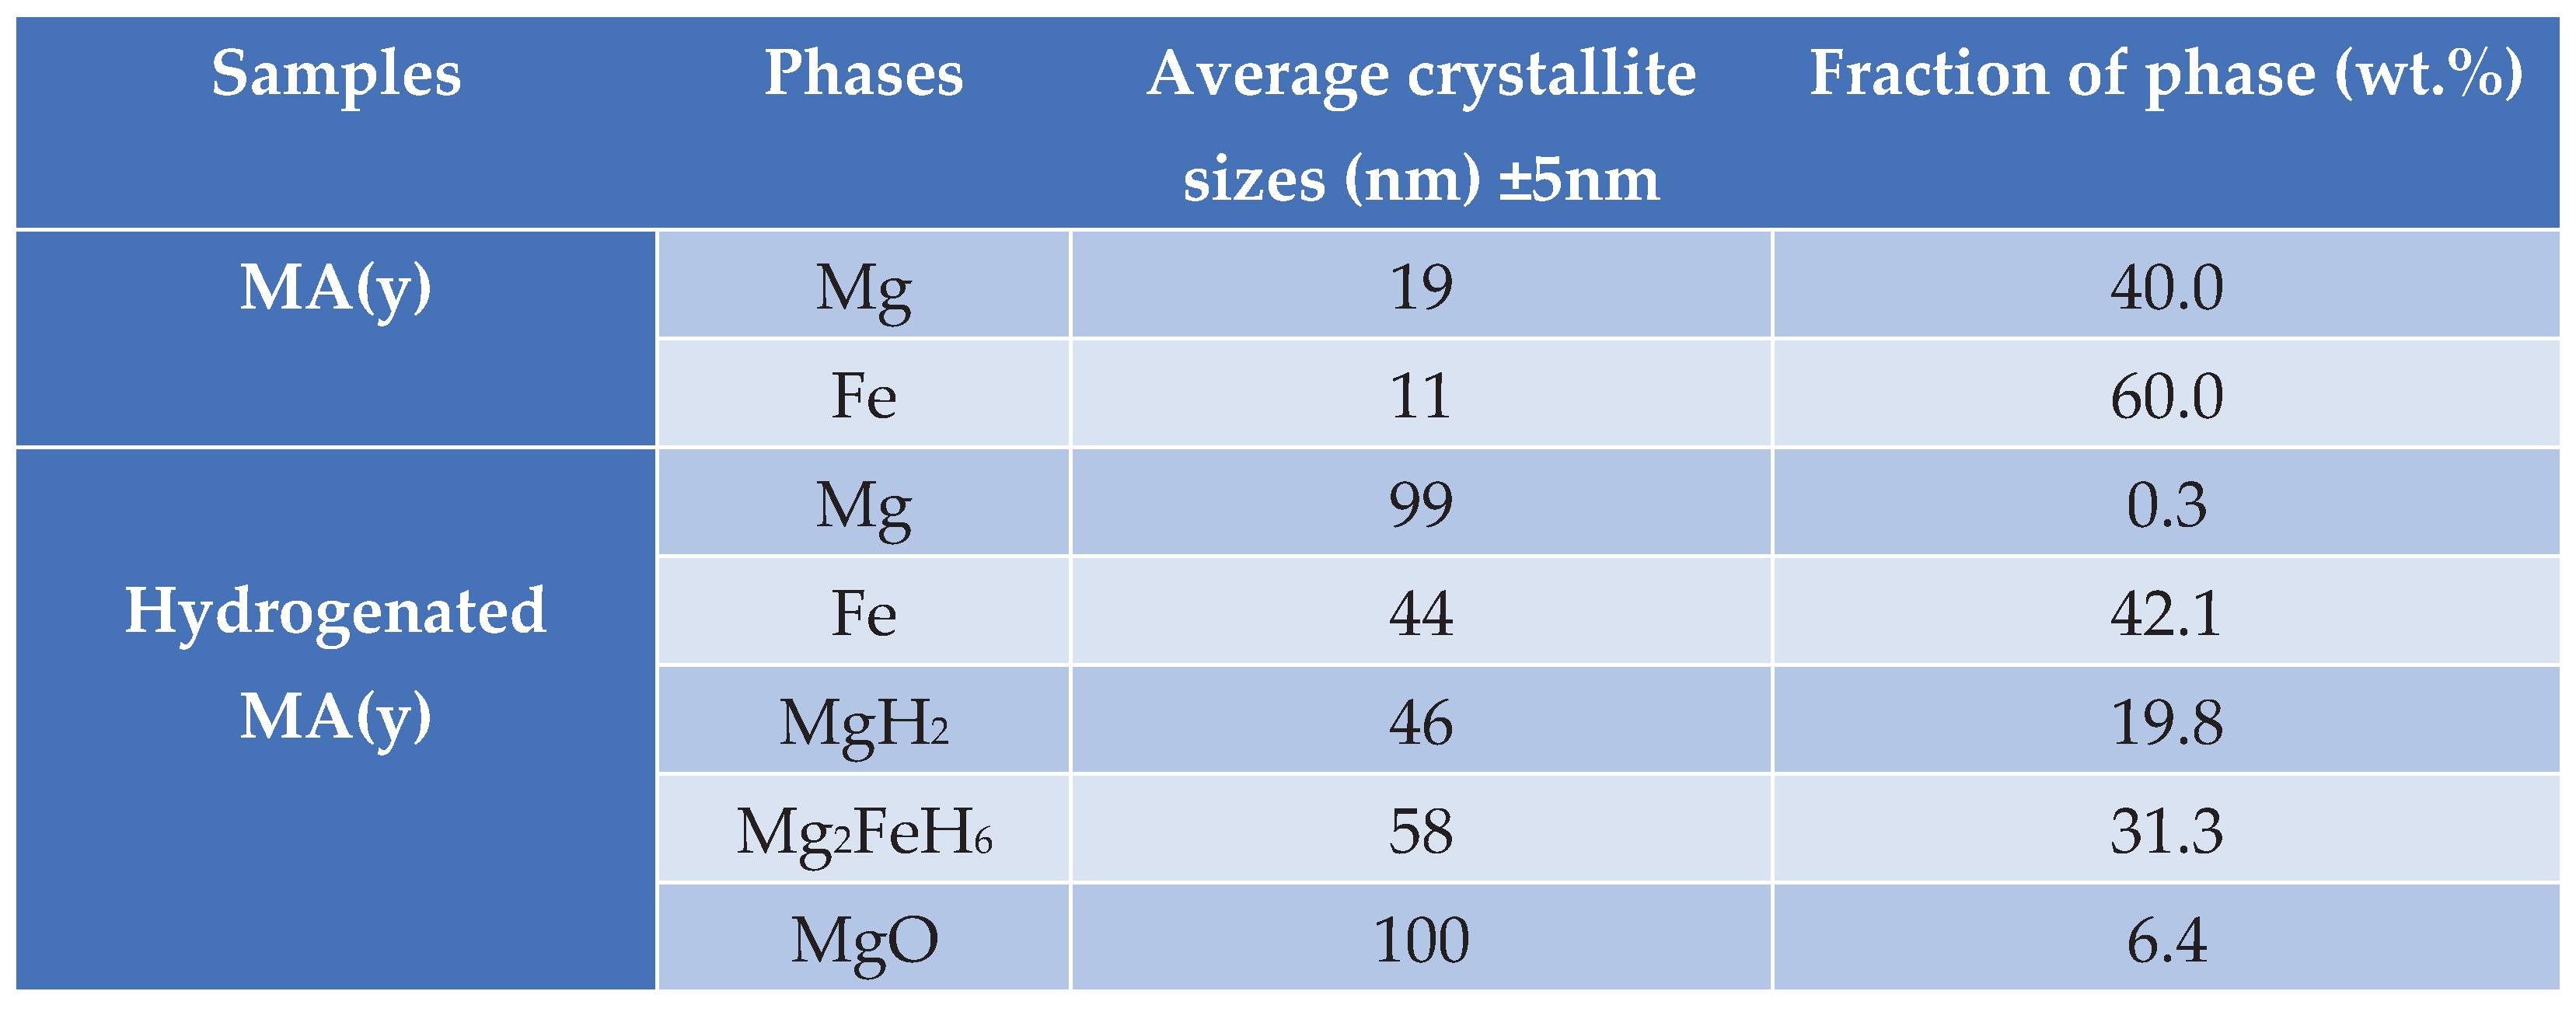
The results of the Rietveld refinement analysis indicate that the MA processing effectively refined the crystallite size of both Mg and αFe to a nanometric scale level. The calculations showed that the average size of Mg crystallites was 19 nm, accounting for 40 wt.%, while the average size of Fe crystallites was 11 nm, accounting for 60 wt.%. The Rietveld analysis was not performed for as-rolled samples because of the strong texture for Mg observed in their XRD patterns. However, it is expected for as-rolled samples to have similar or even smaller crystallite sizes after ARB (20 passes) due to the additional deformation.
The SEM micrographs of samples MA(y) and MA(y)+ARB that were air-exposed for one year are presented in Figure 2. In Figure 2(a), it is evident that the particle sizes for MA(y) are very fine, measuring below 37 μm, with irregular morphology. The fine oxide layer covering the particle surfaces is not visible due to the electron beam interaction volume with the matrix, which masks the oxide signal. In pure Mg, the only oxide that forms is MgO. Due to Mg’s more potent reducing abilities than Fe, it is believed that the preferential oxidation of Mg leads to oxidation-induced chemical segregation, as stated by Czerwinski [27].
Figure 2(b) demonstrates the remarkable consolidation of particles through rolling processing with the MA(y)+ARB sample. The images exhibit a well-distributed presence of Fe, indicated by tiny brighter spots, which confirms the data in Figure 1 and its associated discussion. The rolling process effectively breaks down the fine oxide layer, redistributing it into small islands on the sample surface. These islands are observed through their interaction with the electron beam, producing the largest white regions due to a charging effect. However, fresh oxidation likely occurs during the rolling process, increasing the amount of oxides, as observed in the analysis in Figure 1. Jung et al. [25] also observed such a phenomenon, suggesting that oxidation increases when ARB (or cold rolling) is performed in the air, resulting in less Mg forming hydrides as MgO consumes it.
Samples of both MA(y) and MA(y)+ARB conditions were hydrogenated in a homemade Sieverts-type apparatus at 623 K (350°C) under a hydrogen pressure of 2 MPa. Figure 3 presents XRD patterns after such a procedure. Besides Fe, Mg, and MgO, already present and analyzed before, these XRD patterns revealed the presence of also MgH2 (26624-ICSD) and Mg2FeH6 (107500-ICSD) after hydrogenation. Notably, the crystallization of MgO (9863- ICSD) took place during the heating process for hydrogen absorption, whose crystalline peaks are indicated by the asterisks in the Figure. As previously discussed, the crystallization evidenced the most considerable yield of oxides in the rolled samples than in powders.
Table 1 clearly shows a noteworthy rise in the average crystallite size after carrying out a high-temperature hydrogenation treatment at 623 K, as evidenced by the Rietveld analysis results for XRD patterns of powders taken before and after hydrogenation. It is crucial to recognize that even with the rise, the nanoscale level remains, and it may not considerably impact the ultimate capacity or hydrogenation kinetics. More than 50% of the mixture was converted into hydrides (MgH2 or Mg2FeH6).
Figure 4a displays the H-absorption curves for samples MA(y) and MA(y)+ARB. It is worth noting that neither of the samples showed any incubation time, as also observed in our previous works [19,20]. Through its catalytic properties, Fe effectively facilitates the penetration of hydrogen by transposing the oxide barrier. Although there were some differences in initial kinetics, both samples had high rates of H-absorption and reached near saturation in roughly 6 hours (360 minutes). The maximum capacities attained after 14 hours were 3.7 wt.% for MA(y) and 3.0 wt.% for MA(y)+ARB, representing a decrease of approximately 19% in capacity. The reduction in capacity can probably be attributed to the thicker bulk samples, which obstruct complete hydrogen penetration [19,20,22]. Also, as stated above and confirmed in reference [25], oxidation increases when ARB is performed in the air, resulting in less Mg to form hydrides as MgO consumes it. This MgO is unevenly dispersed between the Mg and Fe interlayer regions and, as seen in Figure 2b, is observed to have broken and redistributed on the as-rolled sample’s surface in thick oxide islands, affecting the hydrogenation process and leading to decreased capacities.
To sum up, the decrease in capacity can be attributed to various factors. These include the notable variation in thickness (bulk and powders) [19,20,22], and the presence of thick oxide layers on the ARB processed samples (Figures 1, 2b, and 3), along with the development of new oxide interparticle’s layers and even on their surface during ARB processing, thus decreasing the amount of disposal Mg to form hydrides [25]. These factors collectively contribute to reducing the available amount of Mg for forming a hydride.
Thicker samples have decreased surface areas compared to powders, the hydrogen evolution into thicker specimens is hindered, and oxides consume Mg. Moreover, the formation of oxides before and post-ARB processing and the resulting layer concentrated in islands on ARB-processed materials from previously formed oxide layers is another crucial factor.
Czerwinski [27] discovered that the growth of oxide in Mg alloys depends on the duration and temperature of exposure in oxidizing environments due to several factors. The short-time-thinner and more compact amorphous structure of MgO at room temperature provide superior protection due to its more compact structure than a crystalline one. The initial MgO formed has a higher ratio of Mg to O than bulk MgO due to an oxygen deficiency. Prolonged exposure to high temperatures is required to achieve full stoichiometric MgO. In the beginning, the oxide growth happens quickly and then slows to a constant rate until the metal surface is completely covered. During this stage, the growth process relies on the diffusion of Mg2+ cations outward through the oxide layer. When temperatures are below 200°C, a dense layer of MgO forms during oxidation; such a layer, combined with slow lattice diffusion that restricts the movement of Mg2+ cations, creates an effective barrier that prevents hydrogen from penetrating the sample. With the growth of the oxide film, the surface of both the metal and oxide alters their structure. As Mg2+ cations disperse, they give rise to vacancies and voids at the metal-oxide interface, creating channels facilitating magnesium transportation. It is worth noting that this phenomenon can create stress points that may cause film cracking, making hydrogen penetration more likely.
Moreover, the difference in volume between the MgO film and the metallic substrate induces tensile stress and fissures. Therefore, oxidation is not reliant on the thickness of the scale, and it is believed that oxygen can penetrate, causing nonprotective oxidation. The compact oxide is replaced by uneven oxide ridges distributed over the metal surface, unrelated to the substrate features. The formation of ridges occurs when air enters through cracks and reacts with the metal, causing hills to grow outward. Prolonged exposure to high temperatures (or very long times) can make the oxide scale less protective and porous, allowing hydrogen to take advantage of the situation and improve capacities. This behavior is evident in as-ARB processed powder samples.
We meticulously investigated the impact of oxide thickness, porosity, and efficacy in hindering hydrogen permeation. Employing the same techniques as previously, we produced powders and preserved them for a month in an air atmosphere before exposing them to 20 passes of ARB processing. Afterward, the resulting samples, MA(m) and MA(m)+ARB, were hydrogenated similarly to the previous specimens (MA(y) and MA(y)+ARB). In this way, oxides effects were emphasized in the comparison because, as the ARB processed sample had the same thickness, its impact was eliminated. The comparison of hydrogenation behavior is illustrated in Figure 4b. It is evident that the MA(m) and MA(m)+ARB specimens displayed lower capacities in contrast to the MA(y) samples, solidifying the notion that the oxide formed post-short-term air exposure played a crucial role in obstructing hydrogen absorption. As predicted by Czerwinski [27], the MA(m) samples showcased a thinner yet more protective oxide layer, consequently leading to reduced capacity compared to MA(y) ones. However, as the amount of MgO was smaller in the MA(m), more Mg was prone to be hydride than MA(y)+ARB samples, thus leading MA(m) to a higher capacity than MA(y)+ARB. Nonetheless, the MA(m)+ARB sample’s broken thinner oxide layer probably generated fewer oxide scales on the surface when compared to the MA(y)+ARB specimen, resulting in an amplified capacity. During ARB, the previous oxide layer was broken, but a new thinner layer was formed again, increasing the capacity of MA(m)+ARB compared to MA(m) samples. In a previous study [[19], a similar outcome was observed for 2Mg-Fe that was processed using MA and a combination of MA+EX+CR, (EX=extrusion, CR=cold rolling) without exposing the as-milled sample to air. The as-rolled sample in bulk form displayed superior capacity compared to the as-milled samples.
Figure 4b indicates that, after 14 hours, the highest capacities achieved were 3.7 wt.% for MA(y), 3.4 wt.% for MA(m)+ARB, 3.2 wt.% for MA(m), and 3.0 wt.% for MA(y)+ARB. However, absorption kinetics are also crucial. In Fig. 4c, it is worth noting that samples MA(m)+ARB, MA(m), and MA(y)+ARB reached around 60% of their maximum acquired capacity in 24 minutes, while the sample MA(y) took 36 minutes. After this short initial period, sample MA(y) reached approximately 95% of its maximum acquired capacity in about 4 hours, while all others took around 6 hours. This behavior suggests that a porous oxide layer on the powder surface may maintain the hydrogenation property expected for powders of very high surface area compared to bulks. However, as also observed in Fig. 4c, ARB processing proved efficient in improving kinetics, likely due to the presence of the (002) preferential texture [11,12,13,19,20,22]. Despite their thickness (reduced surface area compared to powders) and thicker oxide scales accumulating on the surface of samples during ARB, which may hinder more hydrogen penetration than in thinner oxide layer ones and may impact the final capacity, they were able to absorb hydrogen at a similar rate as powders with a higher surface area.
When comparing the results of our current work to previous studies where samples were not exposed to air [19,20], we found that our as-rolled samples had smaller hydrogen capacities than those from such works. This result confirms that exposure to air leads to the degradation of hydrogen capacities, regardless of the time the samples were stored (one month or one year). A study by Huot and Vincent [24] discovered that prolonged milling time in air leads to the formation of MgO, which causes only the degradation of hydrogen capacities without affecting kinetics. These conclusions confirm our findings and show that hydrogen’s first absorption (activation) was possible in a few minutes for all samples, despite long exposure times to air.
In Figure 5, DSC results are compared between hydrogenated MA(y), MA(y)+ARB, and commercial MgH2. The DSC curves of MA(y) and MA(y)+ARB exhibit two desorption endothermic peaks. According to research by [7,30], the smaller peaks (at lower temperatures) are linked to the decomposition of Mg2FeH6, which acts as a catalyst for the desorption of MgH2, represented by the second and more intense peaks. Such hydrides are in agreement with those identified by XRD analyses (as shown in Figure 3). The discrepancy in peak intensities for the complex hydride is likely due to varying amounts of Mg2FeH6 in each sample, with the rolled sample having less. The MgH2 serves as an intermediate product, and when combined with Fe in a 2MgH2 + Fe mixture, it produces Mg2FeH6 [30]. As shown in Figure 3, the MA(y)+CR sample had a higher yield of MgO, which resulted in less Mg being available to form MgH2. Thus, this sample had a lower yield of Mg2FeH6.
The MA(y) sample exhibits the lowest desorption temperature, starting at approximately 190°C and peaking at about 300°C. The MA(y)+ARB sample displays a slightly higher starting desorption temperature of around 195°C (a difference of only ~5 °C), with its peak at roughly 309°C (a difference of only ~9 °C). The higher peak area of MA(y) indicates that there is a greater amount of desorbed hydrogen, which is consistent with the XRD patterns shown in Figure 3. This shift towards higher temperatures in the as-rolled sample has also been observed in our previous research [19], where it was attributed to the reduction of surface area after consolidation. When comparing these temperatures to those of MgH2, a significant difference of approximately 198°C and 130°C on average for the starting and peak temperatures is evident. These reduction in temperature is due to the microstructural changes by MA and MA+ARB and the effect of Fe as catalyst in 2Mg-Fe samples. Furthermore, the peak widths indicate that the 2Mg-Fe samples demonstrate faster desorption kinetics than MgH2, even though its desorption was at the highest temperatures. This observation also suggests a strong catalytic effect of Fe, which has also been noted in other studies [7,8,9,19,20]. Floriano et al. [21] also observed that after CR the peak desorption temperature of MgH2 decreased from 458°C to 388°C, and to 381°C after the addition of Fe as catalyst before CR.
5. Summary
The results clearly demonstrate that all samples, including those processed by ARB, could have initial hydrogen absorption within just a few minutes, despite significant differences in surface area between powders and rolled samples. Furthermore, the desorption temperatures were markedly lower compared to MgH2. Despite extended exposure to air, absorption, and desorption kinetics remained rapid. Although there were some minor differences in capacities, the overall findings are highly encouraging, indicating that scalable techniques such as ARB can produce hydrogen storage materials that are both safe and competitively cost-effective.
Author Contributions
Conceptualization, G.F.L.A.; methodology, G.F.L.A., L.H.F, and E.B.B and B.D.O.; validation, G.F.L.A. and A.M.J.J; formal analysis, G.F.L.A., A.M.J.J and A.M.N; investigation, G.F.L.A., L.H.F, E.B.B, B.D.O. and A.M.J.J.; resources, G.F.L.A.; writing—original draft preparation, G.F.L.A. K.R.C., D.N.T., A.M.N. and A.M.J.J.; writing—review and editing, G.F.L.A., A.M.N. and A.M.J.J.; supervision, G.F.L.A., K.R.C., D.N.T and A.M.J.J.; project administration, G.F.L.A.; funding acquisition, G.F.L.A. All authors have read and agreed to the published version of the manuscript.”.
Funding
The authors thank FAPESP (2014/21237-1) and CNPq (Universal 460471/2014-7) for financial support.
Data Availability Statement
The data required to reproduce the results of this study are provided in the Materials and Methods section.
Acknowledgments
A.M.J.J acknowledges the National Council for Scientific and Technological Development - CNPq (Brazil) under the grant #306622/2021-1.
Conflicts of Interest
The authors declare no conflict of interest.The funders had no role in the design of the study; in the collection, analyses, or interpretation of data; in the writing of the manuscript; or in the decision to publish the results.
References
- Sakintuna, B.; Lamaridarkrim, F.; Hirscher, M. Metal Hydride Materials for Solid Hydrogen Storage: A Review☆. Int. J. Hydrog. Energy 2007, 32, 1121–1140. [Google Scholar] [CrossRef]
- Schlapbach, L.; Züttel, A. Hydrogen-Storage Materials for Mobile Applications. 2001, 414.
- Schulz, R.; Huot, J.; Liang, G.; Boily, S.; Lalande, G.; Denis, M.C.; Dodelet, J.P. Recent Developments in the Applications of Nanocrystalline Materials to Hydrogen Technologies. Mater. Sci. Eng. A 1999, 267, 240–245. [Google Scholar] [CrossRef]
- Didishein, J J; Zolliker, P; Yvon, K; Fischer, P; Schefer, J; Gubelmann, M; Williams, A.F. Dimagnesium Iron(II) Hydride, Mg2FeH6,Containing Octahedral FeH6 4- Anions. Inorg. Chem. 1984, 23, 1953–1957. [CrossRef]
- Bogdanovic, B.; Reiser, A.; Schlichte, K.; Spliethoff, B.; Tesche, B. Thermodynamics and Dynamics of the Mg–Fe–H System and Its Potential for Thermochemical Thermal Energy Storage. J. Alloys Compd. 2002. [Google Scholar] [CrossRef]
- Reiser, A. The Application of Mg-Based Metal-Hydrides as Heat Energy Storage Systems. Int. J. Hydrog. Energy 2000, 25, 425–430. [Google Scholar] [CrossRef]
- Gennari, F.C.; Castro, F.J.; Gamboa, J.J.A. Synthesis of Mg2FeH6 by Reactive Mechanical Alloying: Formation and Decomposition Properties. J. Alloys Compd. 2002. [Google Scholar] [CrossRef]
- Herrich, M.; Ismail, N.; Lyubina, J.; Handstein, A.; Pratt, A.; Gutfleisch, O. Synthesis and Decomposition of Mg2FeH6 Prepared by Reactive Milling. Mater. Sci. Eng. B 2004, 108, 28–32. [Google Scholar] [CrossRef]
- Lima, G.F.; Jorge, A.M.; Leiva, D.R.; Kiminami, C.S.; Bolfarini, C.; Botta, W.J. Severe Plastic Deformation of Mg-Fe Powders to Produce Bulk Hydrides. J. Phys. Conf. Ser. 2009, 144, 012015. [Google Scholar] [CrossRef]
- Lang, J.; Huot, J. A New Approach to the Processing of Metal Hydrides. J. Alloys Compd. 2011, 509, L18–L22. [Google Scholar] [CrossRef]
- Dufour, J.; Huot, J. Rapid Activation, Enhanced Hydrogen Sorption Kinetics and Air Resistance in Laminated Mg–Pd 2.5at.%. J. Alloys Compd. 2007, 439, L5–L7. [Google Scholar] [CrossRef]
- Dufour, J.; Huot, J. Study of Mg6Pd Alloy Synthesized by Cold Rolling. J. Alloys Compd. 2007, 446–447, 147–151. [Google Scholar] [CrossRef]
- Takeichi, N.; Tanaka, K.; Tanaka, H.; Ueda, T.T.; Kamiya, Y.; Tsukahara, M.; Miyamura, H.; Kikuchi, S. Hydrogen Storage Properties of Mg/Cu and Mg/Pd Laminate Composites and Metallographic Structure. J. Alloys Compd. 2007, 446–447, 543–548. [Google Scholar] [CrossRef]
- Skripnyuk, V.M.; Rabkin, E.; Estrin, Y.; Lapovok, R. The Effect of Ball Milling and Equal Channel Angular Pressing on the Hydrogen Absorption/Desorption Properties of Mg–4.95 Wt% Zn–0.71 Wt% Zr (ZK60) Alloy. Acta Mater. 2004, 52, 405–414. [Google Scholar] [CrossRef]
- Skripnyuk, V.; Buchman, E.; Rabkin, E.; Estrin, Y.; Popov, M.; Jorgensen, S. The Effect of Equal Channel Angular Pressing on Hydrogen Storage Properties of a Eutectic Mg–Ni Alloy. J. Alloys Compd. 2007, 436, 99–106. [Google Scholar] [CrossRef]
- Ueda, T.T.; Tsukahara, M.; Kamiya, Y.; Kikuchi, S. Preparation and Hydrogen Storage Properties of Mg–Ni–Mg2Ni Laminate Composites. J. Alloys Compd. 2005, 386, 253–257. [Google Scholar] [CrossRef]
- Huot, J.; Tousignant, M. Effect of Cold Rolling on Metal Hydrides. Mater. Trans. 2019, 60, 1571–1576. [Google Scholar] [CrossRef]
- Antiqueira, F.J.; Leiva, D.R.; Ishikawa, T.T.; Jorge Junior, A.M.; Botta, W.J. Severe Plastic Deformation and Additive Distribution in Mg-Fe to Improve Hydrogen Storage Properties. Mater. Res. 2017, 20, 61–70. [Google Scholar] [CrossRef]
- Lima, G.F.; Triques, M.R.M.; Kiminami, C.S.; Botta, W.J.; Jorge, A.M. Hydrogen Storage Properties of 2Mg–Fe after the Combined Processes of Hot Extrusion and Cold Rolling. J. Alloys Compd. 2014, 586, S409–S412. [Google Scholar] [CrossRef]
- De Lima Andreani, G.F.; Triques, M.R.M.; Kiminami, C.S.; Botta, W.J.; Roche, V.; Jorge, A.M. Characterization of Hydrogen Storage Properties of Mg-Fe-CNT Composites Prepared by Ball Milling, Hot-Extrusion and Severe Plastic Deformation Methods. Int. J. Hydrog. Energy 2016, 41, 23092–23098. [Google Scholar] [CrossRef]
- Floriano, R.; Leiva, D.R.; Carvalho, J.A.; Ishikawa, T.T.; Botta, W.J. Cold Rolling under Inert Atmosphere: A Powerful Tool for Mg Activation. Int. J. Hydrog. Energy 2014, 39, 4959–4965. [Google Scholar] [CrossRef]
- Jorge, A.M.; Ferreira De Lima, G.; Martins Triques, M.R.; Botta, W.J.; Kiminami, C.S.; Nogueira, R.P.; Yavari, A.R.; Langdon, T.G. Correlation between Hydrogen Storage Properties and Textures Induced in Magnesium through ECAP and Cold Rolling. Int. J. Hydrog. Energy 2014, 39, 3810–3821. [Google Scholar] [CrossRef]
- Jorge, A.M.; Prokofiev, E.; Ferreira De Lima, G.; Rauch, E.; Veron, M.; Botta, W.J.; Kawasaki, M.; Langdon, T.G. An Investigation of Hydrogen Storage in a Magnesium-Based Alloy Processed by Equal-Channel Angular Pressing. Int. J. Hydrog. Energy 2013, 38, 8306–8312. [Google Scholar] [CrossRef]
- Vincent, S.D.; Huot, J. Effect of Air Contamination on Ball Milling and Cold Rolling of Magnesium Hydride. J. Alloys Compd. 2011, 509, L175–L179. [Google Scholar] [CrossRef]
- Jung, J.Y.; Fadonougbo, J.O.; Suh, J.-Y.; Lee, Y.-S.; Huh, J.-Y.; Cho, Y.W. Synthesis of Mg2FeH6 by Hydrogenation of Mg/Fe Powder Mixture Prepared by Cold Roll Milling in Air: Effects of Microstructure and Oxygen Distribution. Int. J. Hydrog. Energy 2018, 43, 16758–16765. [Google Scholar] [CrossRef]
- Suárez-Alcántara, K.; Palacios-Lazcano, A.F.; Funatsu, T.; Cabañas-Moreno, J.G. Hydriding and Dehydriding in Air-Exposed MgFe Powder Mixtures. Int. J. Hydrog. Energy 2016, 41, 23380–23387. [Google Scholar] [CrossRef]
- Czerwinski, F. Oxidation Characteristics of Magnesium Alloys. JOM 2012, 64, 1477–1483. [Google Scholar] [CrossRef]
- Lutterotti L MAUD - Materials Analysis Using Diffraction Available online:. Available online: www.ing.unitn.it/~maud/ (accessed on 1 July 2019).
- Lutterotti, L.; Ceccato, R.; Dal Maschio, R.; Pagani, E. Quantitative Analysis of Silicate Glass in Ceramic Materials by the Rietveld Method. Mater. Sci. Forum 1998, 278–281, 87–92. [Google Scholar] [CrossRef]
- Castro, F.J.; Gennari, F.C. Effect of the Nature of the Starting Materials on the Formation of Mg2FeH6. J. Alloys Compd. 2004, 375, 292–296. [Google Scholar] [CrossRef]
Figure 1.
XRD patterns of MA(y) at the bottom and MA(y)+ARB at the top. The revealed phases are Mg (76145-ICSD) and Fe (64795-ICSD).
Figure 1.
XRD patterns of MA(y) at the bottom and MA(y)+ARB at the top. The revealed phases are Mg (76145-ICSD) and Fe (64795-ICSD).
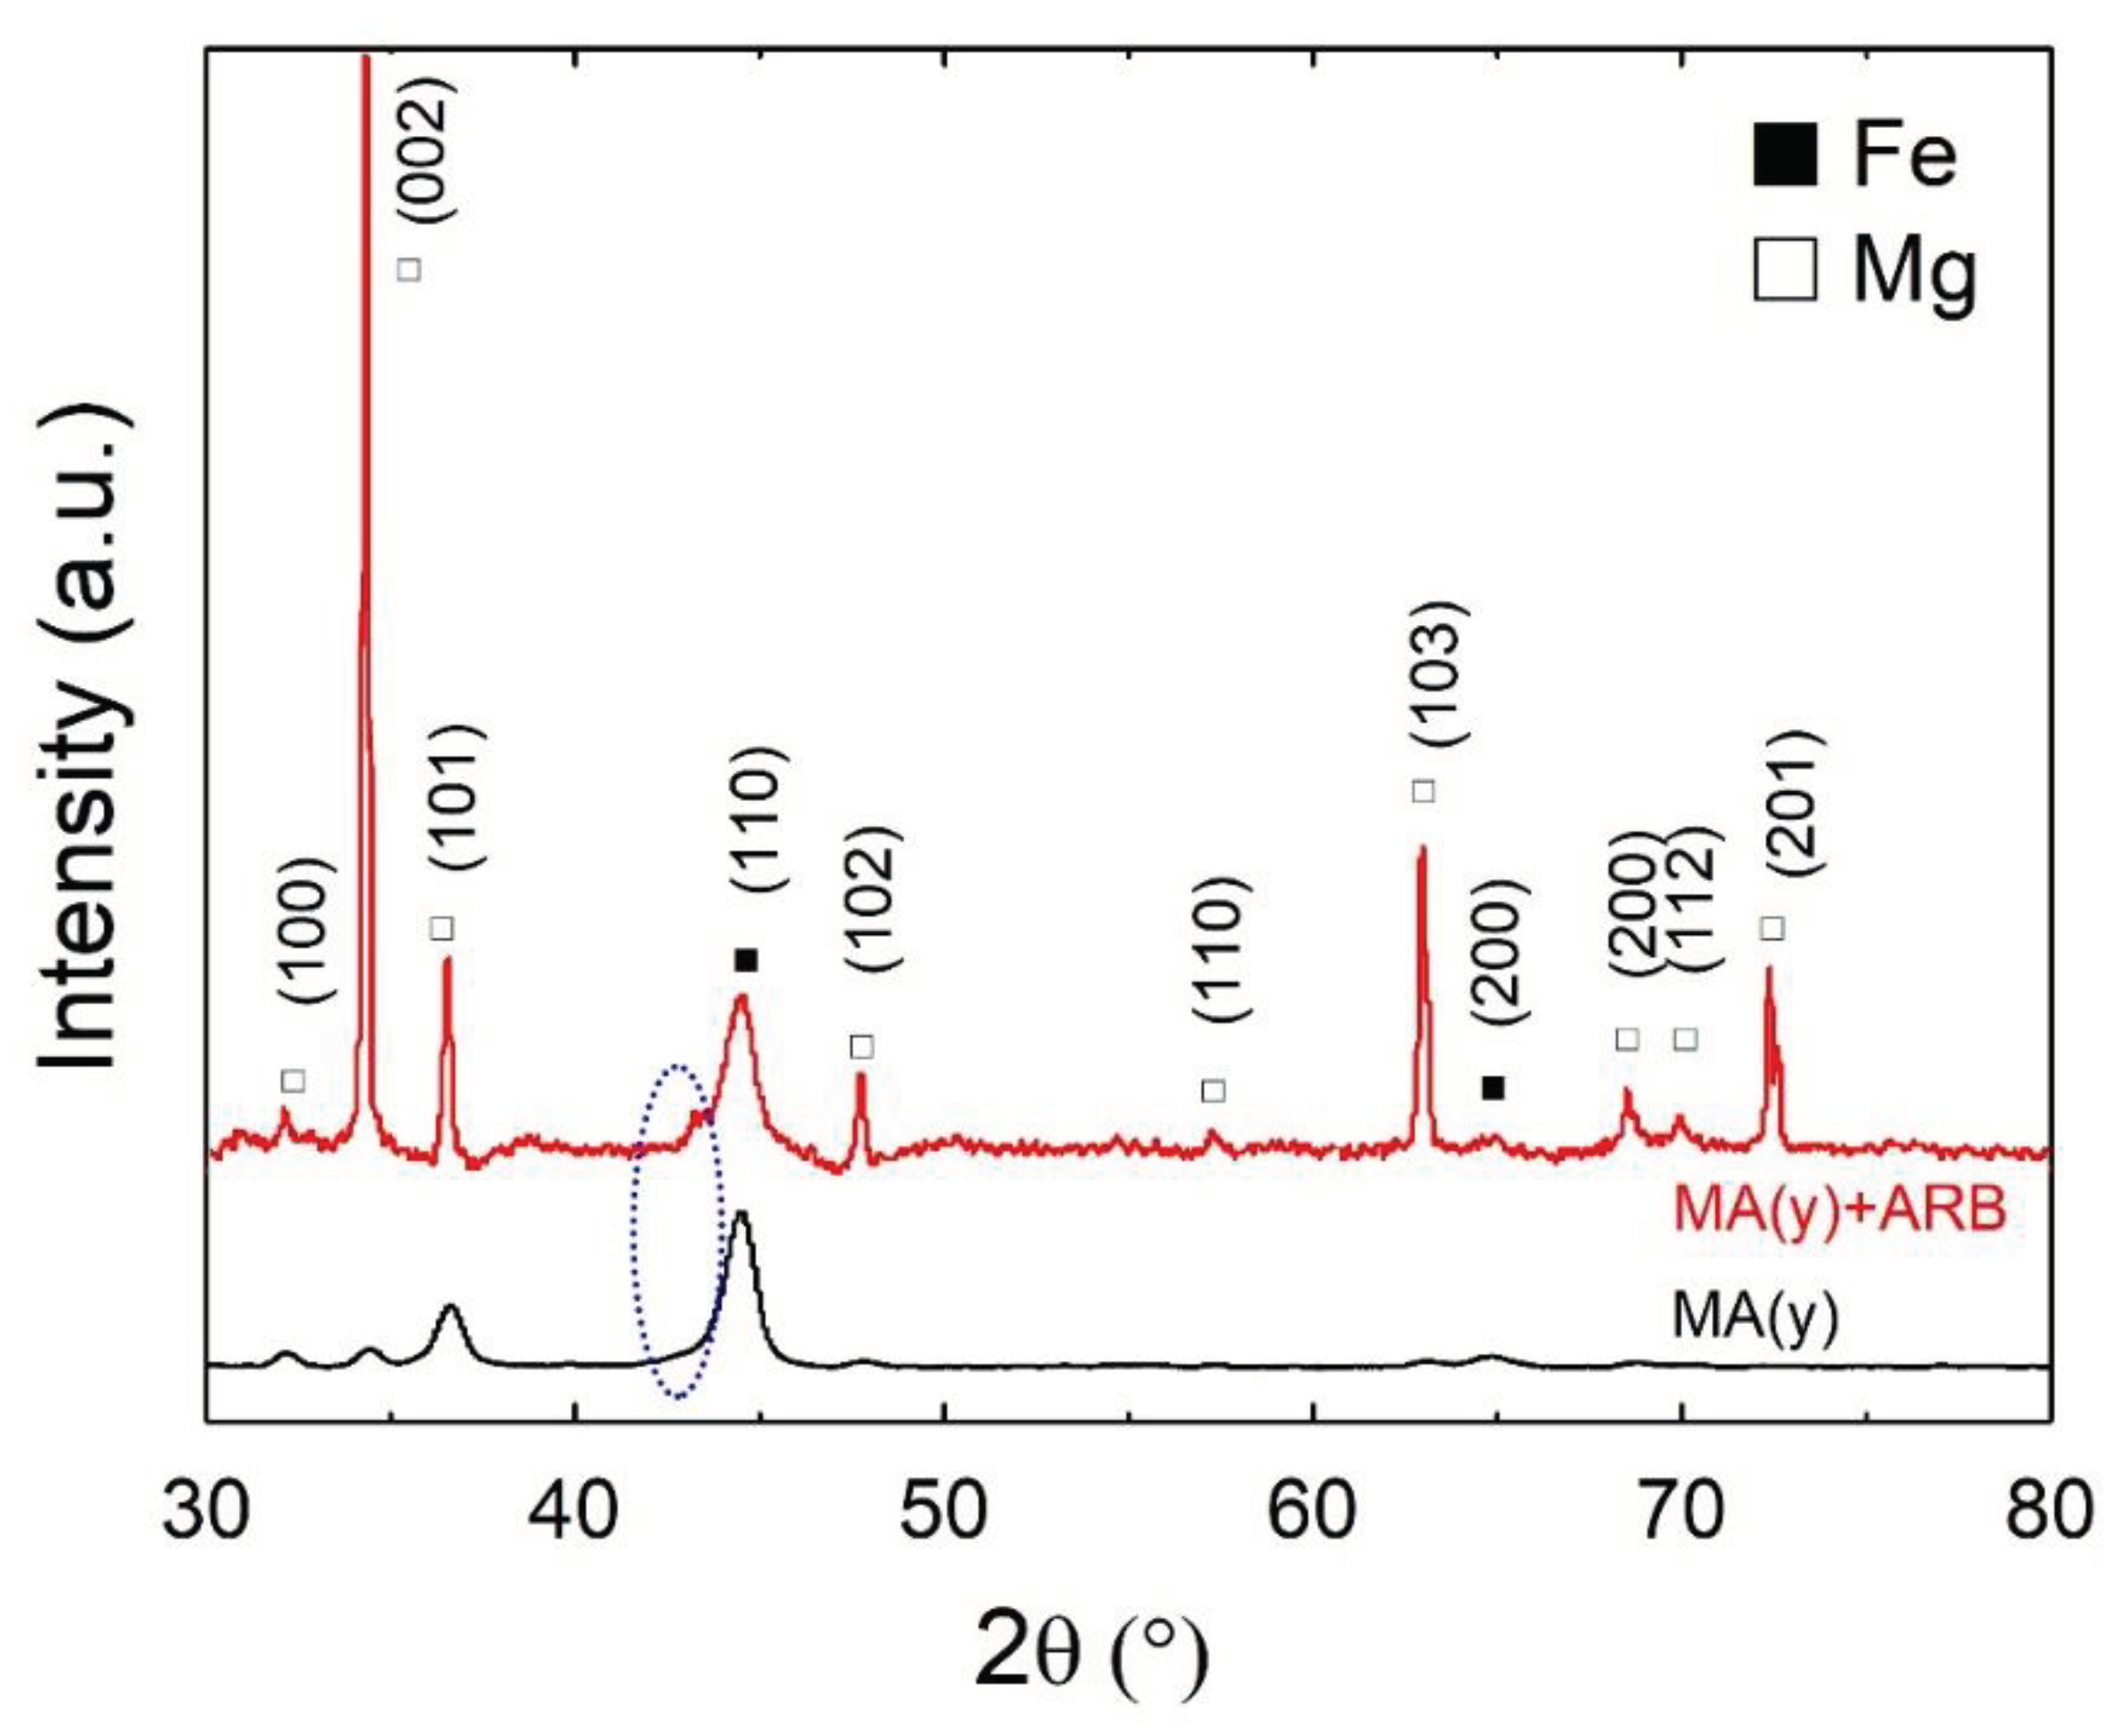
Figure 2.
XRD patterns of MA(y) at the bottom and MA(y)+ARB at the top. The revealed phases are Mg (76145-ICSD) and Fe (64795-ICSD).
Figure 2.
XRD patterns of MA(y) at the bottom and MA(y)+ARB at the top. The revealed phases are Mg (76145-ICSD) and Fe (64795-ICSD).
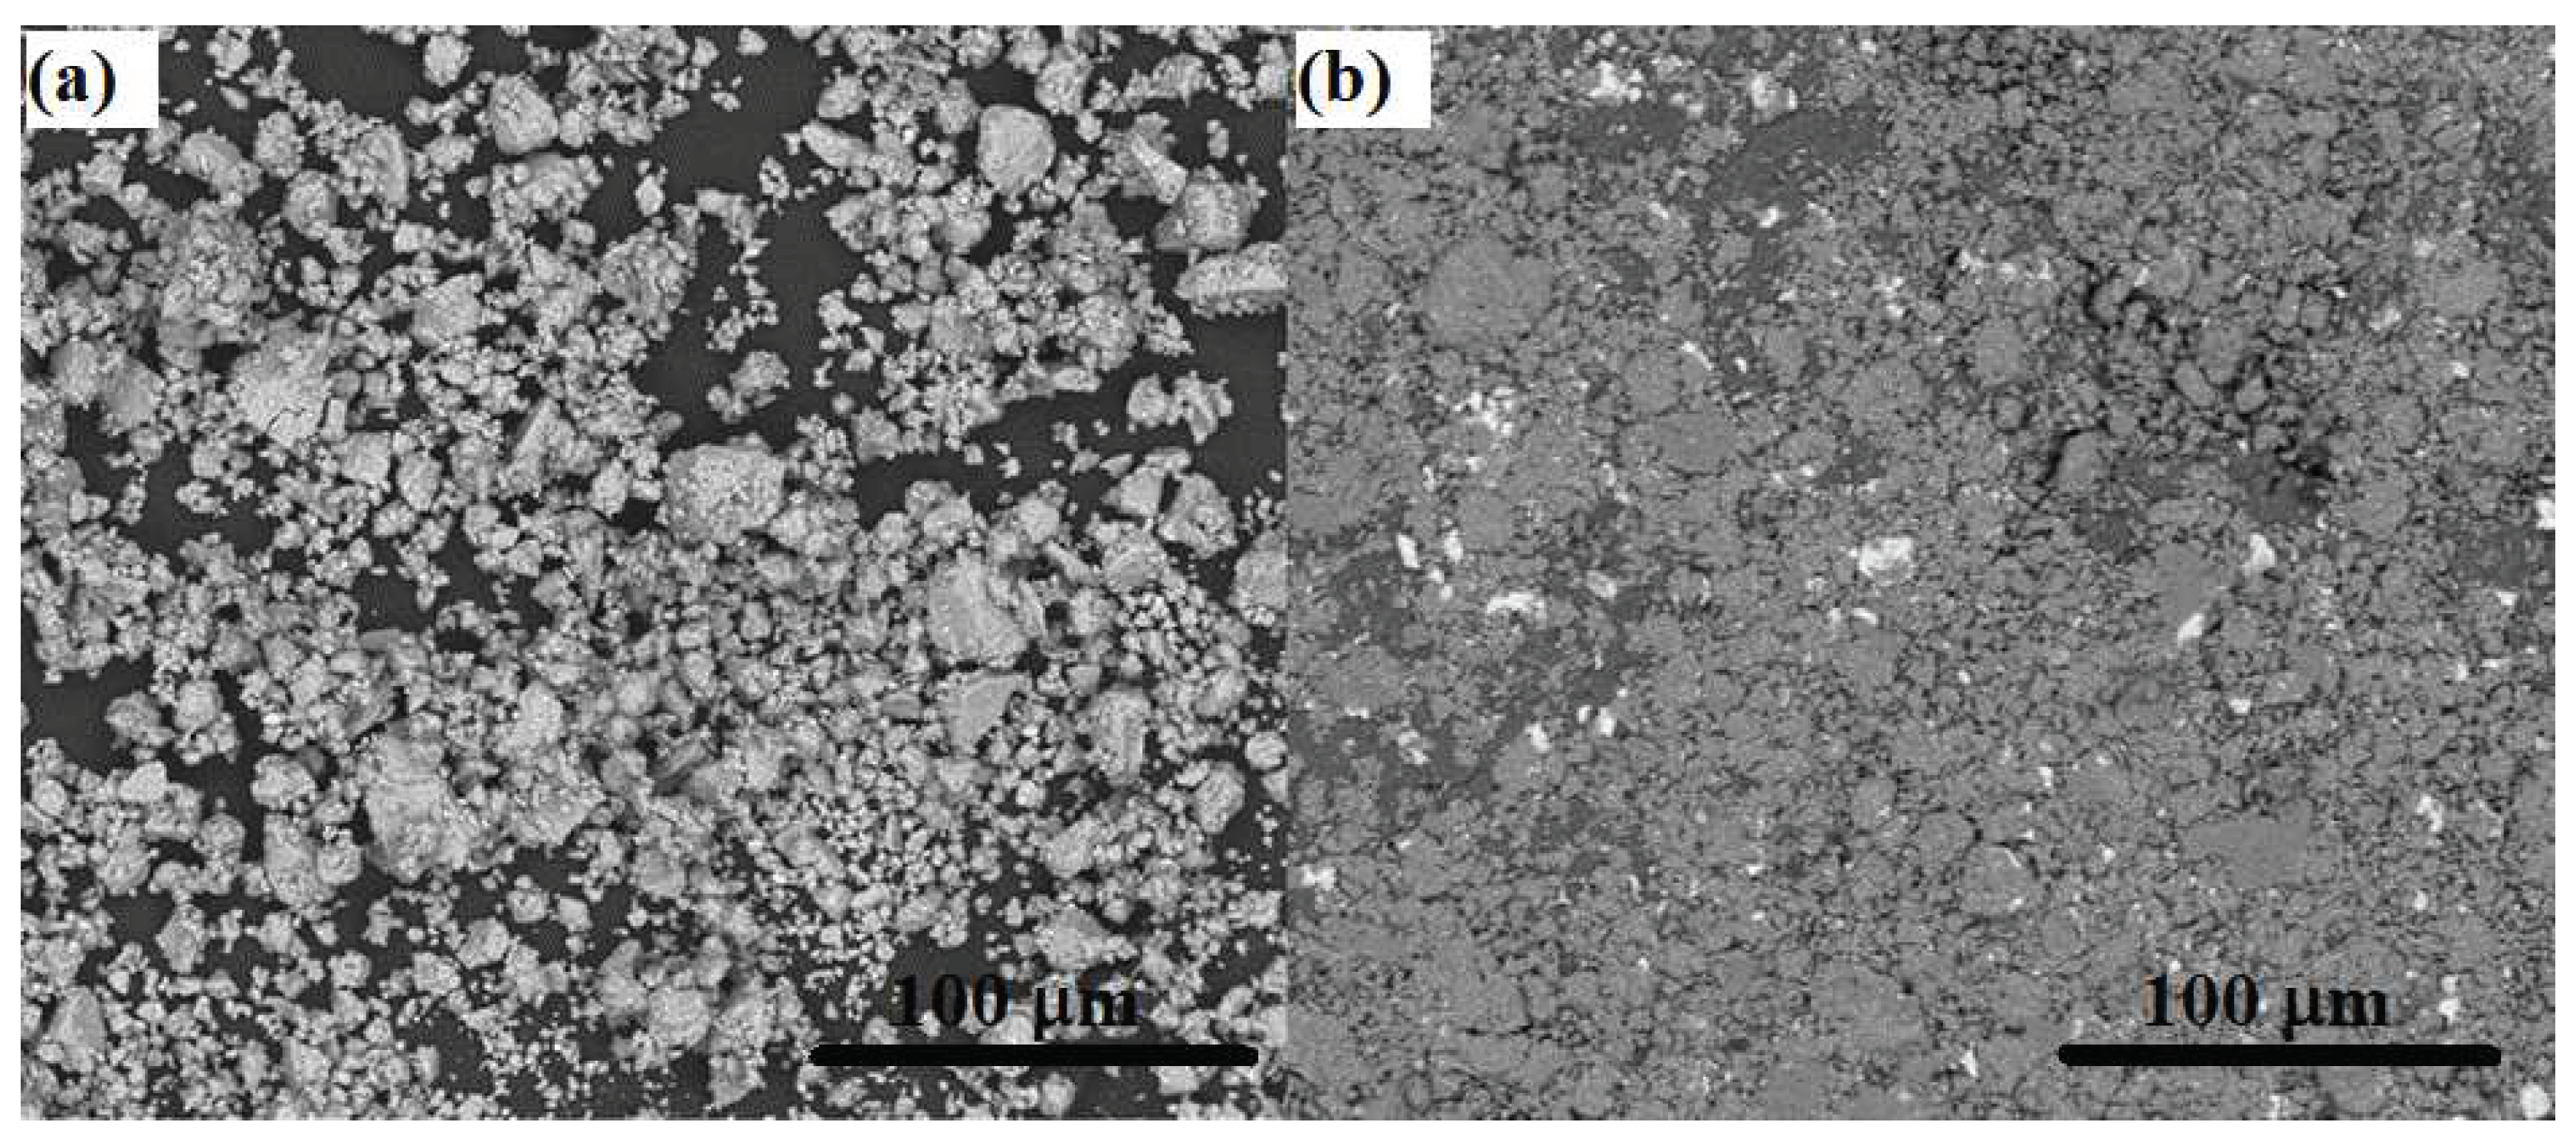
Figure 3.
XRD patterns of hydrogenated MA(y) and MA(y)+ARB samples, as indicated in the Figure. The revealed phases are Mg (76145-ICSD), Fe (64795-ICSD), MgH2 (26624-ICSD), Mg2FeH6 (107500-ICSD), and MgO (9863-ICSD).
Figure 3.
XRD patterns of hydrogenated MA(y) and MA(y)+ARB samples, as indicated in the Figure. The revealed phases are Mg (76145-ICSD), Fe (64795-ICSD), MgH2 (26624-ICSD), Mg2FeH6 (107500-ICSD), and MgO (9863-ICSD).
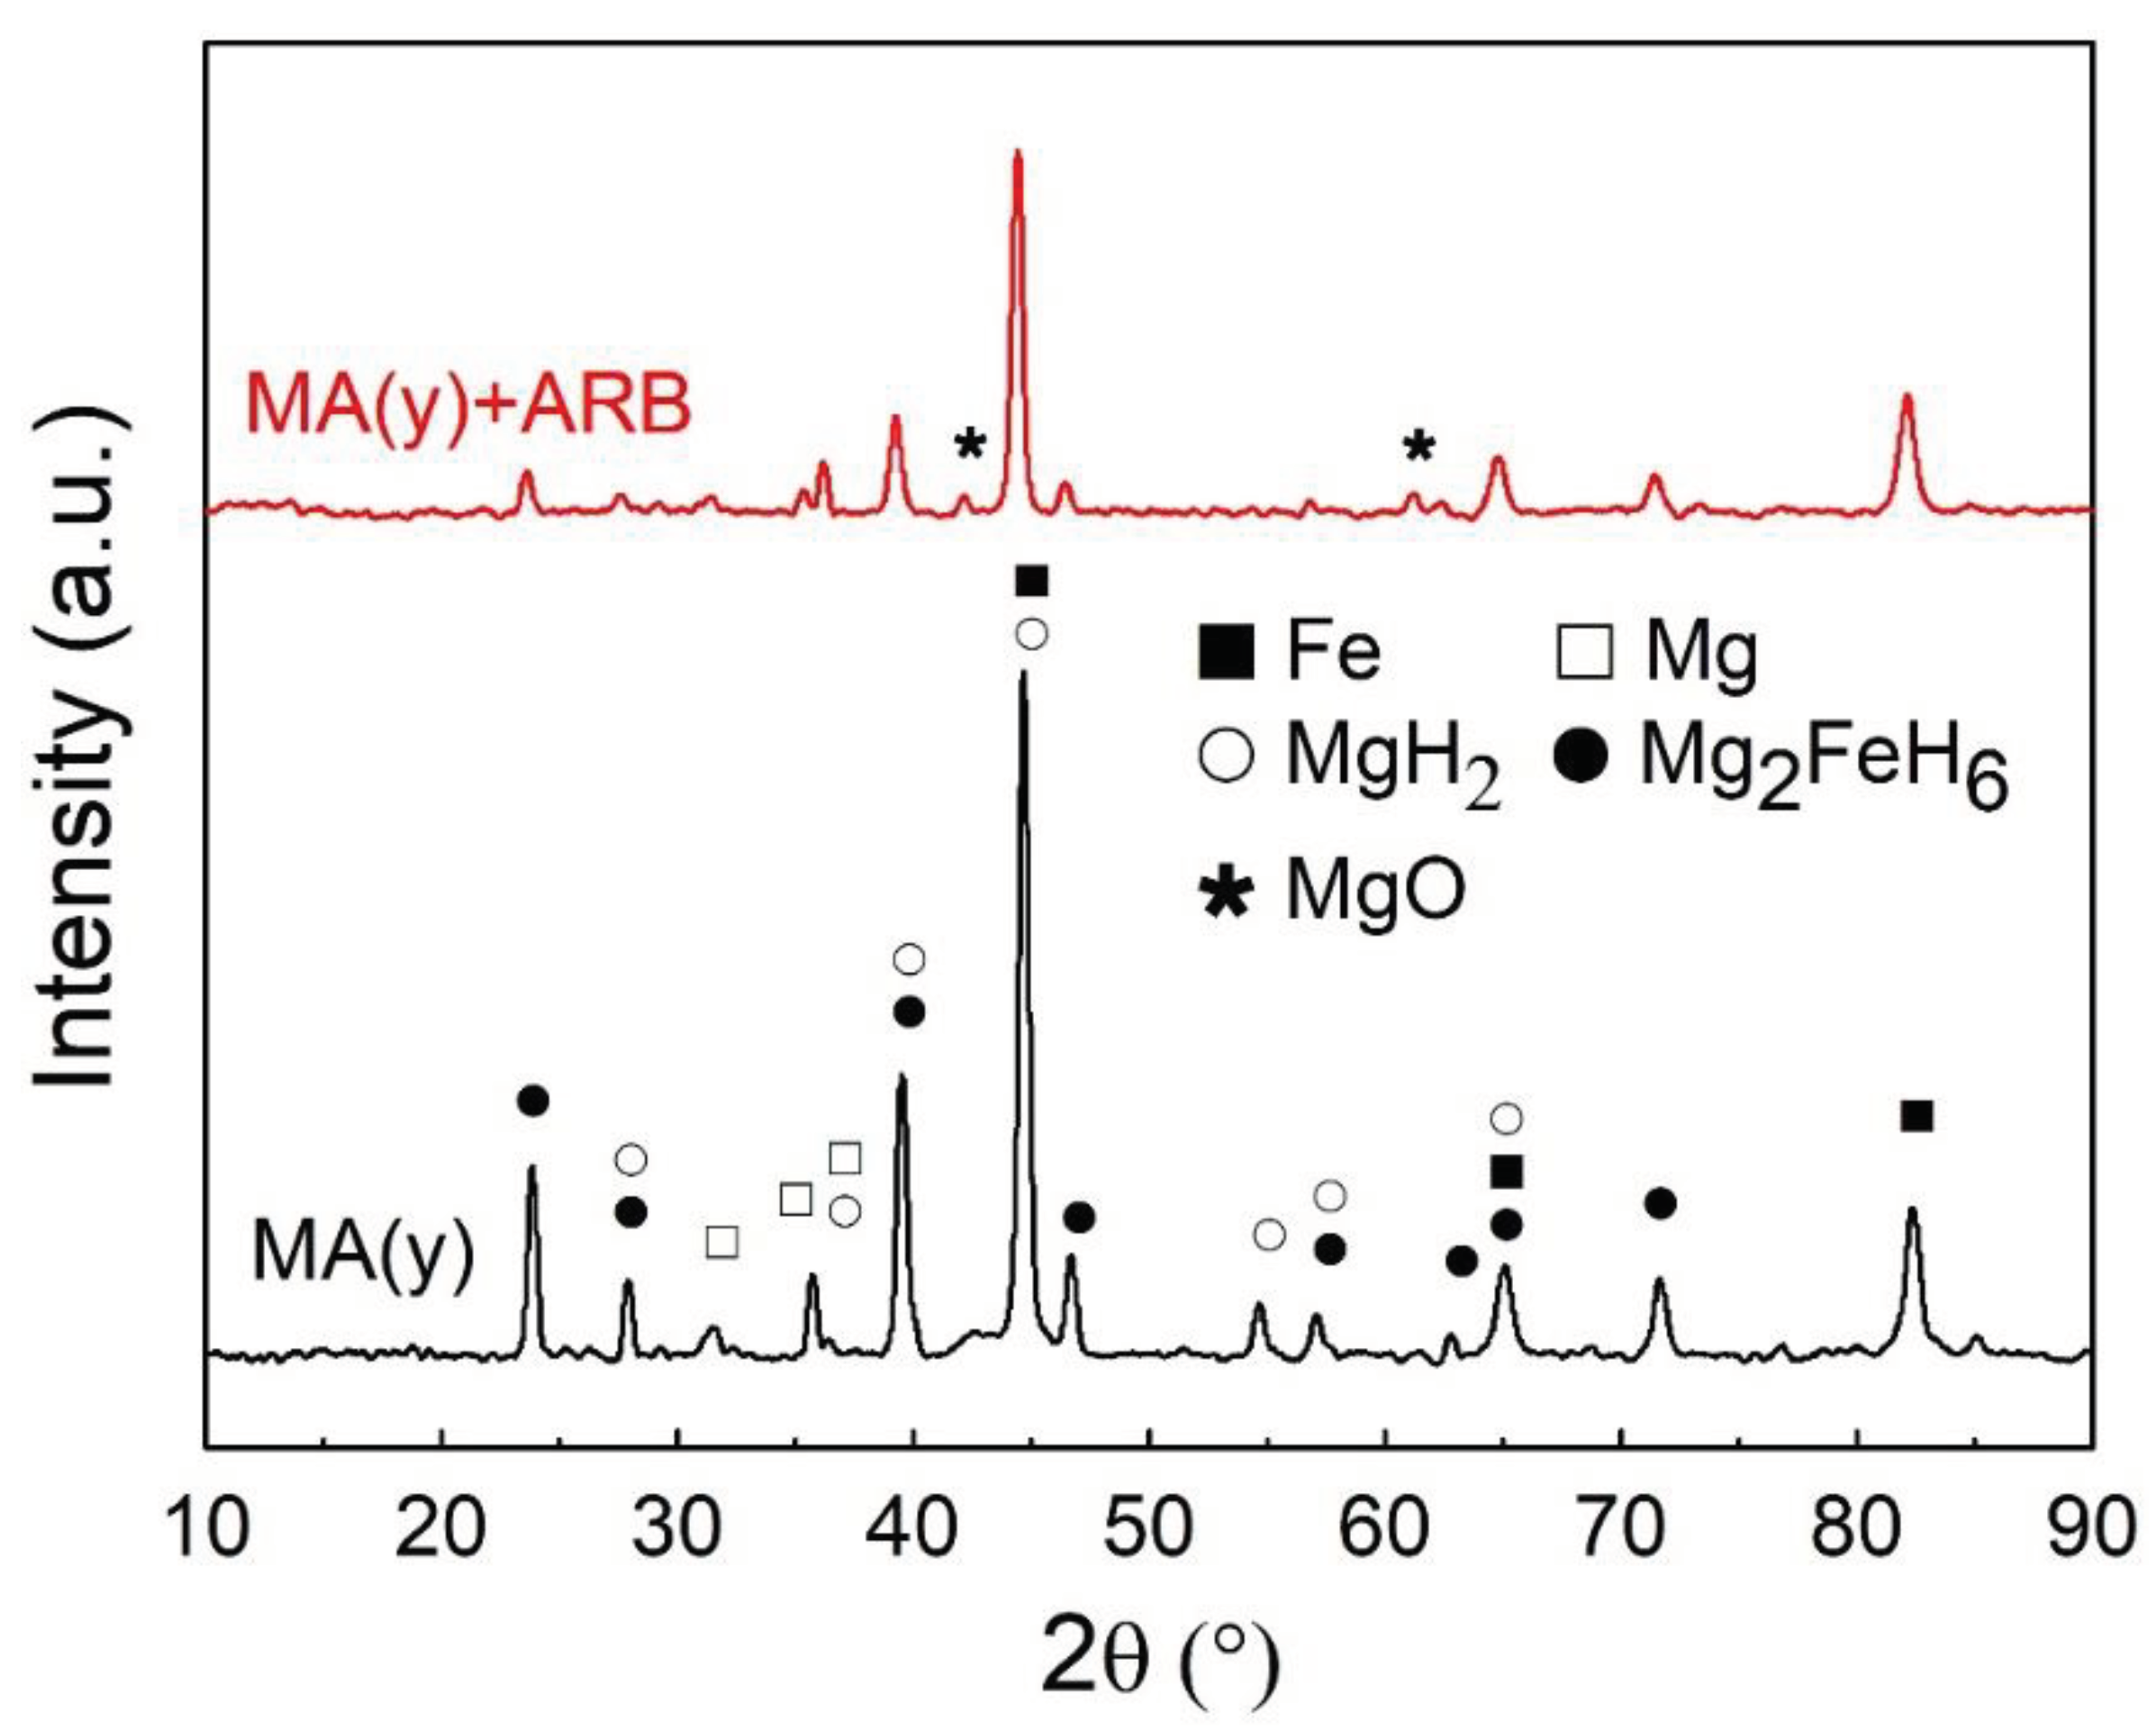
Figure 4.
(a, b) First hydrogenation curves of samples, in (a) comparing MA(y) and MA(y)+ARB, and in (b) comparing MA(y), MA(y)+ARB, MA(m), and MA(m)+ARB. (c) Hydriding kinetics curves comparing all conditions. Hydriding at 623 K (350°C) under a hydrogen pressure of 2 MPa.
Figure 4.
(a, b) First hydrogenation curves of samples, in (a) comparing MA(y) and MA(y)+ARB, and in (b) comparing MA(y), MA(y)+ARB, MA(m), and MA(m)+ARB. (c) Hydriding kinetics curves comparing all conditions. Hydriding at 623 K (350°C) under a hydrogen pressure of 2 MPa.
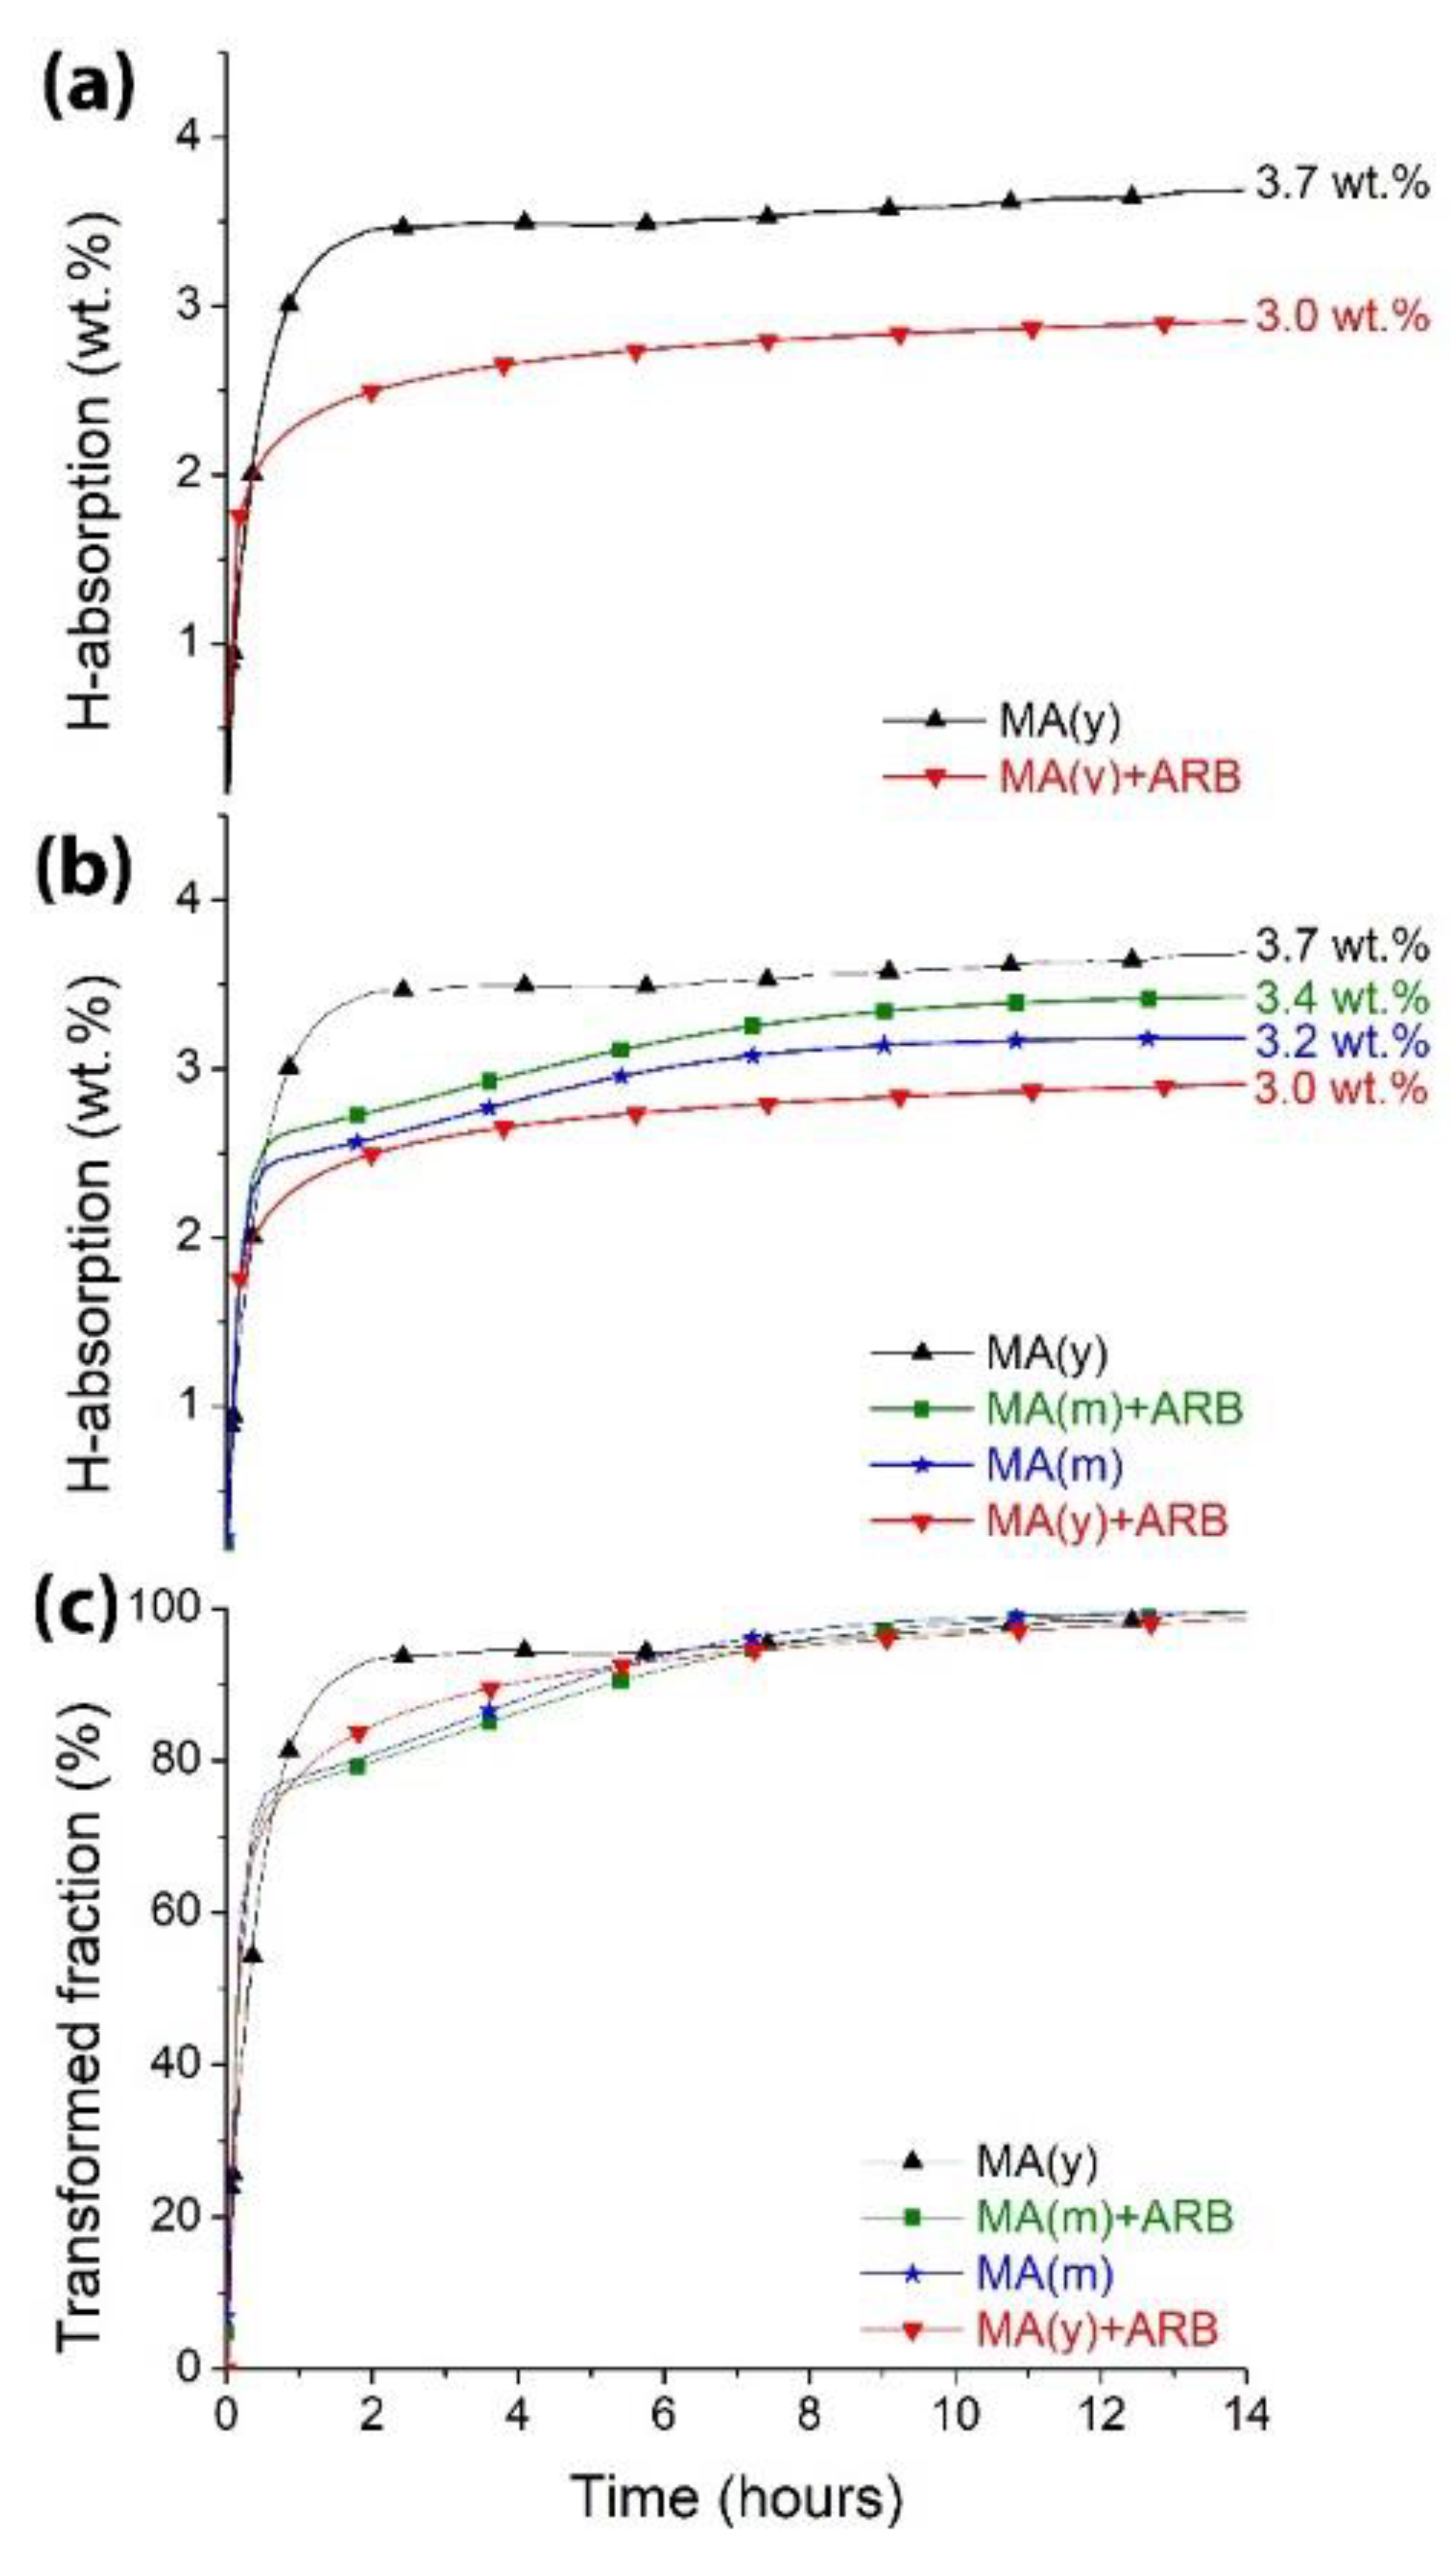
Figure 5.
DSC curves comparing MA(y), MA(y)+ARB, and commercial MgH2 results.


Disclaimer/Publisher’s Note: The statements, opinions and data contained in all publications are solely those of the individual author(s) and contributor(s) and not of MDPI and/or the editor(s). MDPI and/or the editor(s) disclaim responsibility for any injury to people or property resulting from any ideas, methods, instructions or products referred to in the content. |
© 2023 by the authors. Licensee MDPI, Basel, Switzerland. This article is an open access article distributed under the terms and conditions of the Creative Commons Attribution (CC BY) license (http://creativecommons.org/licenses/by/4.0/).
Copyright: This open access article is published under a Creative Commons CC BY 4.0 license, which permit the free download, distribution, and reuse, provided that the author and preprint are cited in any reuse.


