1. Introduction
Recently, fluorescent objects have become increasingly common in daily life. This is because the addition of fluorescent agents to materials improves their visual appearance, and fluorescent substances are commonly found in everyday products such as paper, paint, plastics, and clothing. Fluorescence is an optical phenomenon in which a material is first excited by light radiation in a specific wavelength region, and upon relaxation, the excited state emits light radiation in a longer wavelength region [1, 2]. When the excitation wavelengths are in the ultraviolet region, the emission wavelengths are mostly in the visible region. Therefore, several fluorescent surfaces appear brighter and more vivid than their original appearance based on surface light reflection. Previous studies on fluorescence analysis have mainly targeted man-made objects, such as those mentioned above ([
3,
4,
5,
6,
7,
8,
9,
10]), where the bispectral characteristics of fluorescent objects consisting of fluorescent emission and reflectance spectra were often estimated.
However, a variety of natural objects exist in addition to man-made ones that emit fluorescence, such as minerals, deep-sea fish, corals, and plants. Among these, plants have recently attracted significant interest as a research topic owing to the requirement to increase food production and security as population increases [
1][
15]. In this study, we estimate the fluorescence emission from plant grains and leaves. In practice, polished rice grains emit fluorescence in the blue wavelength range, and plant leaves contain chlorophyll, which emits fluorescence in the red to near-infrared wavelength range. It has also been reported that the spectral distribution of rice changes at different origins [
16], and the spectral distribution of chlorophyll varies based on the plant species and environmental conditions [
17]. These phenomena make fluorescence spectroscopy an effective means of investigating the growth and condition of plants, as well as the freshness and identification of grains.
Specialized equipment such as a spectroradiometer or spectrocolorimeter is required to accurately obtain the spectral distribution information of the fluorescent emission. These instruments have the issue of being expensive and poorly portable, and a major issue is that they can only obtain spectral information of one point in a scene. A spectral imaging system equipped with filters for a camera, such as a liquid-crystal tunable (LCT) filter, to obtain a spectral image of a scene may be useful [
6]. However, such equipment is expensive, poorly portable, and has a low resolution. In this study, we construct a multiband imaging system by adding a minimum number of necessary filters to ordinary small off-the-shelf cameras.
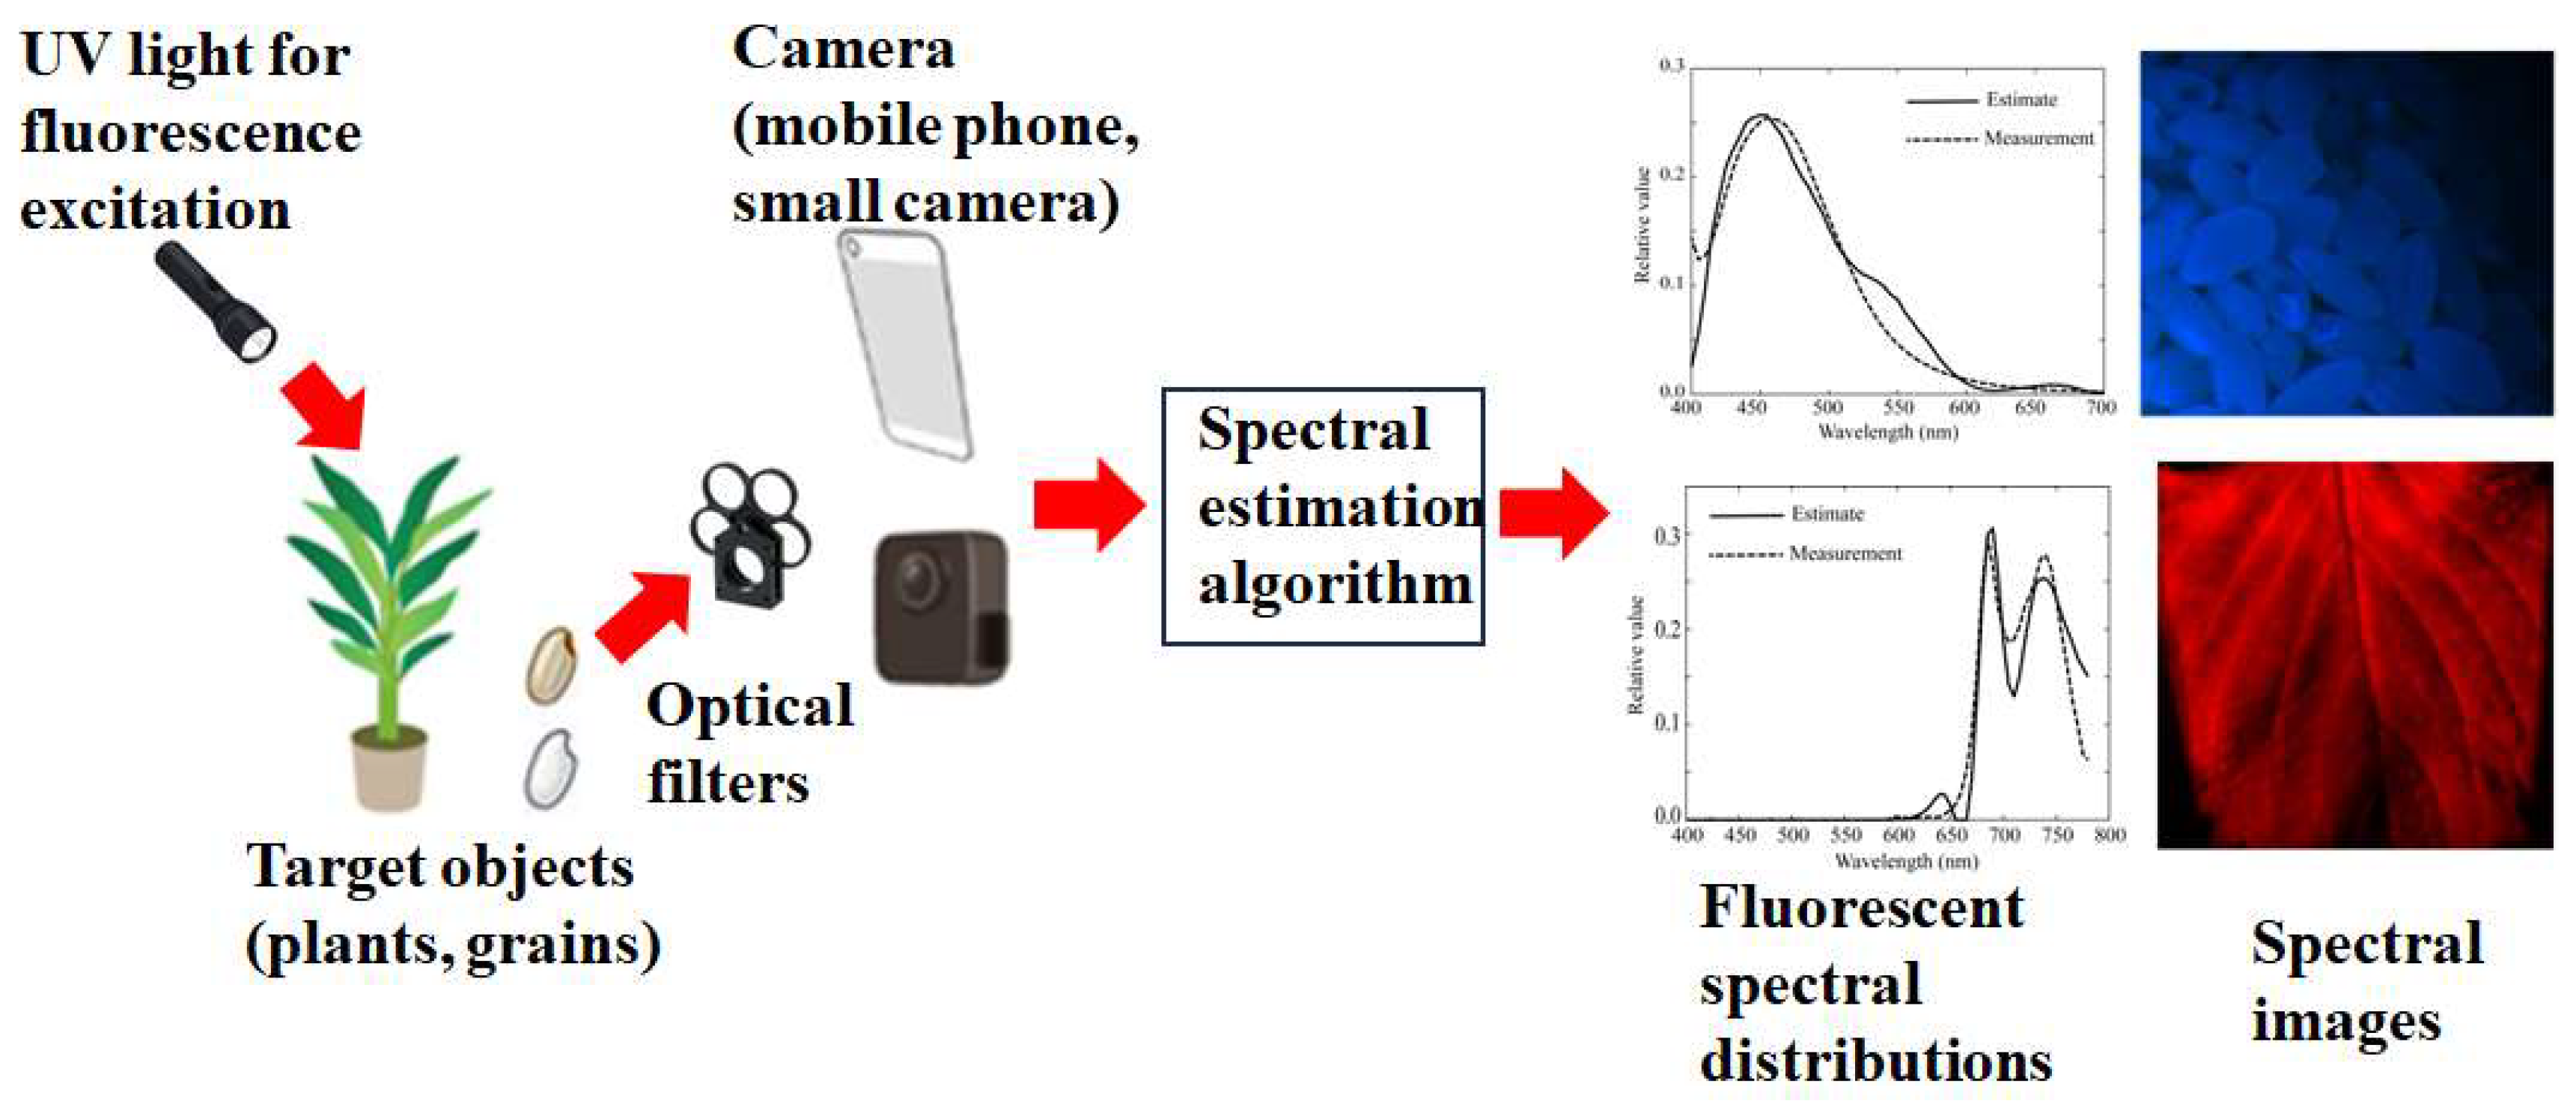
Figure 1 shows an overview of the proposed multiband imaging system for estimating the fluorescence emission spectra of plants and grains. The target plant leaves or rice grains are illuminated with UV light for fluorescence excitation, and the emitted fluorescent light passes through filters and is captured by a mobile phone camera or small monochrome camera. The spectral-estimation algorithm estimates the spectral distribution of the fluorescence emitted from the captured images and outputs a spectral image. The top and bottom figures on the right of
Figure 1 show examples of the emitted fluorescent spectral distributions and sRGB images converted from the spectral images of rice as a grain and Perilla leaves as a plant, respectively.
Numerous methods have been proposed in the fields of imaging science, technology, and computer vision to estimate spectral distribution from camera data. However, almost all these methods are based solely on reflected light from a non-fluorescent object and not on emitted light, such as fluorescence. For example, the Wiener estimation method and the recent linear minimum mean-square error (LMMSE) method are well-known [
18]; however, they are based solely on reflected light from the object surface and estimate the spectral reflectance of an object; thus, they cannot be applied to estimate the spectral distribution of fluorescent emission. These are statistical methods that use spectral reflectance databases. In the case of fluorescence emission, the wavelength band can differ; therefore, a spectral database is not available. In our preliminary study [
11], we employed a simplified Wiener-like method that did not use a fluorescence database. However, it was assumed that the spectroradiometer could be used as the ground truth.
In this study, we propose a method to obtain a reliable estimate of the fluorescence emission spectral distribution from only acquired image data without relying on a spectrometer. A spectroradiometer is used to verify the estimation results. We adopt a ridge regression method [
19,
20,
21], which is used for estimating the coefficients of multiple regression models in scenarios where independent variables are highly correlated. This approach does not require statistics such as the mean, variance, and autocorrelation matrix. By optimally selecting the ridge parameter, we can obtain a much more reliable estimate of the fluorescence emission spectral distribution than using the minimum norm solution.
The remainder of this paper is organized as follows: we first introduce the two types of multiband systems: one for rice grains using a mobile phone camera and the other for plant leaves using a small monochrome camera. Second, an estimation method is developed. We describe an observation model for problem formulation and propose an algorithm to optimally estimate the fluorescence emission spectral distribution from camera data. Third, in the experiments, UV light is used to illuminate real rice grains and green leaves, the emitted fluorescence spectra are estimated, and the reliability of the proposed method is demonstrated.
2. Imaging Systems
2.1. Light Source and Spectrometer
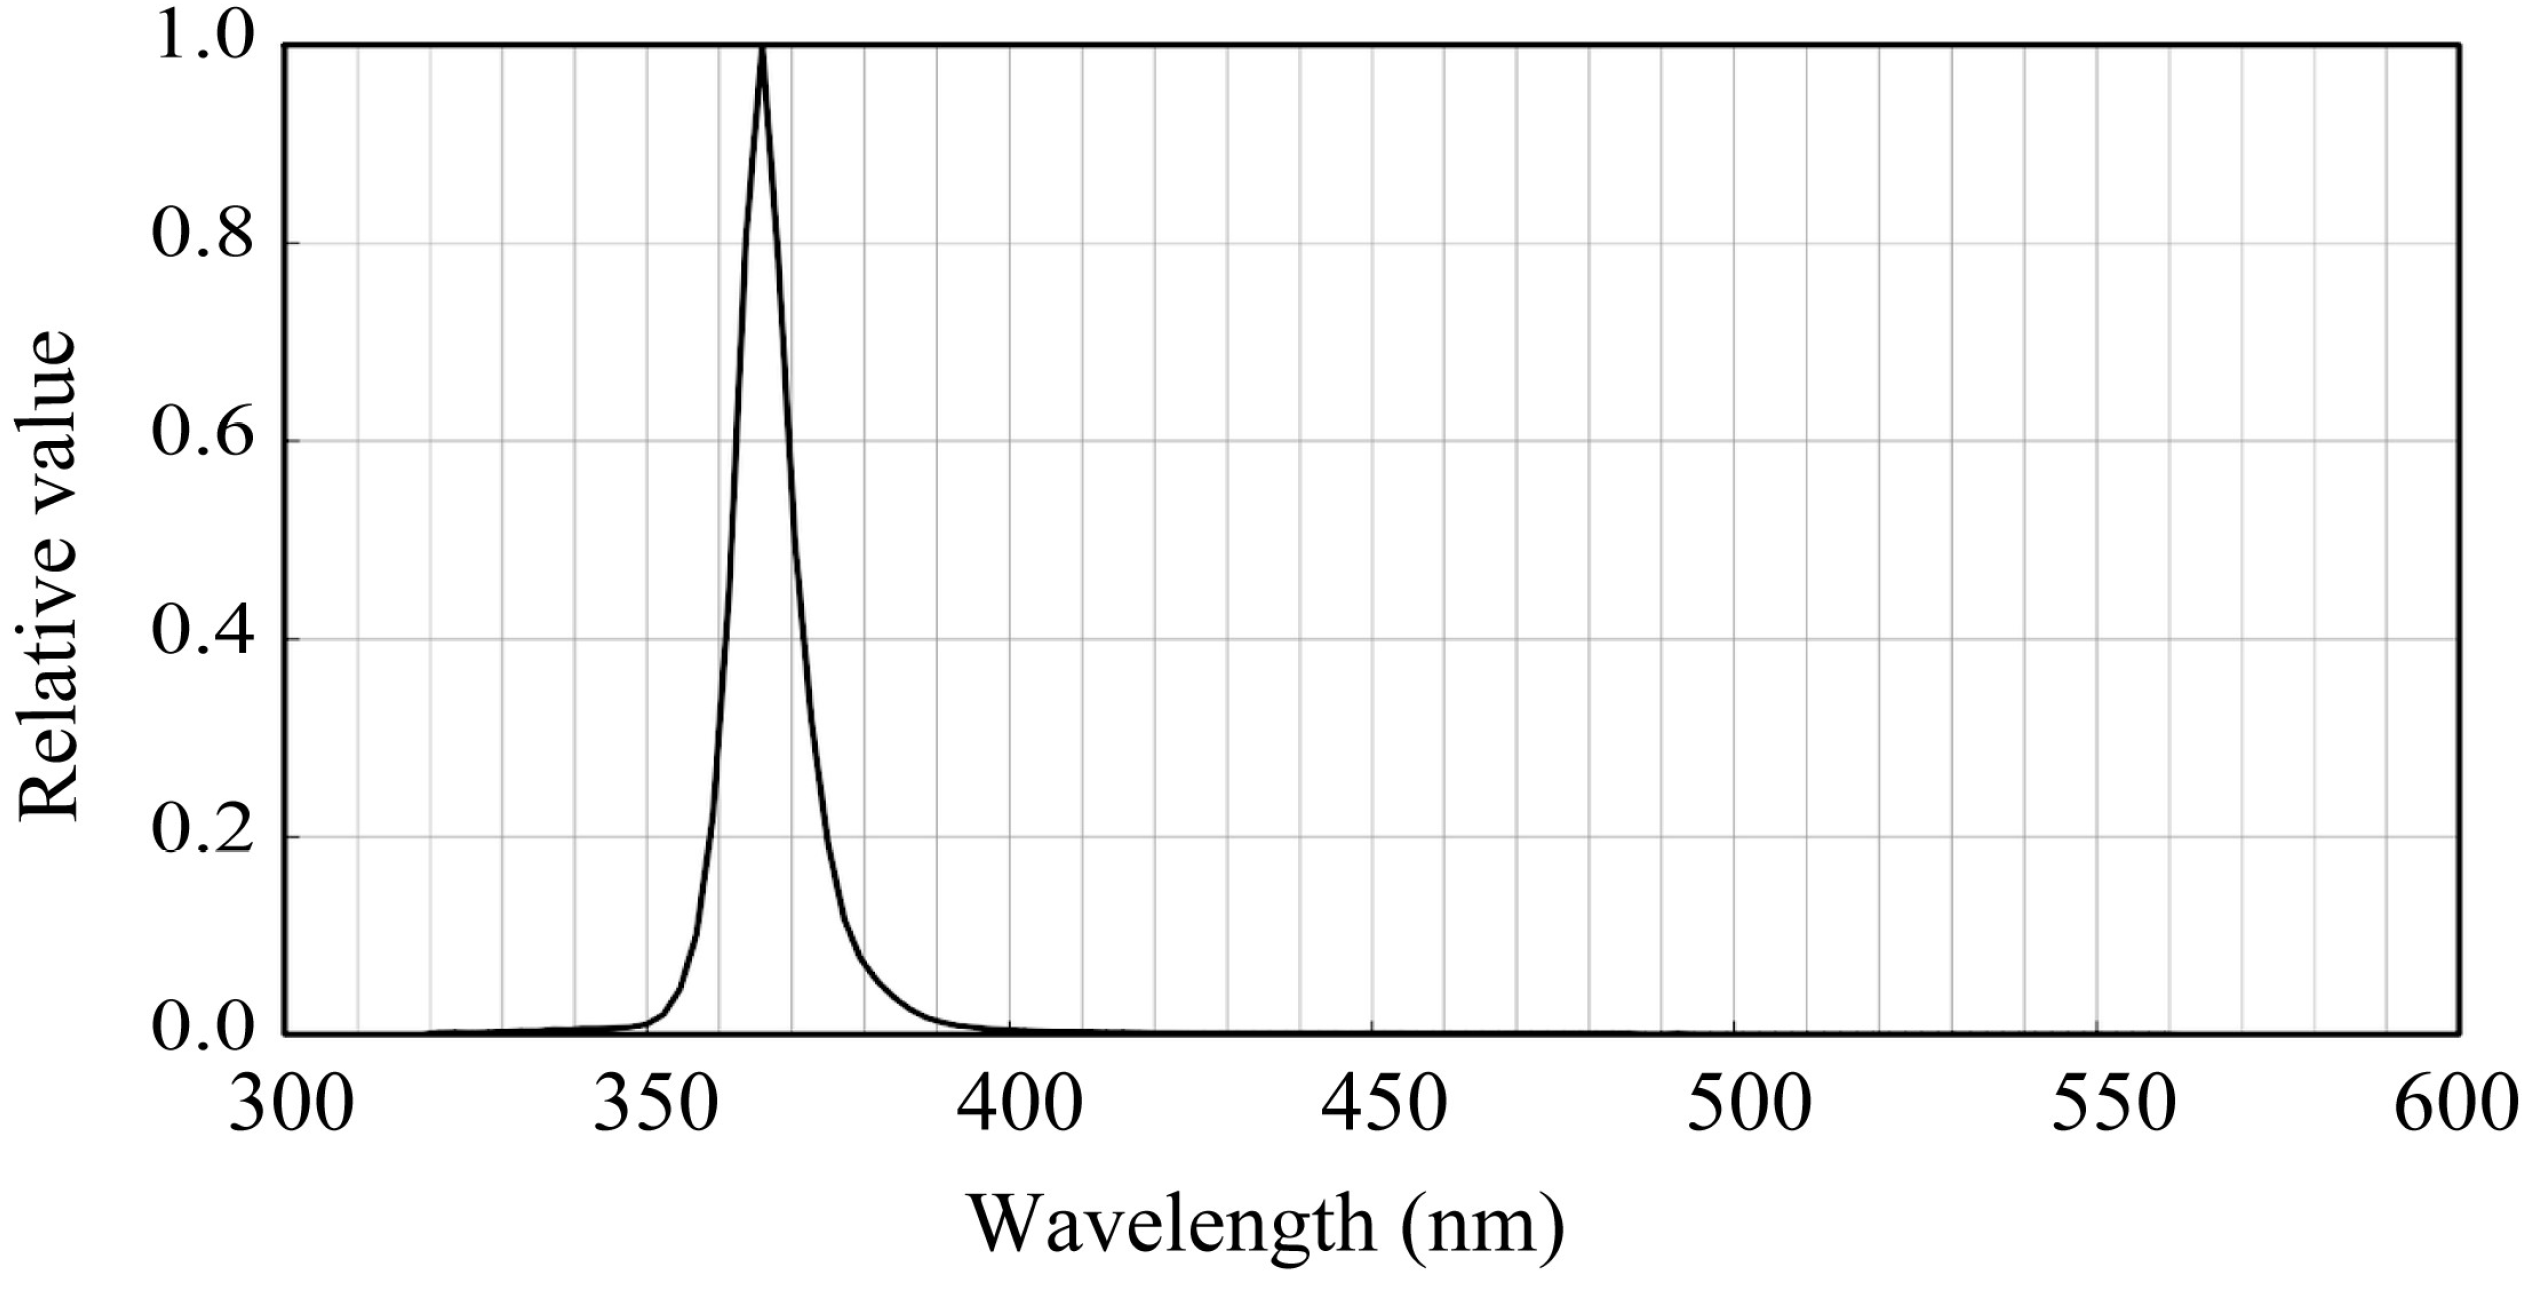
A UV LED light (NCSU276A, NICHIA, Tokushima, Japan) was used to excite fluorescence in the plants.
Figure 2 shows the spectral power distribution, where the peak wavelength of the UV light was 365 nm. The global spectral distribution of the fluorescent light was measured using a spectroradiometer (CS-2000, Konica Minolta, Tokyo, Japan), which was also used to verify the estimated spectral distribution of the fluorescence emission.
2.2. Multiband System Using a Mobile Phone Camera
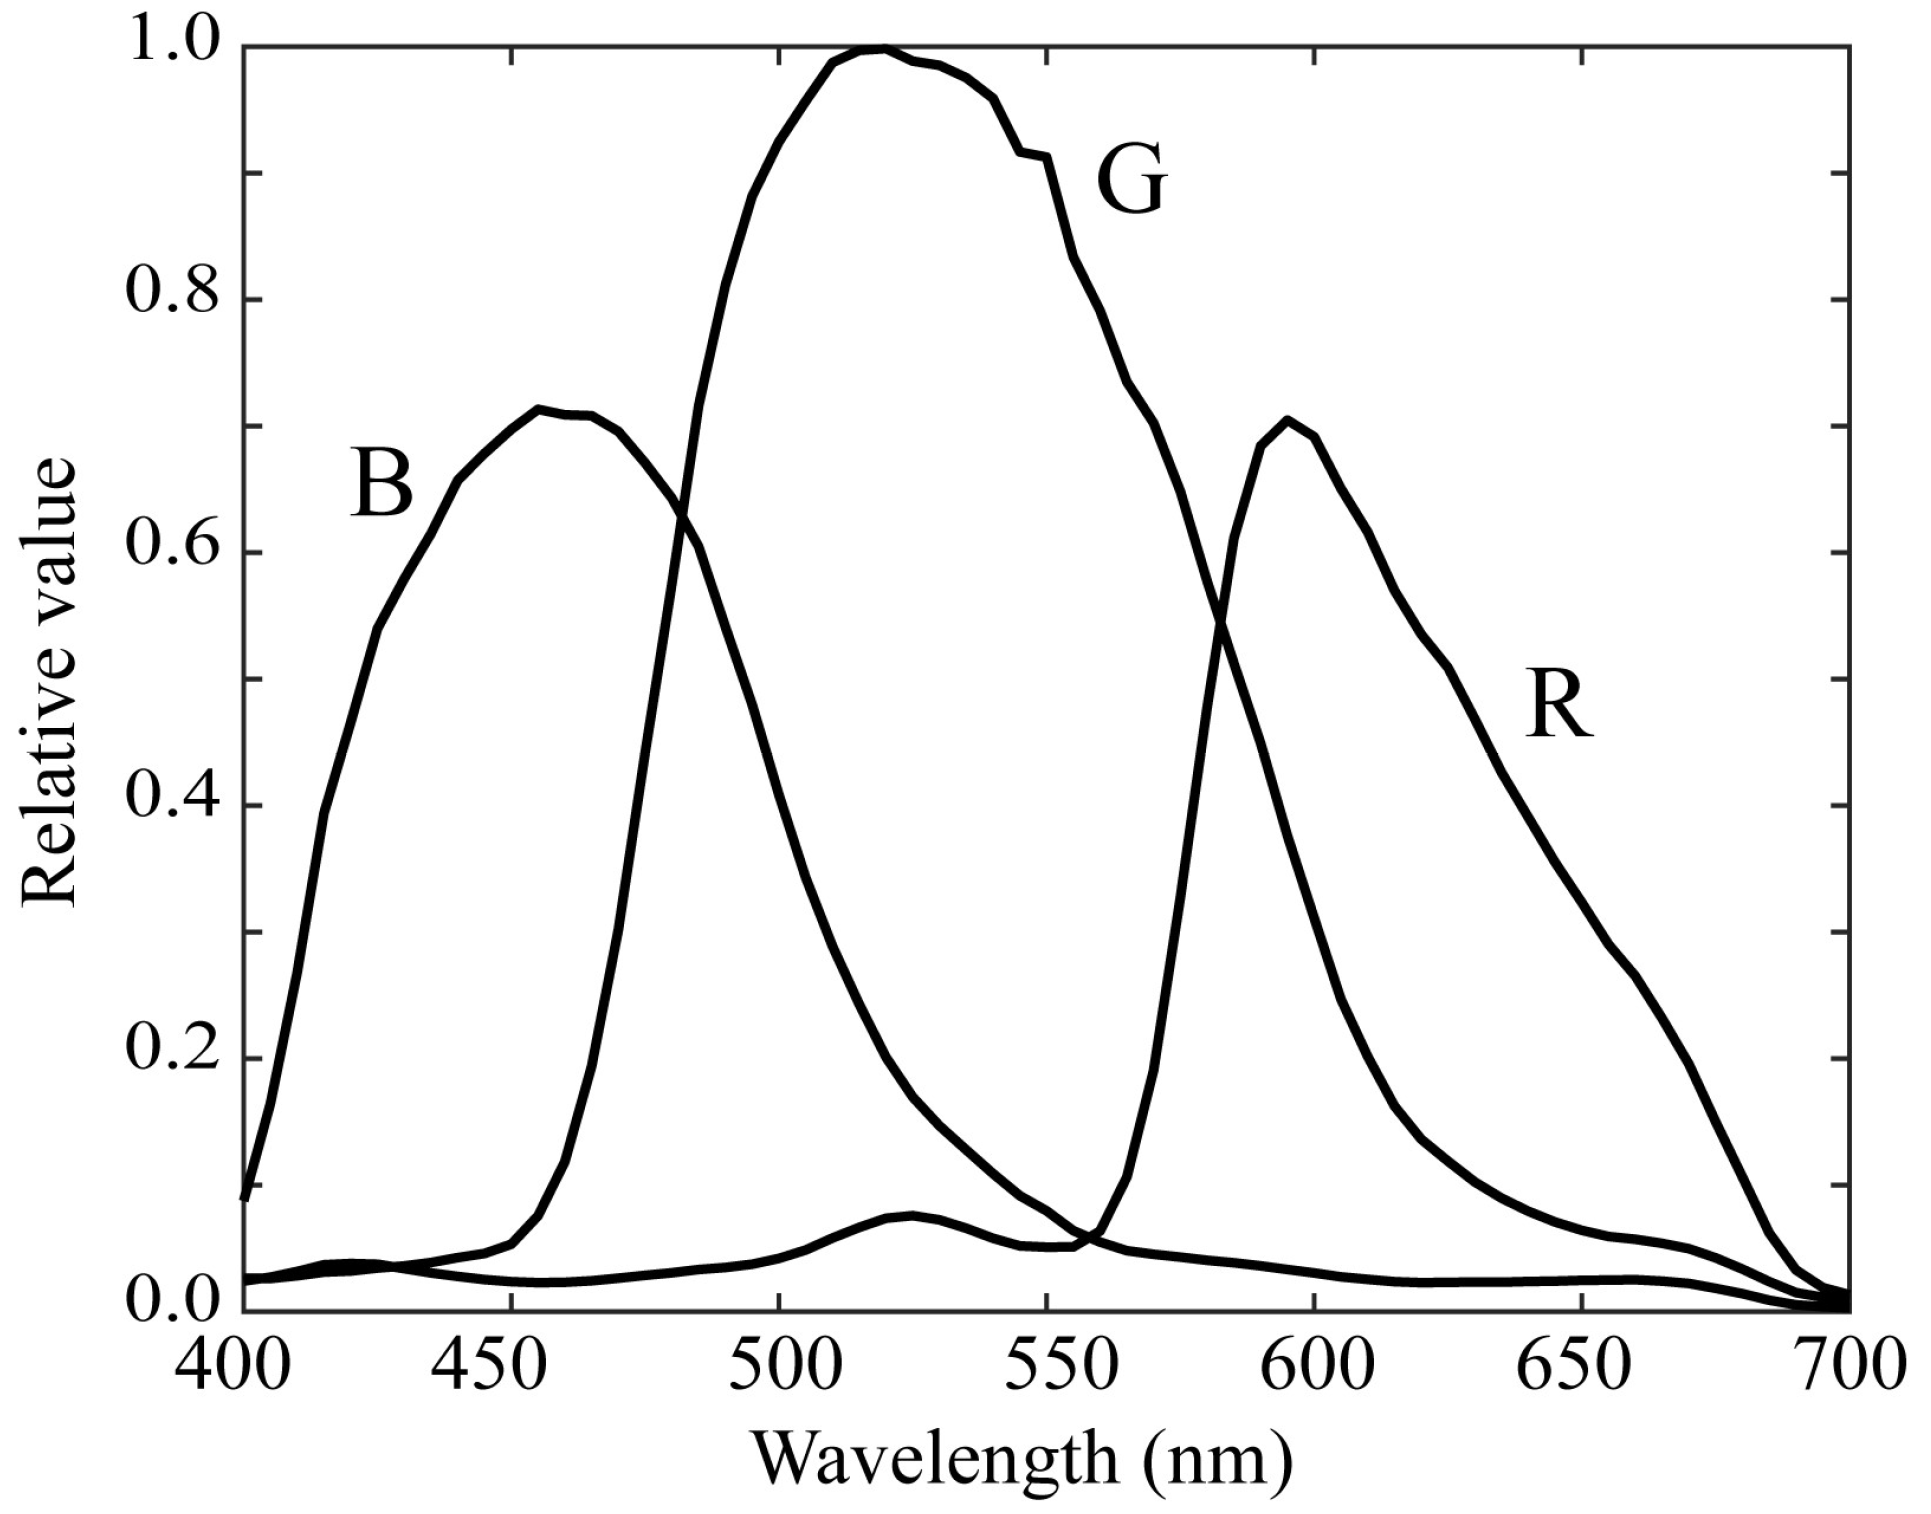
Because the fluorescence emission from rice grains has a spectral distribution that is mostly the visible wavelength range, we used a mobile phone camera with RGB channels (iPhone 6s; Apple Inc., Cupertino, CA, USA) and made it multiband. A similar multiband method was proposed for calculating the surface spectral reflectance [
22]. The camera depth was set to 12 bits. The curves of the spectral sensitivity functions of the RGB camera are shown in
Figure 3 [
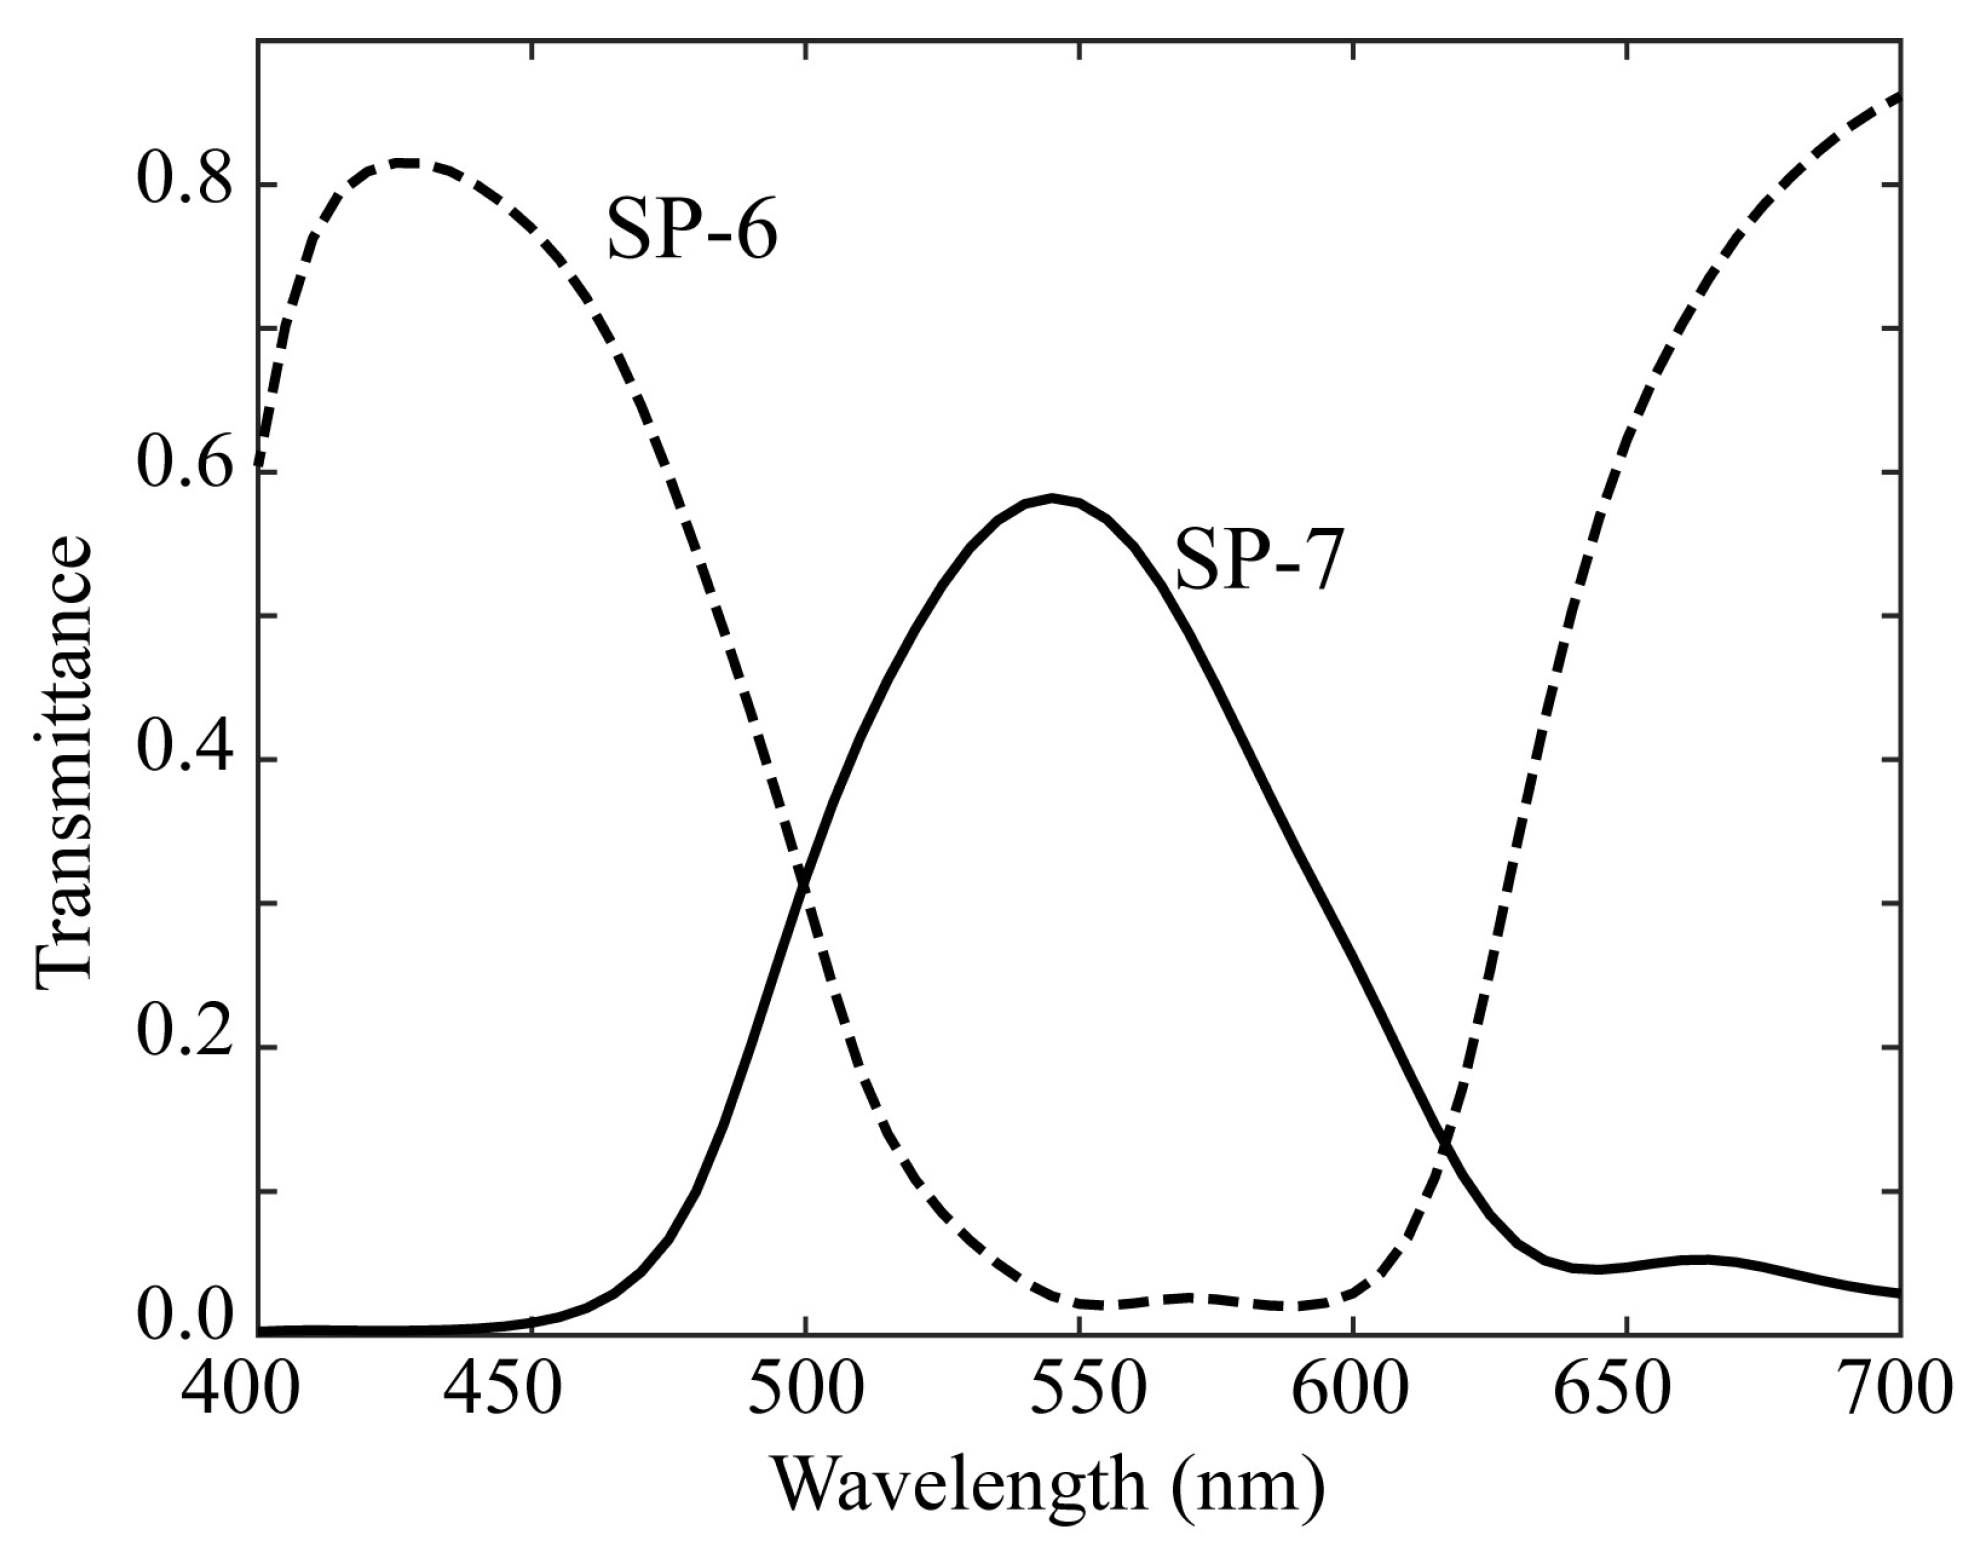
23]. For multiband image acquisition, we selected two color filters from a set of commercial color filters (Fujifilm Optical Filter, Fujifilm, Tokyo, Japan).
Figure 4 shows the spectral transmittance curves of the filters. Combining these transmittances with the original spectral sensitivities yielded different sets of trichromatic spectral sensitivity functions. The SP-6 filter was effective in shifting the spectral sensitivity to short and long wavelengths in the visible range, whereas the SP-7 filter was effective in shifting the spectral sensitivity to the middle wavelengths. Thus, the two sets of modified trichromatic spectral sensitivities resulted in an imaging system with six spectral bands in the visible wavelength region.
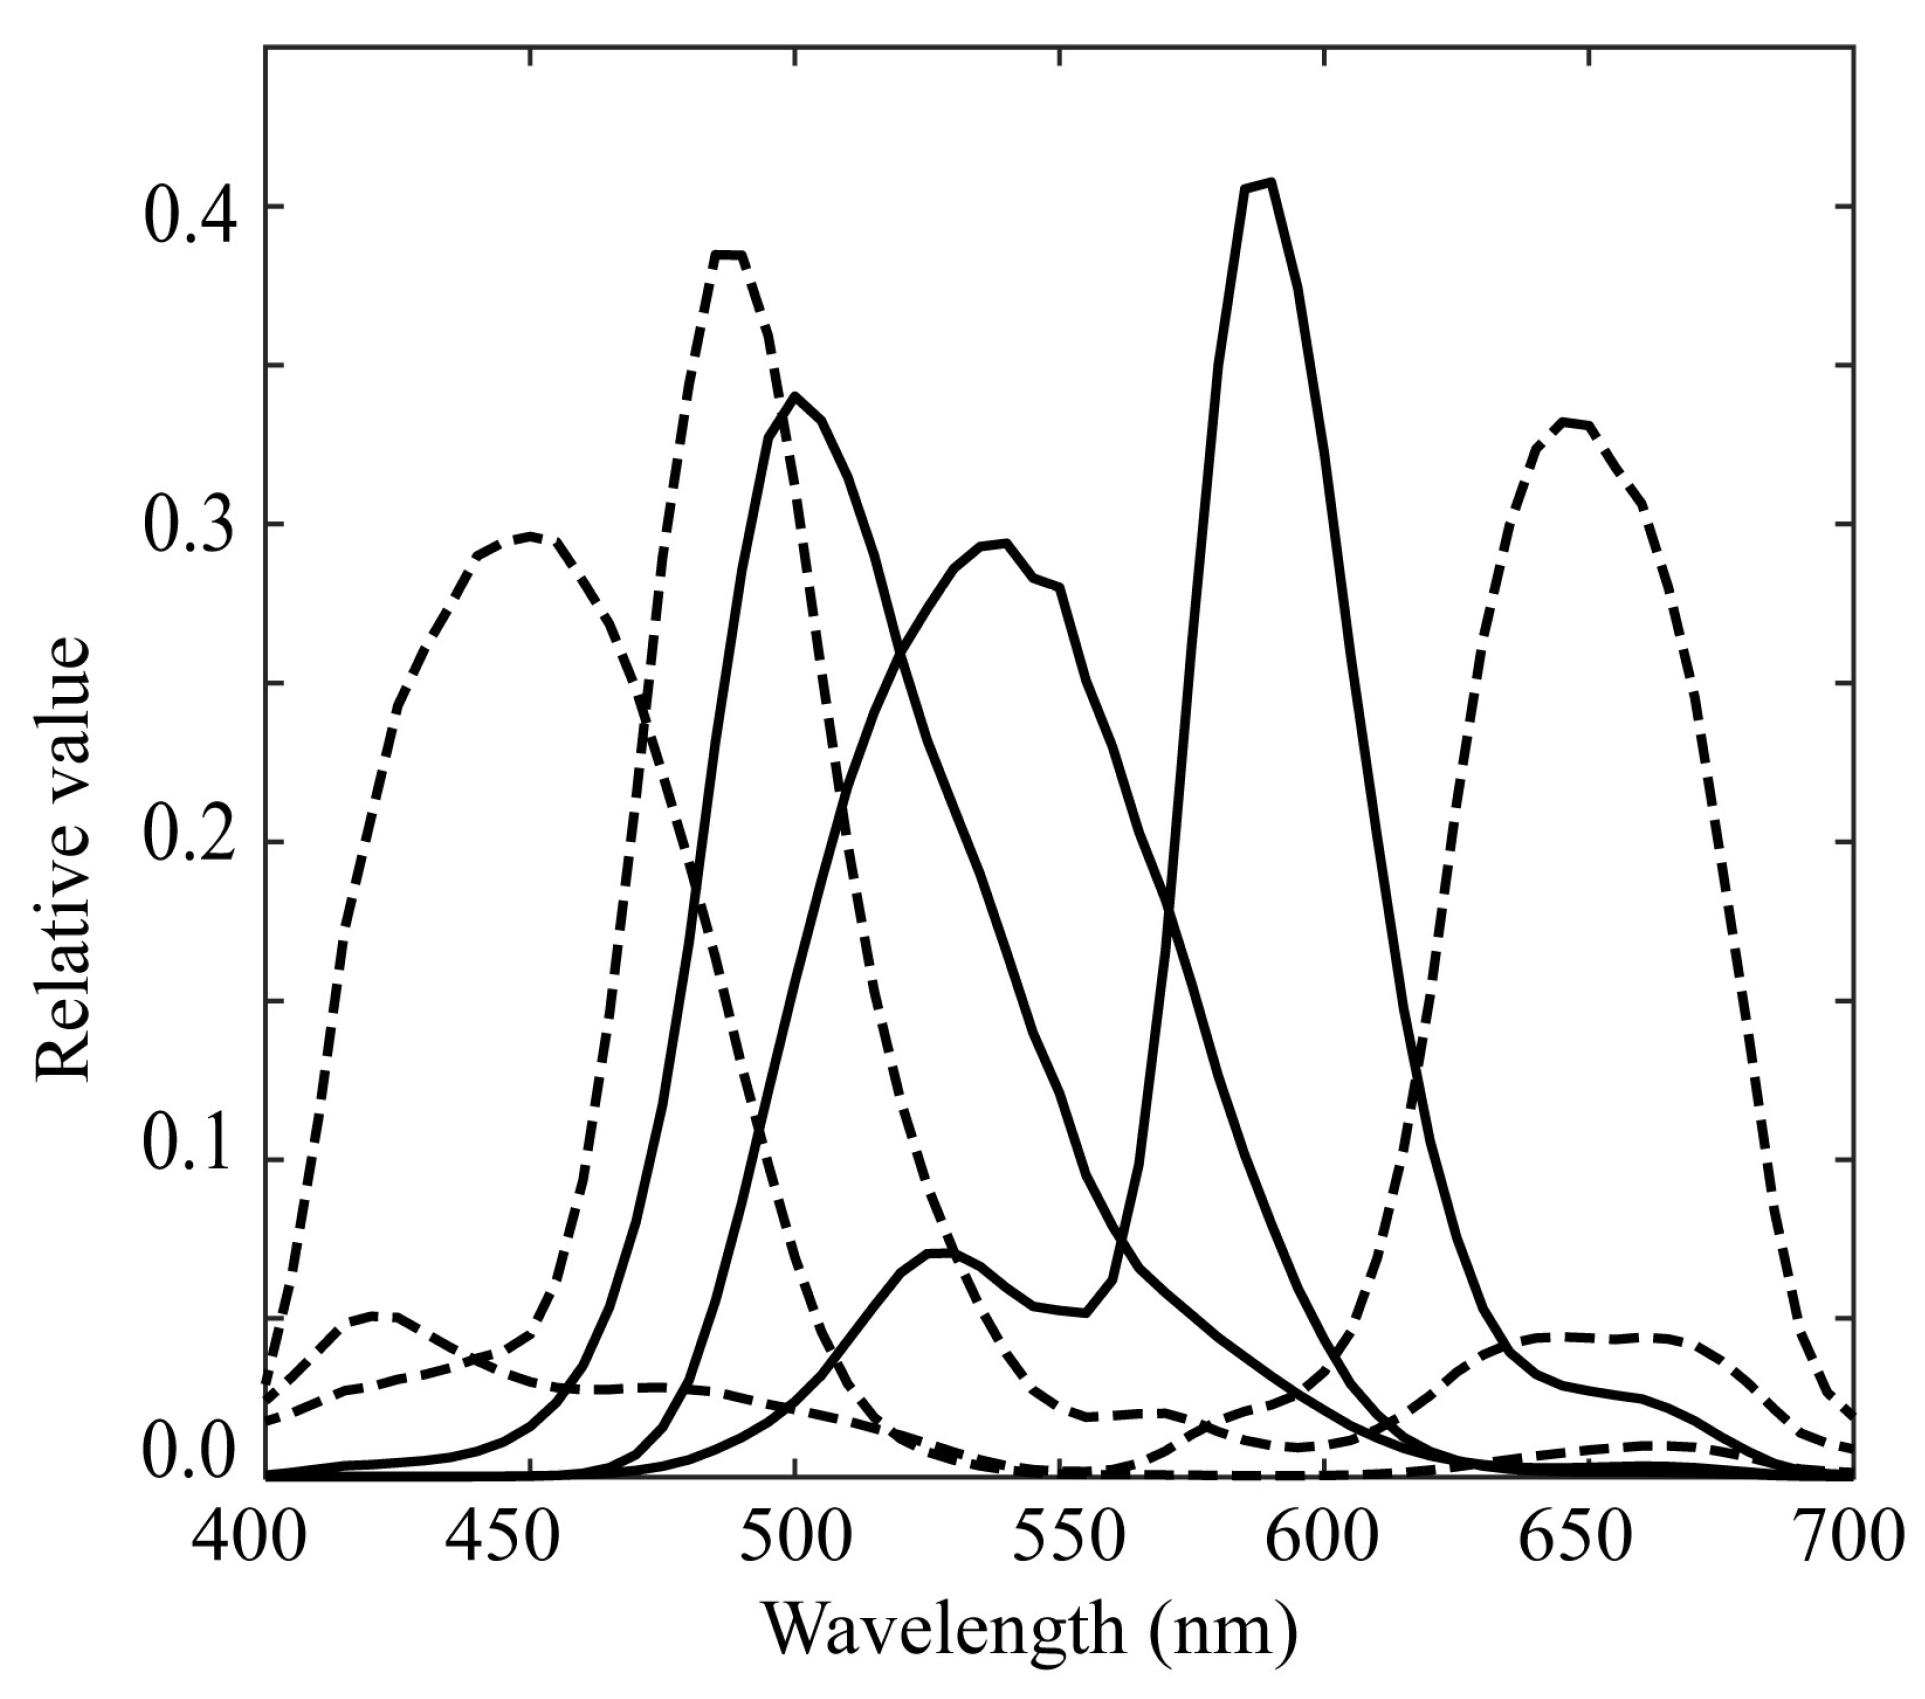
Figure 5 shows the overall spectral sensitivity functions of the proposed multiband imaging system with six channels constructed using an RGB mobile phone camera and two color filters. Notably, this multiband imaging system is suitable for fluorescence image acquisition over the entire visible range. Each filter was attached to the front of a mobile phone camera lens. The image of each channel was acquired using Adobe’s digital negative (DNG) format.
2.3. Multiband System Using a Monochrome Camera
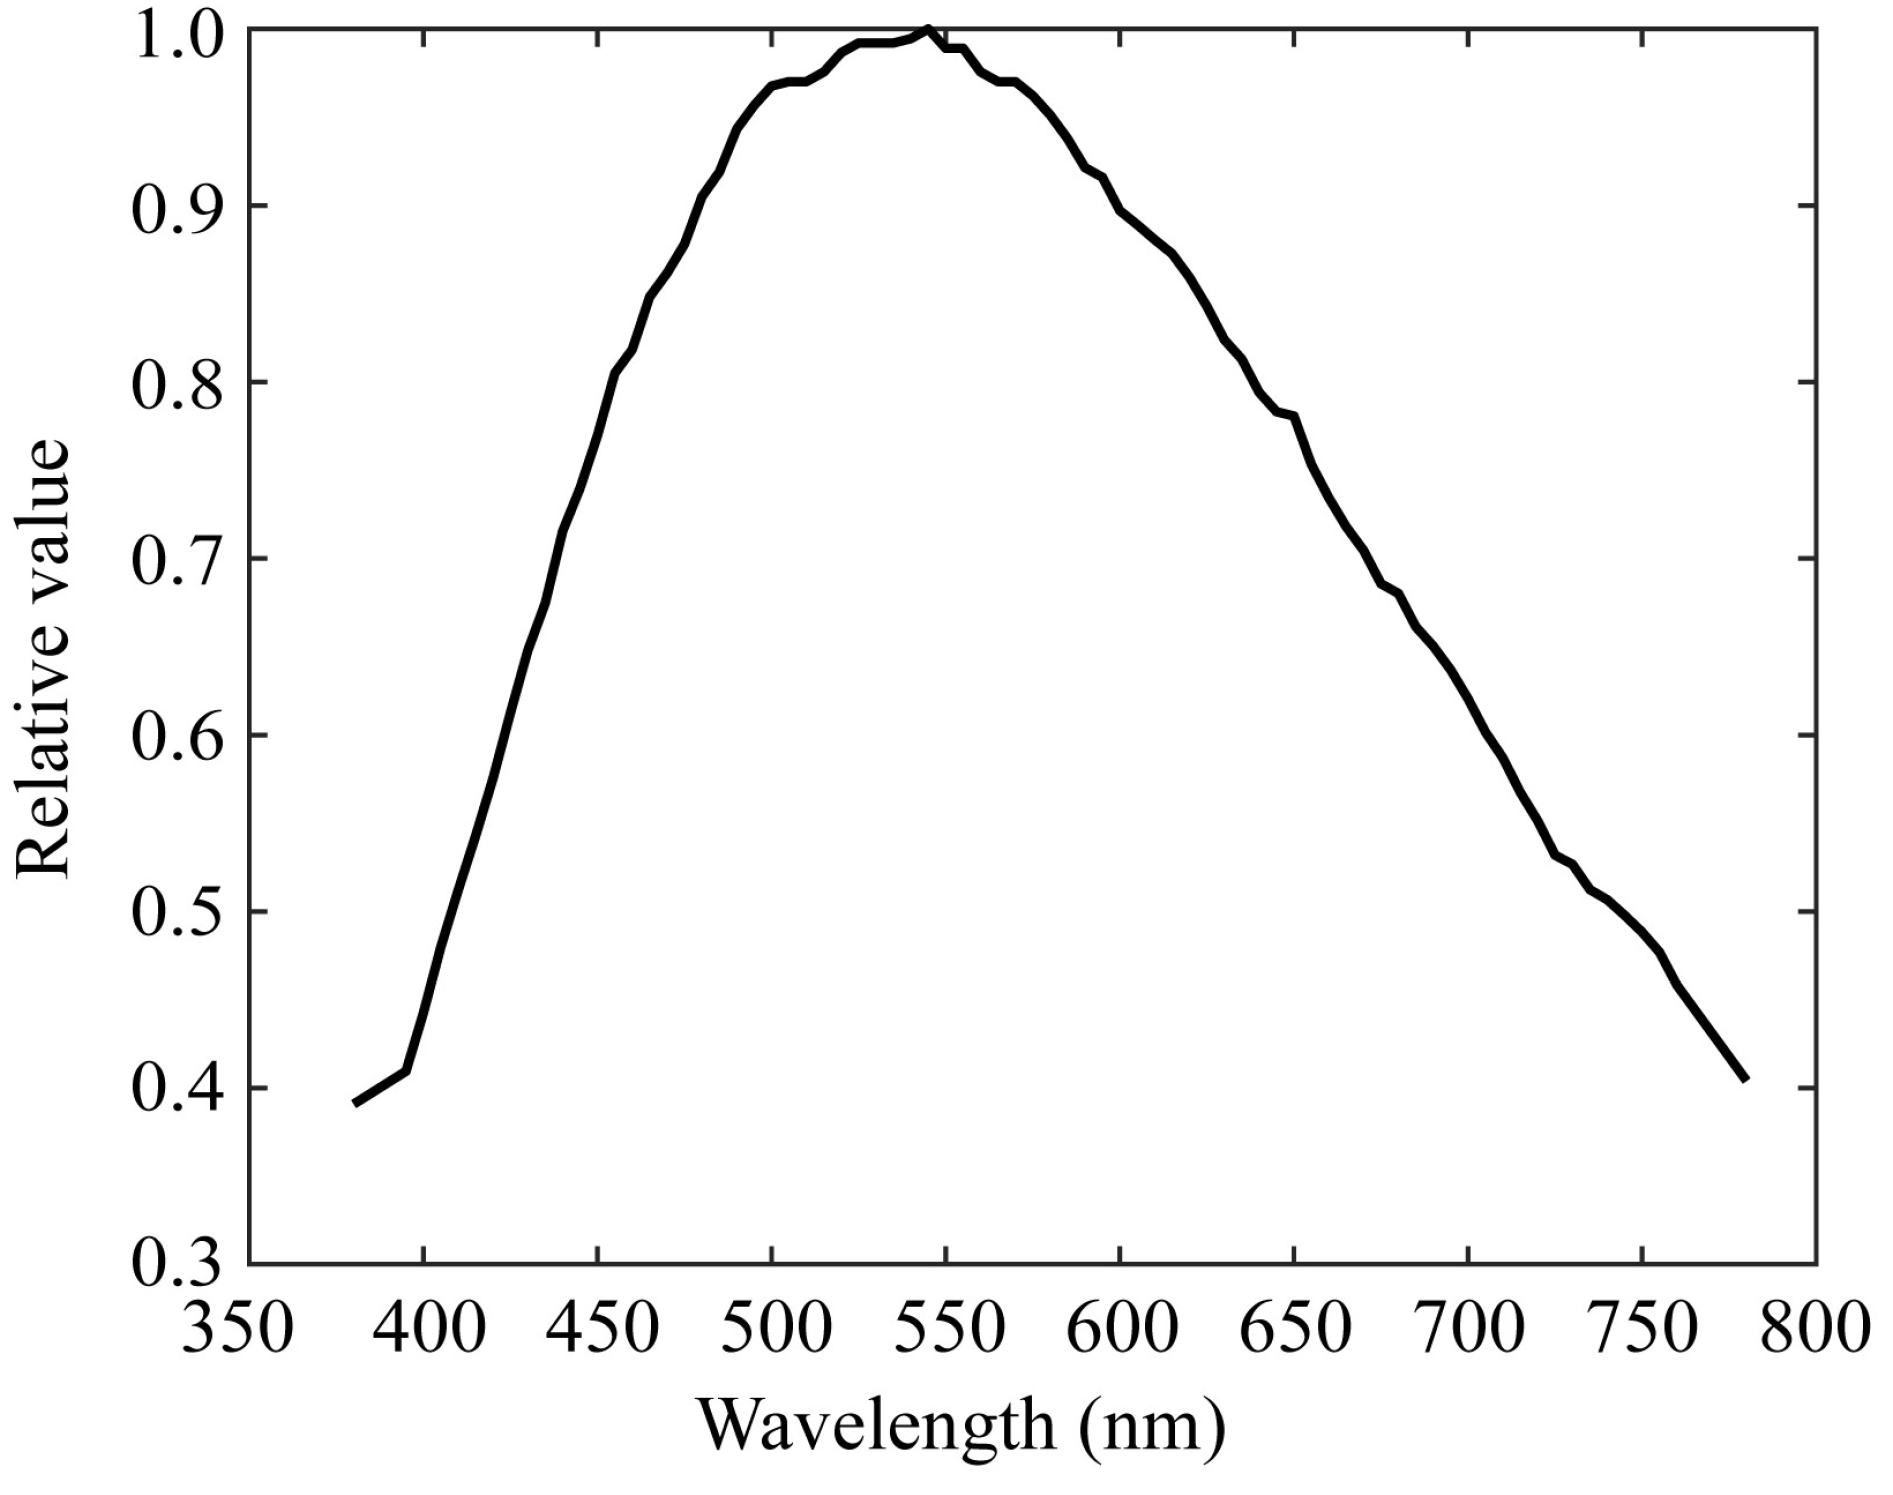
Chlorophyll fluorescence emissions from plant leaves have a spectral distribution in the red to far-red wavelength regions. Because the mobile phone camera did not have sufficient sensitivity in this wavelength region, as shown in
Figure 3, we used a monochrome camera and made it multi-band with additional filters. The camera was a monochrome CCD camera with a 12-bit dynamic range and a Peltier cooling (QImaging, Retiga 1300, Shoshin EM, Aichi, Japan). Additional optical filters were selected such that the combination of camera sensitivity and filter transmittance would result in an overall spectral sensitivity in the red to far-red region.
Figure 6 shows the spectral sensitivity function of the monochrome camera, which has a sensitivity of approximately 800 nm.
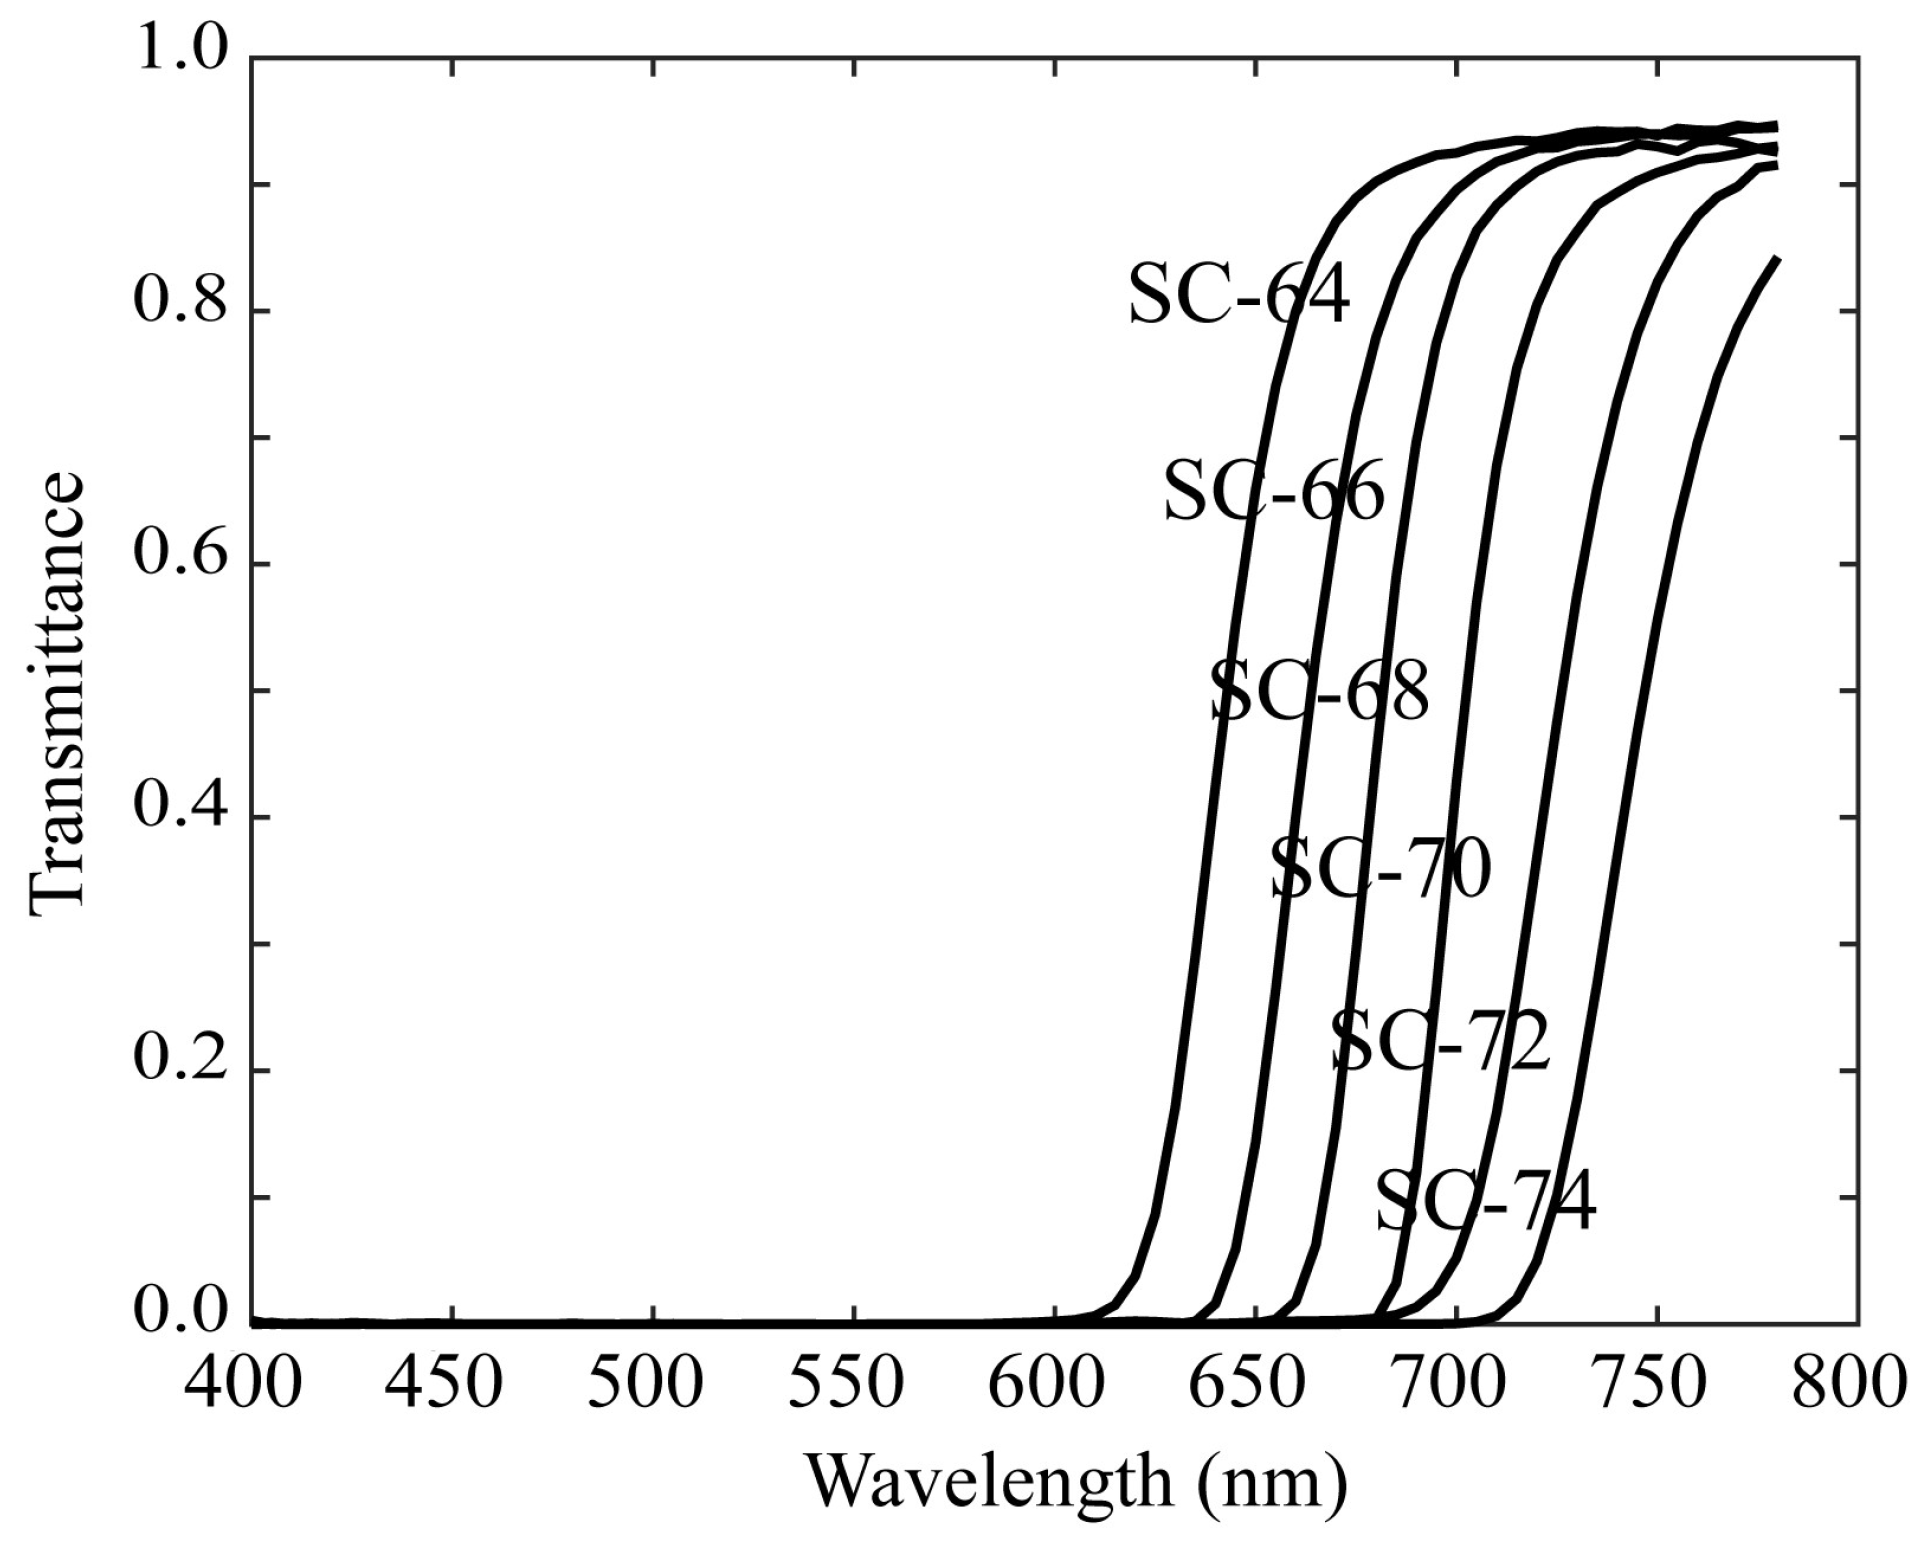
Figure 7 shows the spectral transmittance curves of six sharp-cut filters, SC-64, SC-66, SC-68, SC-70, SC-72, and SC-74 (Fujifilm Optical Filter, Fujifilm, Tokyo, Japan), selected for multiband image acquisition. Each filter was attached to the front of the camera lens.
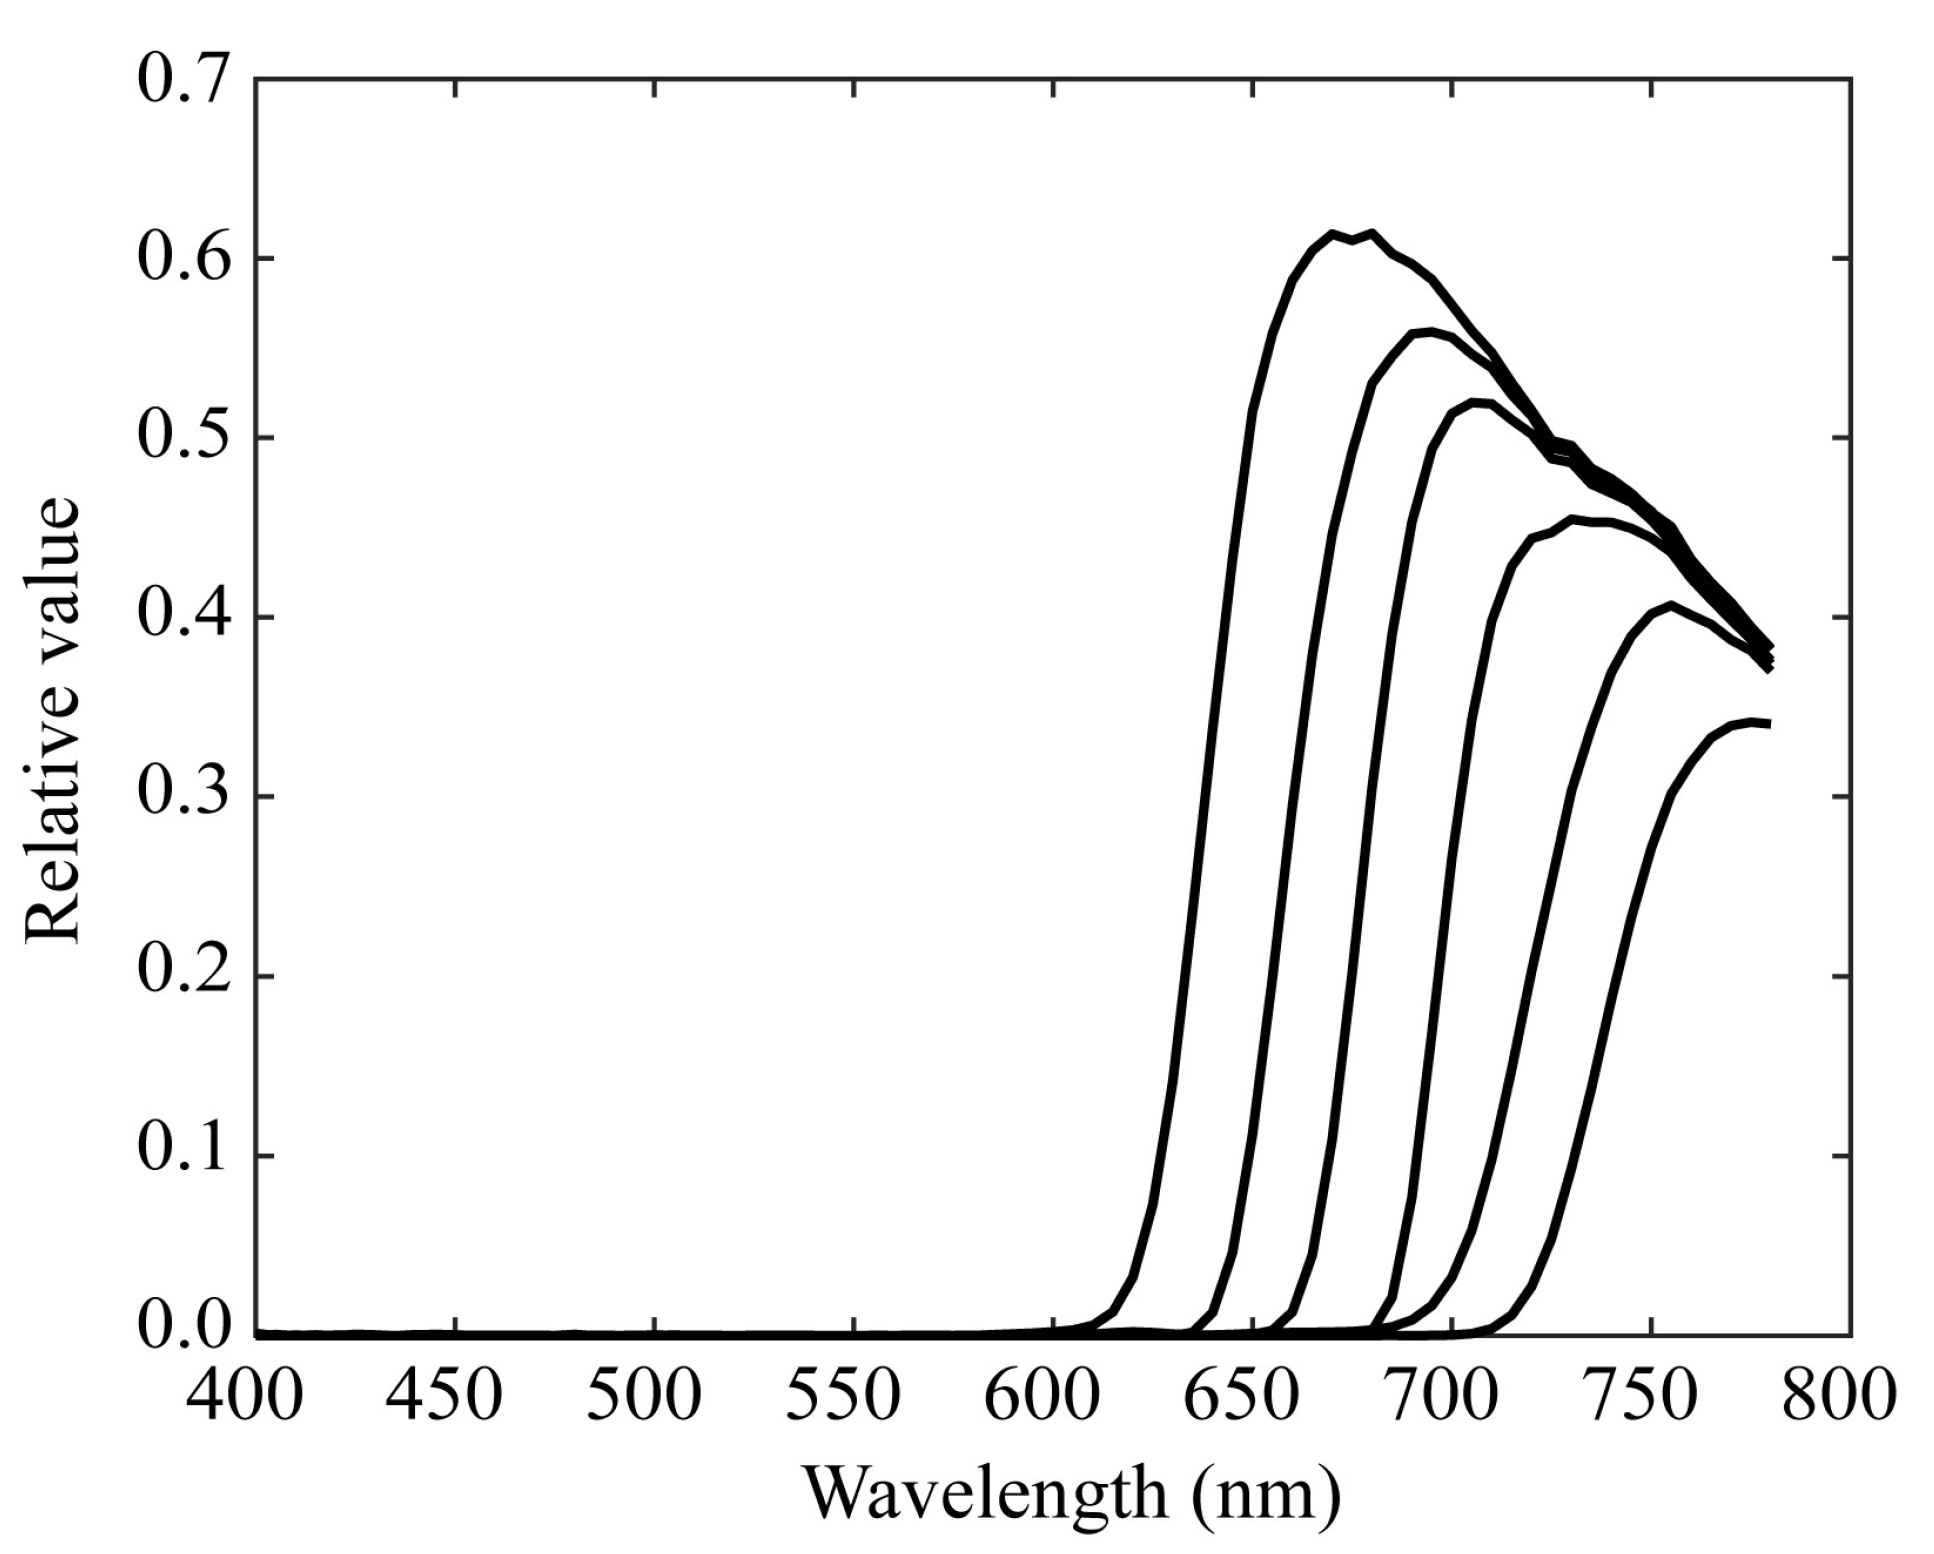
Figure 8 shows the resulting overall spectral sensitivity functions of the proposed multiband imaging system with six channels constructed using a monochrome camera and six sharp-cut filters.
The present imaging system is specialized for detecting fluorescence spectra in the red to far-red region. The image data were acquired in 12-bit TIFF (tag image file format) format. We note that fluorescence emission from rice grains can also be detected using the monochrome camera with six appropriate filters. However, the first imaging system using a mobile phone camera with two filters is much simpler in this case.
3. Spectral Estimation Method
3.1. Observation Model
We used two types of multiband imaging systems with six channels for observing fluorescence images emitted from rice grains and plant leaves. Let the outputs of the imaging system be expressed as six observations
(
i = 1, 2, …, 6).
where
denotes the spectral power distribution of the fluorescence emitted from the target plant, and
(
i = 1, 2, …, 6) denotes the spectral sensitivity functions of the multiband imaging systems. The wavelength range of integration is in the visible range (400–700 nm) for the first imaging system of rice grains and in a wider range (400–780 nm), including red to far-red, for the second imaging system of plant leaves. The sensitivity functions
are presented in
Figure 5 and
Figure 8 for the first and second systems, respectively, which are defined by multiplying the RGB spectral sensitivity functions of the mobile phone camera and the spectral transmittance of the additional color filters for the first system and by multiplying the spectral sensitivity functions of the monochrome camera and the spectral transmittance of the additional sharp-cut filters for the second system.
For the digital representation, the fluorescence spectra and spectral sensitivities are sampled at
N wavelength points at equal intervals and represented by
N-dimensional column vectors as follows:
The discrete representation of the observation model is expressed in the matrix form as follows:
where
A denotes a (6
× N) matrix defined by the spectral sensitivities and expressed as follows:
and
y is a 6-dimensional column vector expressed as follows:
Superscript t andin Eq. (4) represent the matrix transposition and wavelength sampling intervals, respectively. When the continuous spectra are sampled with=5, the discrete spectral functions are represented by 61-dimensional column vectors with N = 61 in the 400–700 nm range for the first system and 77-dimensional column vectors with N = 77 in the 400–780 nm range for the second imaging system.
3.2. Estimation Algorithm
We estimate the fluorescence spectrum
x from observation
y at every pixel point based on the observation model in Eq. (3). In a preliminary study [
11], a statistical approach of the simplified Wiener-like method was presented for a model with a noise term, where the autocorrelation matrix was formally set to an identity matrix; that is, every spectrum other than itself was uncorrelated, and the noise variance was estimated as an unknown parameter. We assumed that the spectral distribution of the fluorescence emission could be directly measured with a spectroradiometer simultaneously as capturing the image using the multiband imaging system. Therefore, the noise variance was determined so that the error between the average fluorescence spectra estimated over the target image area and the fluorescence spectrum measured directly by the spectroradiometer was minimized.
Herein, we consider a method to estimate the best fluorescence emission spectral distribution from only the acquired image data without relying on a spectroradiometer. Let us consider the number of observations as
p (=6). If
, we have the well-known least squares solution. Here, we note that
. In this case, an infinite number of solutions satisfy Eq. (3), and the minimum norm solution among them is expressed as follows (see [
24])
However, this solution method sometimes has a large estimation error and is not reliable for solving the present problem.
In this study, we adopted the ridge regression method [
1][
21], which estimates the coefficients of multiple regression models in scenarios where the independent variables are highly correlated. Ridge regression can provide a possible solution for the imprecision of minimum norm estimators when linear regression models have highly correlated independent variables. Consequently, the following ridge regression estimator has often smaller error than the minimum norm estimator in Eq. (6).
In the present case, the ridge estimator is expressed as follows:
where
y denotes the
p-dimensional observation vector,
A denotes the (
pN) matrix defined in (4), and
denotes the (
pp) identity matrix. The ridge parameter
λ ≥ 0serves as the constant shifting the diagonals of the matrix
. Therefore, even if the matrix
is near singular, the influence of singularity is alleviated by adding constant elements to the diagonals.
To identify the most proper ridge parameter
, we use the cross-validation technique, specifically called
p-fold cross-validation or leave-one-out [
25]. This technique divides the data into
p parts, one of which is used as test data, and the remaining
p-1 parts are used as training data to evaluate the accuracy rate. Training is performed
p times, so that all
p pieces of data are used as test data once, and then the average accuracy is obtained. The practical algorithm is as follows.
First, we divide the matrix
A and the vector
y as follows:
where
(
i=1, 2, …,
p) and then define the remainder after removing
i-th row from
A and
y as follows:
The estimate of
x and error of the test observations using these data are described as follows:
where
i = 1, 2, …,
p. The sum of the squared errors is then obtained as follows:
Therefore, the ridge parameteris determined to minimize the error function J. Normally, the optimal value ofis searched in the range > 0.
4. Experimental Results
4.1. Fluorescence Estimation for Rice Grains
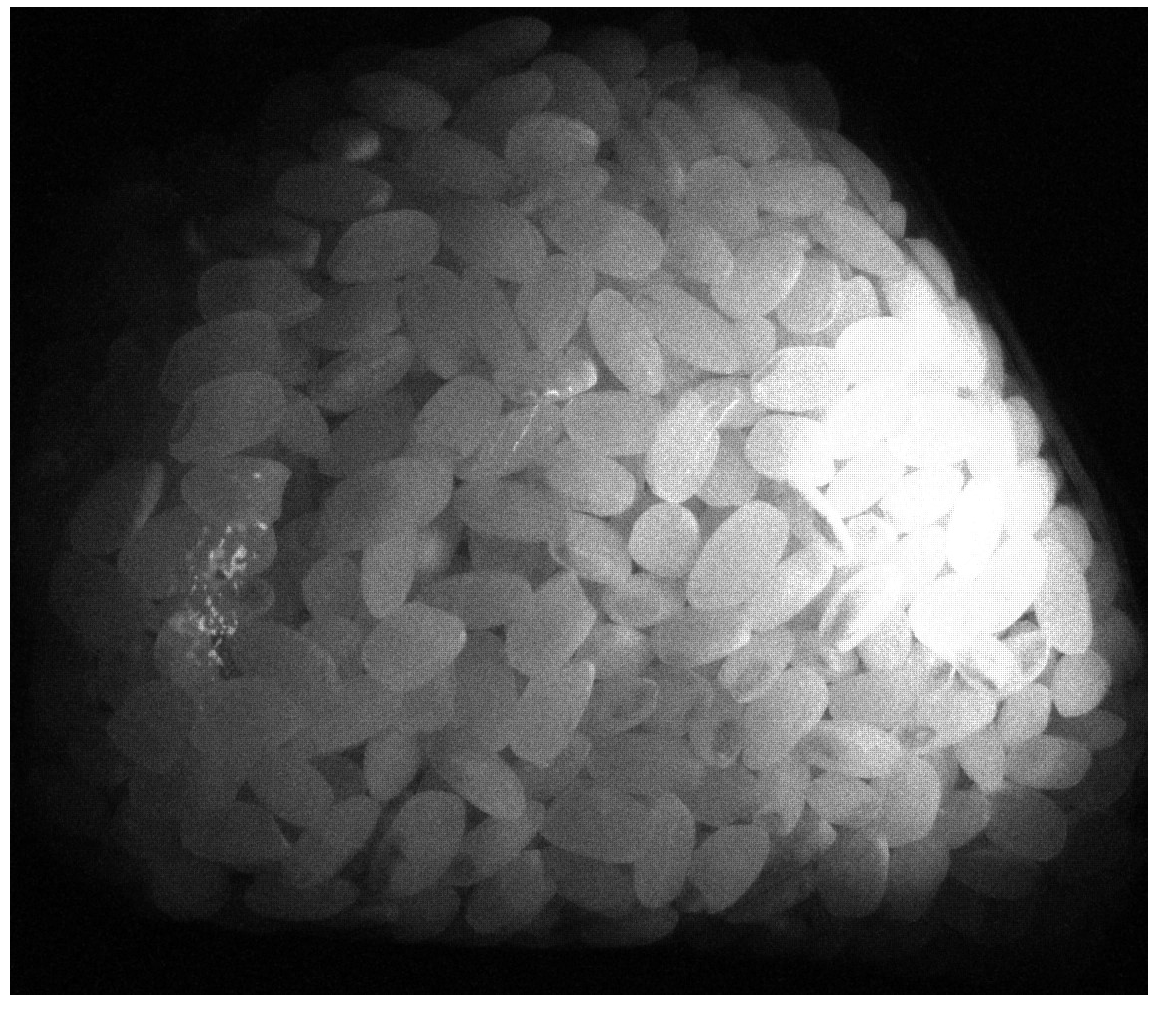
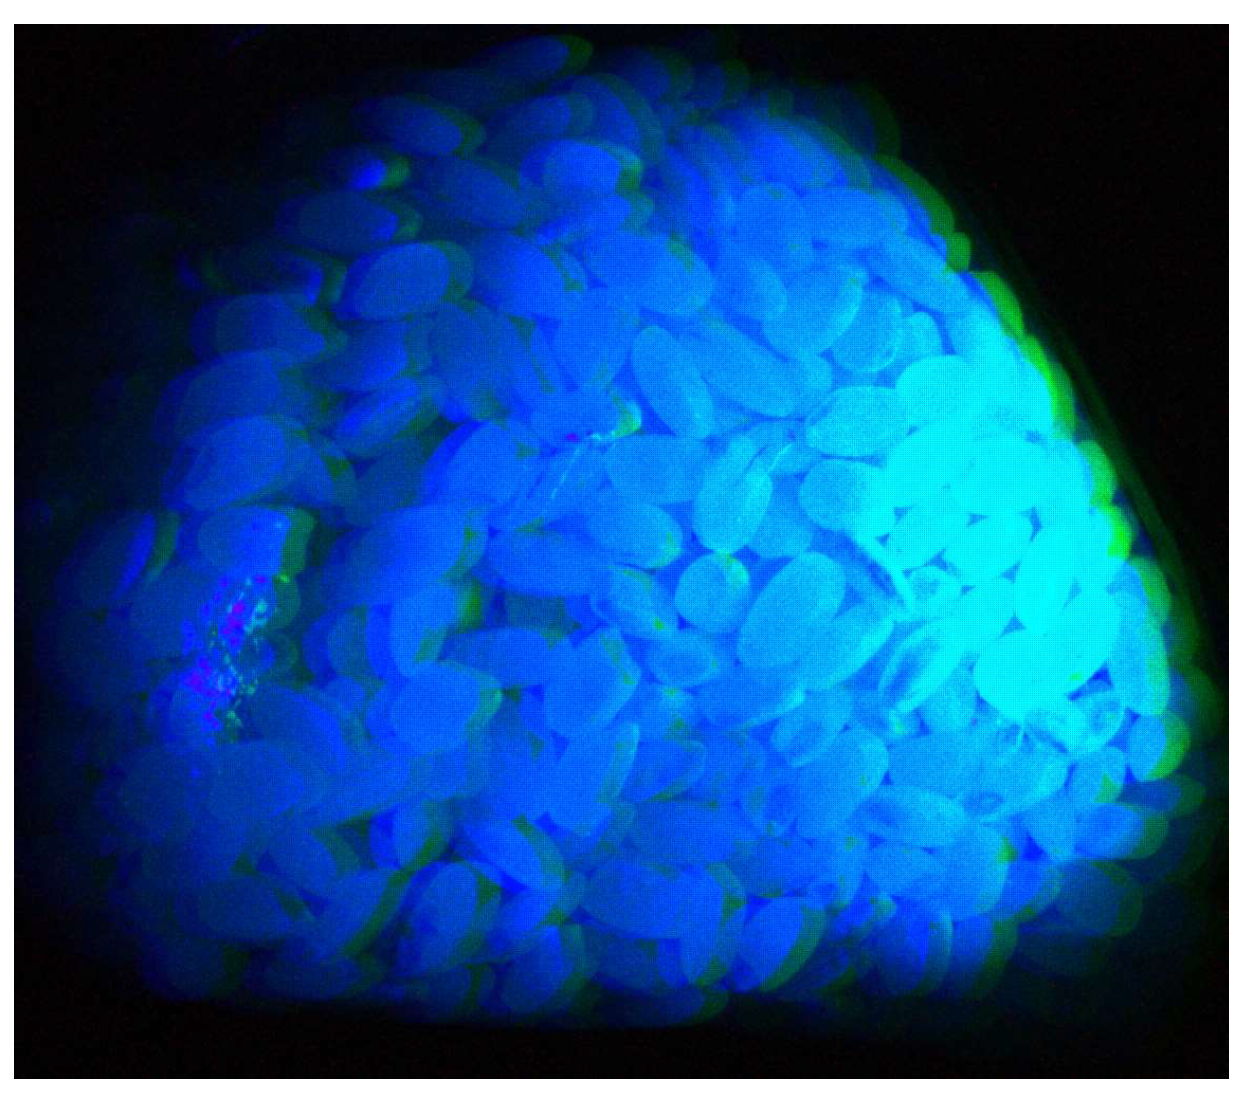
We examined "blended rice,” which is a mixture of rice from different regions and brands. As shown in
Figure 9, the rice grains were placed in a transparent bag and illuminated with UV light from the outside. Multiband images of rice grain surfaces were captured using the first imaging system. The observation
y was averaged over an appropriate region of the object surface to estimate the spectral distribution of the fluorescence emission.
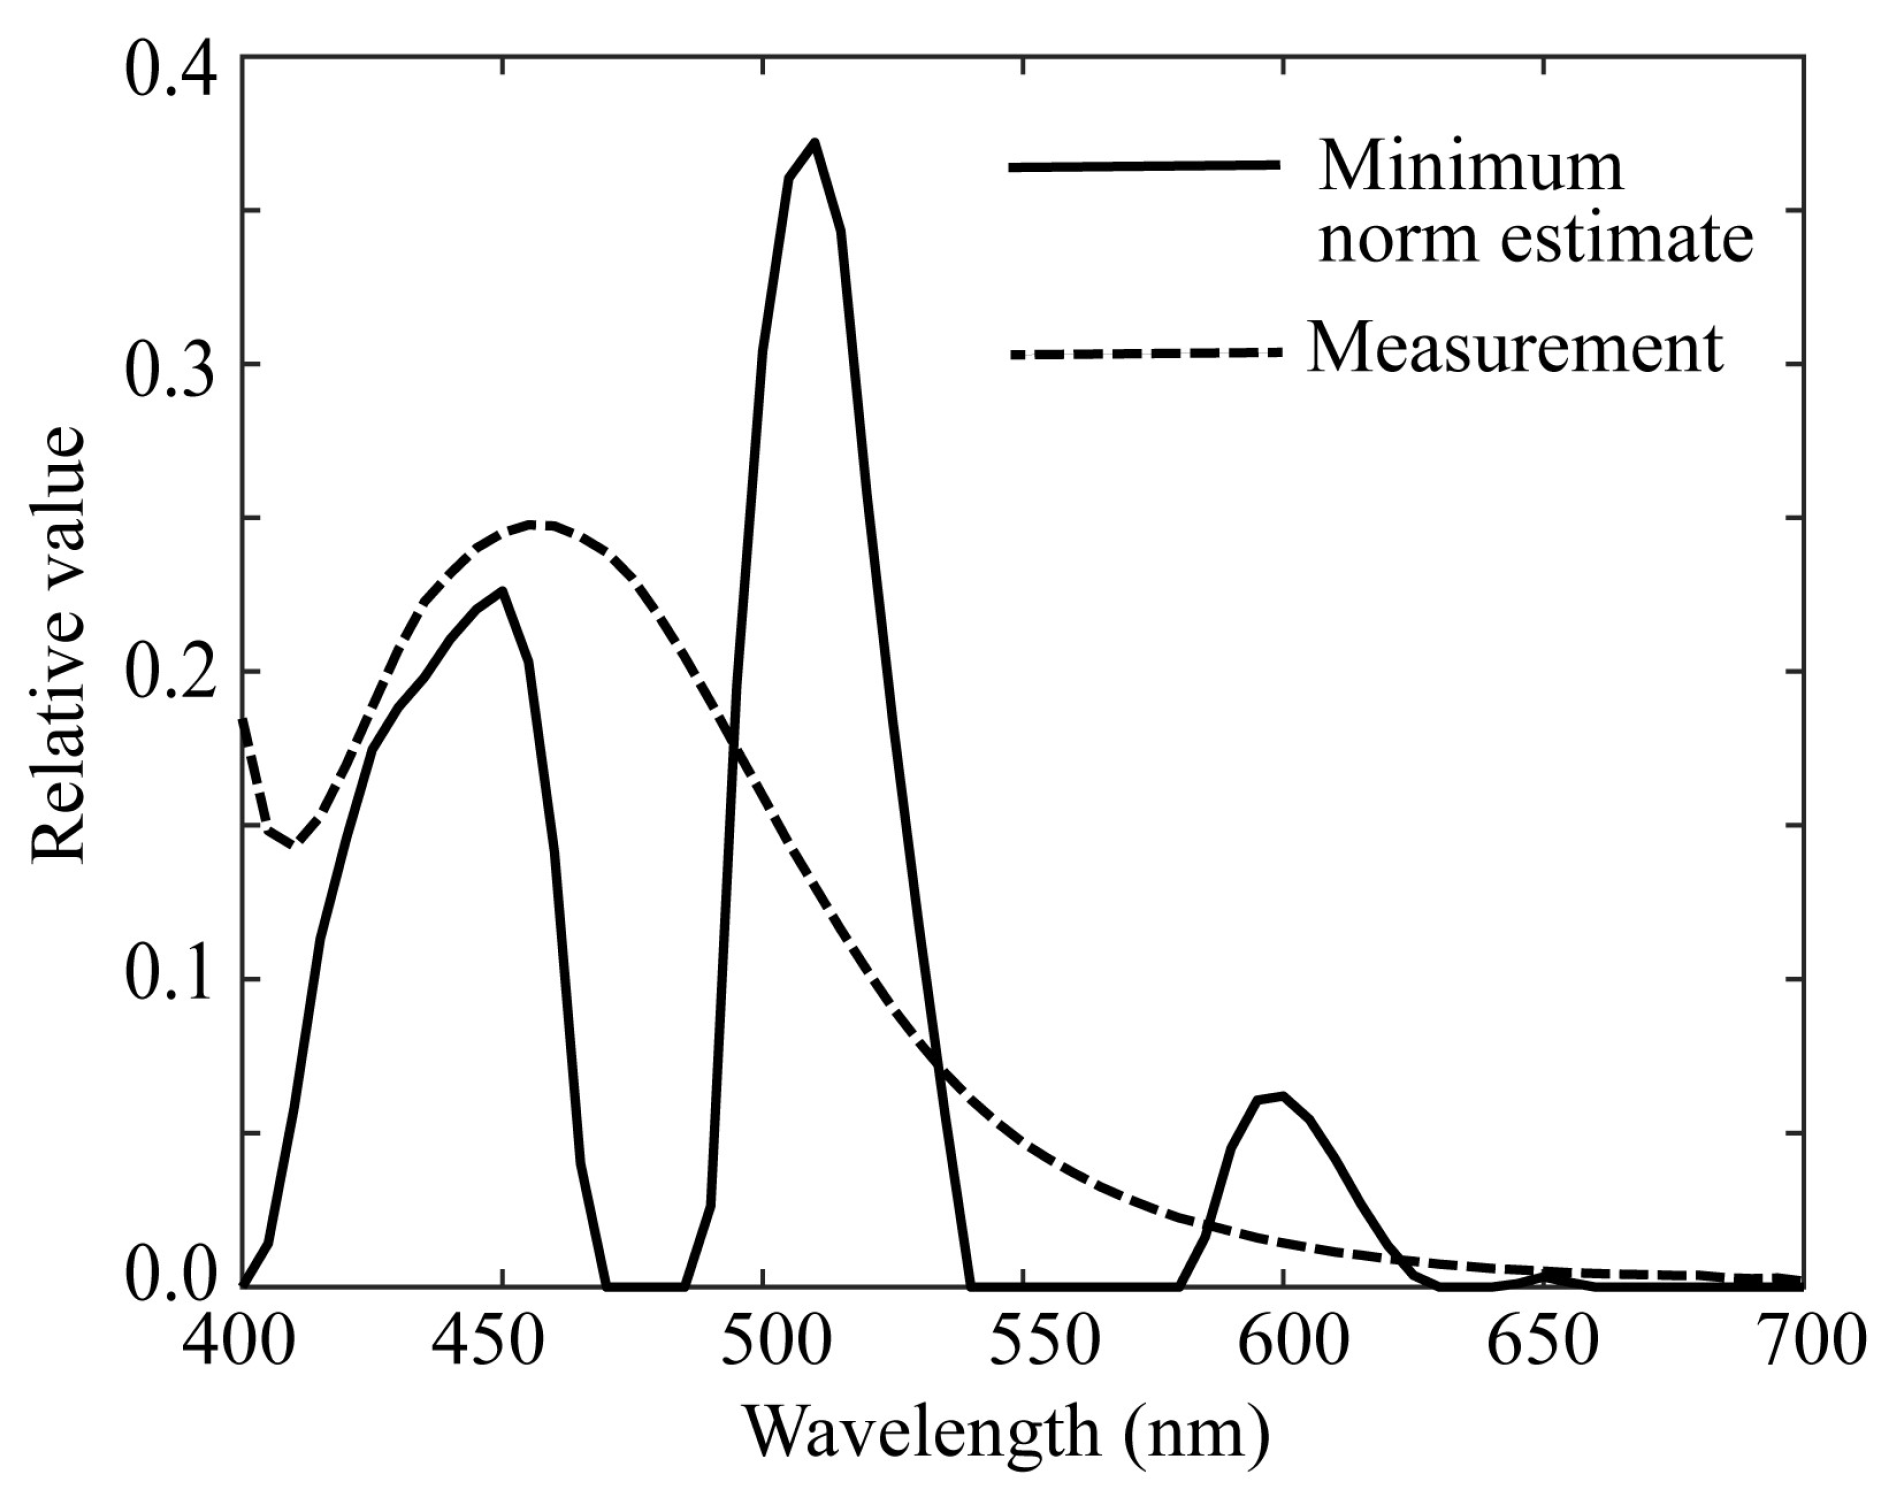
First, the minimum norm estimate was obtained using Eq. (6).
Figure 10 shows this estimate, which is compared with the spectral distribution measured using a spectroradiometer. In the figure, the estimated
and measured
were normalized as
. The minimum norm estimate had a large sum of squared error, 0.5807, and was not reliable. The increase in the measured spectral curve at 400 nm was attributed to the effect of the illuminated UV light.
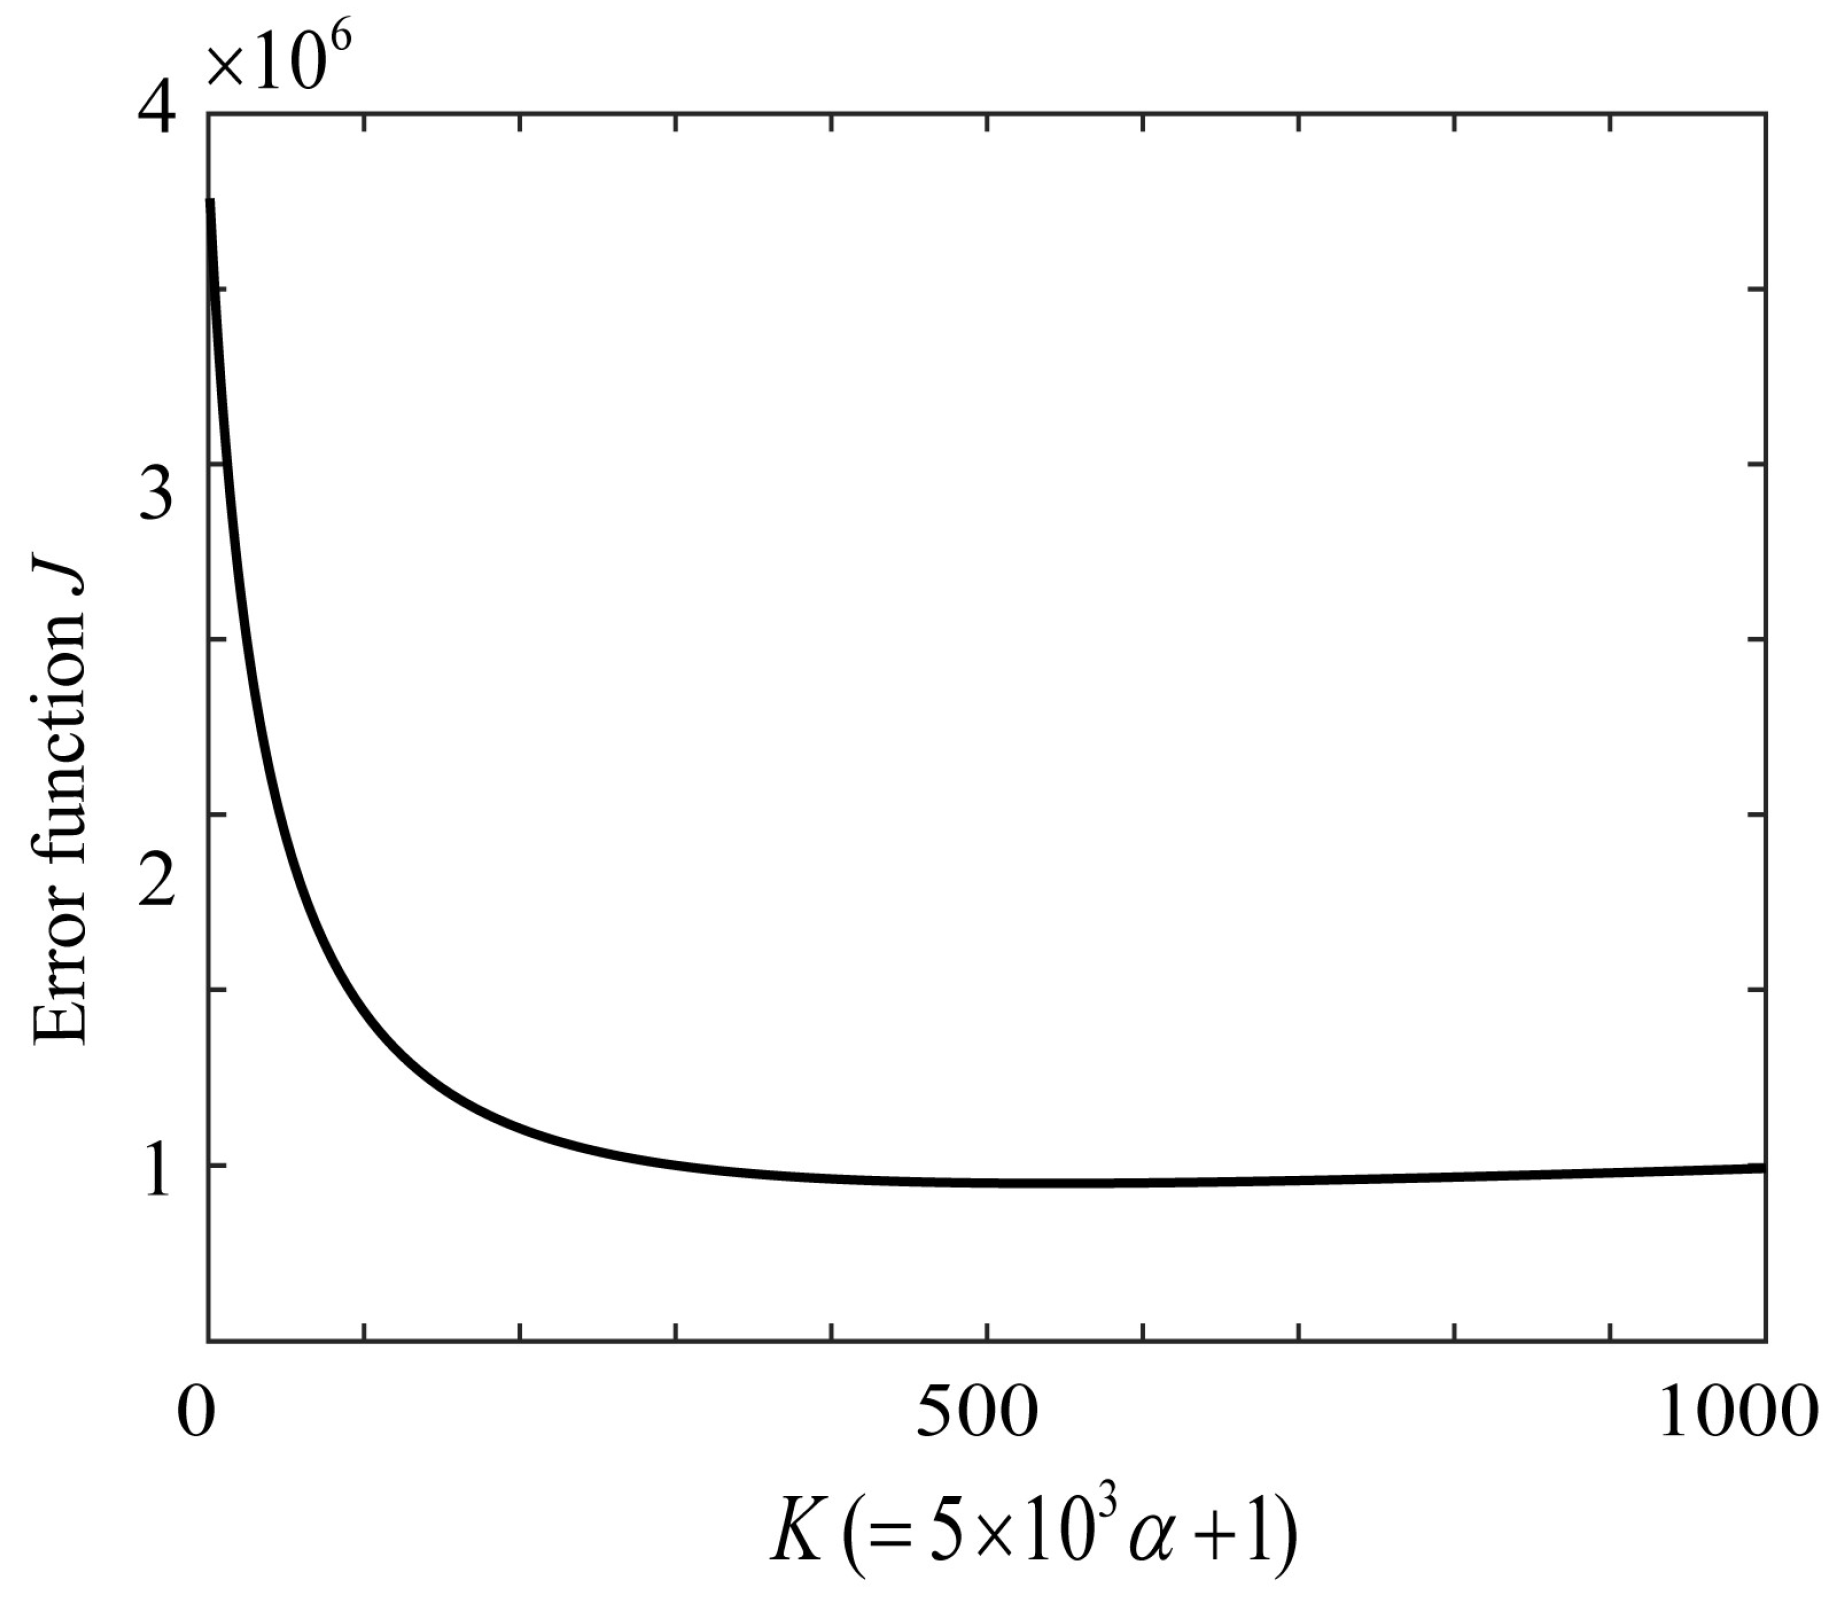
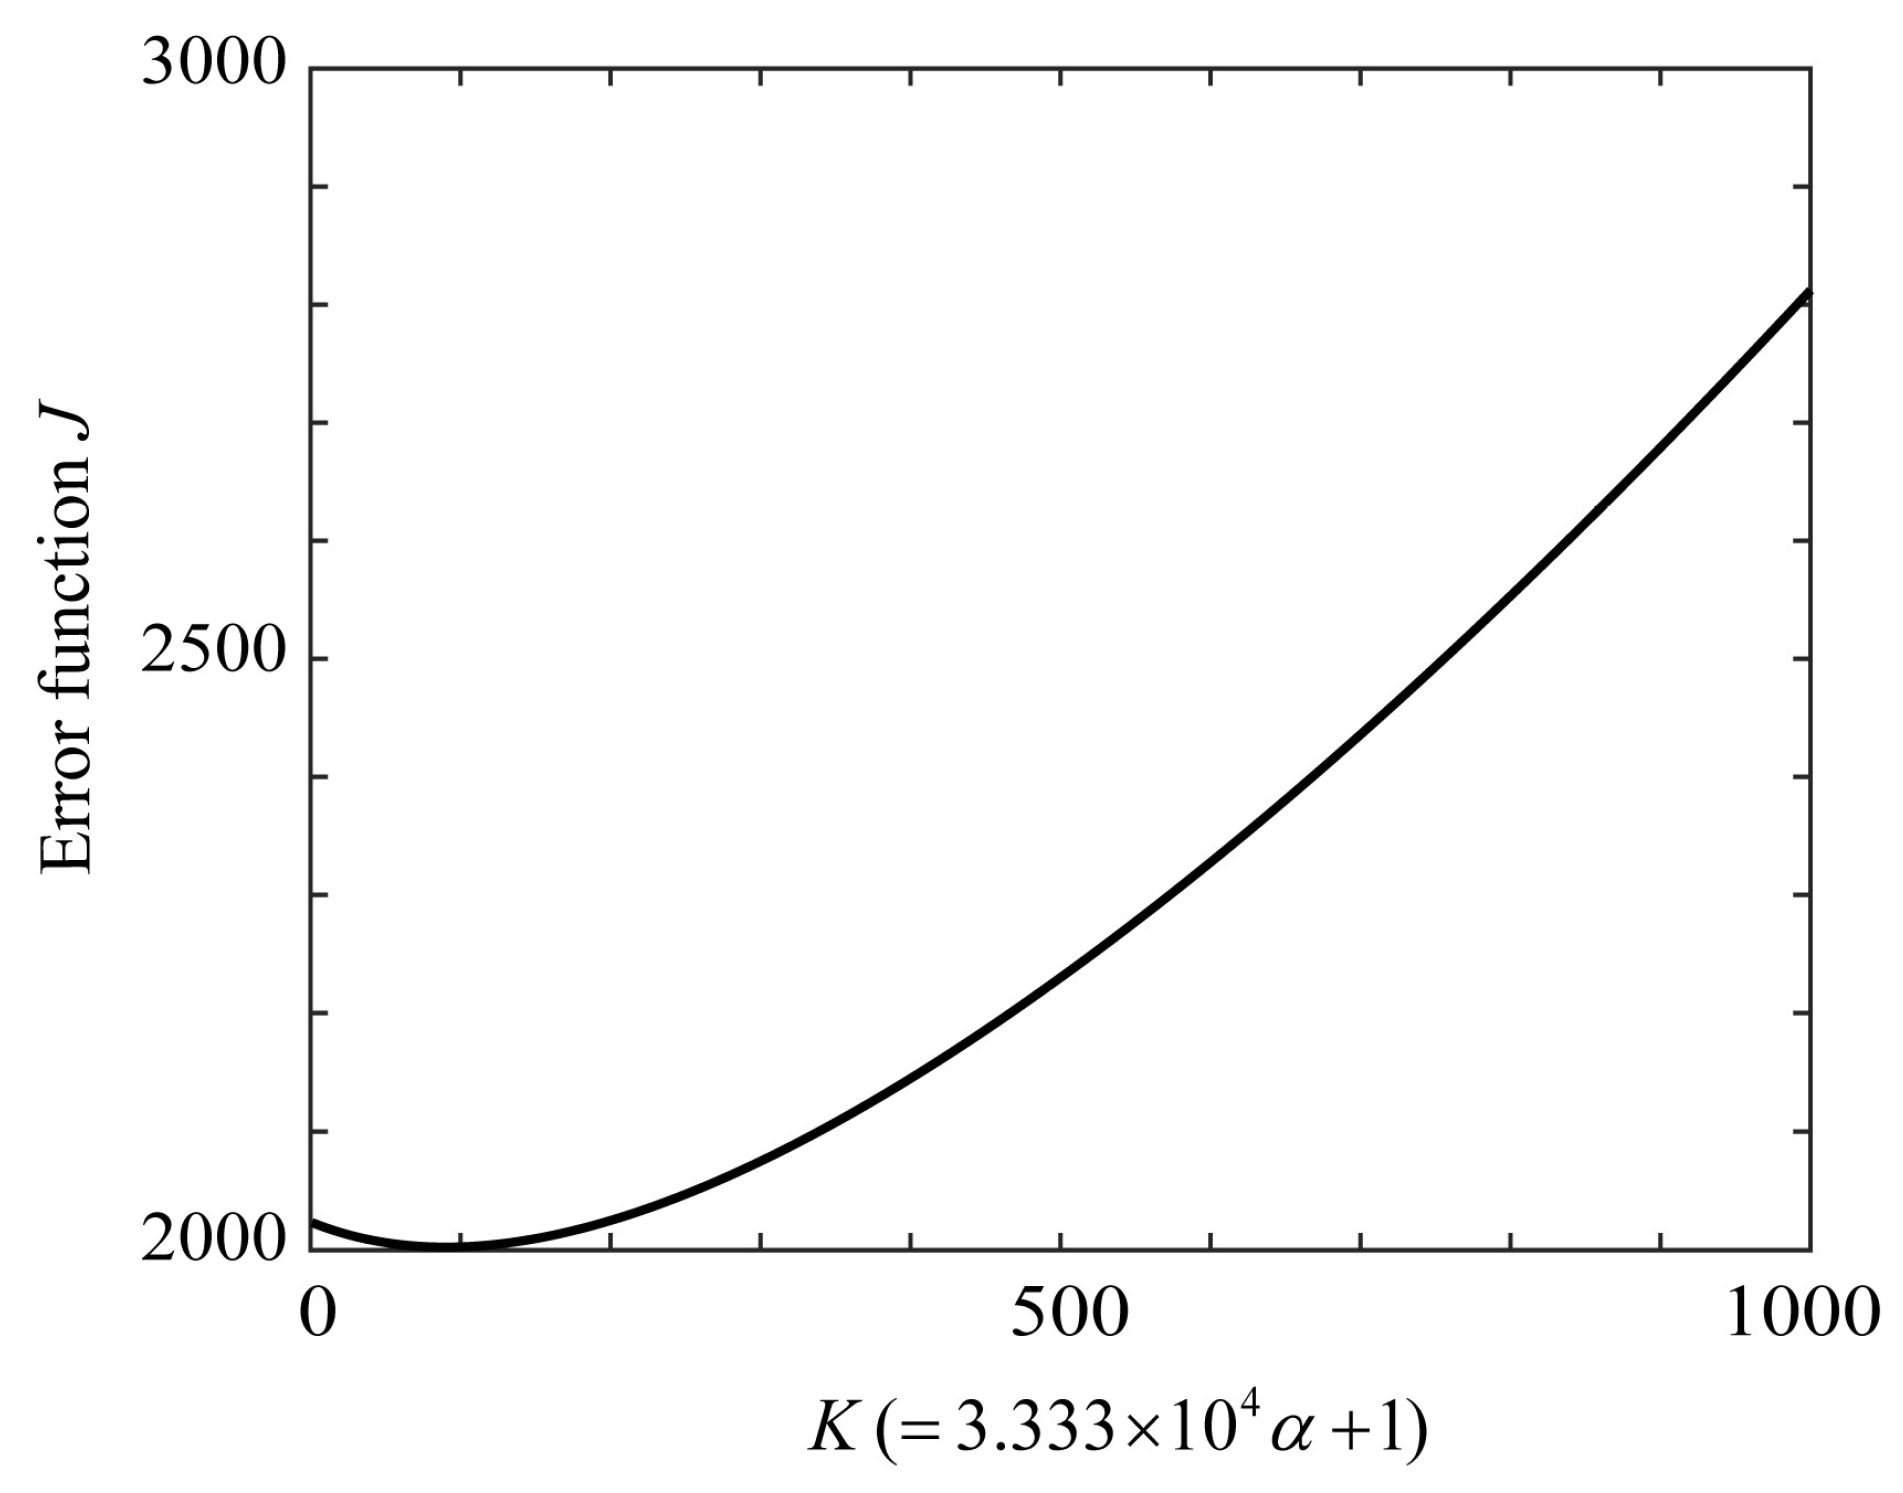
Subsequently, the proposed ridge-estimation method was applied to the present problem. The function for evaluating the estimation is the squared sum of the prediction errors, that is,
J defined in Eq. (12).
Figure 11 shows the function
J calculated, where parameter
K is related to the ridge parameter
as
(
K=1, 2, …, 1000). We varied
K and searched for the optimal
that minimized
J, where
K = 543 and
= 0.1084.
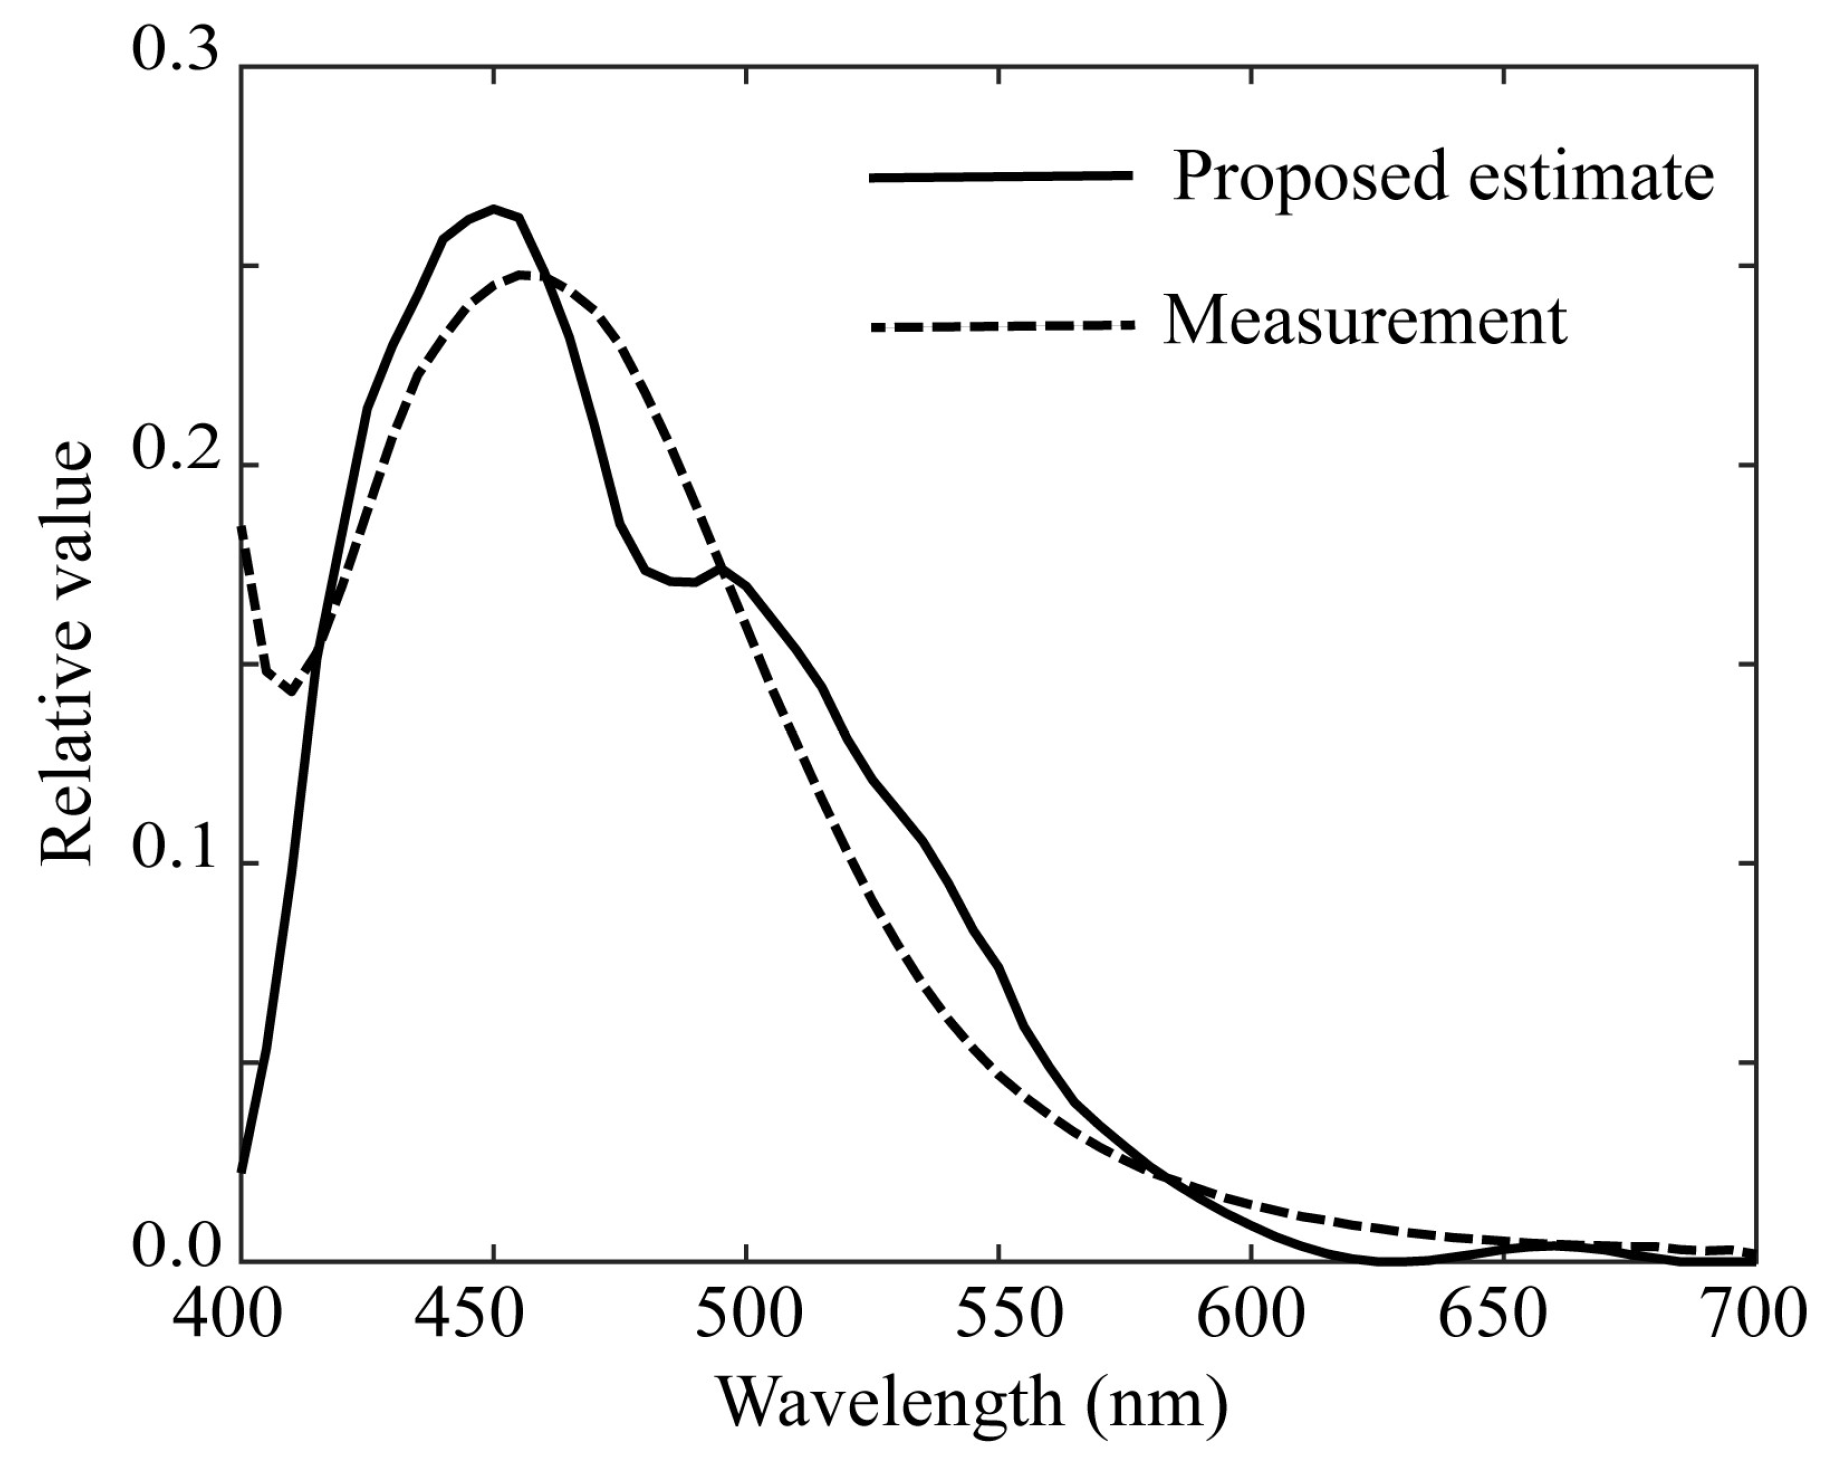
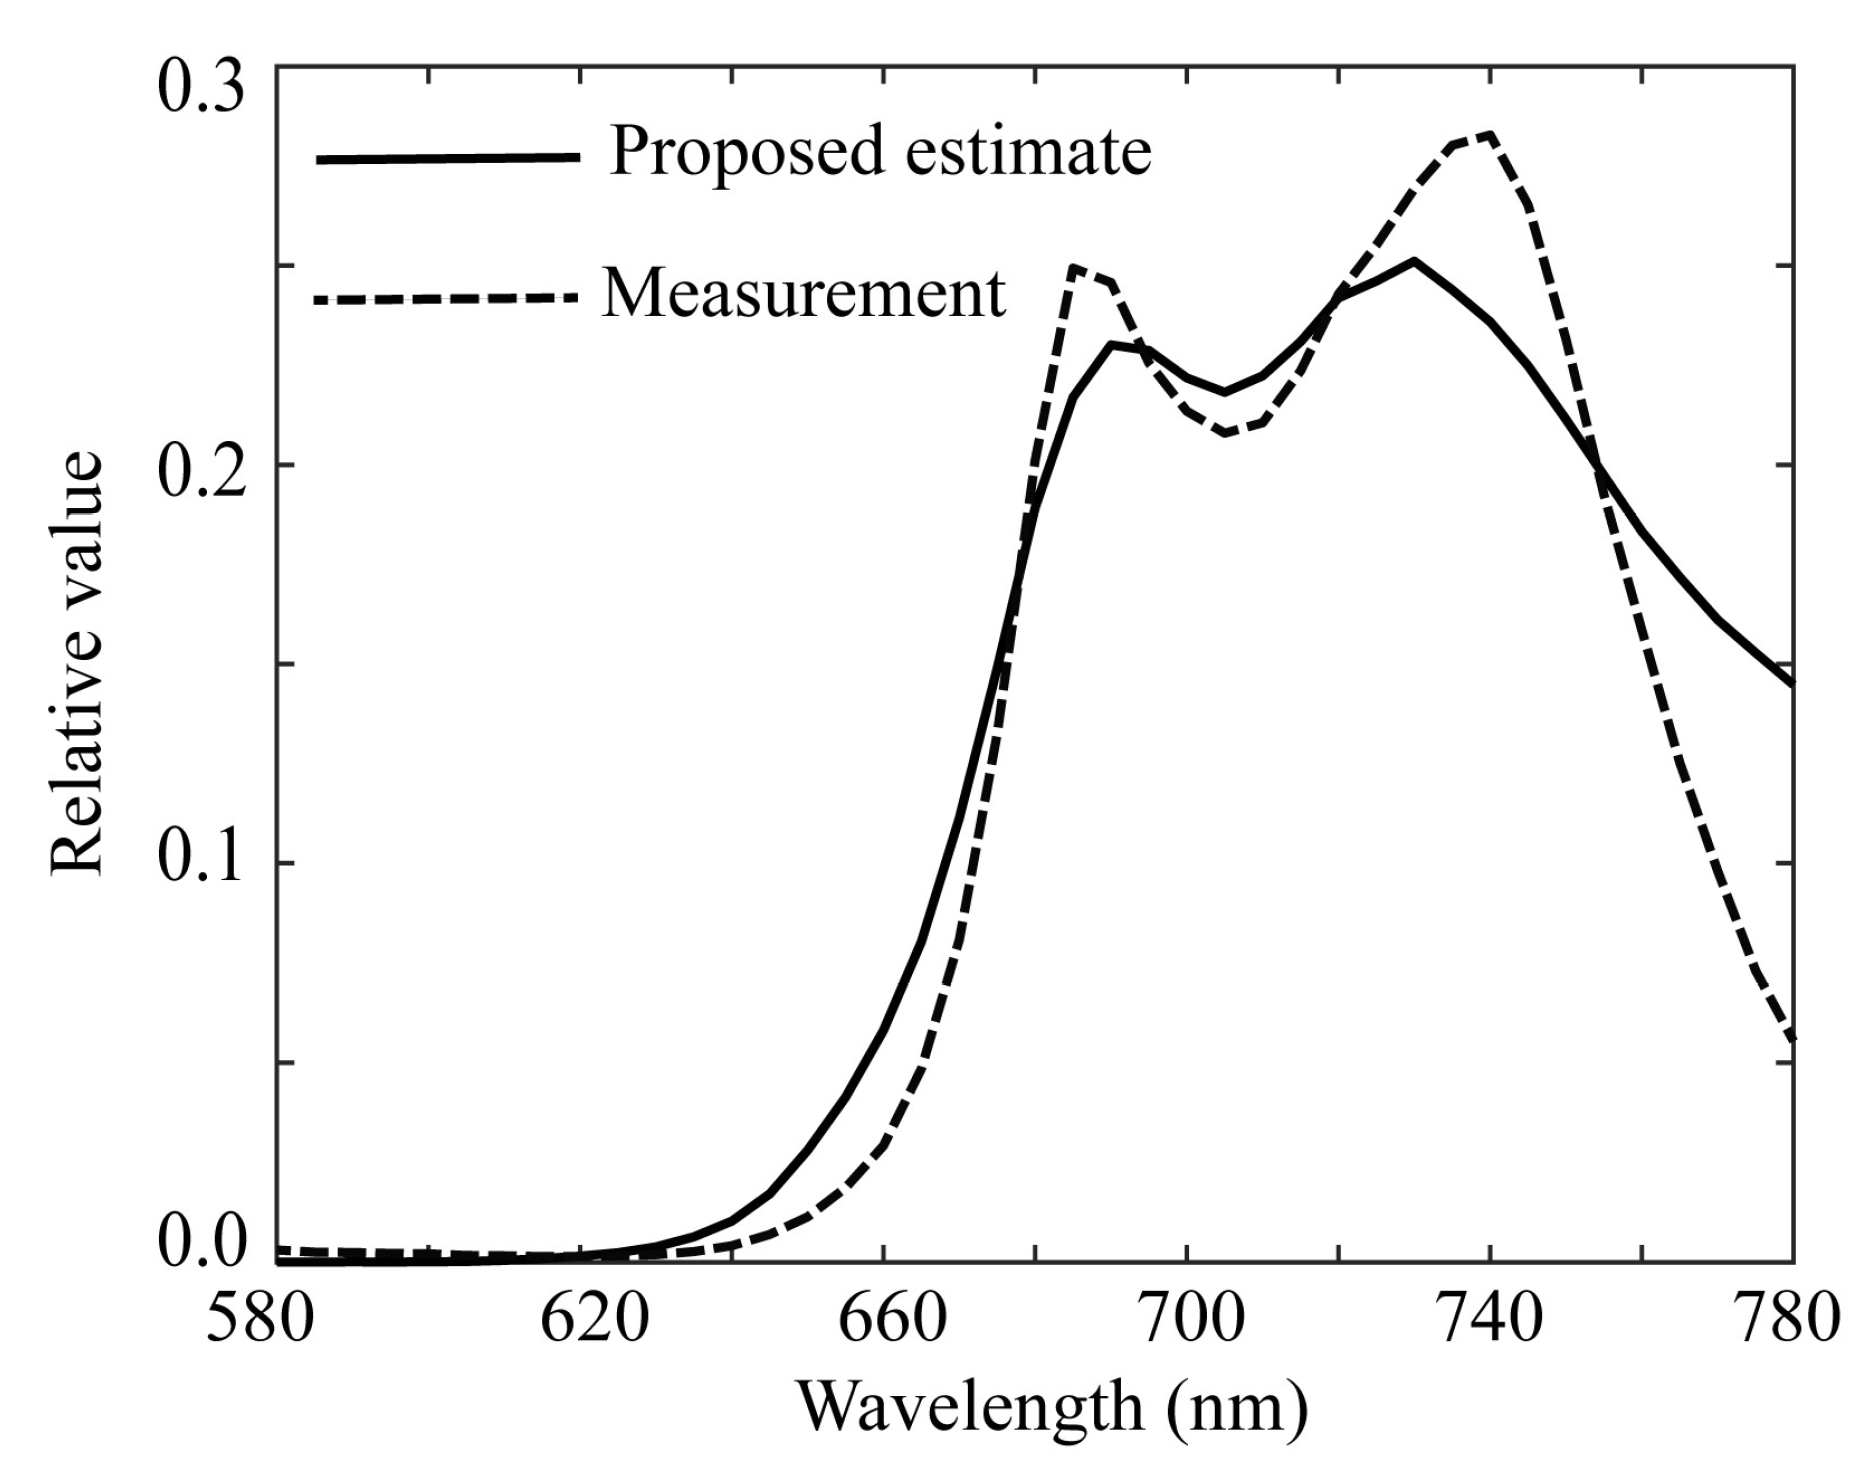
Figure 12 shows the ridge estimation results, where the estimated spectral curve of
is compared with the direct measurement of
using the spectroradiometer. The results are significantly better than those shown in
Figure 10, and the estimation error
is 0.05718.
The similar results to the above error function, proposed estimate, and minimum norm estimate were obtained for the other samples of rice grains.
Furthermore, we rendered the visual appearance of fluorescent emission from the whole object of rice grains used. Human color perception is limited to the visible wavelength range. To know the perceptual color of fluorescence emission, we applied the CIE color matching functions to the estimated fluorescence spectrum at each pixel point to obtain the tristimulus values and converted them into sRGB values.
Figure 13 shows the visual appearance of fluorescence emission rendered with sRGB image for the rice grain object, where the gray areas are the areas where UV light was not illuminated and no fluorescence was emitted.
4.2. Fluorescence Estimation for Plant Leaves
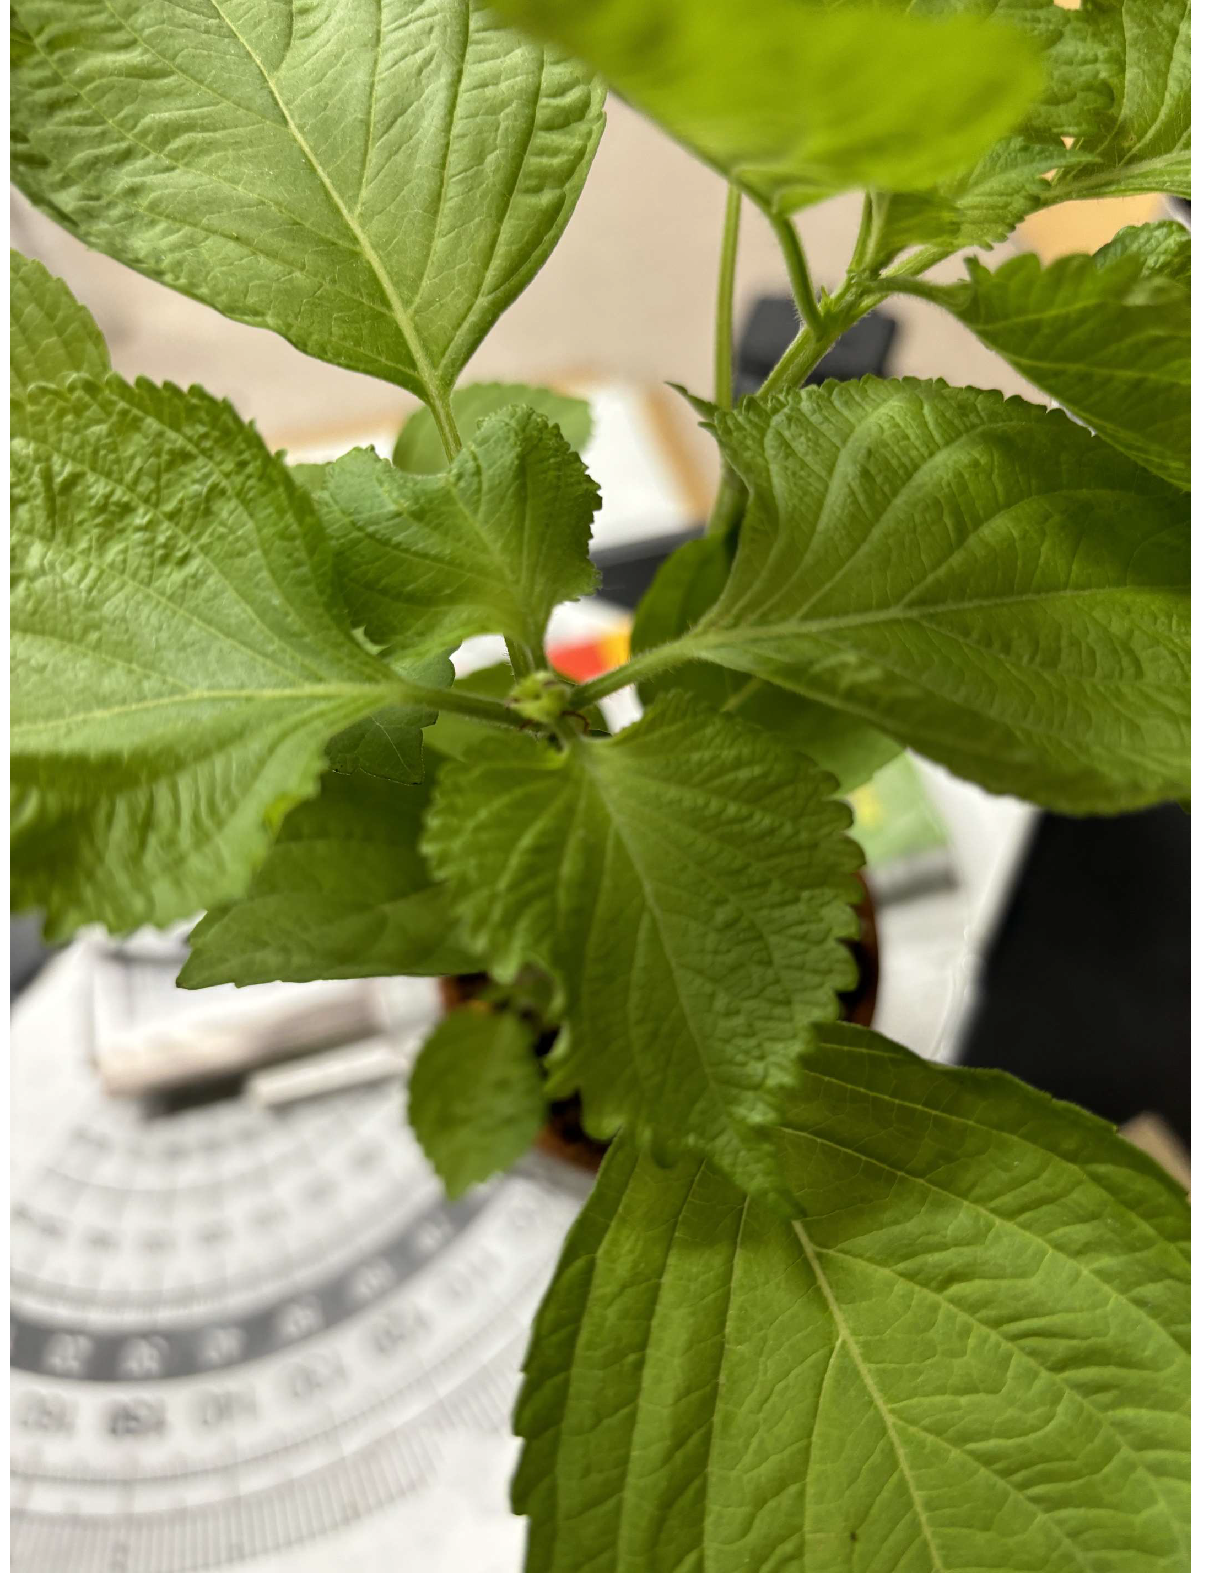
The images of the leaves "Ohba" of a living plant in a pot, as shown in
Figure 14, were captured using the second imaging system. Ohba refers to the leafy part of "Green Shiso" (Perilla frutescens var. crispa), which is edible and sold on the market. Multiple images of the Ohba leaves were obtained by sequentially changing the optical filters, which were then combined into a six-dimensional multiband image.
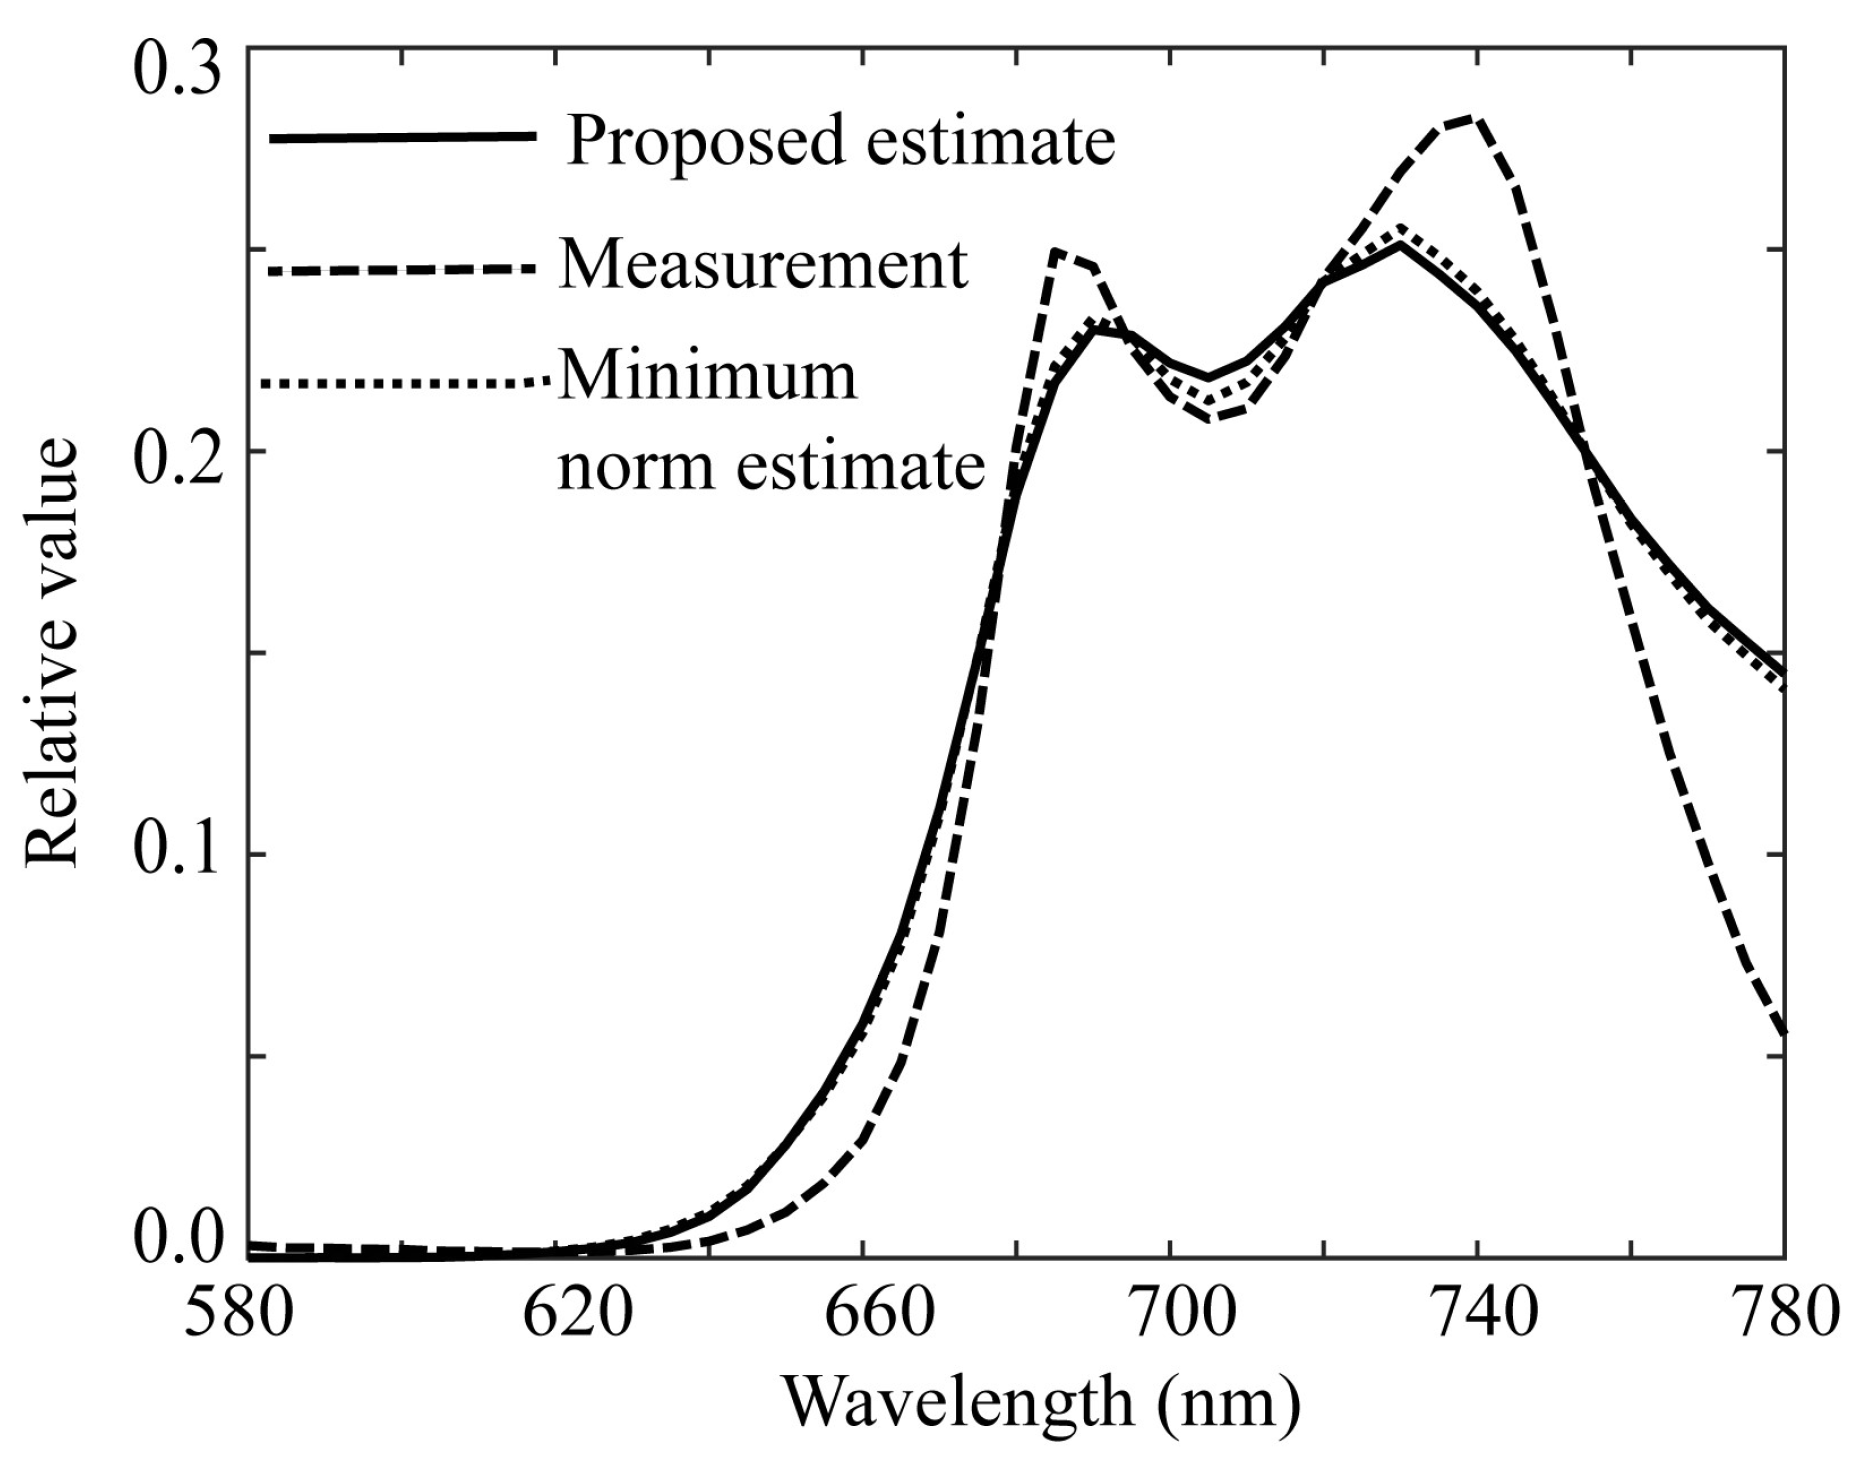
The proposed ridge method was used to estimate the spectral distribution of the fluorescence emitted from plant leaves. Because the fluorescence emission from plant leaves has a spectral distribution in the red to far-red wavelength region, spectral estimation was performed in the wavelength region of 580–780 nm.
Figure 15 shows the error curve of function
J, where parameter
K is related to the ridge parameter as
(
K=1, 2., …, 1000). The
K value and ridge parameter
minimizing
J were
K=90 and
=0.00267, respectively.
Figure 16 shows the ridge estimation results, where the estimated
is compared with the direct measurement
. The estimation error of
was 0.03294.
In addition, we examined the performance of the estimate by the minimum norm solution.
Figure 17 compares the three spectral curves of the ridge estimate, direct measurement, and minimum norm estimate. The two spectral curves of the ridge and minimum norm estimates almost coincide; therefore, in this case the minimum norm estimate exhibits good performance. The similar results were obtained for the other samples of plant leaves.
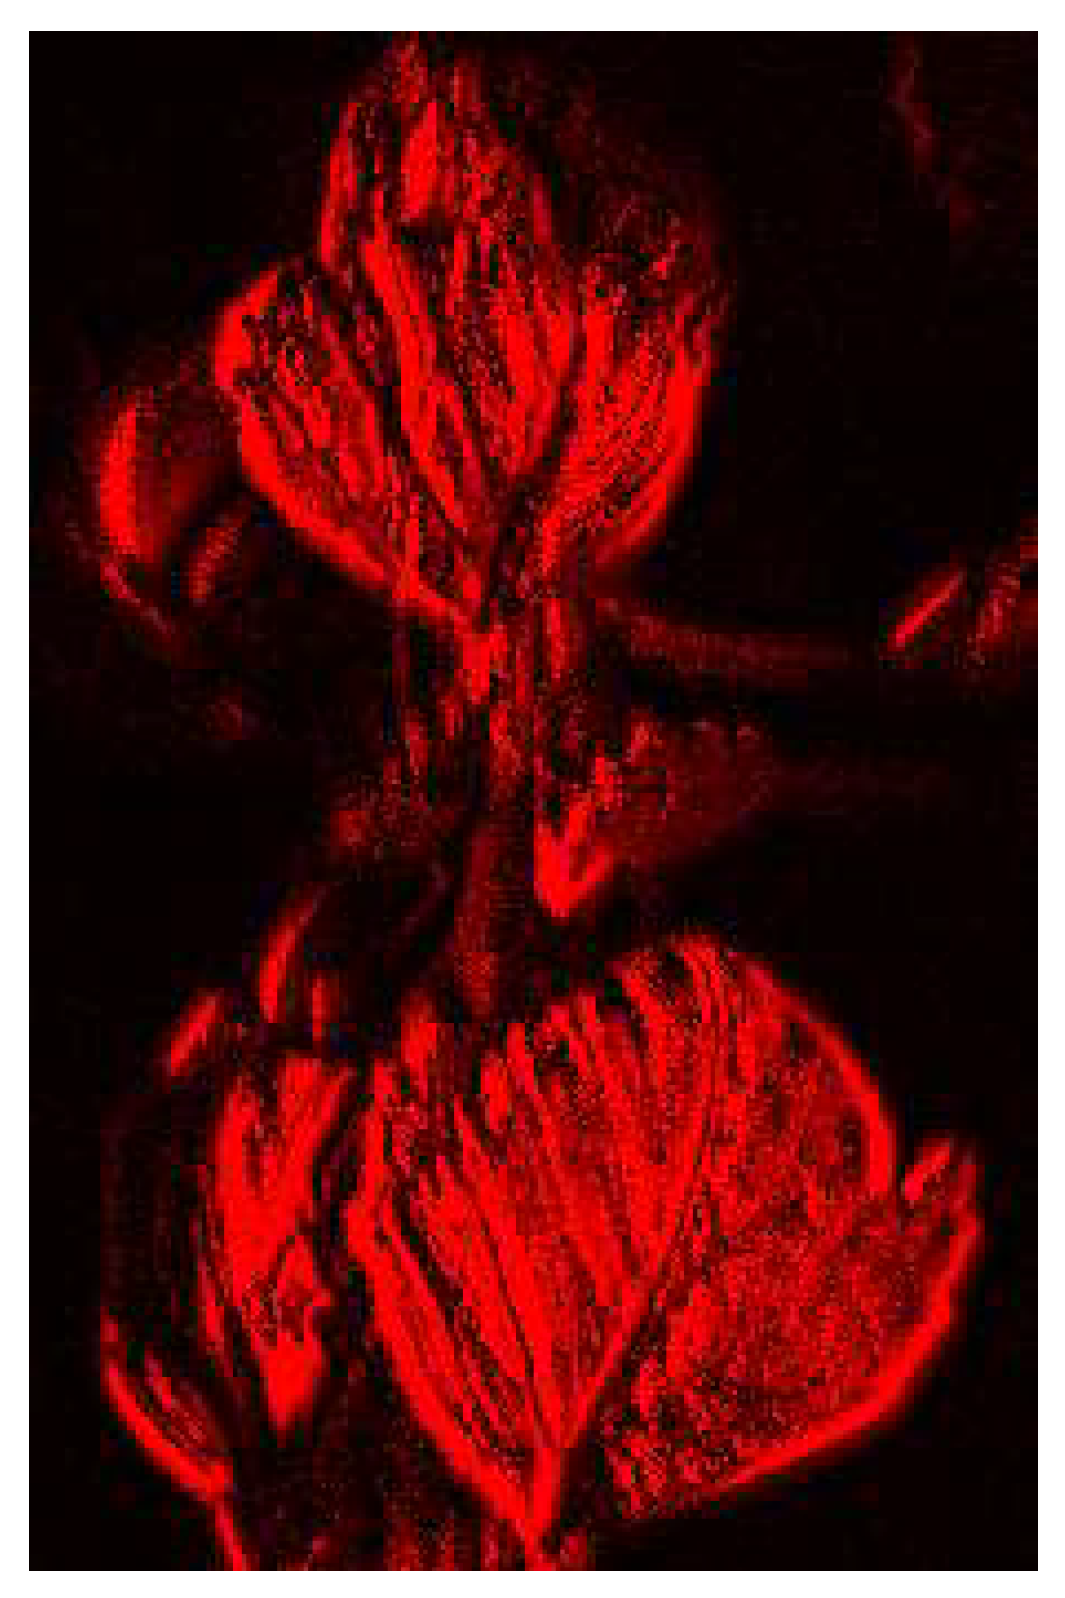
Furthermore, we rendered the visual appearance of fluorescence emission from the whole object of the Ohba leave used. The perceptual color was calculated as sRGB value at all pixel points only in the visible wavelength region.
Figure 18 shows the visual appearance of fluorescence emission rendered by sRGB image with the fluorescent color of the leaf.
5. Conclusions
This study has proposed a method for estimating fluorescence emission spectra from the image data of plant grains and leaves without using a spectrometer. Two types of multiband imaging systems with six channels were constructed by adding the minimum necessary optical filters to ordinary small off-the-shelf cameras: one for rice grains by making a mobile phone camera multiband to detect the fluorescence emission in the visible wavelength region, and the other for plant leaves using a monochrome camera with additional optical filters to detect chlorophyll fluorescence in the red to far-red wavelength region.
We adopted a ridge regression-based method to obtain a reliable estimate of the fluorescence emission spectral distribution using only the acquired image data. The fluorescence emission spectra can be estimated by optimally selecting the ridge parameter without using any statistics on the fluorescence spectra. An algorithm for the optimal selection of this parameter was developed using a cross-validation technique.
In the experiments using blended rice and Ohba leaves, UV light illuminated the plant targets, and the emitted fluorescence images were captured using the imaging systems. The fluorescence emission spectra of the rice grains and Ohba leaves were estimated using the proposed algorithm on the image data. These estimates were compared with direct measurements by a spectroradiometer and the estimate by the minimum norm solution method. In the former case, the proposed method was far superior to the minimum norm method , whereas in the latter case, the estimation results of the proposed method were almost identical to those of the minimum norm method. Thus, we confirmed the reliability of the proposed estimation method. Furthermore, the visual appearance of fluorescence emission from the respective objects of the rice grains and the Ohba leaves were rendered with sRGB images.
It should be noted that the estimation method of the fluorescence emission spectra proposed here is not limited to foods and plants, such as grains and leaves, but can be applied to the problem of estimating the emission spectra from any fluorescent object, including natural and artificial objects. Our future work will include applications to evaluate rice quality and investigate chlorophyll content in leaves.
Author Contributions
Conceptualization, S. T. , S. N., R. O., and H. S.; methodology, S. T. and H. S. software, S. T.; validation, S. T.; formal analysis, S. T. and H. S.; investigation, S. T. , S. N., R. O., and H. S.; resources, S. T.; data curation, S. T. , S. N., and R. O.; writing—original draft preparation, S. T.; writing—review and editing, S.T. , S. N., R. O., and H.S.; visualization, S.T. and R. O.; supervision, S.T.; project administration, S.T.; funding acquisition, S.T. All authors have read and agreed to the published version of the manuscript.
Funding
This research was funded by a Grant-in-Aid for Scientific Research (C) (Grant Number 24K15014).
Institutional Review Board Statement
Not applicable.
Informed Consent Statement
Not applicable.
Data Availability Statement
Data are available on request from the authors.
Conflicts of Interest
The authors declare no conflict of interest.
References
- Wyszecki, G. and Stiles, W.S., Color Science: Concepts and Methods, Quantitative Data and Formulae. 2nd ed. New York: Wiley-Interscience, 2000.
- Lakowicz, J.R. , Principles of Fluorescence Spectroscopy. 3rd ed. Berlin: Springer, 2006.
- J. Suo, L. Bian, F. Chen, and Q. Dai, Bispectral coding: compressive and high-quality acquisition of fluorescence and reflectance. Opt. Express 2014, 22, 1697–1712. [Google Scholar] [CrossRef] [PubMed]
- Tominaga, S. , Hirai, K., and Horiuchi, T., Estimation of bispectral Donaldson matrices of fluorescent objects by using two illuminant projections. JOSA A 2015, 32, 1068–1078. [Google Scholar] [CrossRef] [PubMed]
- Fu, Y.; et al. Reflectance and fluorescence spectral Recovery via actively lit RGB images, IEEE Trans. Pattern Analysis and Machine Intelligence 2015, 38, 1313–1326. [Google Scholar] [CrossRef] [PubMed]
- Tominaga, S. , Hirai, K., and Horiuchi, T., Estimation of fluorescent Donaldson matrices using a spectral imaging system. Opt. Express 2018, 26, 2132–2148. [Google Scholar] [CrossRef] [PubMed]
- Tominaga, S. , Hirai, K., and Horiuchi, T., Spectral reconstruction of fluorescent objects with mutual illumination effects. JOSA A 2019, 36, 1512–1522. [Google Scholar] [CrossRef] [PubMed]
- Blasinski, H. , Farrell, J., and Wandell, B., Simultaneous surface reflectance and fluorescencespectra estimation, IEEE Trans. Image Process. 2020, 29, 8791–8804. [Google Scholar] [CrossRef] [PubMed]
- Tominaga, S. , Estimation of bispectral characteristics of fluorescent objects based on multispectral imaging data. Opt. Eng. 2021, 60, 033102–1_0033102. [Google Scholar] [CrossRef]
- Tominaga, S. , Guarnera, G.C., Appearance synthesis of fluorescent objects with mutual illumination effects. Color Res. Appl. 2022, 47, 615–629. [Google Scholar] [CrossRef]
- Tominaga, S. , Nishi, S., and Ohtera, R., Spectral imaging methods for estimating fluorescence emission spectra from plant grains and leaves, Proc. 8th Computational Color Imaging Workshop 2014, 117-131, Milano, Italy.
- Hachiya, M. , Asanome, N., Goto, T., and Noda, T, Fluorescence imaging with UV-excitation for evaluating freshness of rice. JARQ 2009, 43, 193–198. [Google Scholar] [CrossRef]
- Mahirah, J.; et al. , Rice quality assessment using fluorescence imaging technique. Proc. MSAE 2019, 152–155. [Google Scholar]
- Takayama, K. , Konishi, A., and Omasa, K., Diagnosis of invisible photosynthetic injury caused by a herbicide (Basta) with chlorophyll fluorescence imaging system. CIGR Journal 2003, 1–11. [Google Scholar]
- Tubuxin, B.; et al. , Estimating chlorophyll content and photochemical yield of photosystem II (ΦPSII) using solar-induced chlorophyll fluorescence measurements at different growing stages of attached leaves. Journal of Experimental Botany 2015, 66, 5595–5603. [Google Scholar] [CrossRef] [PubMed]
- Li, C. , Tan, Y., Liu, C., and Guo, W., Rice origin tracing technology based on fluorescence spectroscopy and stoichiometry. Sensors 2024, 24, 2994. [Google Scholar] [CrossRef] [PubMed]
- Park, B. , Wi, S., Chung, H., and Lee, H., Chlorophyll fluorescence imaging for environmental stress diagnosis in crops. Sensors 2024, 24, 1442. [Google Scholar] [CrossRef] [PubMed]
- Tominaga, S. , Nishi, S., Ohtera, R., and Sakai, H., Improved method for spectral reflectance estimation and application to mobile phone cameras. JOSA A 2022, 39, 494–508. [Google Scholar] [CrossRef] [PubMed]
- Arthur, H.E. and Kennard, R.W., “Ridge Regression: Biased estimation for nonorthogonal problems. Technometrics 1970, 12, 55–67. [Google Scholar]
- Arthur, H.E. and Kennard, R.W., “Ridge Regression: Applications to nonorthogonal problems. Technometrics 1970, 12, 69–82. [Google Scholar]
- van Wieringen, W. , Lecture Notes on Ridge Regression, https://arxiv.org/pdf/1509. 0916. [Google Scholar]
- Nishi, S. , Ohtera, R., and Tominaga, S.: Multiband imaging with smartphone cameras for spectral reflectance estimation. Proc. AIC.
- Tominaga, S. , Nishi, S., and Ohtera, R.: Measurement and estimation of spectral sensitivity functions for mobile phone cameras. Sensors 2021, 4985, 1–22. [Google Scholar]
- Madych, W.R. , Solutions of underdetermined systems of linear equations, IMS Lecture Notes Monogr. Ser., 1991; 227-238, 1991.
- Kohavi, R. , A study of cross-validation and bootstrap for accuracy estimation and model selection, Proc. 14th Inter. Joint Conf. Artificial Intelligence 1995, 2, 1137–1143. [Google Scholar]
Figure 1.
Overview of the multiband imaging system proposed for estimating the fluorescence emission spectra from plants and grains.
Figure 1.
Overview of the multiband imaging system proposed for estimating the fluorescence emission spectra from plants and grains.
Figure 2.
Spectral power distribution of the UV LED light used.
Figure 2.
Spectral power distribution of the UV LED light used.
Figure 3.
Spectral sensitivity functions of the RGB camera.
Figure 3.
Spectral sensitivity functions of the RGB camera.
Figure 4.
Spectral transmittance curves of the two filters used.
Figure 4.
Spectral transmittance curves of the two filters used.
Figure 5.
Overall spectral sensitivity functions of the multiband imaging system constructed using an RGB mobile phone camera and two color filters.
Figure 5.
Overall spectral sensitivity functions of the multiband imaging system constructed using an RGB mobile phone camera and two color filters.
Figure 6.
Spectral sensitivity function of the monochrome camera.
Figure 6.
Spectral sensitivity function of the monochrome camera.
Figure 7.
Spectral transmittance curves of the six sharp-cut filters.
Figure 7.
Spectral transmittance curves of the six sharp-cut filters.
Figure 8.
Overall spectral sensitivity functions of the multiband imaging system constructed using a monochrome camera and six sharp-cut filters.
Figure 8.
Overall spectral sensitivity functions of the multiband imaging system constructed using a monochrome camera and six sharp-cut filters.
Figure 9.
Photographic image of the rice grains used in the experiment.
Figure 9.
Photographic image of the rice grains used in the experiment.
Figure 10.
Comparison of the minimum norm estimate for the spectral distribution of fluorescent emission obtained from the image data of rice grains with directly measured fluorescence spectrum by the spectroradiometer.
Figure 10.
Comparison of the minimum norm estimate for the spectral distribution of fluorescent emission obtained from the image data of rice grains with directly measured fluorescence spectrum by the spectroradiometer.
Figure 11.
Error function J with K as a parameter to evaluate the ridge estimate for the rice grains.
Figure 11.
Error function J with K as a parameter to evaluate the ridge estimate for the rice grains.
Figure 12.
Ridge estimation result for the rice grains, where the estimated spectral curve is compared with the direct measurement using the spectroradiometer.
Figure 12.
Ridge estimation result for the rice grains, where the estimated spectral curve is compared with the direct measurement using the spectroradiometer.
Figure 13.
Visual appearance of fluorescence emission rendered with sRGB image for the rice grain object.
Figure 13.
Visual appearance of fluorescence emission rendered with sRGB image for the rice grain object.
Figure 14.
Photographic image of leaves "Ohba" of a living plant in a pot.
Figure 14.
Photographic image of leaves "Ohba" of a living plant in a pot.
Figure 15.
Error function J with K as a parameter to evaluate the ridge estimate for the plant leaves.
Figure 15.
Error function J with K as a parameter to evaluate the ridge estimate for the plant leaves.
Figure 16.
Ridge estimation result for the plant leaves, where the estimated spectral curve is compared with the direct measurement using the spectroradiometer.
Figure 16.
Ridge estimation result for the plant leaves, where the estimated spectral curve is compared with the direct measurement using the spectroradiometer.
Figure 17.
Comparison of three spectral curves between the ridge estimate, direct measurement, and minimum norm estimate for the plant leaves.
Figure 17.
Comparison of three spectral curves between the ridge estimate, direct measurement, and minimum norm estimate for the plant leaves.
Figure 18.
Visual appearance of fluorescence emission rendered with sRGB image for the Ohba leave.
Figure 18.
Visual appearance of fluorescence emission rendered with sRGB image for the Ohba leave.
|
Disclaimer/Publisher’s Note: The statements, opinions and data contained in all publications are solely those of the individual author(s) and contributor(s) and not of MDPI and/or the editor(s). MDPI and/or the editor(s) disclaim responsibility for any injury to people or property resulting from any ideas, methods, instructions or products referred to in the content. |
© 2024 by the authors. Licensee MDPI, Basel, Switzerland. This article is an open access article distributed under the terms and conditions of the Creative Commons Attribution (CC BY) license (http://creativecommons.org/licenses/by/4.0/).