
Submitted:
03 December 2024
Posted:
03 December 2024
You are already at the latest version
Abstract
Optical microscope (OM), energy dispersive spectrometer (EDS), electron backscatter diffractometer (EBSD), electrochemical test, and transmission electron microscope (TEM) were employed to conduct interface microstructure observation and cladding corrosion resistance analysis on 304 SS/CS clad plates that have four different reduction ratios. The increase in rolling reduction ratio leads to larger grain size, gradually refined microstructure, and a decreased thickness of the interfacial martensite area. As the concentration disparity of the C element between carbon steel (CS) and 304 stainless steel (SS) is small, no evident carburization layer and decarburization layer can be detected. The ferrite microstructure on the CS side has a greater stress distribution, a greater local orientation deviation, and deformed grains are dominant. Austenite undergoes strain-induced martensitic transformation with the transformation mechanism of γ→twinning→a'-martensite. The martensite microstructure within the interface region grows in the direction of the interior of austenite grains. The reduction ratio increases sharply, leading to an increase in dislocation density, which promotes the nucleation, growth, and precipitation of carbides and seriously reduces the corrosion resistance of the cladding. Subsequently, the reduction ratio keeps on increasing. However, the degree of change in the reduction ratio diminishes. High temperature promotes the dissolution of carbides and improves the corrosion resistance. From this, it can be understood that by applying the process conditions of raising the reduction ratio and keeping a high temperature at the carbide dissolution temperature, a clad plate that has excellent interface bonding and remarkable corrosion resistance can be acquired.
Keywords:
hot-rolled stainless steel/carbon steel clad plate
; rolling reduction ratio
; interface
; corrosion resistance
; diffusion
1. Introduction
In general, for stainless steel (SS) clad plates, carbon steel (CS) with excellent workability and high structural strength is picked as the substrate plate. Meanwhile, austenitic SS with excellent corrosion resistance and surface quality is selected as the cladding plate. This approach not only reduces the consumption of precious alloy elements like chromium and nickel but also enables the acquisition of materials with outstanding performance[1,2,3,4,5,6]. These characteristics make the SS clad plate widely used as a substitute for stainless steel in fields such as the nuclear field, in reservoirs, ship structures, and construction engineering[3,7,8,9]. In recent years, the main manufacturing techniques for SS clad plates include hot rolling, explosion welding, diffusion welding, liquid-solid bonding, etc. Among these technologies, hot rolling is considered an economical, time-saving, and environmentally friendly process for producing large clad metal sheets[7].
Process parameters such as rolling reduction ratio, surface quality of metals, temperature, and vacuum degree can impact the interface microstructure and thus change the mechanical properties. There have been many related research works focusing on the interface characterization, bond strength, and mechanical characteristics of SS clad plates. Dhib and Guermazi et al. [10] focused on mechanical characteristics and interface morphology of hot-rolled A283 Grade C /316 austenitic SS clad plates. The results indicated that the diffusion of Cr and Ni during the hot-rolling process can reinforce the substrate, while the diffusion of C will form a carburized area and a decarburized area, thereby reducing the interface bonding strength and affecting the corrosion resistance. Wang et al. [11] studied the interface microstructure, tensile shear properties and fracture surface morphologies of five SS clad plates with different rolling reduction ratios. Their experiments have demonstrated that as the rolling reduction ratio increases, mechanical characteristics of the clad plate, such as shear strength and tensile elongation at break, will become more outstanding. Nevertheless, their attention is mainly focused on the mechanical characteristics and the formation of the carburized area and the decarburized area on both sides of the interface, and they do not carry out a more in-depth analysis of the interface microstructure. Liu et al. [12] reported that with the increase of hot rolling temperature, the interfacial shear strength increases, but the grain size caused by recrystallization decreases the tensile strength. Zhu et al. [13] have explored the influence of interface oxides upon shear properties of SS clad plates. It was discovered that test samples with a moderate level of oxidation still possess statistically high shear strength. Nevertheless, the cladding interface is prone to damage due to low fracture toughness during deformation, and the shear strength does not represent the overall properties of the cladding material. Hence, a clad interface with a low degree of oxidation remains extremely important for high-performance composites. Vacuum degree and the quality of the metal surface are key factors influencing the interfacial oxides. In this research, experimental methods such as optical microscope (OM), energy dispersive spectrometer (EDS), electron backscatter diffractometer (EBSD), electrochemical test, and transmission electron microscope (TEM) and electrochemical testing are adopted. To better discuss the impact of the change in rolling reduction ratio on the interface performance and microstructure and to connect the structure with the performance, it is hoped that it can play a guiding role in actual industrial production.
2. Materials and Methods
This experiment takes the hot-rolled 304 SS and CS clad plate as the research object. The details of its main components are presented in Table 1. The processing temperature ranges from 850 ℃ to 1150 ℃. And to investigate the influence of various rolling reduction ratios on the interfacial structure of clad plates, we rolled the original SS clad plate (with a thickness of 210 mm) with different reduction ratios and obtained four clad plates with thicknesses of 90mm, 45mm, 30mm, and 20mm respectively (#1, #2, #3, #4).
Prepare samples using standard metallographic techniques. Given the significant disparity in corrosion resistance between CS and SS and the poor etching effect at the interface, only a 4% nitric acid alcohol solution was used to etch the CS side. The samples were ground and then mechanically polished. Subsequently, the microhardness of the samples was determined using a 402SXV indentation tester. The applied load was set at 100 grams, and the loading time was 10 seconds. For the samples used for EBSD, on the basis of mechanical polishing, they were vibrationally polished for 6 hours using a BUEHLER VibroMet 2 vibratory polishing machine. The EBSD samples were analyzed using a HITACHI SU8700 scanning electron microscope (SEM) that is furnished with a BRUKER Quantax EBSD 400i e-FlashFS electron backscatter diffractometer (EBSD) and a BRUKER Quantax 200 XFlash 6|60 energy dispersive spectrometer (EDS). Therefore, we can not only observe the microstructure of the interface but also conduct qualitative and quantitative analysis of the elements in the micro-region of the samples. The specimen for TEM observation was thinned by Ar-ion milling with the GATAN 654 precision ion polishing system. TEM observations were carried out using a JEOL JEM-2100 at an accelerating voltage of 200 kilovolts. The 304 SS cladding within the clad plates was cut into 10 mm × 10 cm pieces and subsequently solidified with epoxy resin. Potentiodynamic polarization curve and AC impedance of the electrodes were measured using the Gamry electrochemical workstation (Interface 1010). A traditional three-electrode cell was adopted, which was composed of a Pt plate as the counter electrode, a saturated calomel electrode (SCE) as the reference electrode, and a working electrode (WE). All electrochemical experiments were carried out in a 3.5 wt.% NaCl solution. For anodic-cathodic polarization measurements, the samples were polarized between -0.25 V and 0.25 V relative to the corrosion potential (Ecorr) at a scanning rate of 1 mV per second. Electrochemical impedance spectroscopy (EIS) was conducted with an AC disturbance amplitude of 10 mV and in a frequency range from 100 kHz to 0.2 Hz.
3. Results and Discussion
As depicted in Figure 1, the optical microstructure of SS clad plates at the interface and on the CS side is presented. The microstructure on the CS side is predominantly ferrite. The grains are deformed due to the rolling process. Additionally, there are small black spots on the CS side and at the interface, which are mainly precipitated granular carbides. Some holes can be observed along the interface, which may be formed by the shedding of inclusions. Since the C element content in the compositions of SS and CS on both sides is approximately the same, the concentration gradient is not sufficient for the C element to diffuse from the CS side to the SS side. Therefore, no decarburized layer is observed in the optical microstructure.
Figure 2 illustrates the relationship between microhardness and distance in the thickness direction of the SS clad plates. Figure 2a indicates the locations of some microhardness sampling points, where the position of 0 on the x-coordinate stands for the interface of the clad plates. Microhardness is obtained at 50 um intervals from the 0 point to both ends, and three hardness points are taken at each end. The left side of position 0 is the CS, and the right side is 304 SS. Owing to higher carbide content and the formation of martensite areas during the hot rolling process, the interface hardness of all four SS clad plates is the highest. As the rolling reduction ratio increases, work hardening causes a gradual rise in the microhardness on the SS side. However, the difference in rolling reduction ratios does not cause a significant regular change in microhardness on the CS side of the clad plates. For clad plates #3 and #4 with a larger reduction, the hardness is even lower, which may be related to the fragmentation of ferrite grains, the formation of the subgrains, and the random distribution of small granular carbides. Granular carbides have a higher hardness than the ferrite matrix, which can result in the generation of microcracks near the carbides and ultimately have an impact on the measurement of microhardness.
Grain orientation at the interface and on both sides of the four clad plates was analyzed using the EBSD probing technique. The IPF maps shown in Figure 3 were obtained by using channel 5 software for data processing and analysis. In the EBSD maps, high-angle grain boundaries (HAGBs), which are defined as those having misorientation angles greater than 15°, are presented as thick black lines. On the other hand, low-angle grain boundaries (LAGBs) are shown as thin gray lines. Numerous HAGBs are distributed at the interface, while LAGBs are mainly located inside the ferrite grains on the CS side. The microstructure of the 304 SS cladding is austenitic. Figure 3e,f are IPF maps of the corresponding localized regions in (a) and (d) at larger magnifications. As is evident from Figure 3e,f, the refined lath-like microstructure is present at the interface of the four clad plates because of the diffusion of Cr and Ni[11,14]. As the rolling reduction ratio increases, the interfacial region narrows. In other words, the thickness of the martensite area gradually diminishes with the rise of the rolling reduction ratio. Elemental diffusion and thickness reduction occur simultaneously during hot rolling. However, elemental diffusion proceeds much more slowly than thickness reduction, resulting in a narrowing of the interfacial region. It can also be observed that the direction of martensite growth is consistent, both toward the interior of the austenite grains. This results from the strain-induced martensitic transformation of austenite, namely γ→twinning→a^'-martensite. According to the stacking fault energy (SFE) of the material, dislocation gliding, twinning, or martensite transformation occurs during the deformation of the material, as reported in references[15,16,17]. In the internal microstructure on the 304 SS side, twins appear near the interface between large grains or near high-angle grain boundaries (HAGBs).
Following hot rolling with different reduction ratios, grain size of the SS/CS clad plates is significantly refined. Compared to austenite, the ferrite on the CS side is squeezed and deformed more significantly, breaking up into small grains. As a result, subject to high temperature and high pressure, some fragmented ferrite grains tend to grow in the same orientation. Moreover, no specific preferential orientation is generated, and the grain orientations on both sides are distributed randomly. Another notable point is that there is a difference in Figure 3b from the other three samples. A large amount of carbides precipitates in the martensitic region of the interface and at ferrite grain boundaries, and partially precipitates at austenite grain boundaries. This phenomenon does not occur in Figure 3c,d. The reason is that from hot rolling #1 to #2, the change of reduction ratios is large and there are more rolling passes. Whereas #3 and #4 are obtained by hot rolling #2. The change in reduction ratio is relatively smaller. The precipitation rate of carbides slows down. The high temperature during reheating causes the carbides to gradually dissolve.
Figure 4 shows the local misorientation (LM) maps at the interface area of four clad plates. Figure 4a presents that high LMs were gathered at the interface and on the CS side, while low LMs were evenly distributed in 304 SS. During the hot rolling process, due to the mechanical incompatibilities between CS and 304 SS, the strain distribution is not uniform, resulting in the CS generating a higher strain[18,19,20]. For the interface zone and the CS side, the dislocations undergo entanglement and rearrangement because of the hindrance of HAGBs. Therefore, HAGBs show a high degree of local misorientation as depicted in Figure 4a–d [19]. Figure 4b–d display that the average orientation deviation of both CS and SS increases when the rolling reduction ratio increases. Final strain state of the hot rolled clad plates is determined by the dynamic competition between dynamic recrystallization (DRX) and strain hardening[21].
Figure 5 presents the recrystallization characteristics in the cladding interface area. Red stands for the deformed grains, Blue indicates the recrystallized grains, and yellow denotes the restored substructures. Generally speaking, there is a positive correlation between grain distortion and grain misorientation. The EBSD technique combines data on grain morphology and size for the identification of recrystallized grains[22]. In Figure 5a, 304 SS contained relatively large recovered substructures and recrystallized grains with almost no deformed grains. The CS contains a small quantity of recovered substructures and a majority of large deformed grains, as well as fine recrystallized grains. As can be seen from Figure 5a–c, the recrystallized grains of 304 SS become fewer while the deformed grains increase. In the CS, large deformed grains still dominate. In the course of the hot rolling process, the large deformations caused the grains to be too late to recrystallize, and lower rolling temperatures cannot provide sufficient driving force for DRX. As a result, grain distortion takes over in competition with dynamic recrystallization, and the volume fraction of DRX is lower. Due to the strain partitioning in SS/CS clad plates, an increase in the quantity of deformed grains is more remarkable in the CS.
Figure 6 shows the EDS mapping in the cladding interface area of the four clad plates. The content of Fe in the CS is higher than that in 304 SS. Conversely, the content of Cr and Ni in 304 SS is greater than that in the CS. For the elements Fe, Cr, and Ni, there are obvious compositional diffusion zones in the interfacial region. The thickness of the Cr diffusion layer is slightly wider than that of Ni. Although the diffusion coefficient of Ni is higher than that of Cr, the concentration gradient of Cr is greater and the diffusion distance is longer[20]. Carbon shows no significant diffusion tendency since its content in SS and CS is similar.
Figure 7 shows EDS line scan maps in cladding interface area of the four clad plates. Corresponding to the EDS mapping, it can be observed that an average diffusion distance of Cr is approximately 30.0 um, while the average diffusion distance of Ni is about 20.0 um. The diffusion distances of elements Ni and Cr diminish as rolling reduction ratio rises. This occurs because the reduction in thickness during hot rolling is greater than the diffusion distances. The diffusion coefficient of carbon is significantly larger than that of Ni and Cr. However, since the carbon content of CS and SS is approximately the same, there is no evident concentration gradient at the interface area.
Figure 8 displays the TEM bright field image of 304#1 clad plate in different regions and at different magnifications. Additionally, it also presents the corresponding selected-area-electron-diffraction (SAED) pattern. We can see from Figure 8a that there are a large number of twin structures. After magnification in Figure 8b, it is discovered that a substantial number of dislocations accumulate within the twins and at the grain boundaries. Additionally, the dislocation density at twin boundaries is significantly higher than that inside grain boundaries, thereby demonstrating that the nucleation and propagation of dislocations are greatly inhibited at the twin boundaries. The width of the twin lamellae is approximately between 100 nm and 200 nm. As can be observed from the black lines in Figure 8a, the dislocation density within the larger twin lamellae and at the grain boundaries is higher than that of the smaller twin lamellae. The crack edges exhibit specific crystallographic orientations as indicated by Figure 8c,d. This occurs because when a propagating crack nears twins with larger lamellar spacing, it is initially blunted by the twin boundaries. Subsequently, another crack nucleates on the opposite side. Trace analysis shows that the matrix/twin slip system on one side of the crack at twin boundary is typically redirected to the corresponding twin/matrix slip system on the other side[15]. In the SAED pattern of Figure 8d, we can observe the BCC crystal structure, which is consistent with the results observed in the EBSD map, supporting the mechanism of strain-induced austenite transformation to martensite.
To investigate the electrochemical corrosion behavior of the SS cladding CS plates, anodic-cathodic polarization tests were conducted. Figure 9 displays the polarization curves of the clad plates. Table 2 presents the calculated results of corrosion current densities and corrosion potential. Corrosion potential reflects the tendency of a metal surface to corrode. The more negative the corrosion potential is, the greater the probability that metal surface will corrode. Corrosion current density reflects the rate of corrosion on a metal surface. A higher corrosion current density indicates a more rapid corrosion process[23,24]. Comparing the electrochemical test results of five specimens, it can be seen that the 304#1 cladding has a greater corrosion current density and a relatively more negative corrosion potential. The corrosion potentials of the other clad plates are about -200mV. In conclusion, the corrosion resistance of 304#2 cladding is the poorest, and that of 304#1 cladding is the best. Whereas the other two clad plates have the second-best corrosion resistance. The corrosion resistance is closely associated with the organization of the clad plates. The 304#2 cladding has relatively poor corrosion resistance. This might be attributed to the precipitation of chromium-rich carbides between austenitic grains. The accumulation of chromium elements will form chromium-depleted zones, which will affect the formation of the passive film[25,26].
EIS curves for the four cladding are illustrated in Figure 10. As depicted in Figure 10a, Nyquist curves reveal that the cladding of the other clad plates has a capacitive loop radius larger than that of 304#1. This larger loop indicates an increased resistance to charge transfer and thus better corrosion resistance, as reported in [27]. Figure 10b,d are Bode diagrams. The |Z| values in the low-frequency region of the Bode diagram are equivalent to the Nyquist plot, which shows better corrosion resistance of the other claddings compared to 304#2. The impedance modulus in the mid-frequency region has a slope of approximately -1, suggesting that the passivation film exhibits capacitive-type behavior[27,28,29]. The two peaks in Figure 10d indicate two time constants within the frequency spectrum of the evaluation. Furthermore, the equivalent circuit in Figure 10c is employed to fit the EIS curves. The equivalent circuit consists of Rs, Qf, Qdl, Rf, and Rct. In the equivalent circuit, Rs stands for the resistance of the electrolyte solution. Rct and Qdl are respectively the resistance and the fitted electric double layer capacitance. In addition, Rf and Qf indicate the resistance and the corrosion film capacitance of the pores in the corrosion product respectively. The value of the equivalent element is presented in Table 3. Comparing the Qf and Rf of each data set, it can be seen that the Qf of 304#2 cladding decreases sharply, while the Rf increases. This indicates that the corrosion film is more dense, but the coverage ratio of corrosion products on the substrate surfaces as well as the corrosion resistance are sharply reduced. This seriously affects the corrosion resistance of 304#2 cladding[30].
4. Conclusions
- (1)
- With the increase in rolling reduction ratio, the grain size, the width of interfacial martensite zone, and the element diffusion distance decrease. The small difference in C element concentration leads to no obvious decarburized layer or carburized layer being formed.
- (2)
- Due to the greater stress distribution on the CS side, it results in a greater local orientation deviation and a larger number of deformed grains. With a sharp increase in the reduction ratio, ferrite grains will be broken into small ones, being accompanied by the generation of a large amount of carbides. When the rate of increase in the reduction ratio slows down and reheating is carried out, the carbides will gradually dissolve at high temperature.
- (3)
- The growth direction of martensite in the interface area is towards the inside of the austenite grains and is almost perpendicular to the interface, which is associated with the mechanism whereby strain-induced austenite transforms into martensite, →twinning→-martensite
- (4)
- For the 304#2 clad plate, due to the precipitation of a large amount of intergranular carbides, the corrosion resistance of the cladding has decreased significantly. In addition, the change in the reduction ratio does not have a significant effect on the corrosion resistance of the cladding of other clad plates.
Author Contributions
Jie Chen: Writing – review & editing, Writing – original draft, Software, Methodology, Investigation, Conceptualization. Xia Chen: Supervision, Resources, Methodology. Yixin Zhu: Investigation, Conceptualization. Xiaoli Ma: Supervision, Resources, Methodology. Bin Chen: Supervision, Resources, Project administration, Investigation, Conceptualization.
Data Availability
Data will be made available on request.
Acknowledgments
This work is supported by the open fund of the State Key Laboratory of Refractories and Metallurgy (Grants No. G201907).
Conflicts of Interest
The authors declare that they have no known competing financial interests or personal relationships that could have appeared to influence the work reported in this paper.
References
- M. Tang, J. Li, X. Yu, S. Nie, Tensile behavior of stainless steel clad plates with different cladding ratios, Journal of Constructional Steel Research, 182 (2021). [CrossRef]
- Y. Mei, H. Ban, High strain rate behaviour of stainless-clad bimetallic steel, Engineering Structures, 207 (2020). [CrossRef]
- P. Zhao, H. Ban, Y.-F. Hu, K.-F. Chung, Y. Shi, Residual stress within stainless-clad bimetallic steel welded box sections, Thin-Walled Structures, 177 (2022). [CrossRef]
- Z.Y. Chen, J.X. Li, Z.G. Lin, J.J. Qi, L. Sun, G.D. Wang, Process Analysis and Trial Tests for Hot-Rolled Stainless Steel/Carbon Steel Clad Plates, Strength of Materials, 51 (2019) 26-31. [CrossRef]
- H. Ban, X. Yang, L. Hai, Y. Shi, Low-cycle fatigue behaviour and fracture feature of stainless-clad bimetallic steel, Journal of Constructional Steel Research, 196 (2022). [CrossRef]
- X. Liao, H. Wei, L. Feng, H. Ban, Low-cycle fatigue behavior for stainless-clad 304 + Q235B bimetallic steel, International Journal of Fatigue, 159 (2022). [CrossRef]
- B.X. Liu, S. Wang, W. Fang, J.L. Ma, F.X. Yin, J.N. He, J.H. Feng, C.X. Chen, Microstructure and mechanical properties of hot rolled stainless steel clad plate by heat treatment, Materials Chemistry and Physics, 216 (2018) 460-467. [CrossRef]
- H. Ban, R. Bai, L. Yang, Y. Bai, Mechanical properties of stainless-clad bimetallic steel at elevated temperatures, Journal of Constructional Steel Research, 162 (2019). [CrossRef]
- H. Ban, J. Zhu, G. Shi, Y. Zhang, Tests and modelling on cyclic behaviour of stainless-clad bimetallic steel, Journal of Constructional Steel Research, 166 (2020). [CrossRef]
- Z. Dhib, N. Guermazi, A. Ktari, M. Gasperini, N. Haddar, Mechanical bonding properties and interfacial morphologies of austenitic stainless steel clad plates, Materials Science and Engineering: A, 696 (2017) 374-386. [CrossRef]
- S. Wang, B.X. Liu, C.X. Chen, J.H. Feng, F.X. Yin, Microstructure, mechanical properties and interface bonding mechanism of hot-rolled stainless steel clad plates at different rolling reduction ratios, Journal of Alloys and Compounds, 766 (2018) 517-526. [CrossRef]
- B.X. Liu, F.X. Yin, X.L. Dai, J.N. He, W. Fang, C.X. Chen, Y.C. Dong, The tensile behaviors and fracture characteristics of stainless steel clad plates with different interfacial status, Materials Science and Engineering: A, 679 (2017) 172-182. [CrossRef]
- Z. Zhu, Y. He, X. Zhang, H. Liu, X. Li, Effect of interface oxides on shear properties of hot-rolled stainless steel clad plate, Materials Science and Engineering: A, 669 (2016) 344-349. [CrossRef]
- B. Wu, K. Guo, X. Yang, Y. Gao, Y. Jin, Y. Gao, Q. Wang, F. Zhang, Effect of carbon content of substrate on the microstructure changes and tensile behavior of clad layer of stainless steel composites, Materials Science and Engineering: A, 831 (2022). [CrossRef]
- Y.F. Shen, X.X. Li, X. Sun, Y.D. Wang, L. Zuo, Twinning and martensite in a 304 austenitic stainless steel, Materials Science and Engineering: A, 552 (2012) 514-522. [CrossRef]
- P. Xia, F.J. Canillas Rodríguez, I. Sabirov, Microstructure evolution and adiabatic heating during dynamic biaxial deformation of a 304 stainless steel, Materials Science and Engineering: A, 793 (2020). [CrossRef]
- B. Gao, L. Wang, Y. Liu, J. Liu, Y. Sui, W. Sun, X. Chen, L. Xiao, H. Zhou, In-situ TEM investigation on deformation mechanisms of a fine-grained 316L stainless steel, Scripta Materialia, 234 (2023). [CrossRef]
- Y. Yang, Z. Jiang, S. Li, X. Liu, J. Sun, W. Wang, Hot deformation behavior and microstructure evolution of stainless steel/carbon steel laminated composites, Materials Science and Engineering: A, 842 (2022). [CrossRef]
- Y. Yang, H. Li, Z. Jiang, J. Sun, X. Liu, X. Wang, J. Luo, Simultaneously enhanced strength-ductility synergy and corrosion resistance in liquid-solid bonded stainless steel cladding carbon steel plate by hot rolling and annealing treatment, Materials Science and Engineering: A, 871 (2023). [CrossRef]
- Y. Yang, Z. Jiang, Y. Chen, X. Liu, J. Sun, W. Wang, Interfacial microstructure and strengthening mechanism of stainless steel/carbon steel laminated composite fabricated by liquid-solid bonding and hot rolling, Materials Characterization, 191 (2022). [CrossRef]
- A. Momeni, K. Dehghani, H. Keshmiri, G.R. Ebrahimi, Hot deformation behavior and microstructural evolution of a superaustenitic stainless steel, Materials Science and Engineering: A, 527 (2010) 1605-1611. [CrossRef]
- Y. Yang, Z. Jiang, X. Liu, J. Sun, W. Wang, Enhanced interfacial strength and ductility of stainless steel/carbon steel laminated composite by heterogenous lamella structure, Journal of Materials Research and Technology, 18 (2022) 4846-4858. [CrossRef]
- W. Shen, L. Feng, H. Feng, Y. Cao, L. Liu, M. Cao, Y. Ge, Preparation and characterization of 304 stainless steel/Q235 carbon steel composite material, Results in Physics, 7 (2017) 529-534. [CrossRef]
- Y. Liu, Z. Zheng, J. Long, Z. Xu, S. Jiao, Y. Qiao, K. Zheng, F. Yin, Corrosion behaviour of hot-rolled 316L stainless steel-A6 carbon steel composite steel plate for marine environment, Journal of Materials Research and Technology, 26 (2023) 556-570. [CrossRef]
- G. Bai, S. Lu, D. Li, Y. Li, Intergranular corrosion behavior associated with delta-ferrite transformation of Ti-modified Super304H austenitic stainless steel, Corrosion Science, 90 (2015) 347-358. [CrossRef]
- J.-C. Jin, S. Cho, K. Kim, H. Sim, B.G. Park, Y.-K. Lee, Microstructures and intergranular corrosion resistances of hot-rolled austenitic stainless steel clad plates, Journal of Materials Research and Technology, 26 (2023) 1-13. [CrossRef]
- J. Zhang, J. He, B. Peng, H. Li, B. Li, B. Yan, J.-H. Zhang, An experimental investigation for corrosion resistance of stainless clad steel plate, Journal of Constructional Steel Research, 217 (2024). [CrossRef]
- H. Feng, J. Dai, H.-B. Li, Z.-H. Jiang, J.-D. Qu, Y. Zhao, S.-C. Zhang, T. Zhang, Sn microalloying enhances corrosion resistance of stainless steel by accelerating heterogeneous nucleation of passive film, Corrosion Science, 201 (2022). [CrossRef]
- W. Lv, C. Pan, W. Su, Z. Wang, S. Liu, C. Wang, A Study on Atmospheric Corrosion of 304 Stainless Steel in a Simulated Marine Atmosphere, Journal of Materials Engineering and Performance, 24 (2015) 2597-2604. [CrossRef]
- T. Zhang, W. Liu, Z. Yin, B. Dong, Y. Zhao, Y. Fan, J. Wu, Z. Zhang, X. Li, Effects of the Addition of Cu and Ni on the Corrosion Behavior of Weathering Steels in Corrosive Industrial Environments, Journal of Materials Engineering and Performance, 29 (2020) 2531-2541. [CrossRef]
Figure 1.
The optical microstructure of the four clad plates. (a) #1; (b) #2; (c) #3; (d) #4.
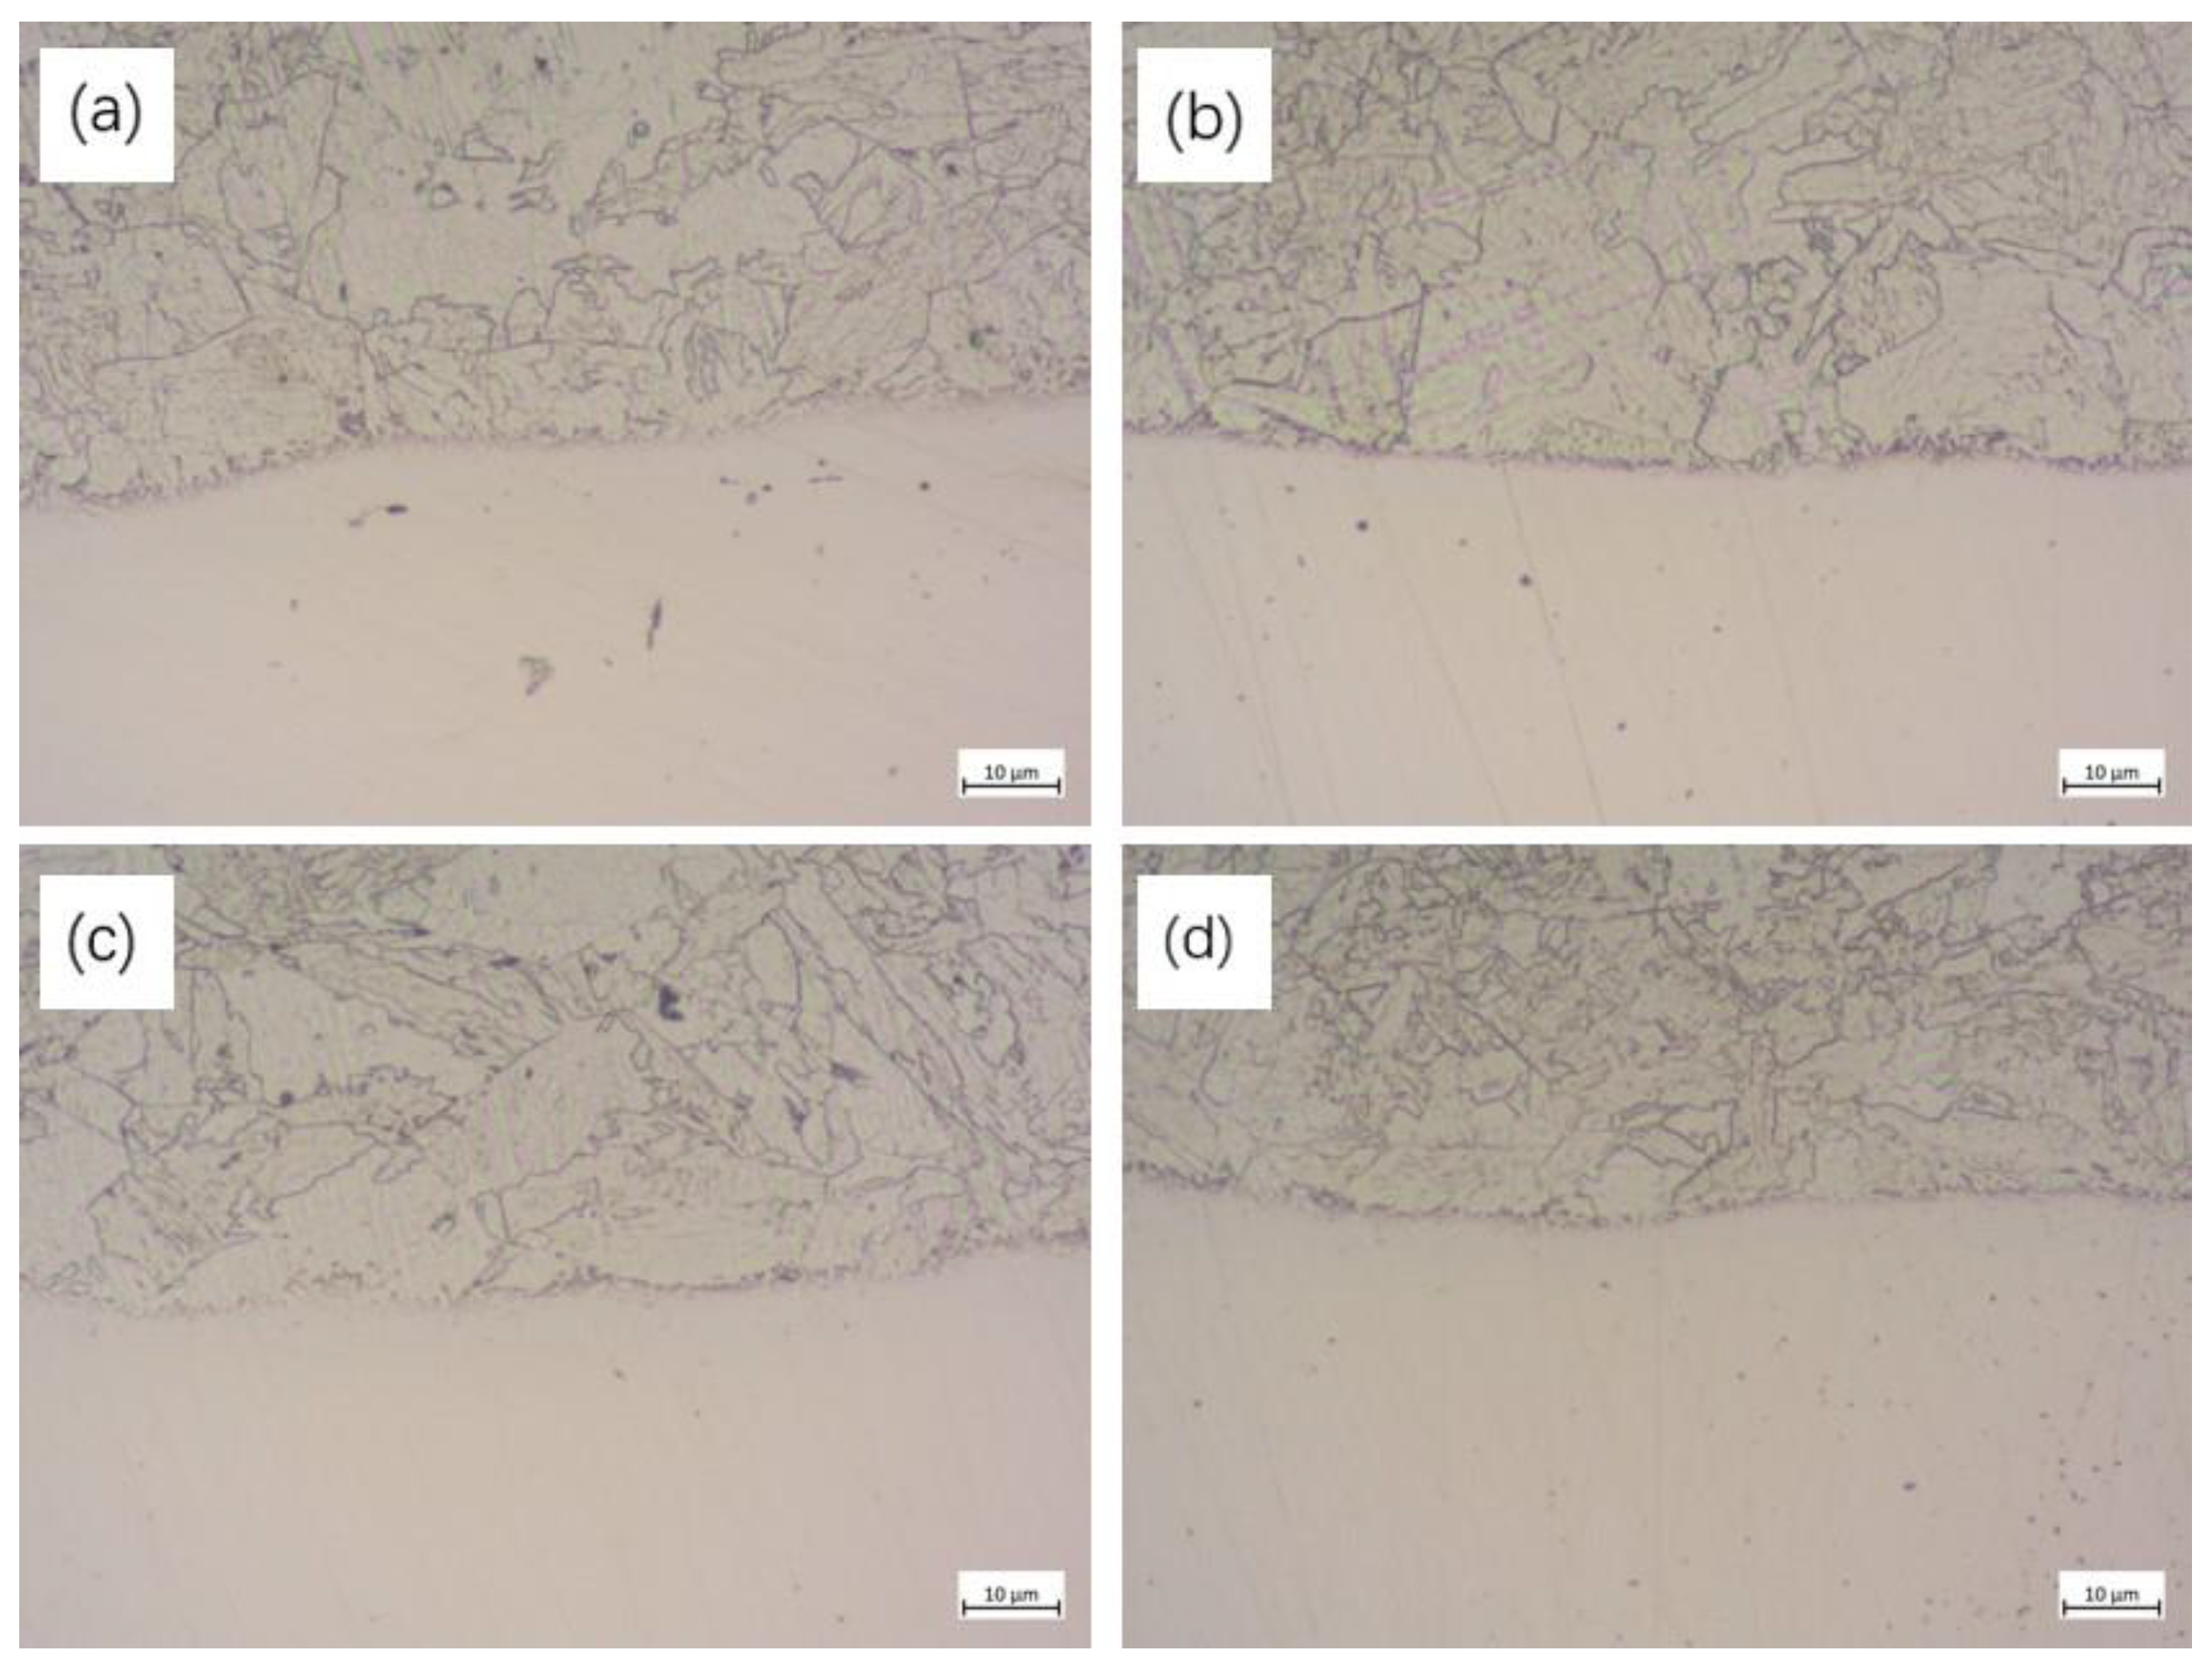
Figure 2.
The relationship between microhardness and distance in the thickness direction of the four clad plates.
Figure 2.
The relationship between microhardness and distance in the thickness direction of the four clad plates.
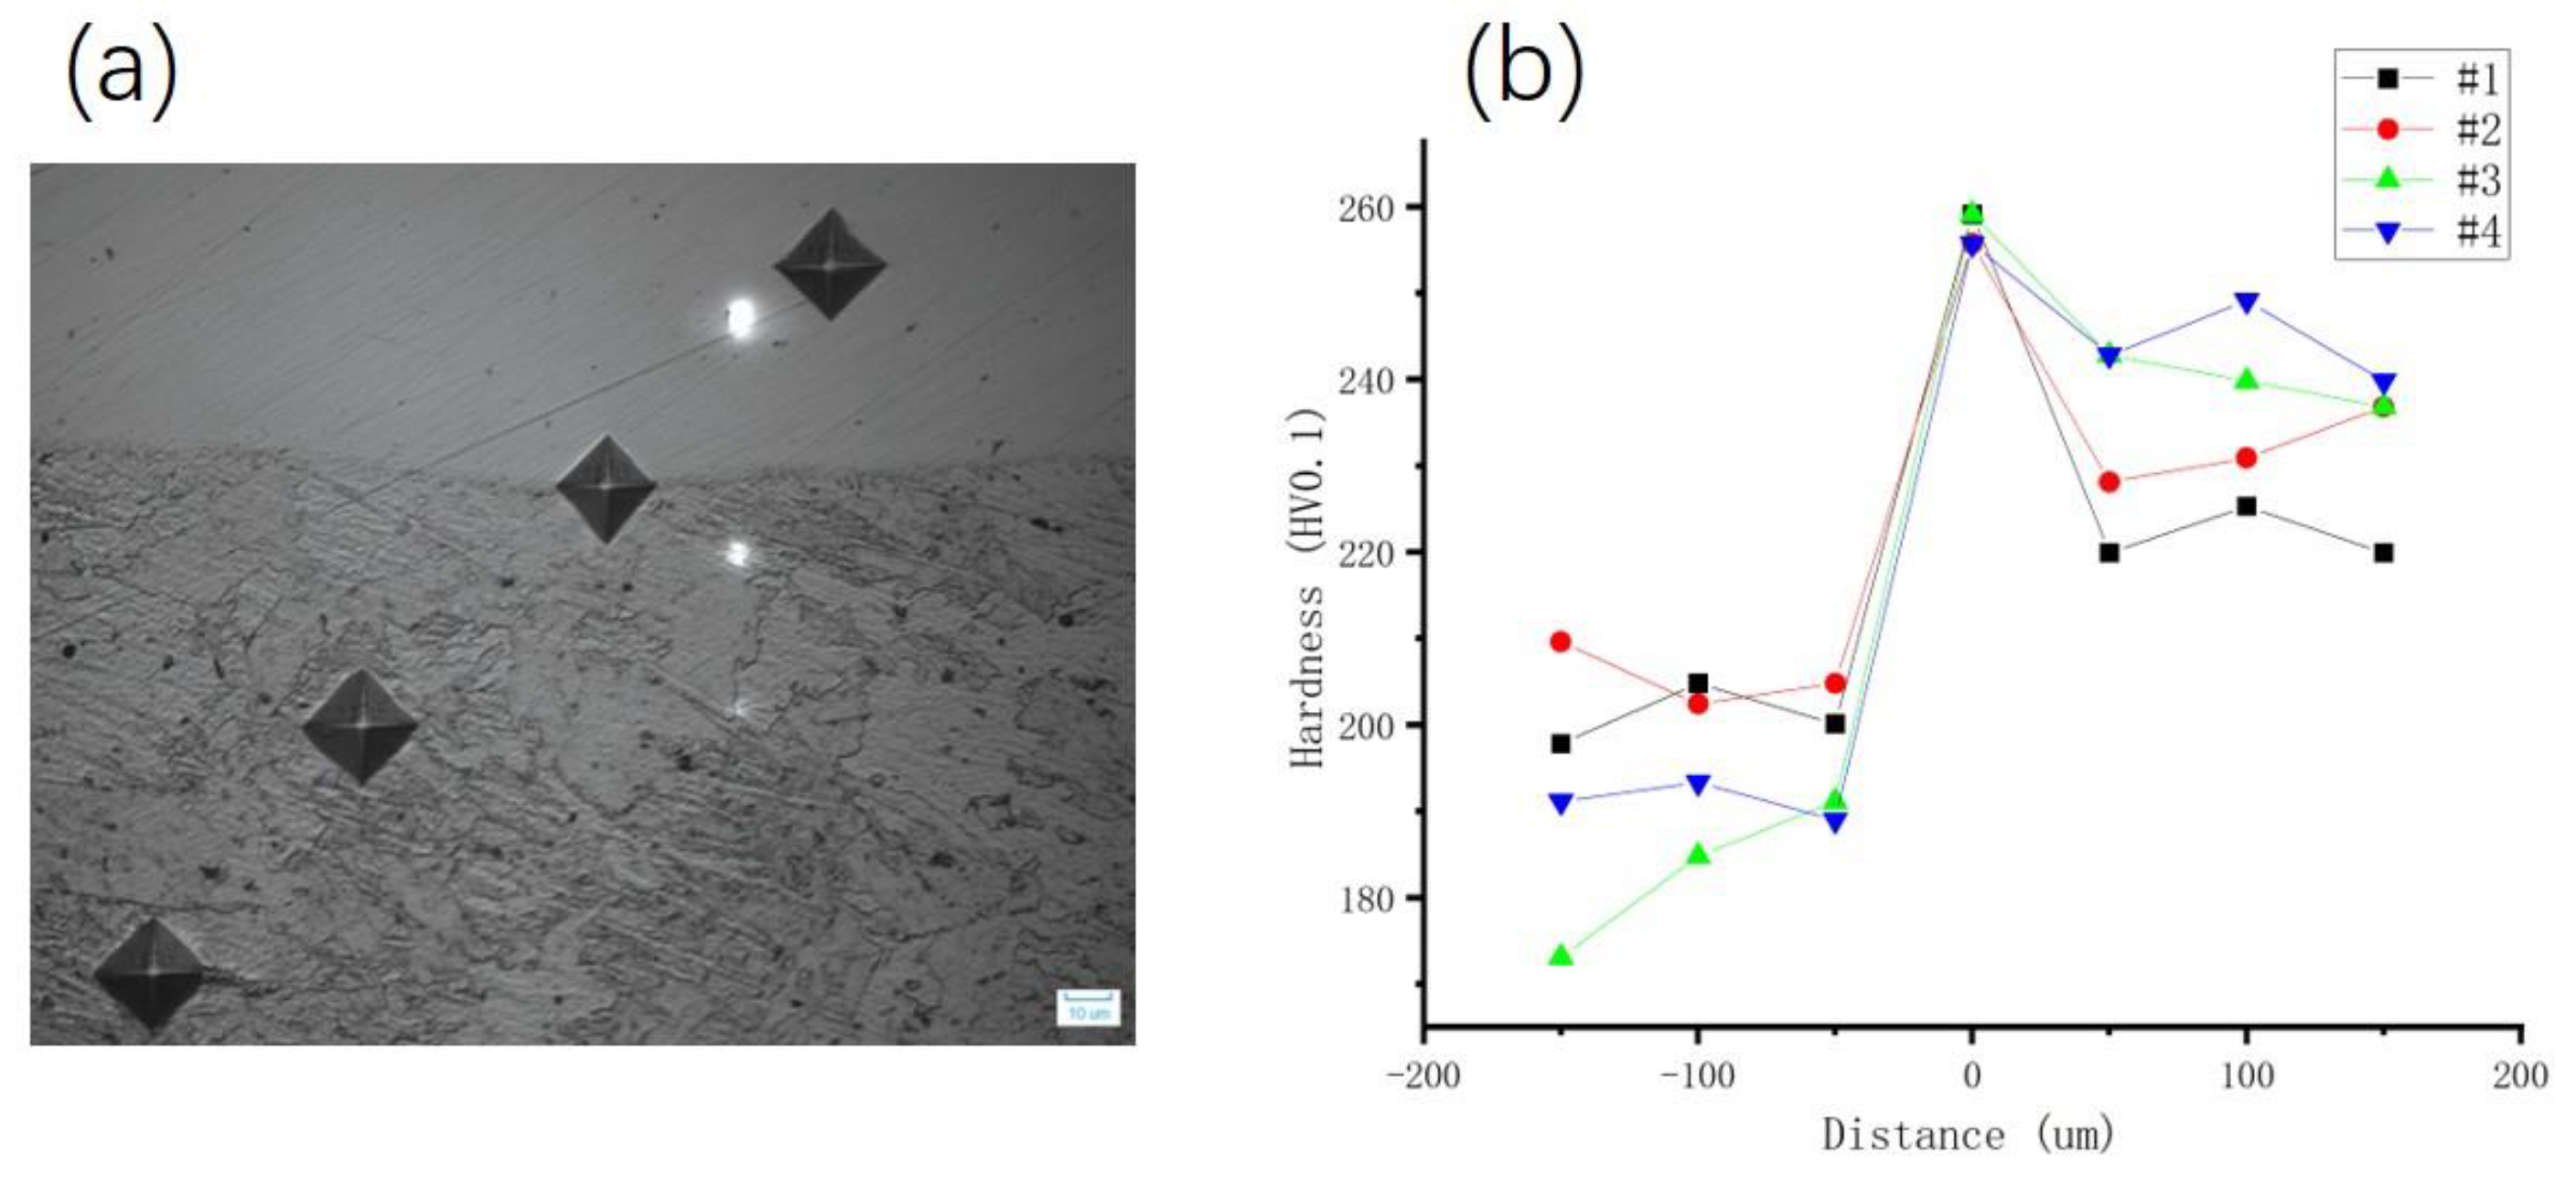
Figure 3.
The IPF maps of the four clad plates. (a) #1; (b) #2; (c) #3; (d) #4; (e), (f) corresponding localized regions in (a) and (d).
Figure 3.
The IPF maps of the four clad plates. (a) #1; (b) #2; (c) #3; (d) #4; (e), (f) corresponding localized regions in (a) and (d).
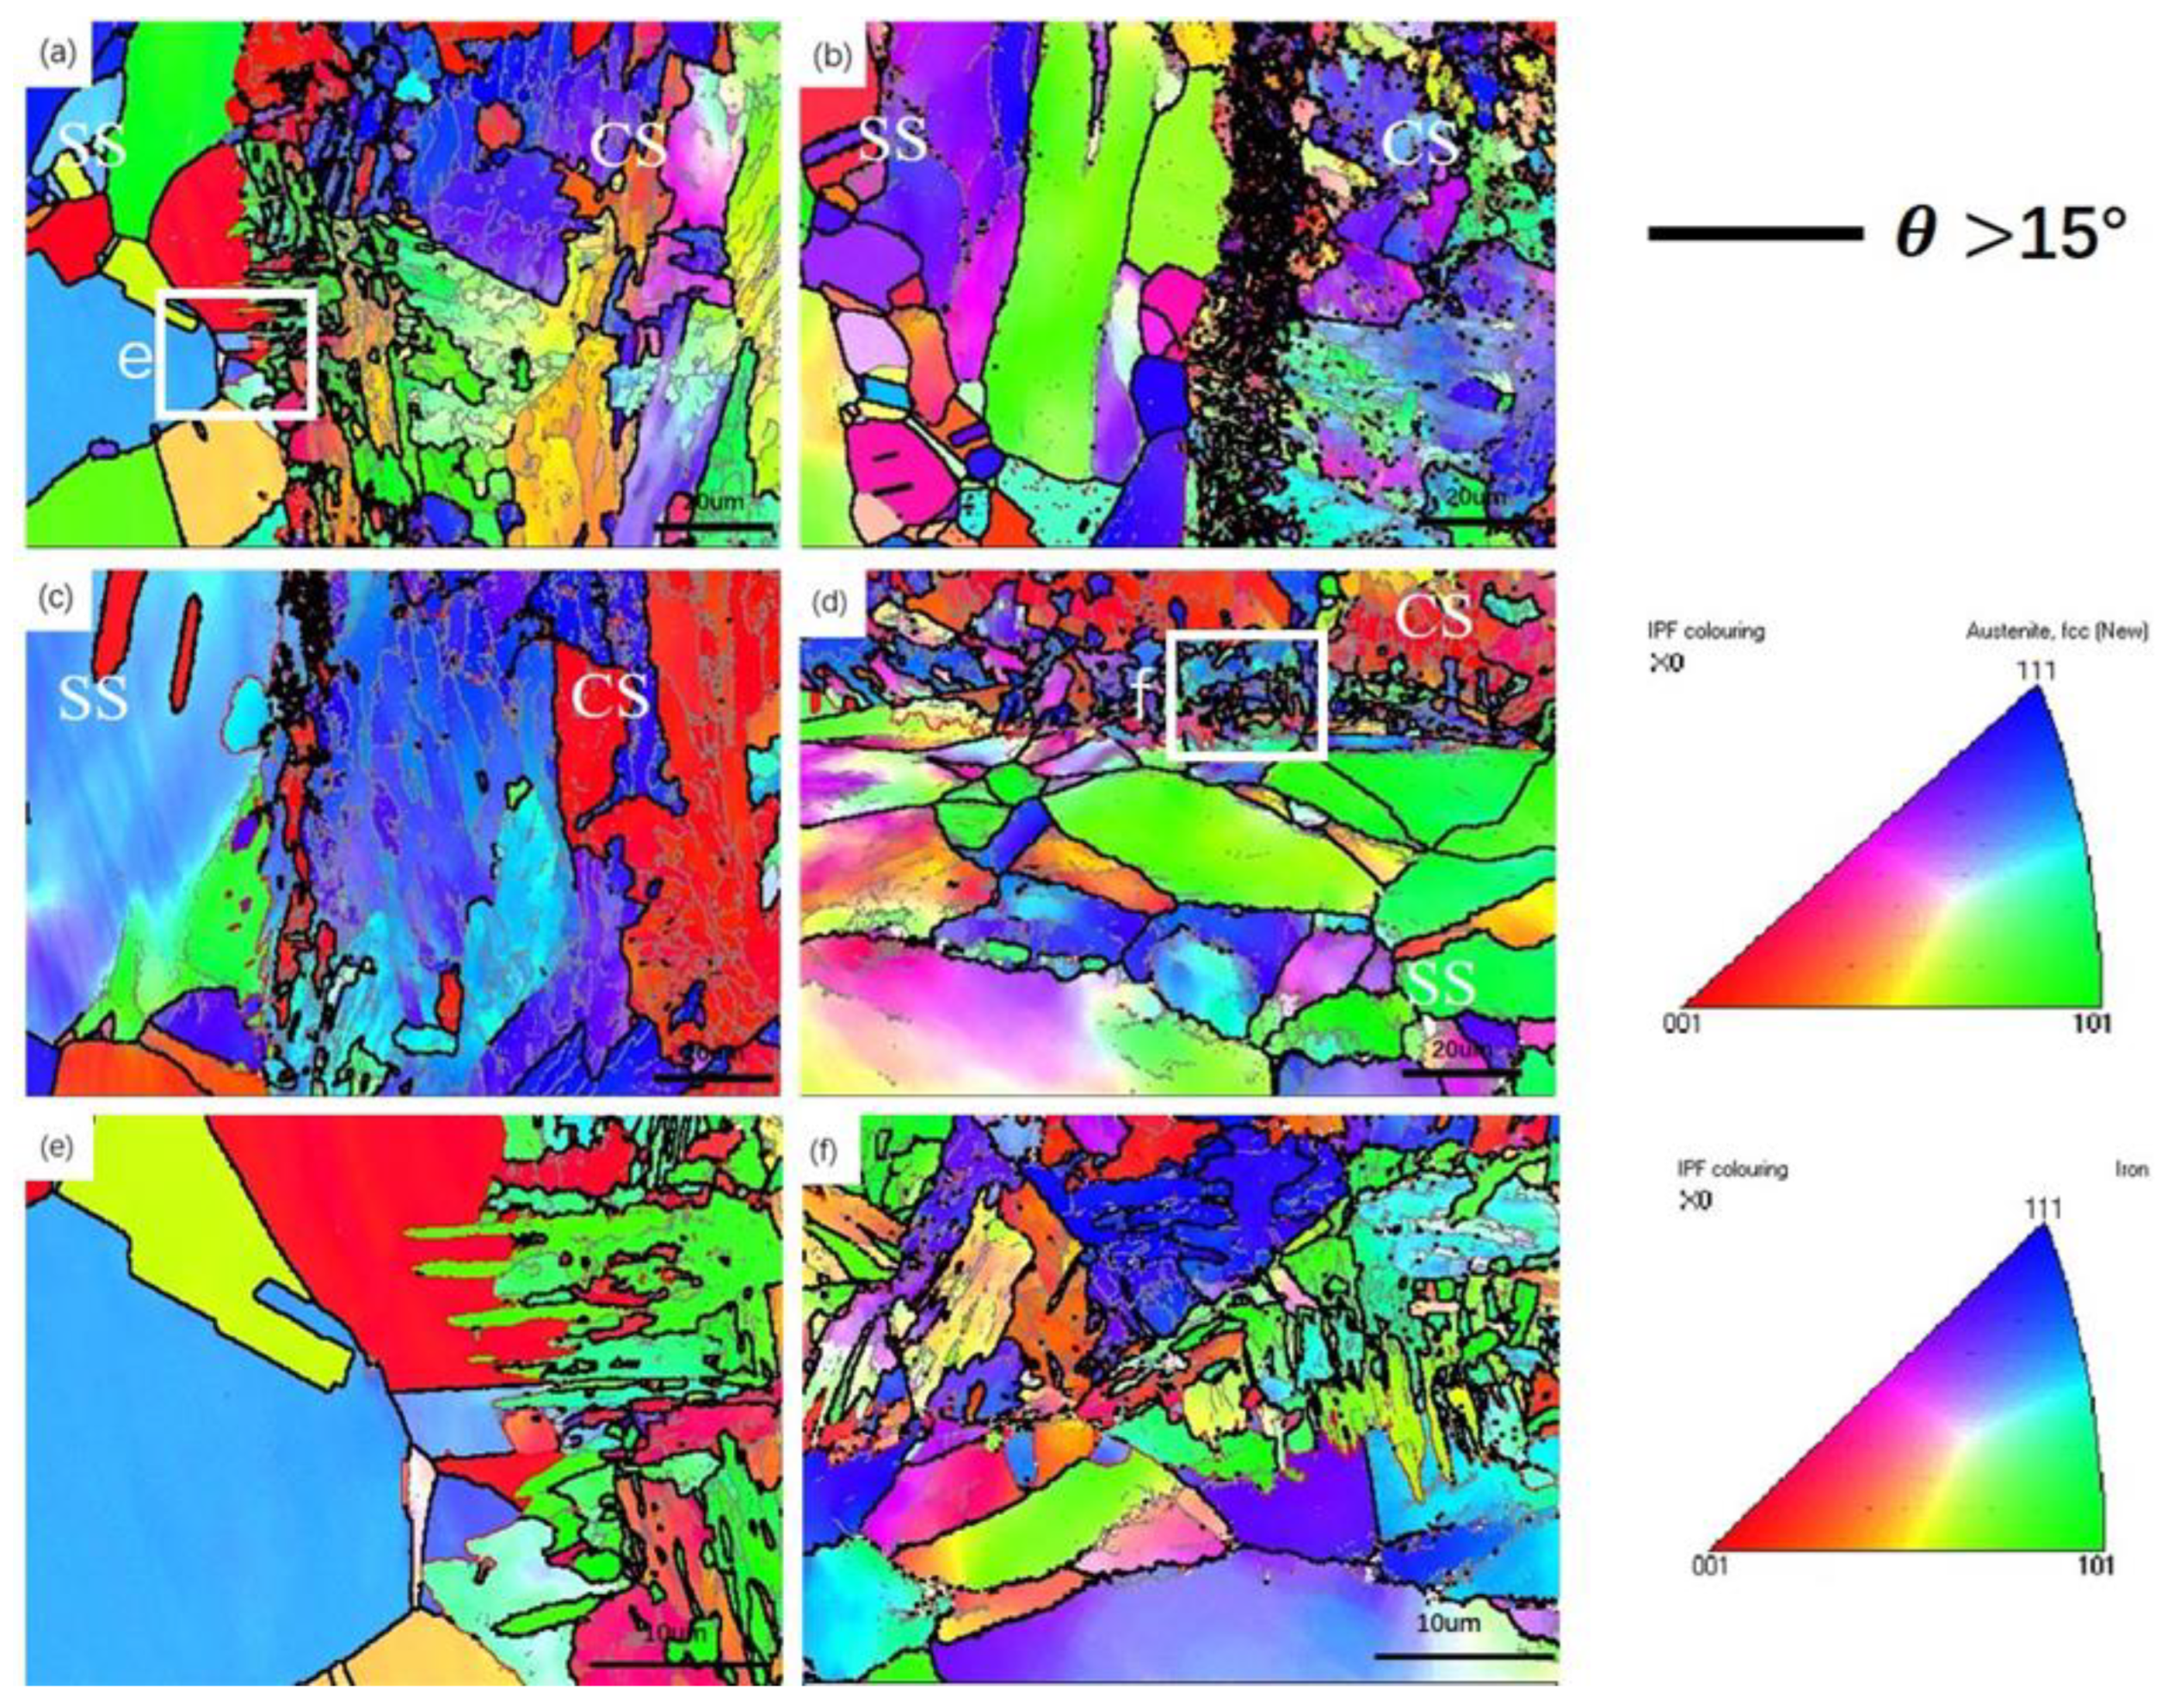
Figure 4.
Local misorientation of the four clad plates. (a) #1; (b) #2; (c) #3; (d) #4.
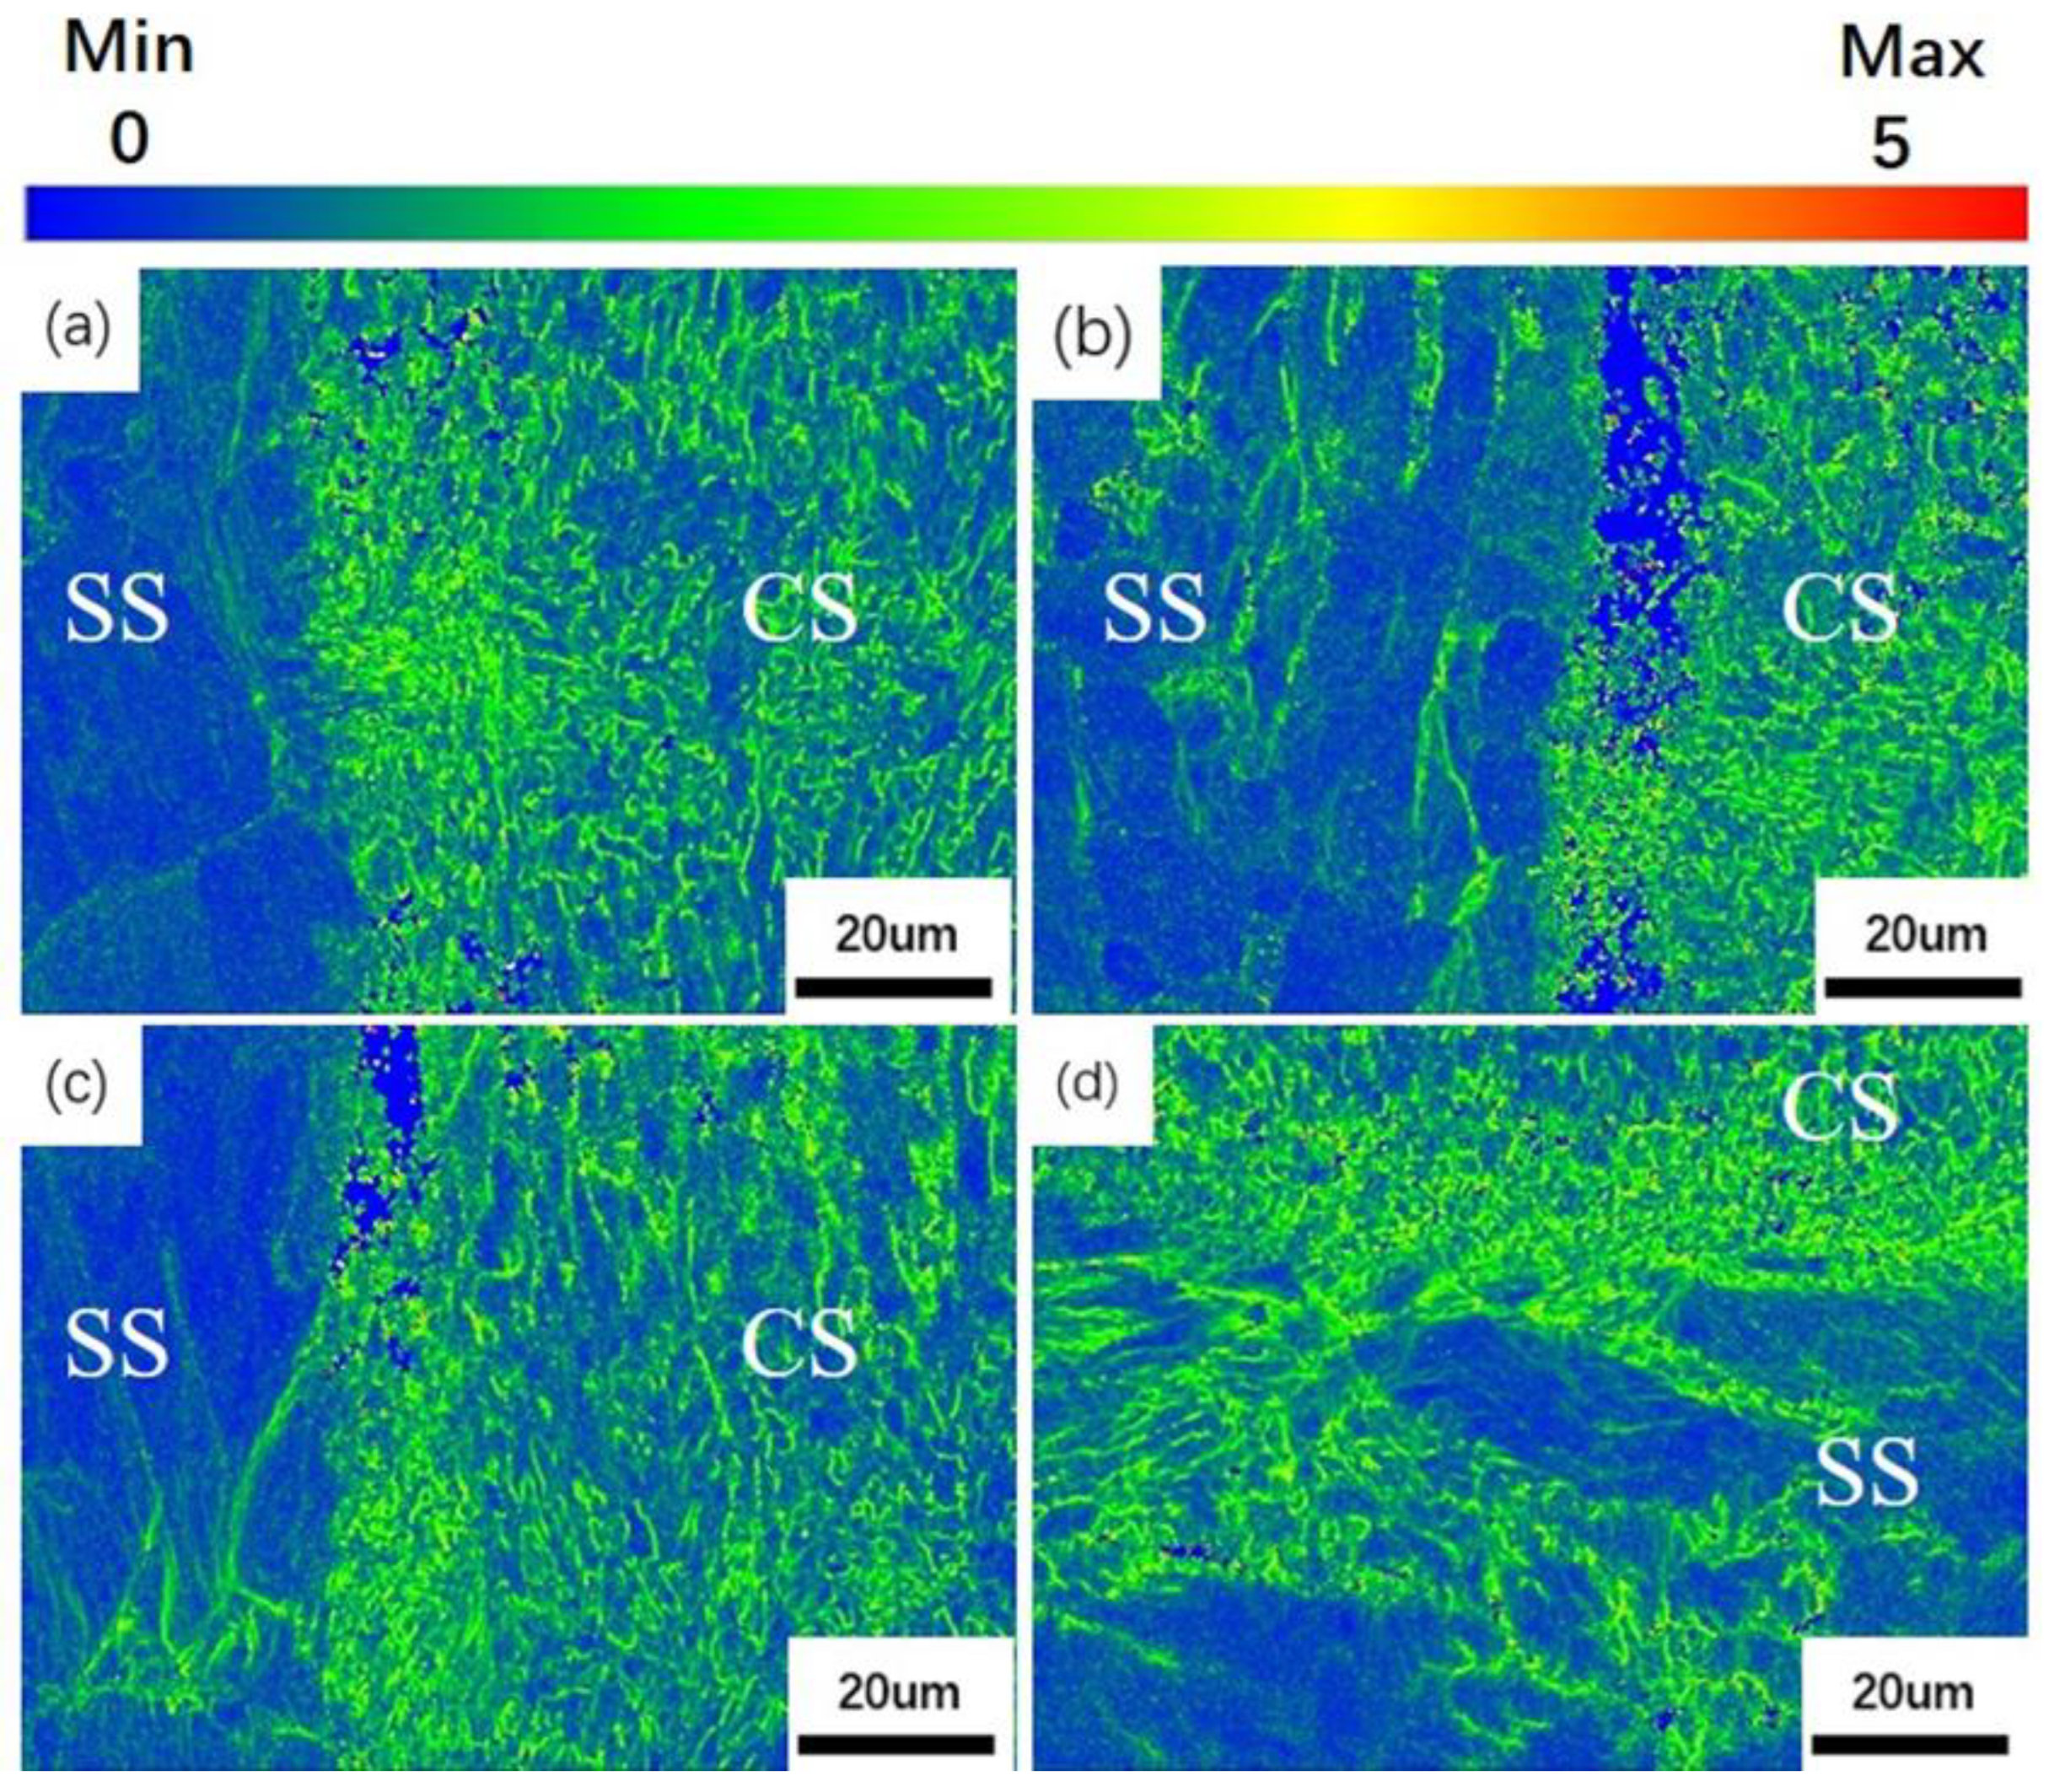
Figure 5.
Recrystallization in the cladding interface area of the four clad plates. (a) #1; (b) #2; (c) #3; (d) #4.
Figure 5.
Recrystallization in the cladding interface area of the four clad plates. (a) #1; (b) #2; (c) #3; (d) #4.
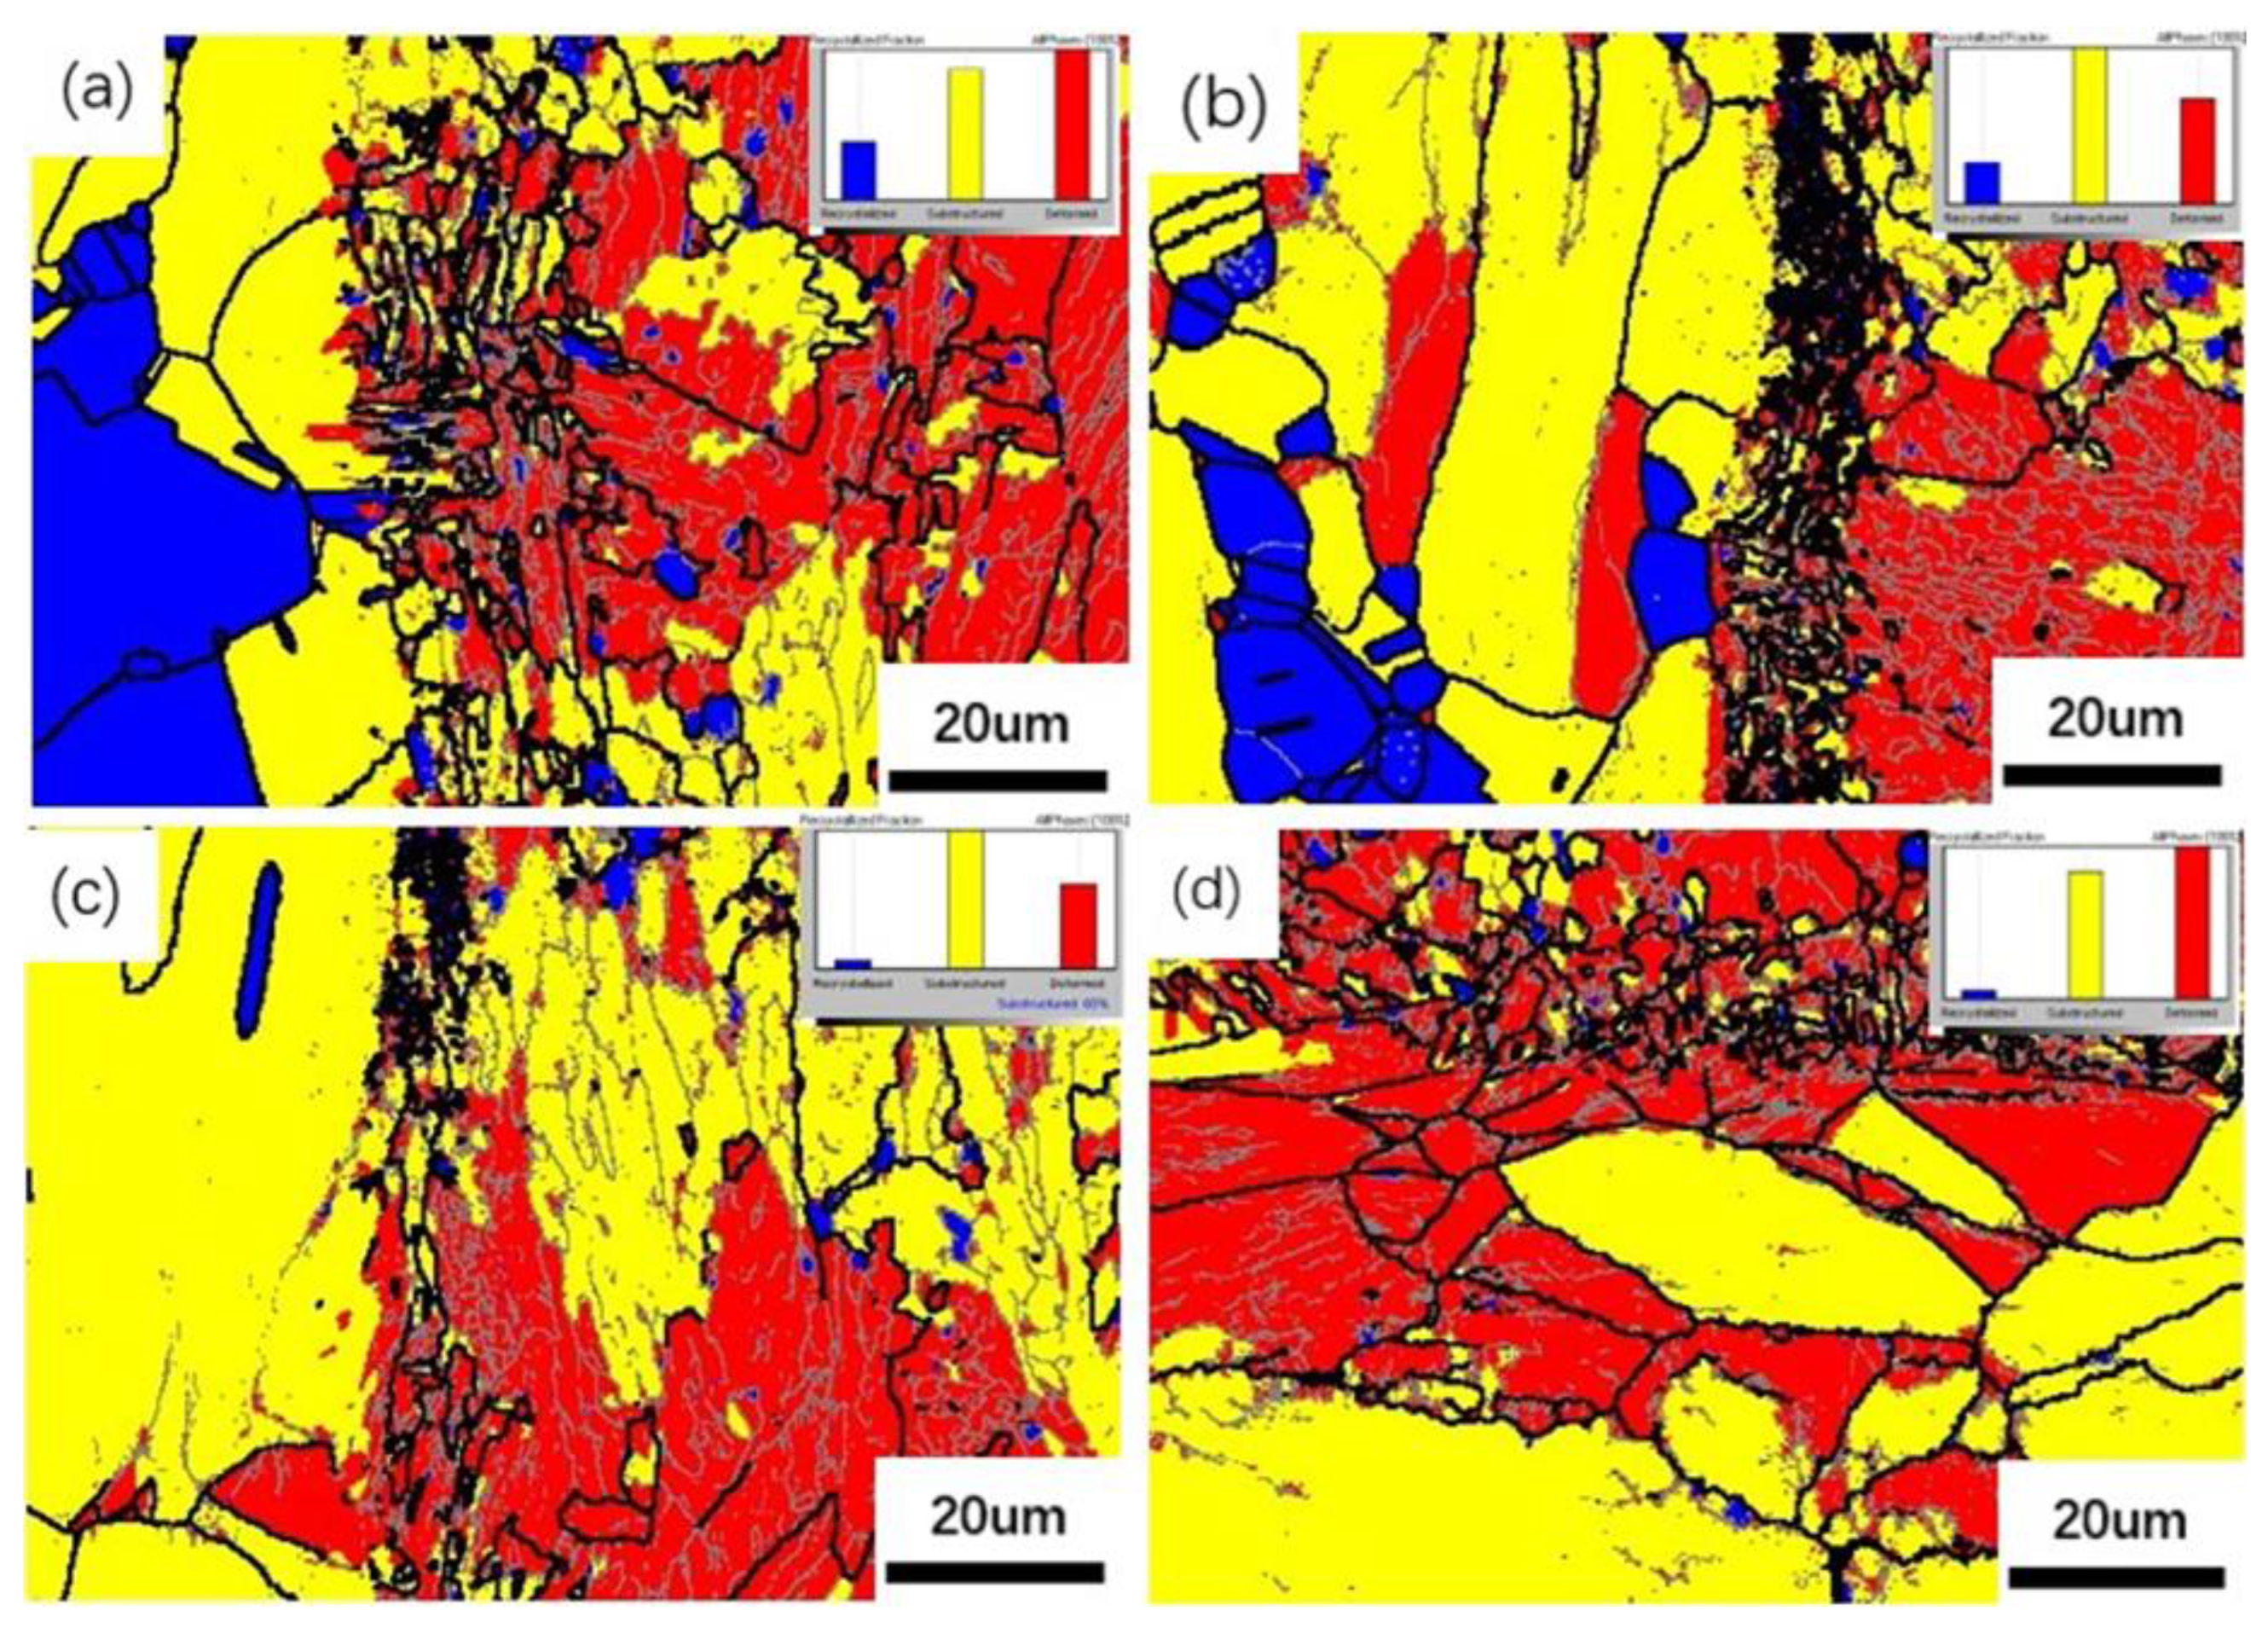
Figure 6.
EDS mapping in the cladding interface area of the four clad plates. (a) #1; (b) #2; (c) #3; (d) #4.
Figure 6.
EDS mapping in the cladding interface area of the four clad plates. (a) #1; (b) #2; (c) #3; (d) #4.
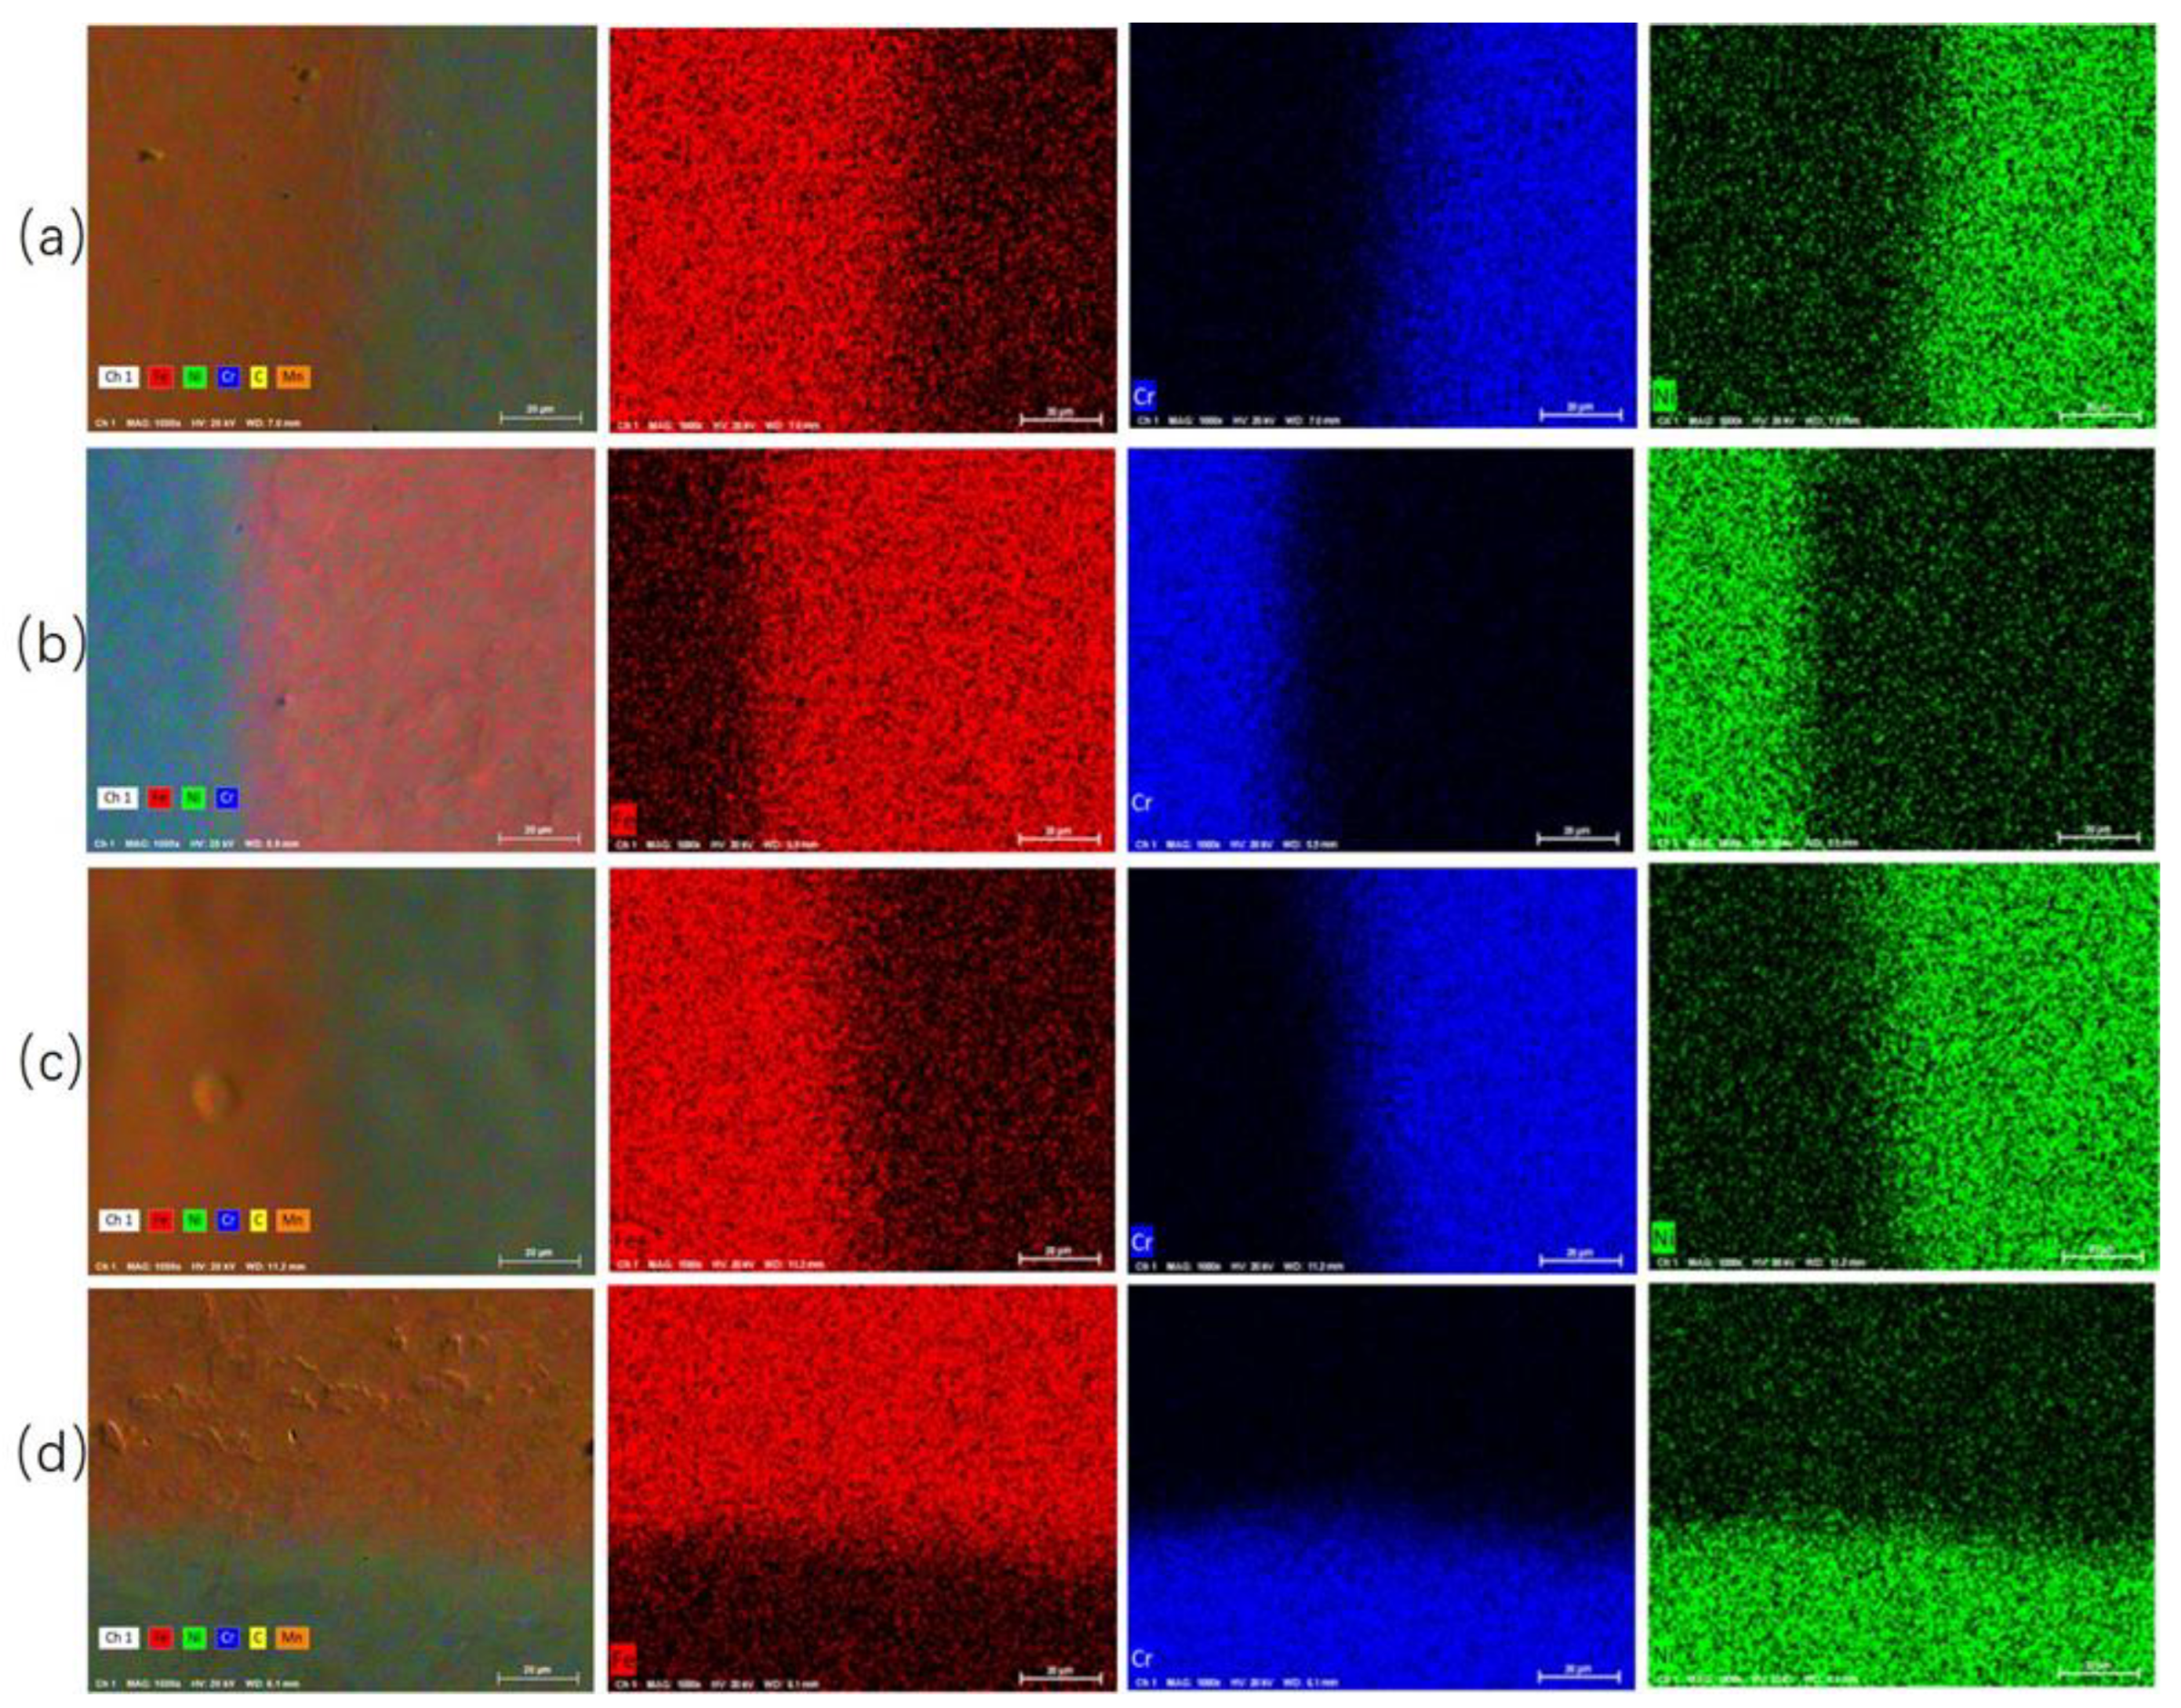
Figure 7.
EDS line scan maps in the cladding interface area of the four clad plates. (a) #1; (b) #2; (c) #3; (d) #4.
Figure 7.
EDS line scan maps in the cladding interface area of the four clad plates. (a) #1; (b) #2; (c) #3; (d) #4.
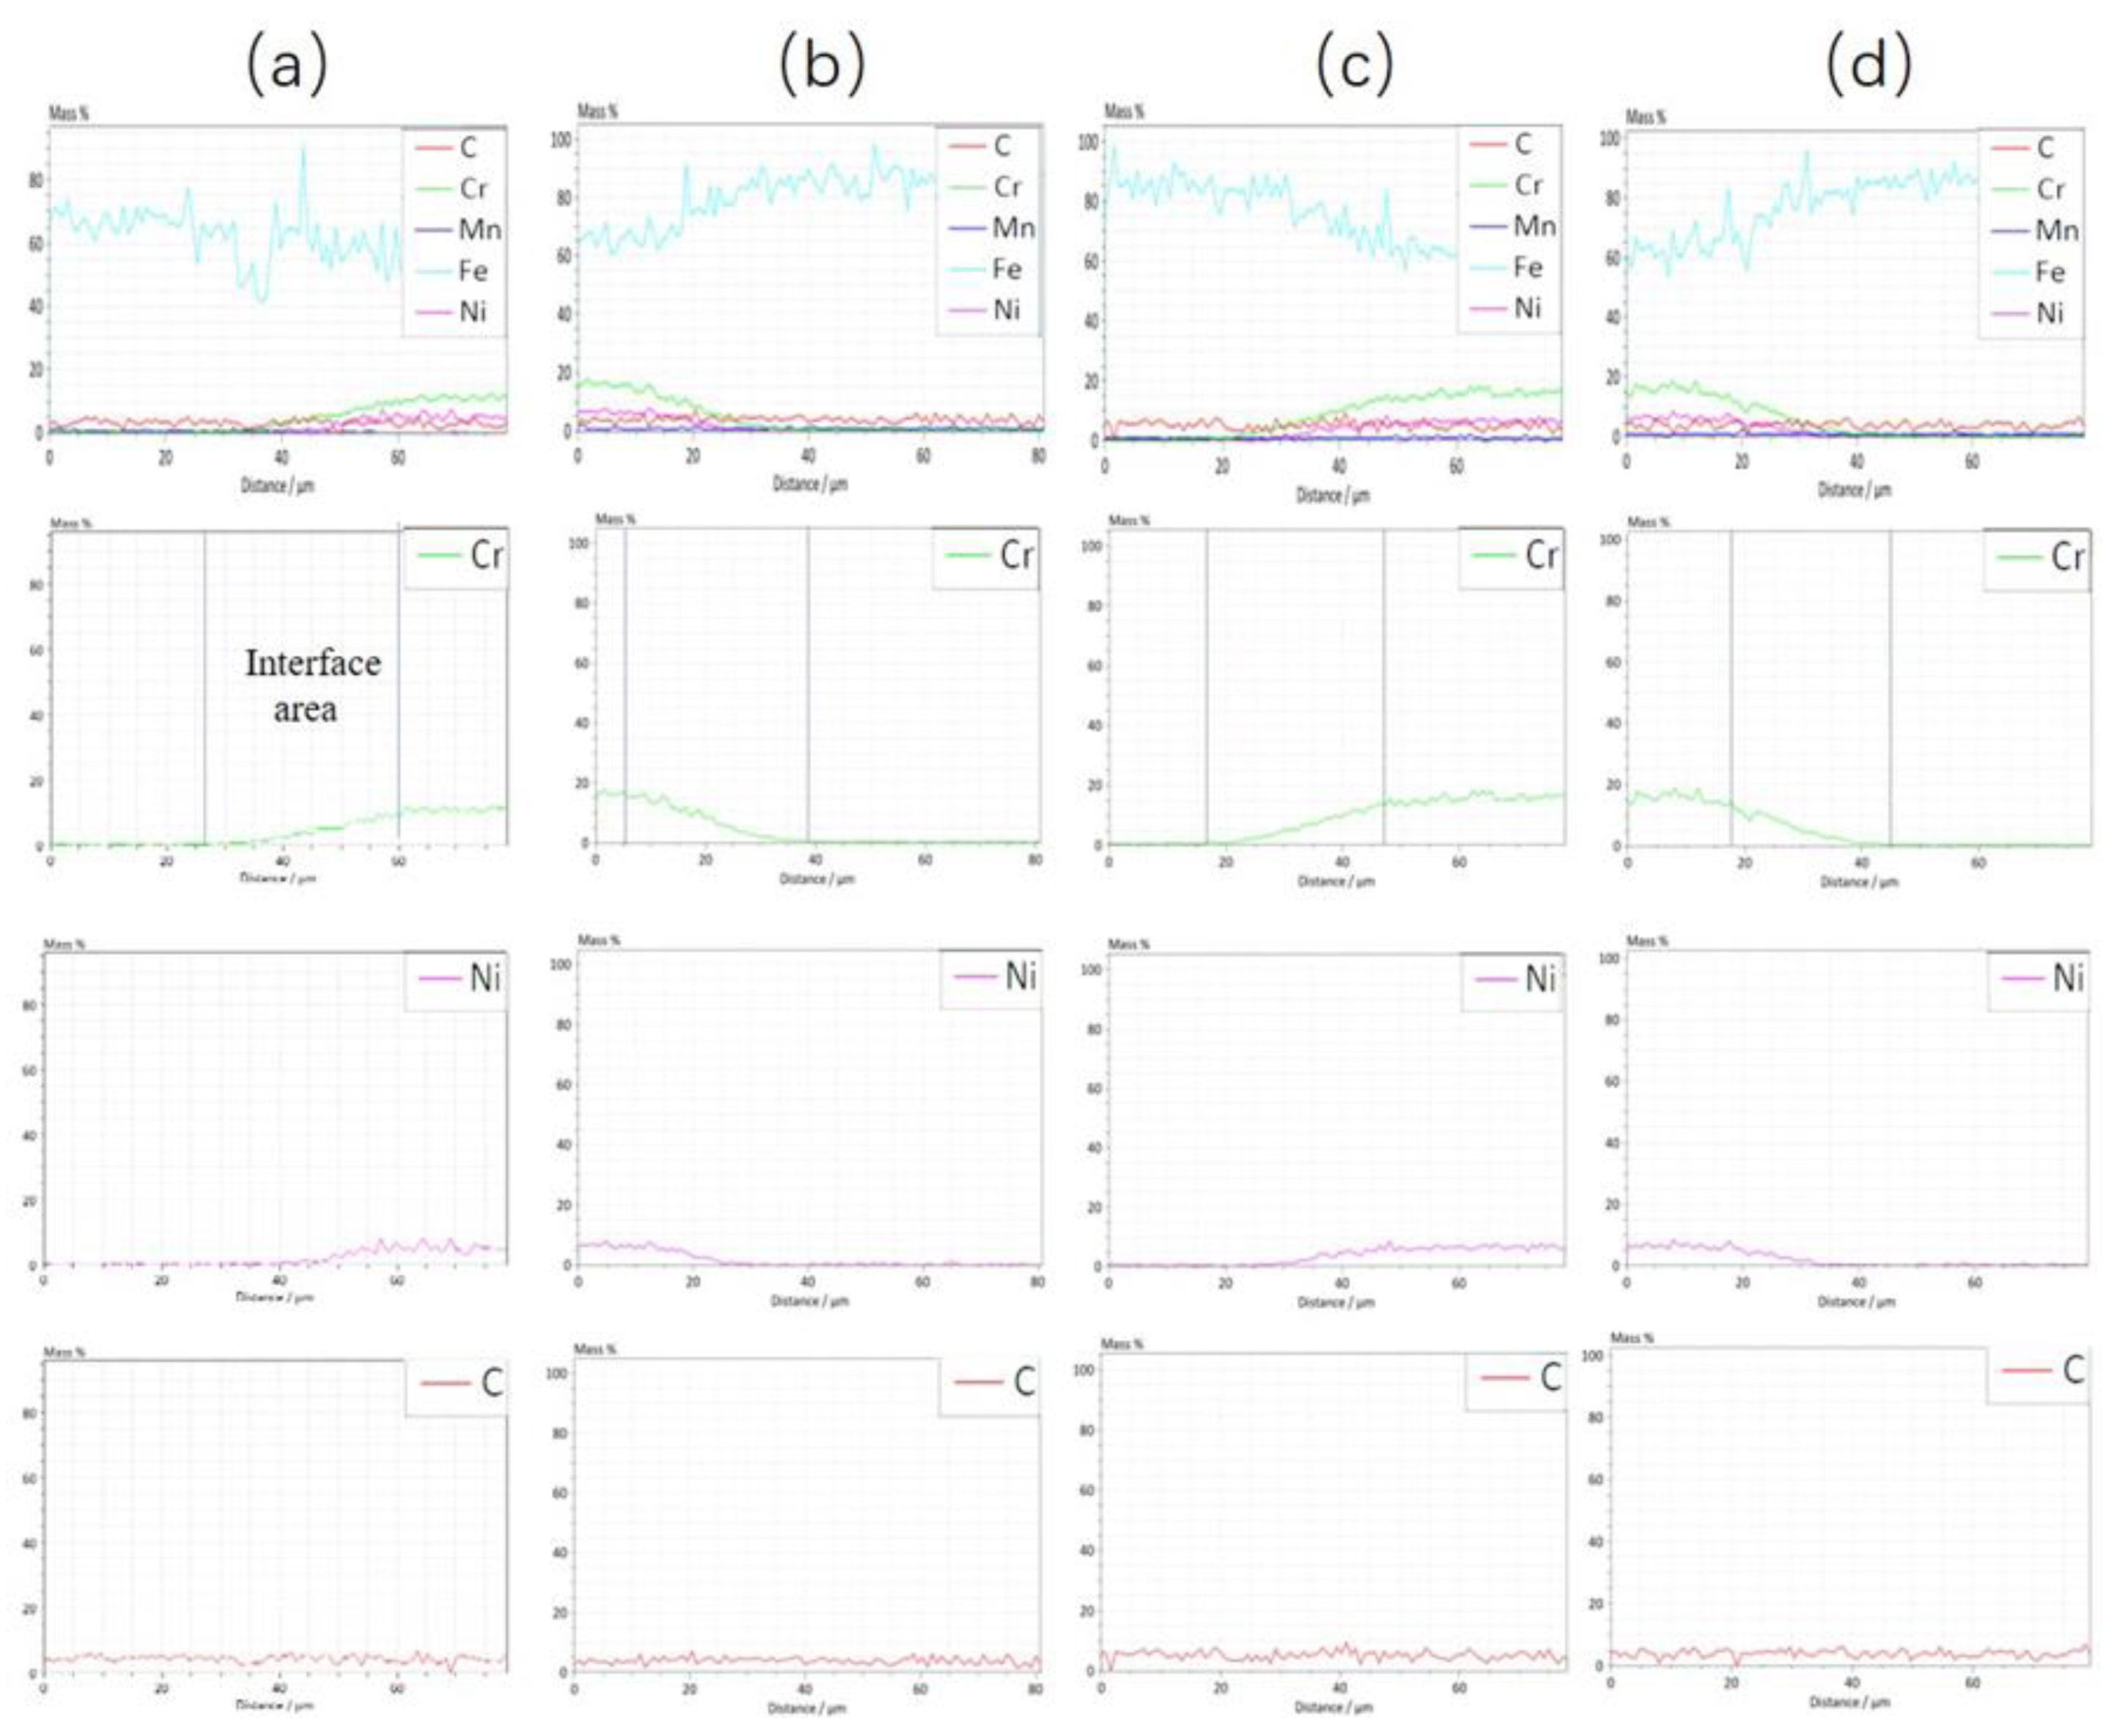
Figure 8.
(a) The TEM image shows abundant twinned structures. (b) A large number of dislocation tangles inside the twins. (c), (d) The crack path propagates along a certain direction.
Figure 8.
(a) The TEM image shows abundant twinned structures. (b) A large number of dislocation tangles inside the twins. (c), (d) The crack path propagates along a certain direction.
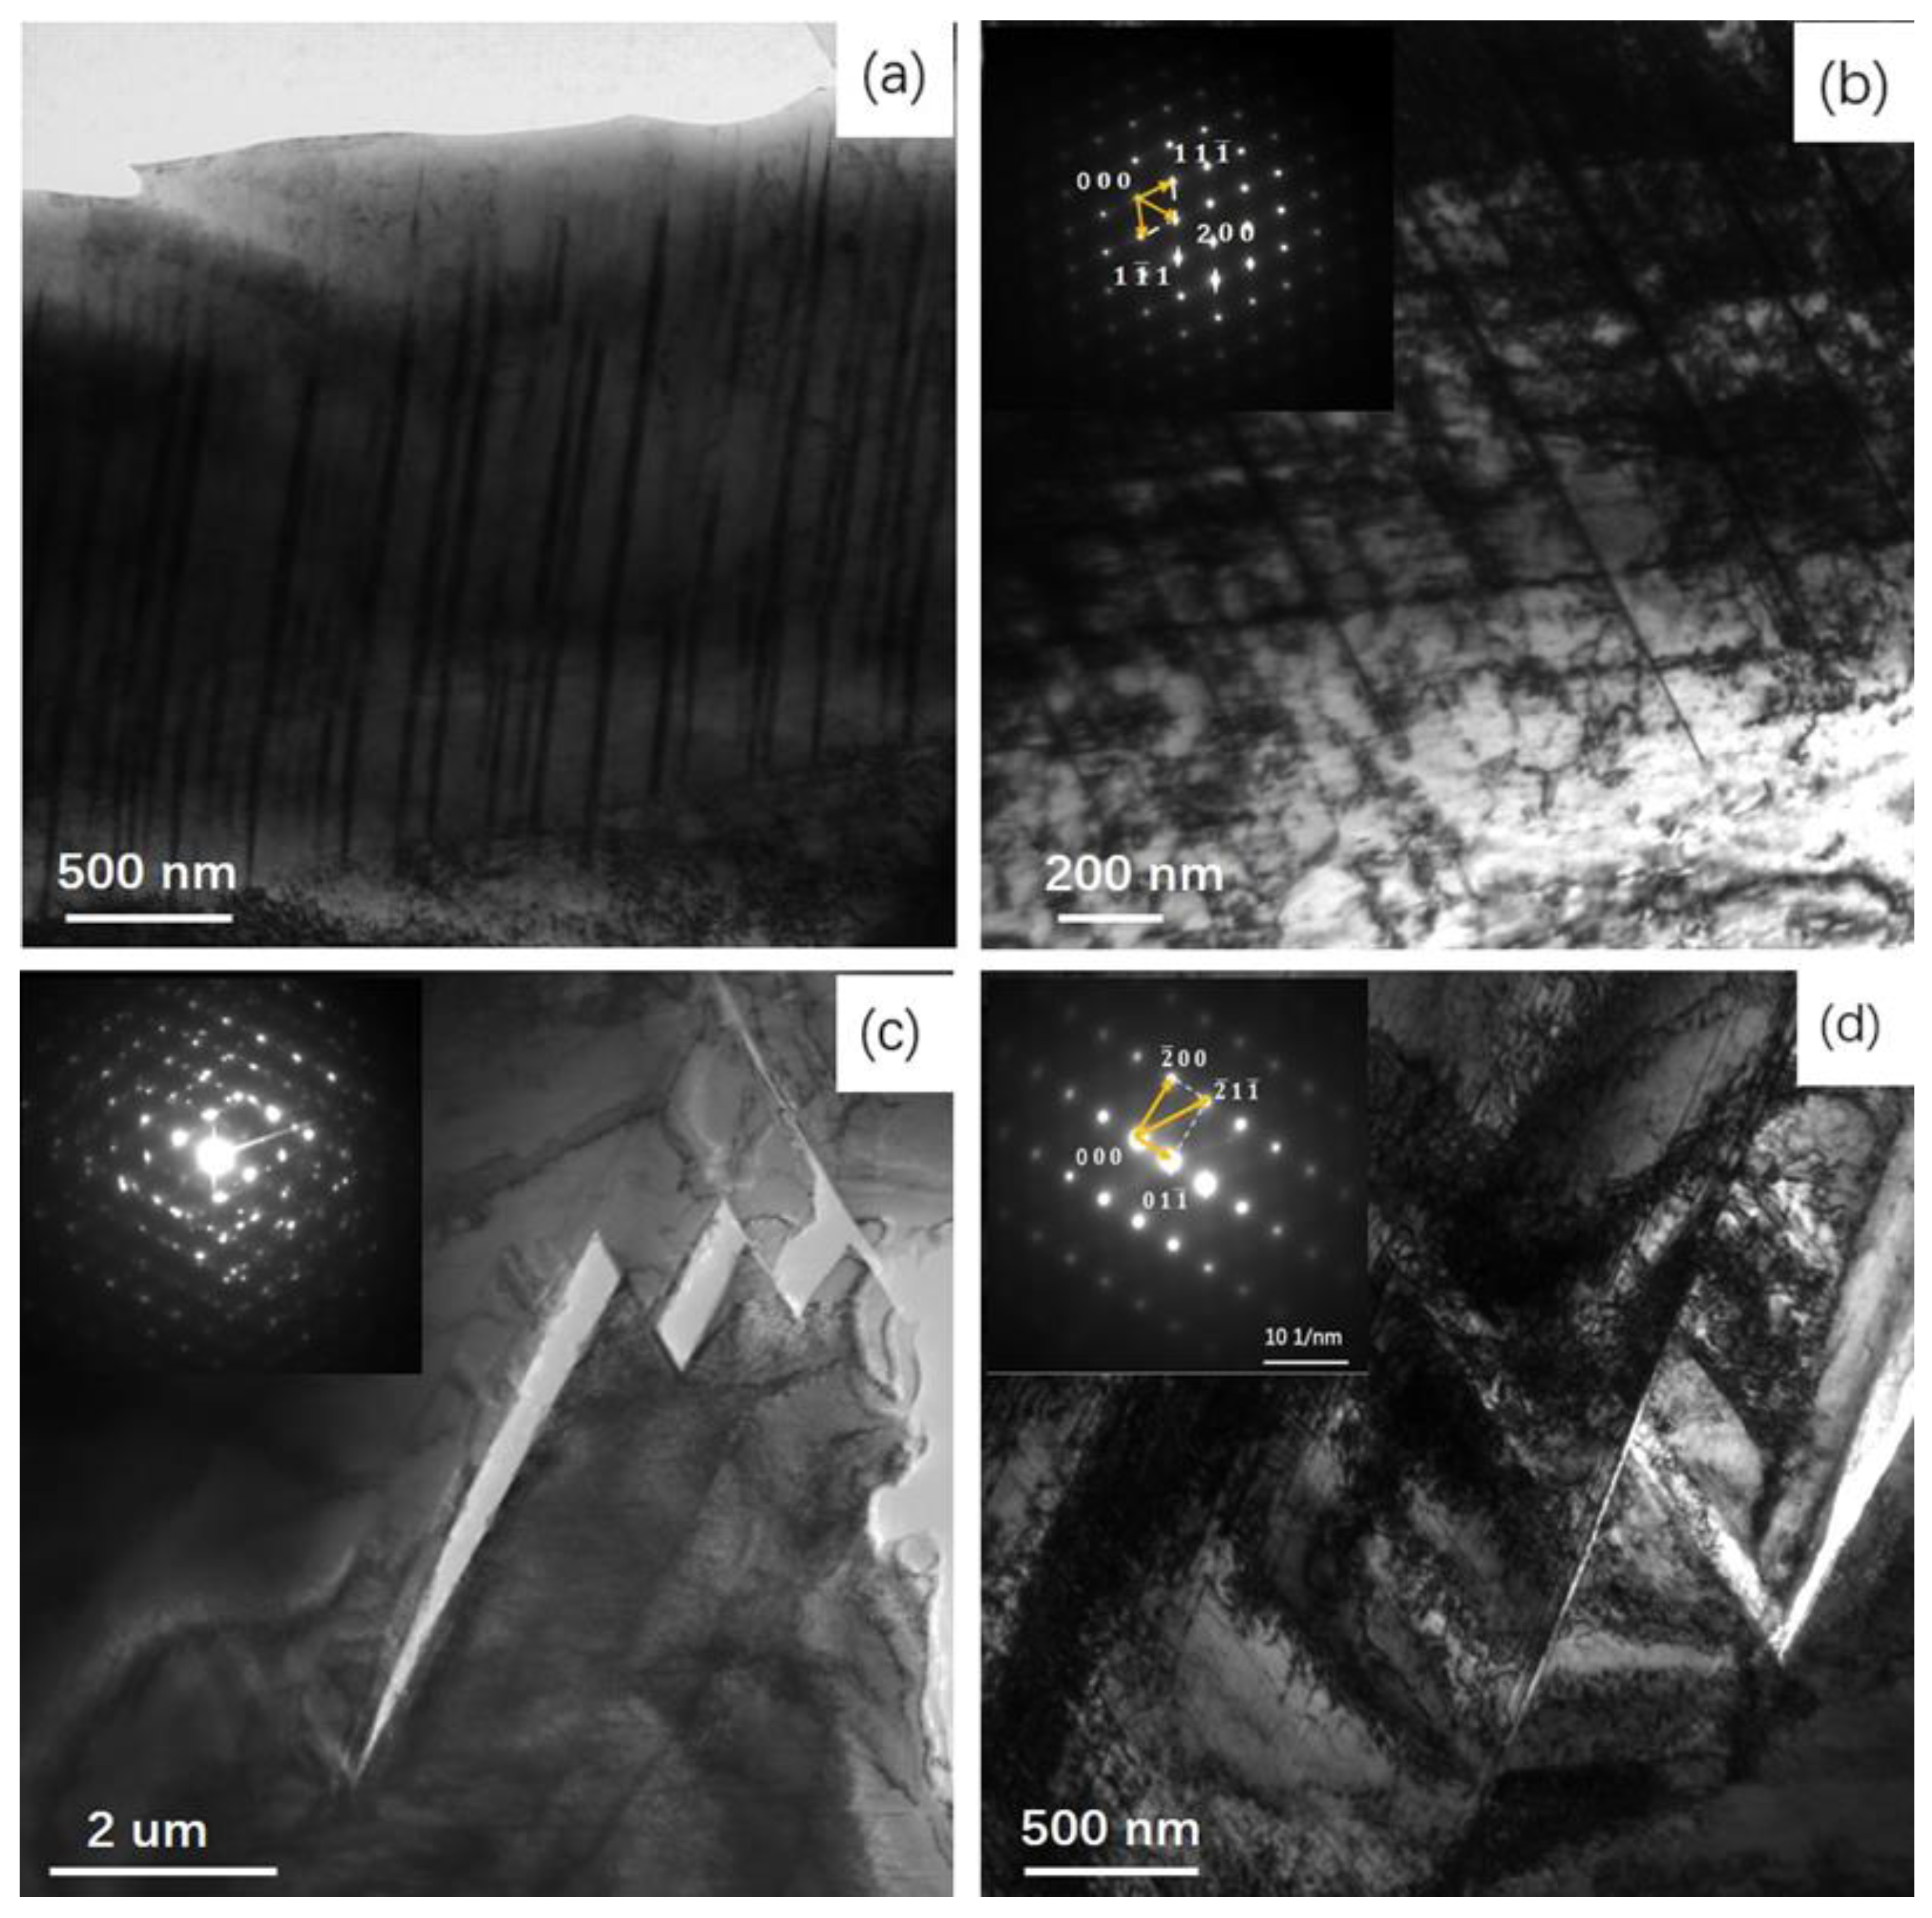
Figure 9.
Tafel curves of the four clad plates in a 3.5% NaCl solution.
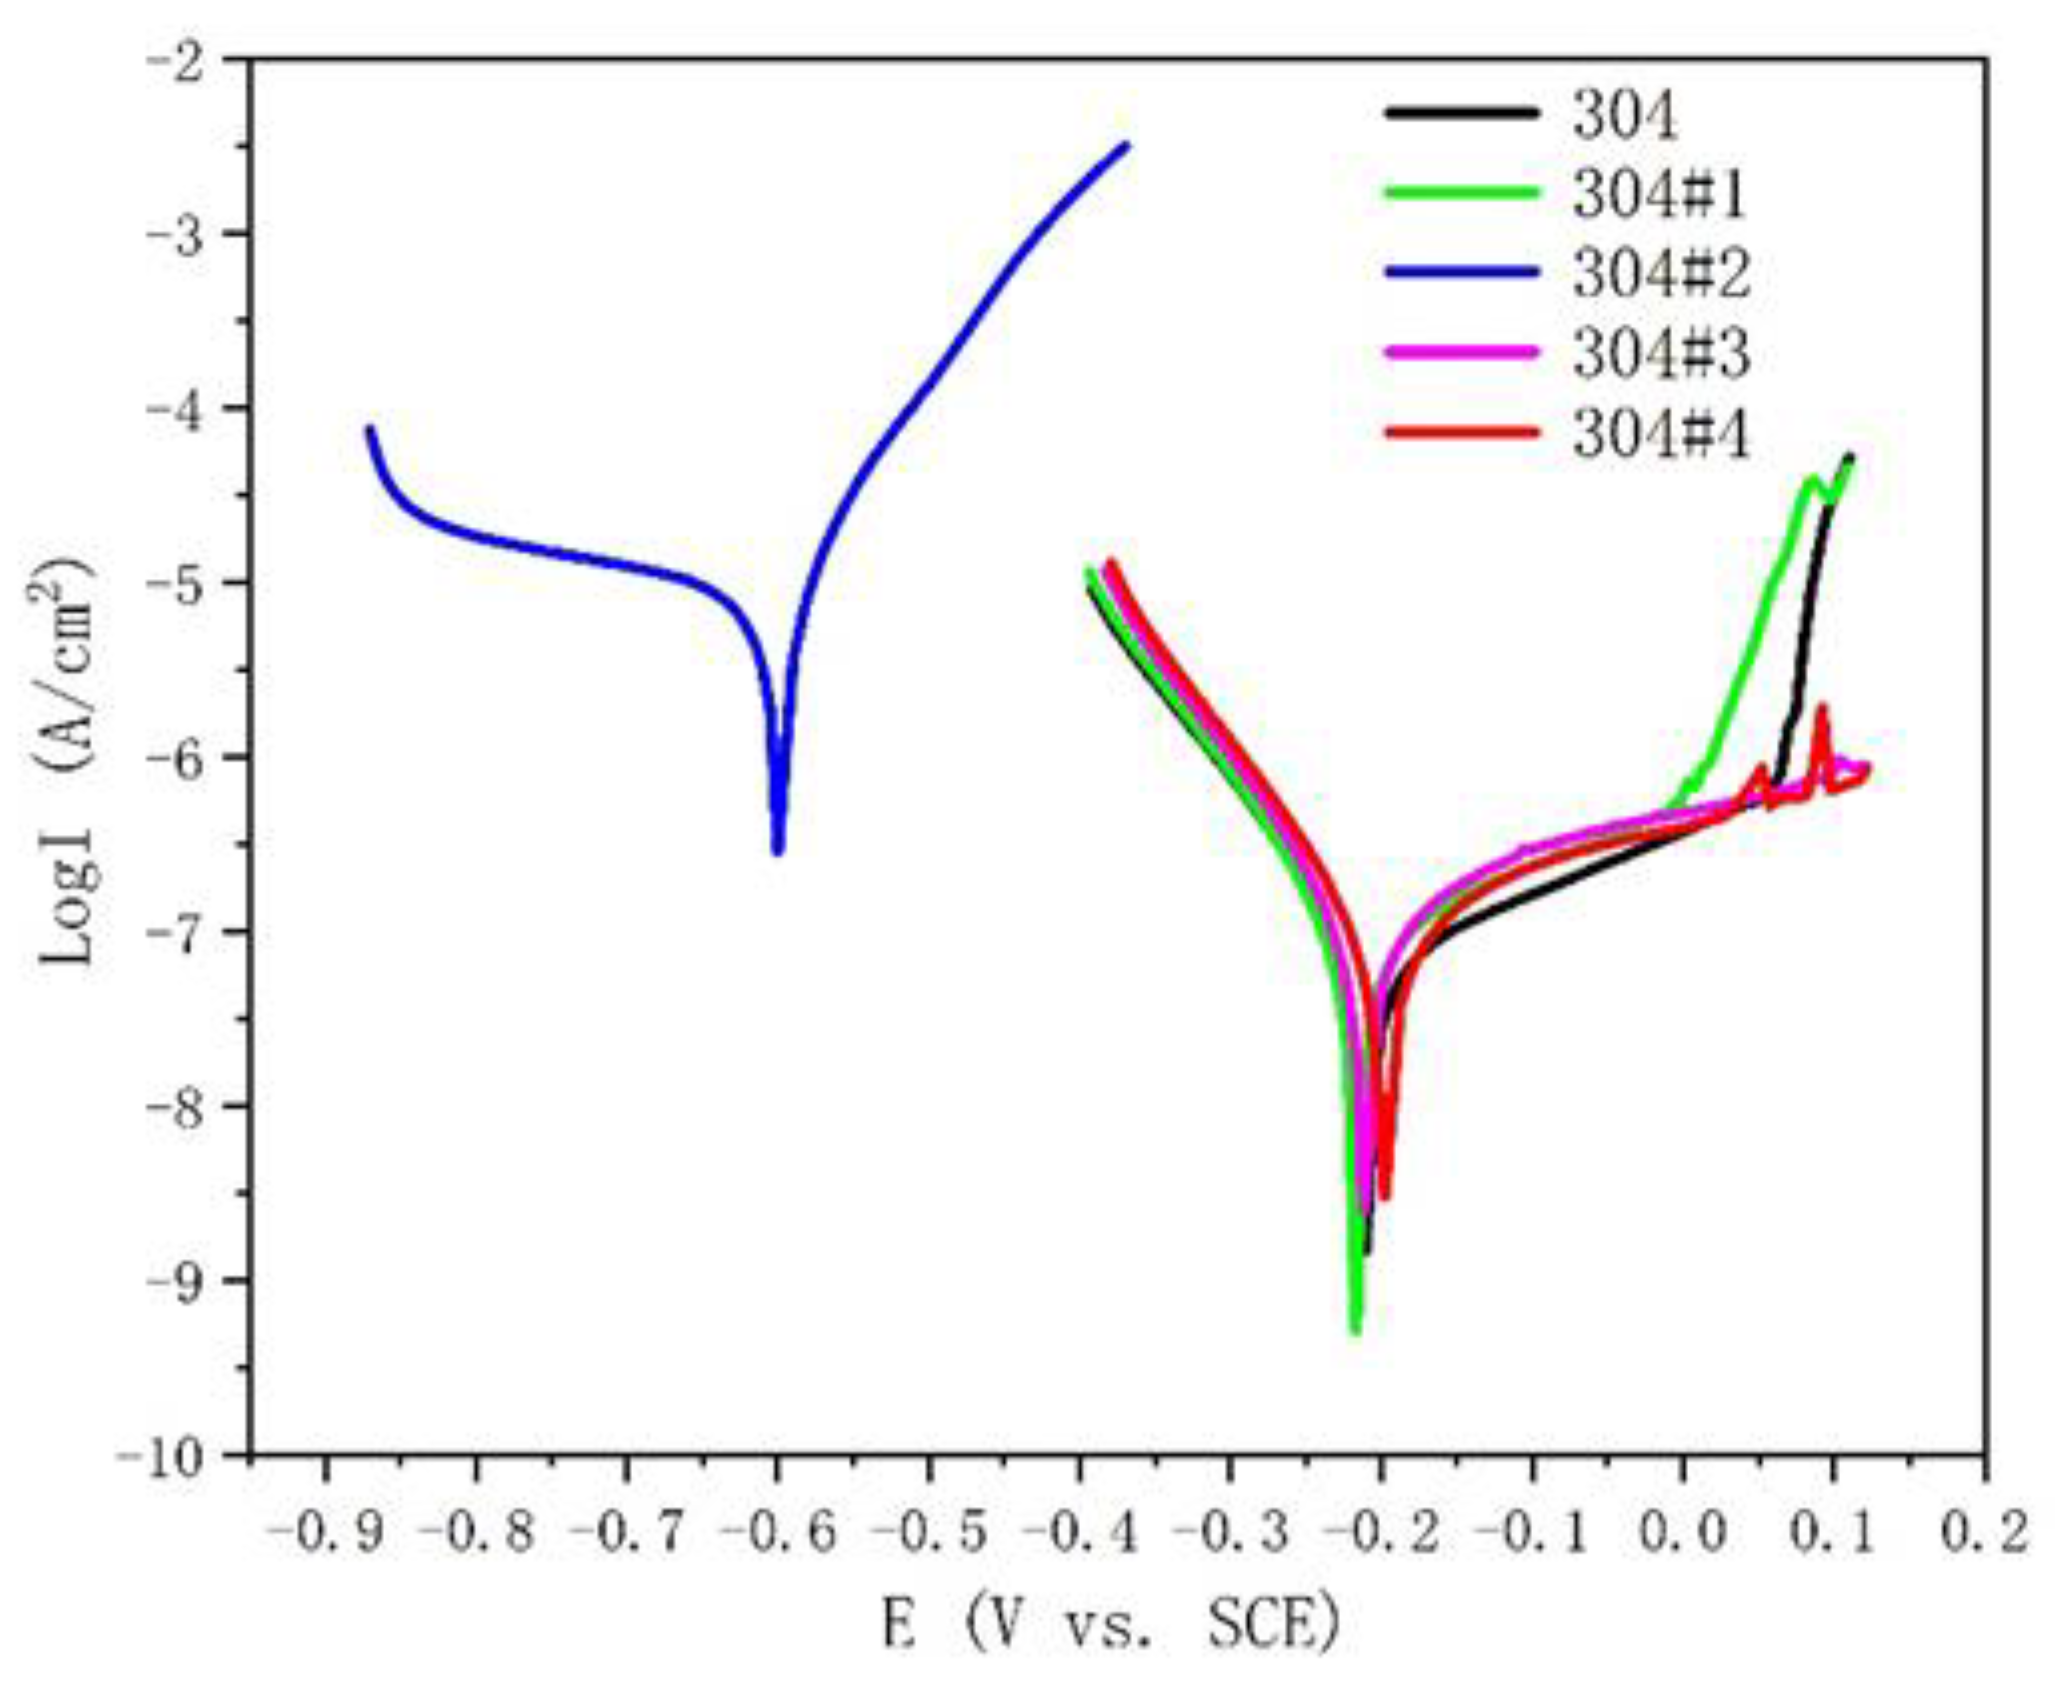
Figure 10.
EIS measurement results for the four clad plates. (a) Nyquist graph; (b)(d) Bode graph. (c) Equivalent circuit graph.
Figure 10.
EIS measurement results for the four clad plates. (a) Nyquist graph; (b)(d) Bode graph. (c) Equivalent circuit graph.
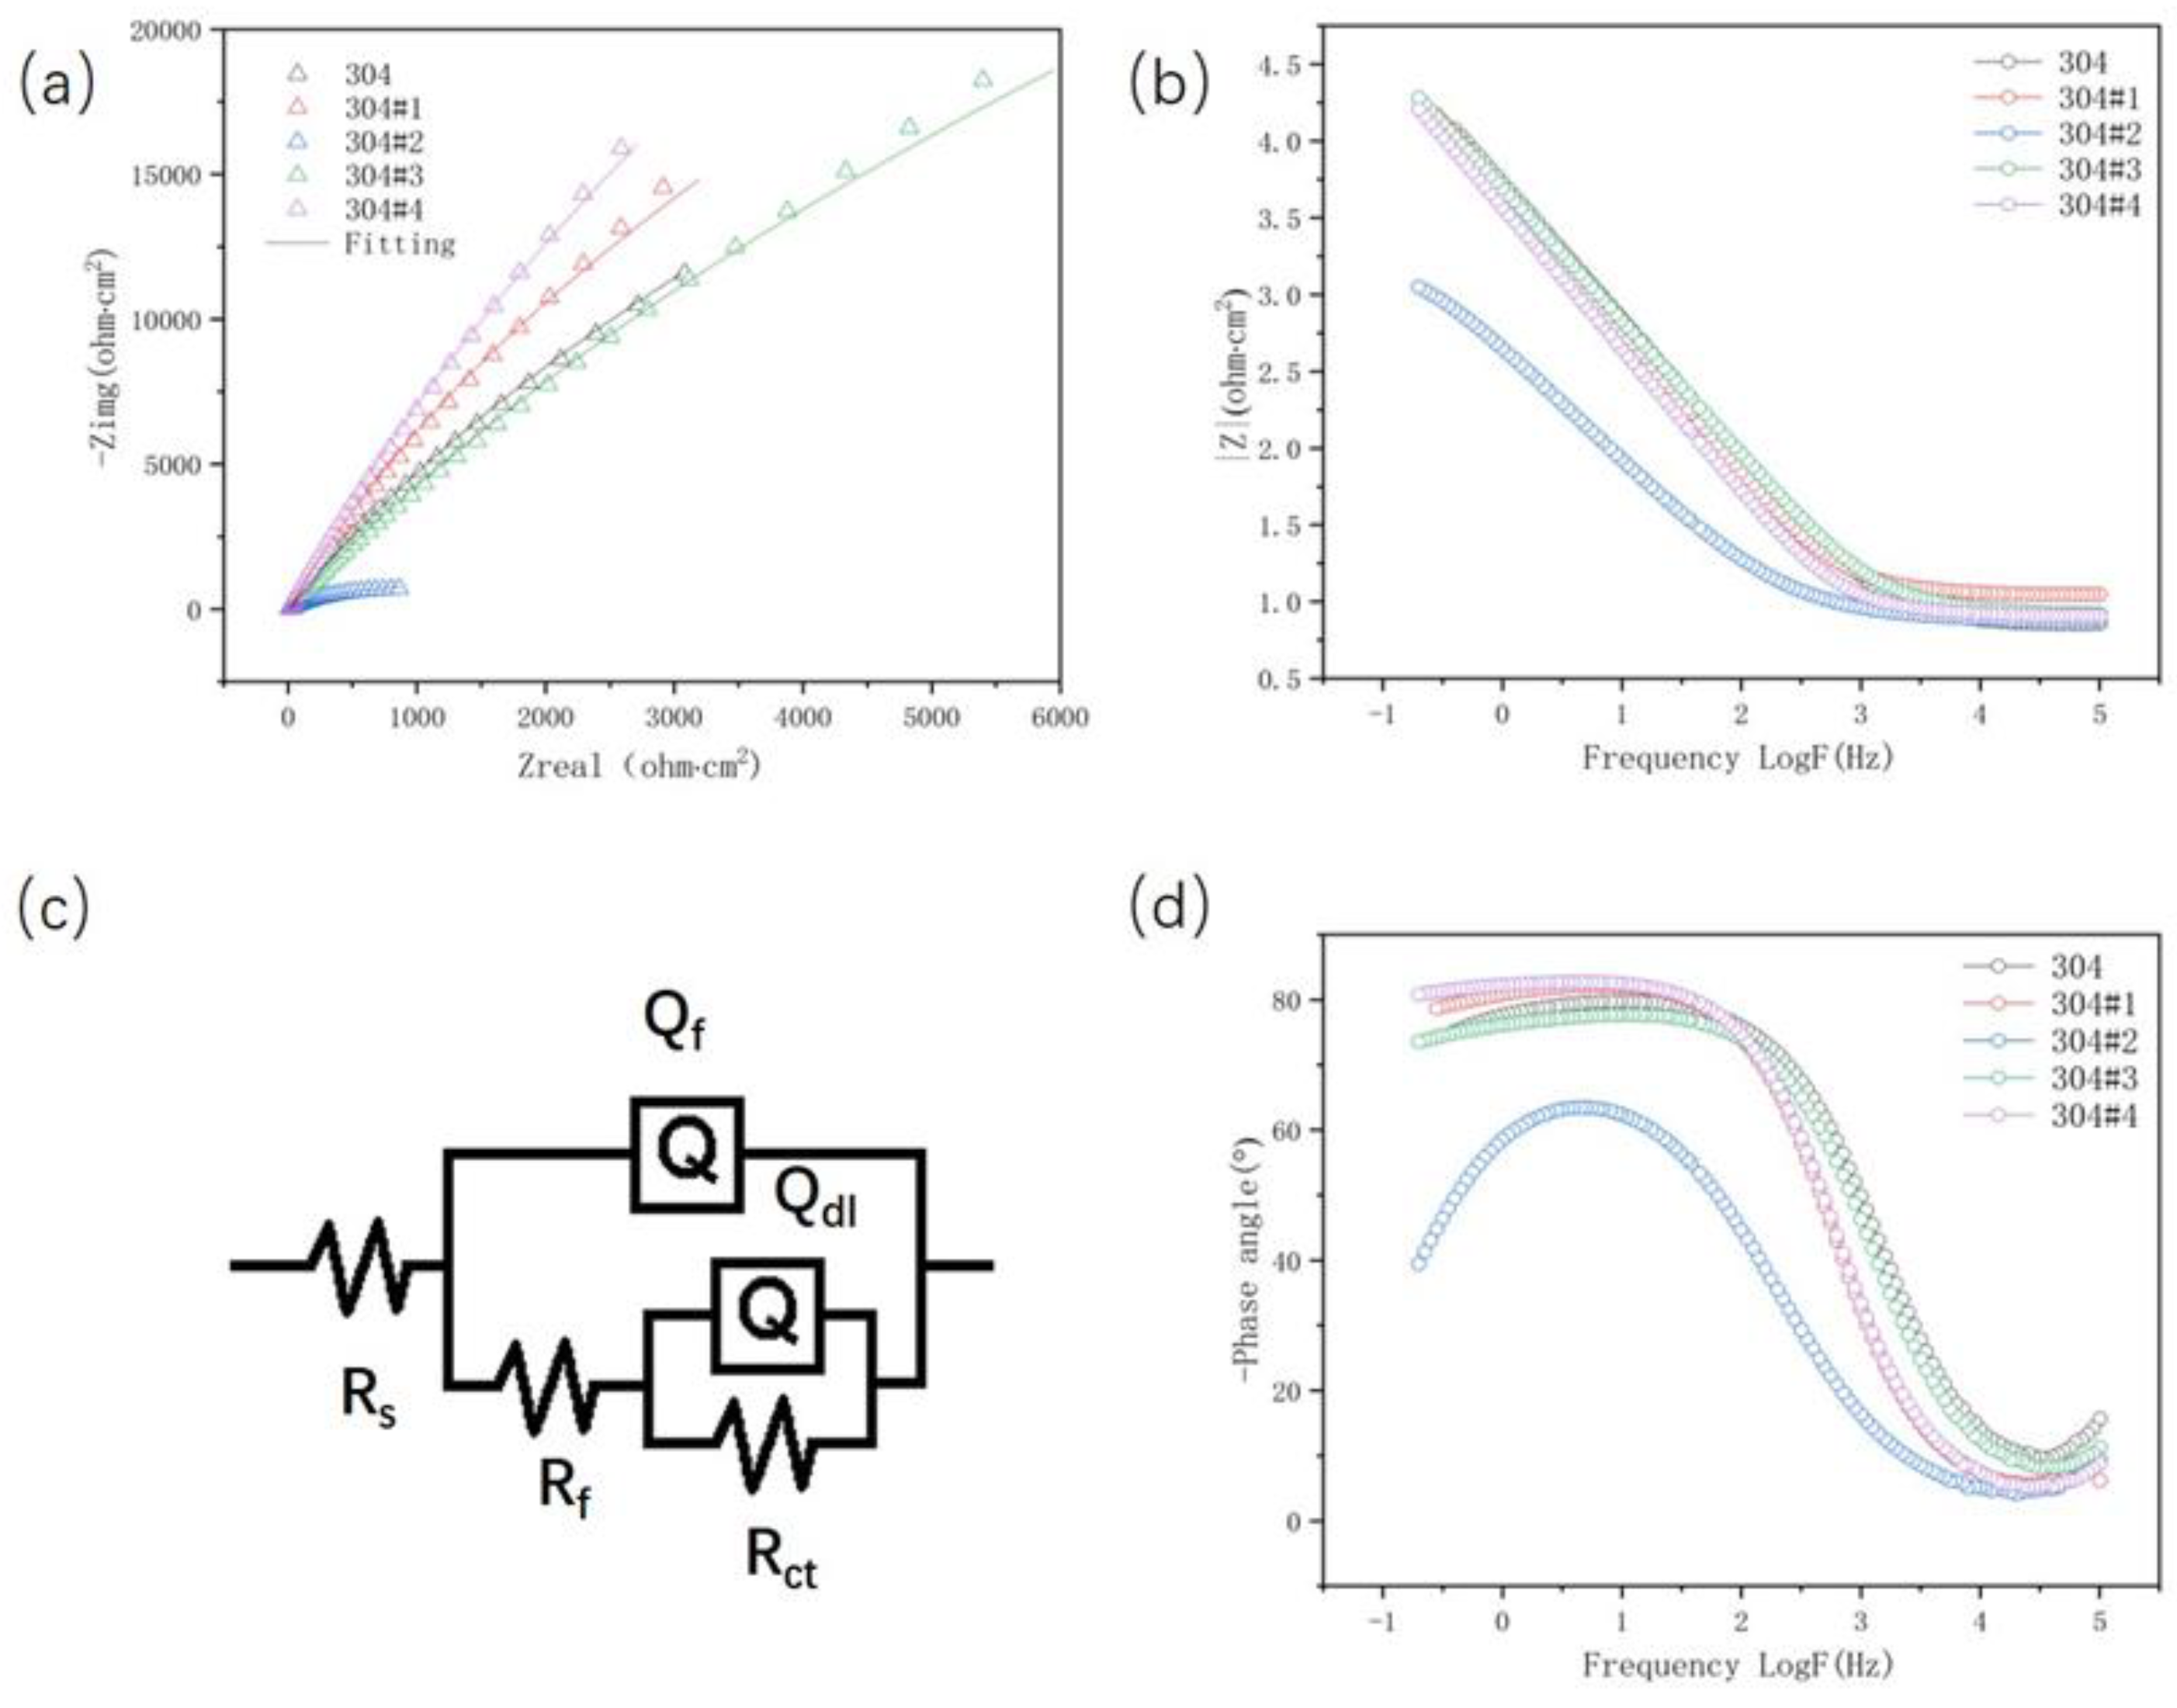

Table 1.
The chemical compositions of CS and SS (wt.%).
| 0.810 | C | Si | S | P | Mn | Cr | Ni | Fe |
|---|---|---|---|---|---|---|---|---|
| 304 SS CS |
0.070 0.071 |
0.750 0.237 |
0.026 0.032 |
0.036 0.038 |
2.000 0.810 |
19.000 - |
10.000 - |
Bal. Bal. |
Table 2.
The calculated results of corrosion current density and the corrosion potential of clad plates.
Table 2.
The calculated results of corrosion current density and the corrosion potential of clad plates.
| Samples | Ecorr(mV) | Icorr(A/cm2) |
|---|---|---|
| 304 | -210.3 | 6.51e-8 |
| 304#1 | -216.9 | 9.67e-8 |
| 304#2 | -600 | 8.94e-6 |
| 304#3 | -197.8 | 1.26e-7 |
| 304#4 | -211.4 | 1.94e-7 |
Table 3.
The results obtained from fitting the EIS curves of the clad plates.
| Rs (Ωcm2) |
Qf (Ω-1sncm-2) |
nf |
Rf (Ωcm-2) |
Qdl (Ω-1sncm-2) |
ndl |
Rct (Ωcm-2) |
|
|---|---|---|---|---|---|---|---|
| 304 | 7.186 | 3.633E-005 | 0.8888 | 1.419E005 | 1.134E-005 | 0.1226 | 380.9 |
| 304#1 | 11.34 | 3.831E-005 | 0.9211 | 1.714E005 | 0.00126 | 0.1011 | 1.092E005 |
| 304#2 | 7.637 | 0.0005262 | 0.7542 | 1306 | 9.989E-006 | 0.464 | 1126 |
| 304#3 | 8.462 | 4.093E-005 | 0.8691 | 1.819E005 | 0.0001234 | 0.1368 | 4371 |
| 304#4 | 8.269 | 4.959E-005 | 0.9241 | 3.373E005 | 5.751E-006 | 0.1393 | 13.37 |
Disclaimer/Publisher’s Note: The statements, opinions and data contained in all publications are solely those of the individual author(s) and contributor(s) and not of MDPI and/or the editor(s). MDPI and/or the editor(s) disclaim responsibility for any injury to people or property resulting from any ideas, methods, instructions or products referred to in the content. |
© 2024 by the authors. Licensee MDPI, Basel, Switzerland. This article is an open access article distributed under the terms and conditions of the Creative Commons Attribution (CC BY) license (http://creativecommons.org/licenses/by/4.0/).
Copyright: This open access article is published under a Creative Commons CC BY 4.0 license, which permit the free download, distribution, and reuse, provided that the author and preprint are cited in any reuse.


