
Submitted:
28 November 2024
Posted:
28 November 2024
You are already at the latest version
Abstract
The purpose of this work was to determine the thermodynamic properties of coconut powder fortified with physiologically active components, obtained through spray drying (CP+FAC), using the data obtained to construct the sorption isotherms at three temperatures (15, 25, and 35 °C), where the properties calculated were net integral isosteric sorption heat (Qst), differential sorption entropy (ΔS), spreading pressure (Φ), enthalpy (qeq), and entropy (ΔSeq); while determining the glass transition temperature (Tg) and critical storage conditions, like water activity (awc), and moisture content (Xwc) in the CP+FAC. Where Qst increased to a maximum value between the Xw intervals of the monolayer and then diminished with increased moisture content (Xw). The Φ increased with the aw increase and diminished with increased temperature, more notably at 25 and 35 °C. The ΔS diminished with the increase of Xw, which represents an increase in the mobility restriction of the water molecules as the available sites saturate and higher-energy sites are used, which is why water is less available to participate in the deterioration reactions. The qeq diminished with Xw, reaching the maximum value at the lowest Xw, this value is an indication of the greater water-CP+FAC interaction, which means the sorption binding sites are stronger. The ΔSeq went from negative value and increased with the Xw increase, which is associated with greater mobility of the water molecules, favoring the formation of multilayers. The glass transition temperature of the CP+FAC at different aw had an inverse relation, where Tg diminished when increasing aw, going to aw: 0.112: Tg: 69.79 °C at aw values of 0.900: Tg: -39.0 °C, evidencing the plasticizer effect of water, where the Gordon-Taylor model is a reliable predictor of the glass transition temperatures of the CP+FAC. Values of the parameters calculated through non-linear regression were Tgs= 391.67 K and k= 0.753, with R2= 0.977. The critical storage conditions of the CP+FAC, at ambient temperature of 35 °C, were awc of 0.46 and Xwc of 3.8 % (db).
Keywords:
Thermodynamic sorption properties
; differential scanning calorimetry
; Glass transition temperature
; activity and water critical content
; stability
1. Introduction
The study of water-solid interactions in low-moisture food systems provides useful information that integrates the composition and structural characteristics with the physical stability and functional properties of food materials. Besides, the thermodynamic analysis of water sorption in dry foods at different temperatures has stirred interest because it provides a complete interpretation of the sorption mechanism based on the energy changes in the bonds between the adsorbate and adsorbent in dry foods, like coconut (Cocos Nucifera L.) powder fortified with physiologically active components (CP+FAC) [1,2].
Linked to the phenomena of moisture sorption, the analysis of glass transition temperature (Tg) permits better understanding of the quality, stability, and safety properties of food systems in function of the relation between the water content and the matrix structure, thus, providing an integrated approach of the role of water in foods. Glass transition, understood as the change from a highly viscous amorphous glass state to a liquid or gummy state, can be reached through increased temperature with constant moisture content, or through increased water content at constant temperature. Glass transition can be classified approximately as a second order phase change accompanied by thermodynamic changes in the enthalpy, changes in the dielectric properties and mechanical changes, like increased free volume, diminished viscosity, increased thermal expansion, and exponential increase of the molecular mobility. Foods in amorphous vitreous state exist in a metastable condition and remain stable for long periods (months to years); however, once they pass to the gummy state, all the rates of processes of quality loss dependent on time increase and the shelf life diminishes to weeks, days or even hours. Identifying the temperatures and critical moisture contents, at which the amorphous solids experience evident rheological changes, contributes to the correct definition of the most-adequate storage conditions where time-dependent changes, deterioration reactions, and structural transformations, like adherence, collapse, stickiness, caking and crystallization of solutes from powdered foods would be limited and/or prevented [1,2,3,4,5,6,7,8].
As temperature increases above Tg, various changes are noted, like increased free volume, diminished viscosity, and increased thermal expansion. The most important changes that affect food behavior are related with the exponential increase of molecular mobility and diminished viscosity [5,6]. Because low glass transition temperature is a result of the presence of low molecular weight substances such as reducing sugars or acids (for example citric, fumaric or malic acids) powdered fruits are very vulnerable to deterioration changes during processing and storage. The widely applied approach allows obtaining powders with higher Tg values is addition of high molecular weight polymers like starches, arabic gum or maltodextrin and the influence of moisture on Tg may be examined easily via thermal analyses through differential scanning calorimetry (DSC) in samples that have been balanced for different water activities (aw), and thereby, for different moisture contents [7,8].
Another consistent criterion to predict the storage stability and shelf life of dehydrated products is based on determining the thermodynamic properties of water vapor sorption in function of temperature (isosteric sorption heat, differential entropy, integral entropy, integral enthalpy, and spreading pressure); for which, sorption isotherms, which describe the relation between aw and the equilibrium moisture content of a food at constant temperature are fundamental to comprehend the adsorbate and adsorbent relations, guarantee that water is not available, and limit the chemical reactions and deterioration of physical-chemical and microbiological characteristics of powdered foods. [1,3,6,9].
The thermodynamic properties of foods relate the water concentration in foods with its partial pressure, which is crucial in the analysis of heat and mass transport phenomena during dehydration, and permit determining the final point at which food should dehydrate to achieve a stable product with optimal moisture content, and the minimum amount of energy required to eliminate a given amount water from the food, providing information on the microstructure associated with the water-food interface [6,10,11,12,13,14].
Differential sorption heat, sometimes called isosteric sorption heat (Qst), is used as an indicator of the state of the water adsorbed by the solid particles, which is a measure of the physical, chemical, and microbial stability of the biological materials stored. Knowing the differential sorption heat is of great importance when designing equipment for dehydration processes. This is because the vaporization heat of the water sipped can increase to values above the vaporization heat of pure water as the foods dehydrate to low moisture levels [2,10,12].
The net isosteric heat (qst) is defined as the total sorption heat in foods less the vaporization heat of water, at the system’s temperature. Adsorption heat is a measure of the energy released in the sorption, and desorption heat requires energy to break the intermolecular forces between the water vapor molecules and the surface of the adsorbent. Thereby, sorption heat is considered indicative of the intermolecular attraction forces between the sorption sites and water vapor [4,10,12,13,14,15].
The differential entropy (ΔS) of a material is proportional to the number of sorption sites available at a specific energy level, associated with the molecular ordering system, if ΔS <0, it describes a structured system [2,10,12,13,14,15].
Two other parameters used to explain the modes of moisture adsorption by foods are integral entropy (ΔSeq) and integral enthalpy (qeq). Integral entropy describes the degree of disorder and randomness of the water molecule movement and has been used to explain modes of moisture sorption by biological materials. The net integral enthalpy, or net equilibrium sorption heat, is an integral molar amount and is calculated in similar manner as the differential sorption heat (isosteric sorption heat), but at constant spreading pressure instead of constant moisture content [1,4,10,12].
Spreading pressure (Φ) and its dependence on aw and water temperature is a useful tool to interpret kinetic sorption data, with the driving force responsible for diffusion in porous solids and/or as the adsorption free surface energy, possibly considered as the difference in surface tension between the sorption sites discovered in the solid and sites with adsorbed molecules [10,12].
Food safety and spoilage are the principal concerns of food manufacturers and consumers. The preservation achieved by dehydrating powdered foods requires information on the thermodynamic properties related with water activity and vitrification phenomena. Efforts have been limited on establishing a link between aw and Tg for specific food products, as in CP+FAC. This work sought to calculate and evaluate the thermodynamic properties of water adsorption and determine the glass transition temperature of CP+FAC at different concentrations of solids, as well as the critical storage conditions.
2. Materials and Methods
To obtain the CP+FAC and the construction of the moisture sorption isotherms, the study followed the methodologies reported by Lucas et al., 2018a; 2018b and 2021 [16,17,18] respectively.
To fit the moisture sorption isotherms in the CP+FAC, nine mathematical models were used according to the equations by GAB [19], BET [20], Oswin [21], Smith [22], Halsey [23], Henderson [24], Chung and Pfost [25], Peleg [26] and Caurie [27] (Table 1) and the goodness of fit of the models was determined by using the mean square error (ERSM) and the maximum adjusted R2.
2.1. Determination of the Thermodynamic Properties
From the data obtained in determining the moisture sorption isotherms of CP+FAC, these were calculated with the following methodologies:
2.1.1. Isosteric Sorption Heat (kJ ⋅ mol-1)
The net isosteric heat (qst) and isosteric sorption heat (Qst), on the base of thermodynamic principles, were determined from equations 1 and 2:
where λvap: latent vaporization heat of pure water (kJ ⋅ mol-1); T (K): absolute temperature; Xeq: equilibrium moisture content (Kg ⋅ Kg-1 db), and R: (kJ ⋅ mol-1 ⋅ K-1) ideal gas constant.
This was calculated from the equation by Clausius-Clapeyron applied to the system and the pure water with the following assumptions: (1) the vaporization heat of pure water and excess sorption heat do not change with temperature and (2) the system’s moisture content remains constant. When again plotting the sorption isotherm in the form ln (aw) versus 1/T, for a specific moisture content, the slope of the regression line provides a measure of the net isosteric sorption heat, qst, obtaining the sorption heat, Qst, by applying Eq. 2. This procedure assumes that qst is invariant with temperature, and application of the method requires measuring sorption isotherms at more than two temperatures [1,2,10,14,28,29,30].
2.1.2. Spreading Pressure (Φ) (J ⋅ m-2)
This is also known as surface potential, represents the free surface energy for sorption and may be considered as the difference in surface tension between the active adsorption sites in the solid and water molecules. The value Φ is not determined experimentally, but can be obtained through an analytical procedure related with Eq. 3 [10,12,29].
where θ = EMC/xo (xo: moisture in the monolayer).
Applying the Dent model [31], where it is expressed by integrating the spreading pressure of water adsorbed in terms of surface area per sorption site, or area per water molecule in each sorption site, that is, coverage of the complete monolayer as:
where: KB: Boltzmann’s constant (1.380 x 10⁻²³ J ⋅ K-1); Am: area of water molecule: (1.06 x 10⁻¹⁹ m2); b and b0 are the constants of Dent’s sorption isotherm related with the properties of the water adsorbed (dimensionless), determined through non-linear regression analysis using the moisture content of the monolayer obtained by applying the BET equation to the experimental data of equilibrium moisture.
2.1.3. Differential Entropy (ΔS) (J ⋅ mol-1 ⋅ K-1)
The differential adsorption entropy was calculated by fitting Eq. 5 to the equilibrium data [10,28,29].
When tracing ln (aw) versus 1/T for constant water content, the value of ∆S is calculated from the intersection (∆S/R).
2.1.4. Net Integral Sorption Enthalpy (qeq) (J ⋅ mol-1 ⋅ K-1)
The net integral enthalpy is considered the difference in surface tension between the bare sorption sites in the solid and sites with adsorbed molecules; it is an integral molar amount and is calculated similarly to the isosteric sorption heat, but at constant spreading pressure, where the variation in net integral enthalpy with moisture content indicates the level at which the water/substrate interaction is greater than the interaction of the water molecules (Eq. 6) [10,12,29].
2.1.5. Net Integral Sorption Entropy (ΔSeq) (J ⋅ mol-1 ⋅ K-1)
Integral enthalpy is needed to determine the integral entropy associated with the sorption process. Net integral entropy describes the degree of disorder and randomness of the water molecule movement. It also quantifies the mobility of the water molecules adsorbed during sorption. The ΔSeq of a system may be calculated with Eq. 7, considering that the geometric mean of activity (aw*) is used, obtained at constant spreading pressure at various temperatures [10,12,28,29]:
2.2. Glass Transition Temperature (Tg) in the CP+FAC
A thermal analysis was performed of the CP+FAC by using differential scanning calorimetry (DSC) (T.A. Instrument, Q2000, USA) equipped with a cooling unit up to -90 ºC (T.A. Instrument, refrigerated Cooling System 90). Samples of CP+FAC (5-10 mg) obtained from the balanced isotherms of 15 ºC and different aw were analyzed according with the methodology proposed by Grabowski et al., 2006 [32] (modified), using a cooling ramp of 10 ºC/min until reaching -90 °C, 1-min holding time at -90 ºC and a heating ramp of 10 °C/min until 250 °C. The thermograms obtained were examined by using the Universal Analysis 2000 Program (T.A. Instrument, USA), with prior calibration of la temperature and fusion heat with indium [1,5,6,33].
2.3. Plasticizer Behavior of Water
To evaluate and predict the plasticizer effect of water and its influence on the glass transition temperature (Tg), model the linearized Gordon-Taylor model was used (Eq. 8) [1,2,5,6,7,8,33,34]:
where Tgw is the water glass transition temperature: -135.15 °C (138.15 K), Tgs is the glass transition temperature of the anhydrous solids, xw is the mass fraction of water, and k is the constant of the Gordon-Taylor model.
2.4. Particle Size Distribution
Particle sizes were determined as percentiles D10, D50, and D90, using a Mastersizer 3000 (Malvern Instrument Ltd., Worcestershire, UK), with prior dispersion of the samples in 500 mL of distilled water until obtaining a darkening value of 10±1 %, considering the size distribution from Mie theory and using the refraction index of 1.52 [35].
2.5. Particle Morphology
This was carried out through SEM analysis in the CP+FAC. Micrographs were taken of the CP+FAC by using scanning electron microscopy (Jeol 5910LV) at 15 Kv, where the samples were deposited on a copper conductive tape and on a sample holder, then coated with gold in a vacuum evaporator (Denton Vacuum, 30 mA, 5 kV, 100 militorr) [33,36].
Particle size distribution and morphology of the CP+FAC was carried out before and after storing the powder at 35 °C, in N2 atmosphere (35 °C-N2), packaged in multilayered bags (Alico S.A.), with laminated film thickness (PET): 12 μm, aluminum foil: 8 μm and polyethylene sealing layer: 100 μm, grammage of 136.54 g ⋅ m-2, with water vapor barrier <5 cm3 ⋅ m-2 ⋅ 24 h ⋅ atm) and O2 barrier <5 cm3 ⋅ m-2 ⋅ 24 h ⋅ atm).
3. Results and Discussion
3.1. Water Sorption Isotherms of the CP+FAC
The water adsorption isotherms of the CP+FAC at the three temperatures evaluated had typical type II behavior, according with the BET classification [37], with sigmoidal shape, as presented in Figure 1, which are characteristics of amorphous materials rich in hydrophilic components. Sigmoid isotherms may be divided generally into three regions; region I corresponds to aw <0.22, which refers to water adsorption in the monolayer (mo), region II represents aw between 0.22 and 0.73, corresponding to the water adsorption multilayers additional to the mo, and in region III, aw is between 0.73 and 1.0, corresponding to water condensation in the pores of the material followed by the material’s solubility [11,18,19,38].
According to Lucas et al., 2021 [18], the mathematical models that best fit the behavior of the data of the moisture adsorption isotherms in the CP+FAC, were the Peleg [26], GAB [19], and BET [20] models (Table 2 and Figure 1), presenting the lowest ERSM values and highest R2 values, for all temperatures.
Figure 1 shows the experimental moisture sorption isotherms for the CP+FAC and those represented by the Peleg model, fitting adequately to the experimental results. The Xw of the monolayer (mo) shows the amount of water adsorbed strongly on the food surface and is considered the optimal value to ensure the product’s stability; for the CP+FAC, it was observed that in the GAB [19] and BET [20] models, the moisture of the mo diminished when temperature increased, showing values between 7.15 % – 3.64 % at 15 and 25 °C for GAB and from 2.54 % – 2.34 % at the same temperatures for BET. This behavior indicates that the molecules absorbed gained kinetic energy causing the attractive forces to be loosened and this permitted some water molecules to separate from their sorption sites, thus, diminishing the equilibrium humidity values. Additionally, moisture of the mo in the BET model was lower than that of the GAB model, while the energy constant C in the BET model was higher than that of the GAB model. This behavior has been observed by various authors [Table 2]. Presumably, the strong adsorbent-adsorbate interactions, which are exothermic, are favored with lower temperature, causing increased parameter C with decreasing temperatures [15,34].
3.2. Thermodynamic Properties of the CP+FAC
3.2.1. Isosteric Sorption Heat (Qst)
This is used to study the magnitude of binding energy, or the availability of polar sites to the water vapor and of the physical-chemical and microbiological state of the food, as sorption advances. Isosteric adsorption heat increased to a maximum value, within the moisture content interval of the monolayer (mo) (0.48 % – 2.87 % (db)) found in the GAB and BET models of Xw, whose values ranged between 35.718 and 99.261 kJ ⋅ mol-1 and then diminished with increased moisture content. The maximum value indicates the coverage of the strongest binding sites and the highest water-solid interaction (adsorbate-adsorbent) and water is closely bonded to the material, which corresponds to high interaction energy. Upon continuing the coating of les favorable sites and the formation of multiple layers, as shown by diminished Qst, with increased moisture content, this confirms the fact that higher moisture levels diminish the binding force to water [Figure 2]. The high Qst values at low moisture contents indicate high water binding energy, which is characteristic of monolayer sorption, this is explained by the fact that most sites with high water binding energies were already occupied but sorption continued on sites with lower water binding energies. The same behavior was observed in sugar cane powder [15]; chia seeds [4]; cassava flour [12]; dried and pulverised edible house cricket and black soldier fly larvae [30].
The high values at low moisture contents can be explained by strong hydrogen bonding of water molecules to the food constituting a monolayer of molecules. Therefore, the amount of energy required to remove these water molecules is high. The decreasing trend of Qst suggested that the heat of sorption approaches the heat of vaporization of pure water at higher moisture contents. As the moisture content decreases and only the monolayer moisture is left, the water molecules become more strongly bound to the surface of the powders and to the sorption sites with higher interaction energies. At the same time, the heat of sorption increases above the heat of vaporization of pure water, making it difficult to remove water from the surface of the powders [39].
3.2.2. Spreading Pressure (Φ) (J ⋅ m-2)
The value of Φ represents excess free energy on the surface, which indicates increased surface tension in the sorption sites, caused by molecules adsorbed. Figure 3 shows the behavior of Φ, whose values increase with increased aw, and diminish with increased temperature, most notably at 25 and 35 °C [29,40].
3.2.3. Differential Sorption Entropy (ΔS) (J ⋅ mol-1 ⋅ K-1)
Figure 4 shows the ΔS in function of moisture content at 15, 25 and 35 °C, where CP+FAC diminished as it gained moisture until reaching a minimum value and then increased as the Xw continued increasing, although – in general – there were no significant differences due to the effect of temperature. Diminished ΔS represents an increase in the mobility restriction of the water molecules as the available sites saturate and sites of greater energy are used; the subsequent increase implies that the water molecules can form multilayers. The ΔS is considered that of maximum stability because it is where the water molecules achieve a neater disposition within the solid and strong bonds are produced between the adsorbate and adsorbent, which is why water is less available to participate in deterioration reactions. With very high moisture contents, entropy will be approximately the same as in the liquid water because interactions between water and CP+FAC will be null [1,4,15].
Conditions for the maximum stability of CP+FAC were 2.87 kg H2O per 100 kg s.s. (aw= 0.29) at 15 °C; 2.44 kg H2O per 100 kg s.s. (aw= 0.33) at 25 °C; and 2.14 kg H2O per 100 kg s.s. (aw= 0.37) at 35 °C [Figure 4]. In addition, integral entropy may be directly related with the disorder of the order of the water molecules sorbed in foods and, hence, it is a useful function to study the effect of the drying method on the product’s stability. The same behavior was reported by Velázquez-Gutiérrez et al., 2015 [4], with chia mucilage, Alpizar-Reyes et al., 2017 [1], with tamarind seed mucilage, and Ayala-Aponte et al., 2016 [12] with cassava flour.
Although no differences were noted in ΔS due to the effect of temperature, normally, at higher temperatures the change of ΔS is greater because the kinetic energy of the molecules that interact during the water exchange process is directly proportional to temperature. Thereby, the system’s ΔS is lesser at low temperatures due to the diminished number of sorption sites and the restricted movement of the water molecules, which makes the adsorption process more favorable thermodynamically at lower temperatures. High ∆S values at low moisture contents are explained by the fact that water was strongly bound, but lower ΔS values may be interpreted as the water activity at which this product is more stable [4,12,15]. When the ΔS has negative magnitude with low moisture contents, it is attributed to the existence of chemical adsorption and/or structural modifications of the adsorbent [29,37].
3.2.4. Net Integral Sorption Enthalpy (qeq) (J ⋅ mol-1)
Changes in net integral enthalpy (Qin) with the equilibrium moisture content are shown in Figure 5. This integral was determined the same way as the differential sorption enthalpy, but at constant spreading pressure. The value of qeq diminishes with increased Xw, varying on average for the three temperatures from 0.529 kJ ⋅ mol-1 for an Xw of 0.004 g of water / g s.s. at -0.1106 kJ ⋅ mol-1 for 0.238 g of water / g s.s. This thermodynamic behavior may be attributed to saturation of the active sorption points (moisture monolayer), given that water is adsorbed more easily in the active sites of the outer surface of the CP+FAC at low moisture contents, reaching the maximum value of qeq. This maximum value indicates the greater water-CP+FAC interaction, which means that the sorption binding sites are stronger. Increased equilibrium moisture evidences diminished net integral enthalpy, which is attributed to lesser favorability of the active sorption sites by being covered with water, forming multilayers. According to these results, variation in net integral enthalpy with Xw indicates that the level of solid-water interaction is higher than the interaction among water molecules, where the magnitude of enthalpy with high moisture content reflects the presence of free water. Determination of integral enthalpy is useful to quantify the energy required for drying, from the food’s initial moisture content to its final moisture content. It also provides information on the microstructure of foods and the theoretical interpretation of physical phenomena that take place in the water-food interface.
3.2.5. Net Integral Sorption Entropy (ΔSeq) (J ⋅ mol-1 ⋅ K-1)
Figure 6 shows the ΔSeq in function of moisture content (Xw), finding that all values were negative, which could indicate existence of chemical adsorption or structural modification of the adsorbent or of the solid’s outer surface, where ΔSeq increased with the increase in equilibrium moisture content, varying from a minimum value of ‒19.47 J ⋅ mol-1 ⋅ K-1 for an Xw value of 0.005 g water / g s.s. at ‒0.471 J ⋅ mol-1 ⋅ K-1 for 0.257 g of water / g s.s. This result may be associated to greater mobility of the water molecules, favoring formation of multilayers. Hence, ΔSeq tends to approach that of free liquid water. The minimum value of ΔSeq may be considered the maximum stability point of foods during storage. Given that water molecules are strongly bound with the adsorbent in this zone, they are more neatly organized and less available to participate in deterioration reactions. Thereby, this minimum value of ΔSeq is at an Xw close to the moisture of the monomolecular layer (mo) predicted with the BET and GAB models [Table 2] [12,13,29].
3.3. Glass Transition Temperature (Tg) and Its Relation with the Composition
Figure 7 shows the thermograms obtained through DSC for the CP+FAC stored at 35 °C and HR= 65 % in different aw. In the range from 0.112 – 0.90, similar behavior was observed at 15 and 25 °C (data not shown); additionally, Tg diminished when temperature was reduced. The temperature was taken from the midpoint of the change in heat capacity as the safest glass transition temperature (Tg), showing an inverse relation between Tg and aw, that is, when increasing aw, the Tg of the CP+FAC diminishes, this may be explained by the plasticizer effect of water because the addition of a plasticizer in the proximities of vitreous-amorphous powder reduces viscosity, increases molecular mobility, and increases the volume emptied by the “solid matter” provoking a volume available for its free movements (free volume) [1]. At the same time, it is noted that the thermograms obtained had a typical second-order transition, where the glass transition of amorphous materials produce a step change in the heat flow due to changes in heat capacity at phase transition temperature, which – as expected – the water plasticizer effect provokes significant decrease of Tg with increased Xw, where the water plasticizer effect may be based on weakening of hydrogen bonds and on dipole-dipole intra and inter macromolecular interactions due to shielding of these forces principally attractive by water molecules. This same behavior was found by other researchers who studied vitreous transitions and state diagrams for spray-dried tomato pulp [34]; with mango powder [44], with tamarind seed mucilage [1], with freeze-dried pumpkin [6] and of the freeze dried pumpkin powders produced with different maltodextrin addition, where it was observed that Tgs increases with increasing maltodextrin content in the sample, due to the addition of high molecular weight biopolymers, resulting in an improvement in its stability [8].
When increasing moisture content in the CP+FAC, it had great impact on fluidity, stickiness, surface adherence, and stability in storage due to its plasticizer effects and crystallization behavior.
Availability of free water in a food component is expressed as aw, responsible for the microbiological and biochemical reactions and, in turn, had great impact upon glass transition temperature (Tg), which varied for aw: 0.112: Tg: 69.79 °C, at values of aw: 0.900: Tg: -39.0 °C, demonstrating the plasticizer effect of water on the Tg, which was evident with great reduction caused by increased moisture content [Figure 7] [4,6,33].
As the amount of plasticizer increases, the vitreous-amorphous material undergoes a change from the vitreous state to gummy state. The effect of temperature on Tg is directly related with the capacity to adsorb moisture because when temperature increases, the attraction forces between molecules diminish due to increased kinetic energy of water molecules that leads to an increase in the distance among each other and it is well-known that as moisture content is increased, Tg is decreased due to the low Tg of water (−137 °C), which can be modelled by the Gordon-Taylor equation. Thus, the more effective measure of physical stability was the change in Tg as storage RH was increased, resulting in moisture content increase [1,7,8,45].
The Tg value obtained for the CP+FAC with aw: 0.112; with moisture content at 2.96 %, it was 69.79 °C, obtaining a high value due to the addition of maltodextrin as wall material whose Tg varies between 100 and 188 °C, depending on its dextrose-equivalent (DE) property, said high Tg value (69.79 °C) would not be achieved without using maltodextrin to obtain products with lower moisture and more stable [44].
The Tg of the CP+FAC was very close to that of products with starch, unlike other fruits, like raspberry (Tg: 12.2 °C) [38] and mango (Tg: 42.6 °C) [46], which have more monosaccharaides than polysaccharides, with low molecular weight. Generally, Tg is related with molecular weight (Mw). For example, the monosaccharide has a very low Tg, while the Tg of foods with high molecular weight that contain carbohydrates and proteins tends to be above 100 °C [6].
Experimental data of Tg in the CP+FAC, balanced at nine levels of aw, were fitted to the Gordon and Taylor model to predict the Tg of the binary solid mixture, where the predicted values and the fitted curve are shown in Figure 8; resulting in a reliable predictor model of the glass transition temperatures of the CP+FAC. The values of the parameters calculated through non-linear regression were: Tgs= 391.67 K and k= 0.753, with R2= 0.977, results somewhat different from those reported by other authors, although these differences can be related with the different compositions of the food matrices, conditions of the drying process, and type of wall material used and concentration used [4,6,7,8,33,34,44]; where the physical-chemical composition of the CP+FAC is fat: 30.54±0.90 %; Protein: 4.07±0.49 %; total dietary fiber: 23.87±1.61 % and 7 % maltodextrin.
The k parameter controls the degree of curvature of the dependence of Tg on water content (binary system) and may be related with the interaction force among the system’s components. If k= 1, the glass transition temperature is a straight line. If k >1, the nature of the graphic relation between the glass transition temperature and the content of solids is more concave and for k <1, the nature of the relation is convex [1,4,7,8,47].
3.4. Glass Transition Temperature (Tg) – Water Activity (aw) Relation and Content in Moisture (Xw – Water Activity (aw) in the CP+FAC
Prediction of food stability based solely on data from sorption isotherms is not sufficient, given that certain physical-chemical and structural processes and, like stickiness, crunchiness, collapse, amorphous to crystalline transformations, and non-enzymatic browning rates are not related with the moisture value of the monolayer (mo) and are best correlated with glass transition temperature (Tg) through plasticizing by water or temperature. Thus, using state diagrams that indicate the physical state of the material, combined with the sorption isotherms aids in the prediction of food stability regarding its physical characteristics. Several authors have coupled the data from sorption isotherms with those of Tg to obtain the critical conditions for food storage: Tonon et al., 2009 [48], with acai powder; Djendoubi-Mrad et al., 2013 [47], with osmodehydrated apples and pears; Velázquez-Gutiérrez et al., 2015 [4], with chia seed mucilage; Zotarelli et al., 2017 [44], with mango powder. The critical content of water / water activity is the value at which the Tg of the product is equal to room temperature. Above this temperature, vitreous and amorphous powders are susceptible to changes of spoilage, like collapse, stickiness, and caking, which result in quality loss.
Thereby, to calculate the critical storage conditions of the CP+FAC, the sorption isotherms and data of Tg in function of aw were plotted and the critical values of aw and Xw were obtained, considering a room temperature of 35 °C Figure 9; water content and Tg values were predicted by the BET - GAB and Gordon-Taylor models, respectively; observing that the CP+FAC had an awc of 0.46 and Xwc of 3.8 % (db), this means that when the CP+FAC is stored at 35 °C, the maximum relative humidity to which it can be exposed is 46 % and its moisture content would be 3.8 %. When stored at a higher relative humidity, the powder will undergo physical transformations, like collapse, stickiness, and caking; these values are similar to those reported by Tonon et al., 2009 [48], with acai powder, but values much higher than those reported by Djendoubi-Mrad et al., 2013 [47], with osmodehydrated apples and pears, Zotarelli et al., 2017 [44], with mango powder, Al-Ghamdia et al., 2020 [6], with freeze dried pumpkin, which may be related with higher sugar content and acid present in these fruits, compared with the CP+FAC.
3.5. Particle Size Distribution (D10, D50, and D90) in the CP+FAC
Distribution of the average particle size in the three percentiles at time 0 (before storage) was: D10: 1.70±0.05 µm; D50: 8.46±2.09 µm; D90: 78.18±24.30 µm [Figure 10a]; after storage, agglomeration was generally present, forming larger particles. This may be attributed to the formation of bridges between the smaller particles, yielding as a result an increase in average particle size in the three percentiles on day 180, thus: D10: 2.04±0.09 µm; D50: 38.52±3.67 µm; D90: 102.65±6.82 µm [Figure 10b] [44].
This behavior could be explained by the continuous increase observed in moisture gain during storage, possibly causing significant agglomeration of the CP+FAC, losing its free-flowing characteristics and presenting clumping; this same behavior was reported by Pua et al., (2008) [49], with spray-encapsulated jackfruit oil (Artocarpus heterophyllus) and Mosquera-Mosquera, (2010) [50], with borojó powder encapsulated with maltodextrin, indicating that strict control must be conducted of moisture content and storage at low temperatures, given that these are key factors to minimize agglomerate effects of powders; as a result of the humidification, sugars crystalize and form agglomerations due to the effect of stickiness. Collapse in pulverized products implies time-dependent structural changes, which suppose changes in mechanical properties related with caking or stickiness. In addition, the rate of caking is in function of temperature, relative humidity, and storage time.
3.6. CP+FAC Morphology
The microstructural analysis (SEM) of the CP+FAC particle morphology is a valid tool to determine and observe the agglomeration phenomenon or agglomeration on the powder surface during storage [51]. The microphotographs obtained at optimal drying conditions (day of storage 0) exhibited spherical shape and various sizes, which fluctuated between 20 and 65 µm, with smooth and rough surfaces, some with collapsed walls and of agglomerate structure due to electrostatic effects and to the van der Waals forces, characteristic of spray-dried powders, like CP+FAC [44,52,53,54] [Figure 7 and Figure 11a]. Spray drying generally shrinks the powder particles due to water vaporization while freeze drying produces no shrinkage as water is frozen quickly in place followed by water sublimation, thus retaining the same shape and volume of particles [55]. Furthermore, the surface structure and the fibrous material without fracturing or low-porosity matrix represents an indication of the effective role of maltodextrin as encapsulating agent providing coverage over the nucleus that, likewise, acts as thermal defense against oxidation and any unwanted physical and chemical change [44,56,57].
After 180 days of storage at 35 ºC-N2 [Figure 7 and Figure 11b], it was found that the CP+FAC samples collapsed structurally because of the agglomeration phenomenon likely due to water adsorption on the particle surface, which could be the early stage of the caking phenomenon already described. Obviously, water absorption, together with Tg, plays a major role in the process of plasticization which causes the agglomeration of the sample. Water absorption leads to a decrease in the Tg of the sample [56,57,58].
4. Conclusions
This study determined the thermodynamic properties associated with moisture adsorption in the CP+FAC, where isosteric sorption heat, calculated through the equation by Clausius-Clapeyron, increases by diminishing moisture content. Entropy changes were evident, showing that the adsorption process is irreversible. Spreading pressure increased with increased aw and had little effect on temperature. It was observed that the net integral enthalpy of the CP+FAC diminishes when increasing moisture content. Net integral entropy increased continually with moisture content, but had a negative value with respect to the entropy of pure liquid water. These adsorption findings in the CP+FAC, are of interest in the determination of the optimal storage conditions, the prediction of shelf life and the optimization and quantification of energy requirements during the transfer of mass and heat during drying.
The glass transition temperature (Tg) of the CP+FAC, stored in different water activities (aw), diminished with increased water content, which varied for aw: 0.112: Tg: 69.79 °C at values of aw: 0.900: Tg: -39.0 °C, confirming the strong plasticizer effect of water upon this property. The critical activity (awc) and water content (Xwc) for the CP+FAC at 35 °C were awc of 0.46 and Xwc of 3.8 % (db), respectively, this means that when the CP+FAC is stored at 35 °C, the maximum relative humidity to which it can be exposed is 46 % and its moisture content would be 3.8 %; and when stored at a higher relative humidity the powder will undergo physical transformations, like collapse, stickiness, and caking.
- CRediT authorship contribution statement: Juan Carlos Lucas and Misael Cortes, Formal analysis. Conceptualization: Writing - review & editing. German Antonio Giraldo and Juan Carlos Lucas: Investigation, Writing - review & editing. Misael Cortes and Juan Carlos Lucas: Methodology, Resources, Writing - review & editing.
Funding
No funding was obtained for this study.
Declaration of Competing Interest
The authors declare that they have no known competing financial interests or personal relationships that could have appeared to influence the work reported in this paper.
Nomenclature
| aw | water activity |
| awc | critical water activity |
| Am | area of water molecule: (1.06 x 10⁻¹⁹ m2) |
| a, b, c1, c2, m1, m2, n1, n2, A, B, C, K | are fit parameters of each model |
| b and b0 | constants of Dent’s sorption isotherm |
| db | dry base |
| Xw | moisture content |
| mo | humidity of the monolayer |
| EMC | equilibrium moisture content |
| CP+FAC | coconut powder fortified with vitamins C, D3, E and calcium |
| SD | spray dried |
| RH | relative humidity |
| R | constant of ideal gases (KJ ⋅ mol-1 ⋅ K-1) |
| R2 | coefficient of determination |
| RMSE | minimum root of mean square error |
| Qst | Isosteric sorption heat (kJ mol-1) |
| ΔS | differential sorption entropy (J ⋅ mol-1 ⋅ K-1) |
| Φ | spreading pressure (J ⋅ m-2) |
| qeq | net integral sorption enthalpy (J ⋅ mol-1) |
| ΔSeq | Net integral sorption entropy (J ⋅ mol-1 ⋅ K-1) |
| Tg | glass transition temperature |
| Xwc | critical moisture content |
| DSC | differential scanning calorimetry |
| λvap | latent vaporization heat of pure water (kJ ⋅ mol-1) |
| T | absolute temperature (K) |
| Xeq | equilibrium moisture content (Kg ⋅ Kg-1 db) |
| KB | Boltzmann’s constant (1.380 x 10⁻²³ J ⋅ K-1) |
| Tgw | water glass transition temperature: -135.15 °C (138.15 K) |
| Tgs | glass transition temperature of the anhydrous solids |
| xw | mass fraction of water |
| k | constant of the Gordon-Taylor model |
| SEM | scanning electron microscopy |
| BET | Brunauer, Emmett and Teller mathematical model for modeling sorption isotherms |
| GAB | Guggenheim, Anderson and de Boer model for water sorption isotherm analysis |
References
- Alpizar-Reyes, E.; Carrillo-Navas, H.; Romero-Romero, R.; V Varela-Guerrero, V.; Álvarez-Ramírez, J.; Pérez-Alonso, C. Thermodynamic sorption properties and glass transition temperature of tamarind seed mucilage (Tamarindus indica L.). Food and Bioproducts Processing 2017, 101, 166–176. [Google Scholar] [CrossRef]
- Vasile, F.E.; Judis, M.A.; Mazzobre, M.F. Moisture sorption properties and glass transition temperature of a non- conventional exudate gum (Prosopis alba) from northeast Argentine. Food Research International 2020, 131, 109033. [Google Scholar] [CrossRef] [PubMed]
- Carter, B.P.; Schmidt, S.J. Developments in glass transition determination in foods using moisture sorption isotherms. Food Chemistry 2012, 132, 1693–1698. [Google Scholar] [CrossRef]
- Velázquez-Gutiérrez, S.K.; Figueira, A.C.; Rodríguez-Huezo, M.E.; Román-Guerrero, A.; Carrillo-Navas, H.; Pérez-Alonso, C. Sorption isotherms, thermodynamic properties and glass transition temperature of mucilage extracted from chia seeds (Salvia hispanica L. ). Carbohydrate Polymers 2015, 121, 411–419. [Google Scholar] [CrossRef]
- Mahato, S.; Zhu, Z.; Sun, D.W. Glass transitions as affected by food compositions and by conventional and novel freezing technologies: A review. Trends in Food Science & Technology 2019, 94, 1–11. [Google Scholar] [CrossRef]
- Al-Ghamdia, S.; Hong, Y.K.; Qu, Z.; Sablani, S.S. State diagram, water sorption isotherms and color stability of pumpkin (Cucurbita pepo L. ). Journal of Food Engineering 2020, 273, 109820. [Google Scholar] [CrossRef]
- Vargas-Muñoz, D.P.; Neves-deOliveira, L.A.; Cardoso-daSilva, L.; Teixeira-Godoy, H.; Emy-Kurozawa, L. Storage stability of 5-caffeoylquinic acid in powdered cocona pulp microencapsulated with hydrolyzed collagen and maltodextrin blend. Food Research International 2020, 137, 109652. [Google Scholar] [CrossRef] [PubMed]
- Stępién, A.; Witczak, M.; Witczak, T. Sorption properties, glass transition and state diagrams for pumpkin powders containing maltodextrins. LWT-Food Science and Technology 2021, 134, 110192. [Google Scholar] [CrossRef]
- Singh, P.; Talukdar, P. Determination of thermophysical and desorption properties of elephant foot yam using composition based and fast sorption method. Thermal Science and Engineering Progress 2020, 18, 100508. [Google Scholar] [CrossRef]
- Al-Muhtaseb, A.H.; McMinn, W.A.M.; Magee, T.R.A. Water sorption isotherms of starch powders. Part 2: Thermodynamic characteristics. Journal of Food Engineering 2004, 62, 135–142. [Google Scholar] [CrossRef]
- Ayala-Aponte, A. Determinación de las isotermas de sorción y del calor isosterico en harina de yuca. Biotecnología en el Sector Agropecuario y Agroindustrial 2011, 9, 88–96. [Google Scholar]
- Ayala-Aponte, A. Thermodynamic properties of moisture sorption in cassava flour. DYNA 2016, 83, 139–145. [Google Scholar] [CrossRef]
- Caballero-Gutiérrez, B.L.; Márquez-Cardozo, C.J.; Ciro-Velásquez, H.J. Thermodynamic Study of Adsorption Properties of Rocoto Pepper (Capsicum pubescens) Obtained by Freeze-Drying. Advance Journal of Food Science and Technology 2018, 15, 91–98. [Google Scholar] [CrossRef]
- Moussaoui, H. , Bahammoua, Y., Idlimama, A., Lamharrar, Abdenouri, N. Investigation of hygroscopic equilibrium and modeling sorption isotherms of the argan products: A comparative study of leaves, pulps, and fruits. Food and Bioproducts Processing 2019, 114, 12–22. [Google Scholar] [CrossRef]
- Largo-Ávila, E.; Cortes-Rodríguez, M.; Ciro-Velásquez, H.J. The adsorption thermodynamics of sugarcane (Saccharum officinarum L.) powder obtained by spray dryig technology. VITAE 2014, 21, 165–177. [Google Scholar] [CrossRef]
- Lucas-Aguirre, J.C.; Tobón-Castrillón, C.; Cortes-Rodríguez, M. Influence of the composition of coconut-based emulsions on the stability of the colloidal system. Advance Journal of Food Science and Technology 2018, 14, 77–92. [Google Scholar] [CrossRef]
- Lucas-Aguirre, J.C.; Giraldo- Giraldo, G.A.; Cortes-Rodríguez, M. Effect of the Spray Drying Process on the Quality of Coconut Powder Fortified with Calcium and Vitamins C, D3 and E. Advance Journal of Food Science and Technology 2018, 16, 102–124. [Google Scholar] [CrossRef]
- Giraldo-Giraldo, G.A.; Cortes-Rodríguez, M. Modelling of Moisture Sorption Isotherm and Evaluation of Net Isosteric Heat for Spray-Dried Fortified Coconut (Cocos nucifera L.) Powder. British Food Journal 2021. [Google Scholar] [CrossRef]
- Van den Berg, C.; Bruin, S. Water activity and its estimation in food systems. In Water Activity: Influences on Food Quality; Rockland, L.B., Stewart, G.F., Eds.; Academic Press: New York, 1981; pp. 1–61. [Google Scholar]
- Brunauer, S.; Emmett, P.H.; Teller, E. Adsorption of gases in multi-molecular layers. Journal of American Chemistry Society 1938, 60, 309–320. [Google Scholar] [CrossRef]
- Oswin, C.R. The kinetics of package life III. The isotherm. Journal of Chemical Industry 1946, 65, 419–421. [Google Scholar] [CrossRef]
- Smith, S.E. The sorption of water vapor by high polymers. Journal of the American Chemical Society 1947, 69, 646. [Google Scholar] [CrossRef]
- Halsey, G. Physical adsorption on non-uniform surfaces. Journal of Chemistry Physics 1948, 16, 931–937. [Google Scholar] [CrossRef]
- Henderson, S. A basic concept of equilibrium moisture. Agricultural Engineering 1952, 33, 29–32. [Google Scholar]
- Chung, D.S.; Pfost, H. Adsorption and desorption of water by cereal grains and their products. Transactions of the American Society of Agricultural Engineering 1967, 10, 52–555. [Google Scholar] [CrossRef]
- Peleg, M. Assessment of a semi-empirical four parameter general model for sigmoid moisture sorption isotherms. Journal of Food Process Engineering 1993, 16, 21–37. [Google Scholar] [CrossRef]
- Caurie, M. A new model equation for predicting safe storage moisture levels for optimum stability of dehydrated foods. Journal of Food Technology 1970, 5, 301–307. [Google Scholar] [CrossRef]
- Kaya, S.; Kahyaoglu, T. Thermodynamic properties and sorption equilibrium of pestil (grape leather). Journal of Food Engineering 2005, 71, 200–207. [Google Scholar] [CrossRef]
- Arslan, N.; Toğrul, H. Modelling of water sorption isotherms of macaroni stored in a chamber under controlled humidity and thermodynamic approach. Journal of Food Engineering 2005, 69, 133–145. [Google Scholar] [CrossRef]
- Kamau, E.; C Mutungi, C.; Kinyuru, J.; Imathiu, S.; Tanga, C.; Affognon, H.; Ekesi, S.; Nakimbugwe, D.; Fiaboe, K.K.M. Moisture adsorption properties and shelf-life estimation of dried and pulverised edible house cricket Acheta domesticus (L.) and black soldier fly larvae Hermetia illucens (L.). Food Research International 2018, 106, 420–427. [Google Scholar] [CrossRef]
- Dent, R.W. A multilayer theory for gas sorption. Part 1: Sorption of a single gas. Textile Research Journal 1977, 47, 145–152. [Google Scholar] [CrossRef]
- Grabowski, J.A.; Truong, V.D.; Daubert, D.R. Spray drying of amylase hydrolyzed sweetpotato puree and physicochemical properties of powder. Journal of Food Science 2006, 71, E209–E217. [Google Scholar] [CrossRef]
- Islam, M.Z.; Kitamura, Y.; Yamano, Y.; Kitamura, M. Effect of vacuum spray drying on the physicochemical properties, water sorption and glass transition phenomenon of orange juice powder. Journal of Food Engineering 2016, 139, 131–140. [Google Scholar] [CrossRef]
- Goula, A.M.; Karapantsios, T.D.; Achilias, D.S.; Adamopoulos, K.G. Water sorption isotherms and glass transition temperature of spray dried tomato pulp. Journal of Food Engineering 2008, 85, 73–83. [Google Scholar] [CrossRef]
- Mirhosseini, H.; Ping Tan, C.; Hamid, N.S.A.; Yusof, S. Effect of Arabic gum, xanthan gum and orange oil contents on ζ-potential, conductivity, stability, size index and pH of orange beverage emulsion. Colloids and Surfaces A: Physicochem. Eng. Aspects 2008, 315, 47–56. [Google Scholar] [CrossRef]
- Cano-Chauca, M.; Stringheta, P.C.; Ramos, A.M.; Cal-Vidal, J. Effect of the carriers on the microstructure of mango powder obtained by spray drying and its functional characterization. Innov. Food. Sci. Emerg. 2005, 6, 420–428. [Google Scholar] [CrossRef]
- Iglesias, H.A.; Chirife, J.; Ferro-Fontan, C. On the temperature dependence of isosteric heats of water sorption in dehydrated foods. Journal of Food Science 1989, 54, 1620–1631. [Google Scholar] [CrossRef]
- Syamaladevi, R.M.; Sablani, S.S.; Tang, J.; Powers, J.; Swanson, B.G. State diagram and water adsorption isotherm of raspberry (Rubus idaeus). Journal of Food Engineering 2009, 91, 460–467. [Google Scholar] [CrossRef]
- Duarte-Marques, R.C.; Resende-Oliveira, É.; Mendes-Coutinho, G.S.; Chaves-Ribeiro, A.E.; Souza-Teixeira, C.; Soares-Júnior, M.S.; Caliari, M. Modeling sorption properties of maize by-products obtained using the Dynamic Dewpoint Isotherm (DDI) method. Food Bioscience 2020, 38, 100738. [Google Scholar] [CrossRef]
- Ajibola, O.O.; Aviara, N.A.; Ajetumobi, O.E. Sorption equilibrium and thermodynamic properties of cowpea (Vigna unguiculata). Journal of Food Engineering 2003, 58, 317–324. [Google Scholar] [CrossRef]
- McMinn, W.; Magee, T. Thermodynamic properties of moisture sorption of potato. Journal of Food Engineering 2003, 60, 157–165. [Google Scholar] [CrossRef]
- Azuara, E.; Beristain, C.I. Enthalpic and entropic mechanisms related to water sorption of yogurt. Drying Technology 2006, 24, 1501–1507. [Google Scholar] [CrossRef]
- Viganó, J.; Azuara, E.; Telis, V.R.N.; Beristain, C.I.; Jiménez, M.; Telis-Romero, J. Role of enthalpy and entropy in moisture sorption behavior of pineapple pulp powder produced by different drying methods. Thermochimica Acta 2012, 528, 63–71. [Google Scholar] [CrossRef]
- Zotarelli, M.F.; Martins-da Silva, V.; Durigon, A.; Dupas-Hubinger, M.; Borges-Laurindo, J. Production of mango powder by spray drying and cast-tape drying. Powder Technology 2017, 305, 447–454. [Google Scholar] [CrossRef]
- Voelker, A.L.; Sommer, A.A.; Mauer, L.J. Moisture sorption behaviors, water activity-temperature relationships, and physical stability traits of spices, herbs, and seasoning blends containing crystalline and amorphous ingredients. Food Research International 2020, 136, 109608. [Google Scholar] [CrossRef] [PubMed]
- Zhao, J.H.; Liu, F.; Wen, X.; Xiao, H.W.; Ni, Y.Y. ; () State diagram for freeze–dried mango: freezing curve glass transition line maximal–freeze–concentration condition, J. Food Eng. 2015, 157, 49–56. [Google Scholar] [CrossRef]
- Djendoubi-Mrad, N.; Bonazzi, C.; Courtois, F.; Kechaou, N.; Boudhrioua-Mihoubid, N. Moisture desorption isotherms and glass transition temperatures of osmo-dehydrated apple and pear. Food and Bioproducts Processing 2103, 91, 121–128. [Google Scholar] [CrossRef]
- Tonon, R.V.; Baroni, A.F.; Brabet, C.; Gibert, O.; Pallet, D.; Hubinger, M.D. Water sorption and glass transition temperature of spray dried açai (Euterpe oleracea Mart.) juice. Journal of Food Engineering 2009, 94, 215–221. [Google Scholar] [CrossRef]
- Pua, C.K.; Hamid, N.S.A.; Tan, C.P.; Mirhosseini, H.; Rahman, R.A.; Rusul, G. Storage stability of jackfruit (Artocarpus heterophyllus) powder packaged in aluminium laminated polyethylene and metallized co-extruded biaxially oriented polypropylene during storage. Journal of Food Engineering 2008, 89, 419–428. [Google Scholar] [CrossRef]
- Mosquera-Mosquera, L.H. Influencia de la humedad y de la adición de solutos (maltodextrina o goma arábiga) en las propiedades fisicoquímicas de borojó y fresa en polvo. Tesis Doctoral, Universidad Politécnica de Valencia, 2010; p. 219. [Google Scholar]
- Liu, F.; Cao, X.; Wang, H.; Lia, X. Changes of tomato powder qualities during storage. Powder Technology 2010, 204, 159–166. [Google Scholar] [CrossRef]
- Frascareli, E.C.; Silva, V.M.; Tonon, R.V.; Hubinger, M.D. Effect of process conditions on the microencapsulation of coffee oil by spray drying. Food Bioprod. Process 2012, 90, 413–424. [Google Scholar] [CrossRef]
- Jafari, S.M.; Ghalenoei, M.G.; Dehnad, D. Influence of spray drying on water solubility index, apparent density, and anthocyanin content of pomegranate juice powder. Powder Technology 2016, 311, 59–65. [Google Scholar] [CrossRef]
- Mohammed, N.K.; Tan, C.P.; Manap, Y.A.; Alhelli, A.M.; Hussin, A.S.M. Process conditions of spray drying microencapsulation of Nigella sativa oil. Powder Technology 2017, 315, 1–14. [Google Scholar] [CrossRef]
- Deshwal GKr Kumar-Singh, A.; Kumar, D.; Sharma, H. Effect of spray and freeze drying on physico-chemical, functional, moisture sorption and morphological characteristics of camel milk powder. LWT – Food Science and Technology 2020, 134, 110117. [Google Scholar] [CrossRef]
- Zhang, L.; Qiu, J.; Cao, X.; Zeng, X.; Tang, X.; Sun, Y.; Lin, L. Drying methods, carrier materials, and length of storage affect the quality of xylooligosaccharides. Food Hydrocolloids 2019, 94, 439–450. [Google Scholar] [CrossRef]
- Mutlu, C.; Koç, A.; Erbaş, M. Some physical properties and adsorption isotherms of vacuum-dried honey powder with different carrier materials. LWT-Food Science and Technology 2020, 134, 110166. [Google Scholar] [CrossRef]
- Islam-Shishir, M.R.; Taip, F.S.; Saifullah, Md.; Aziz, N.Ab.; Talib, R.A. Effect of packaging materials and storage temperature on the retention of physicochemical properties of vacuum-packed pink guava powder. Food Packaging and Shelf Life 2017, 12, 83–90. [Google Scholar] [CrossRef]
Figure 1.
Water sorption isotherms of experimental and modeled CP+FAC [Peleg, 1993].
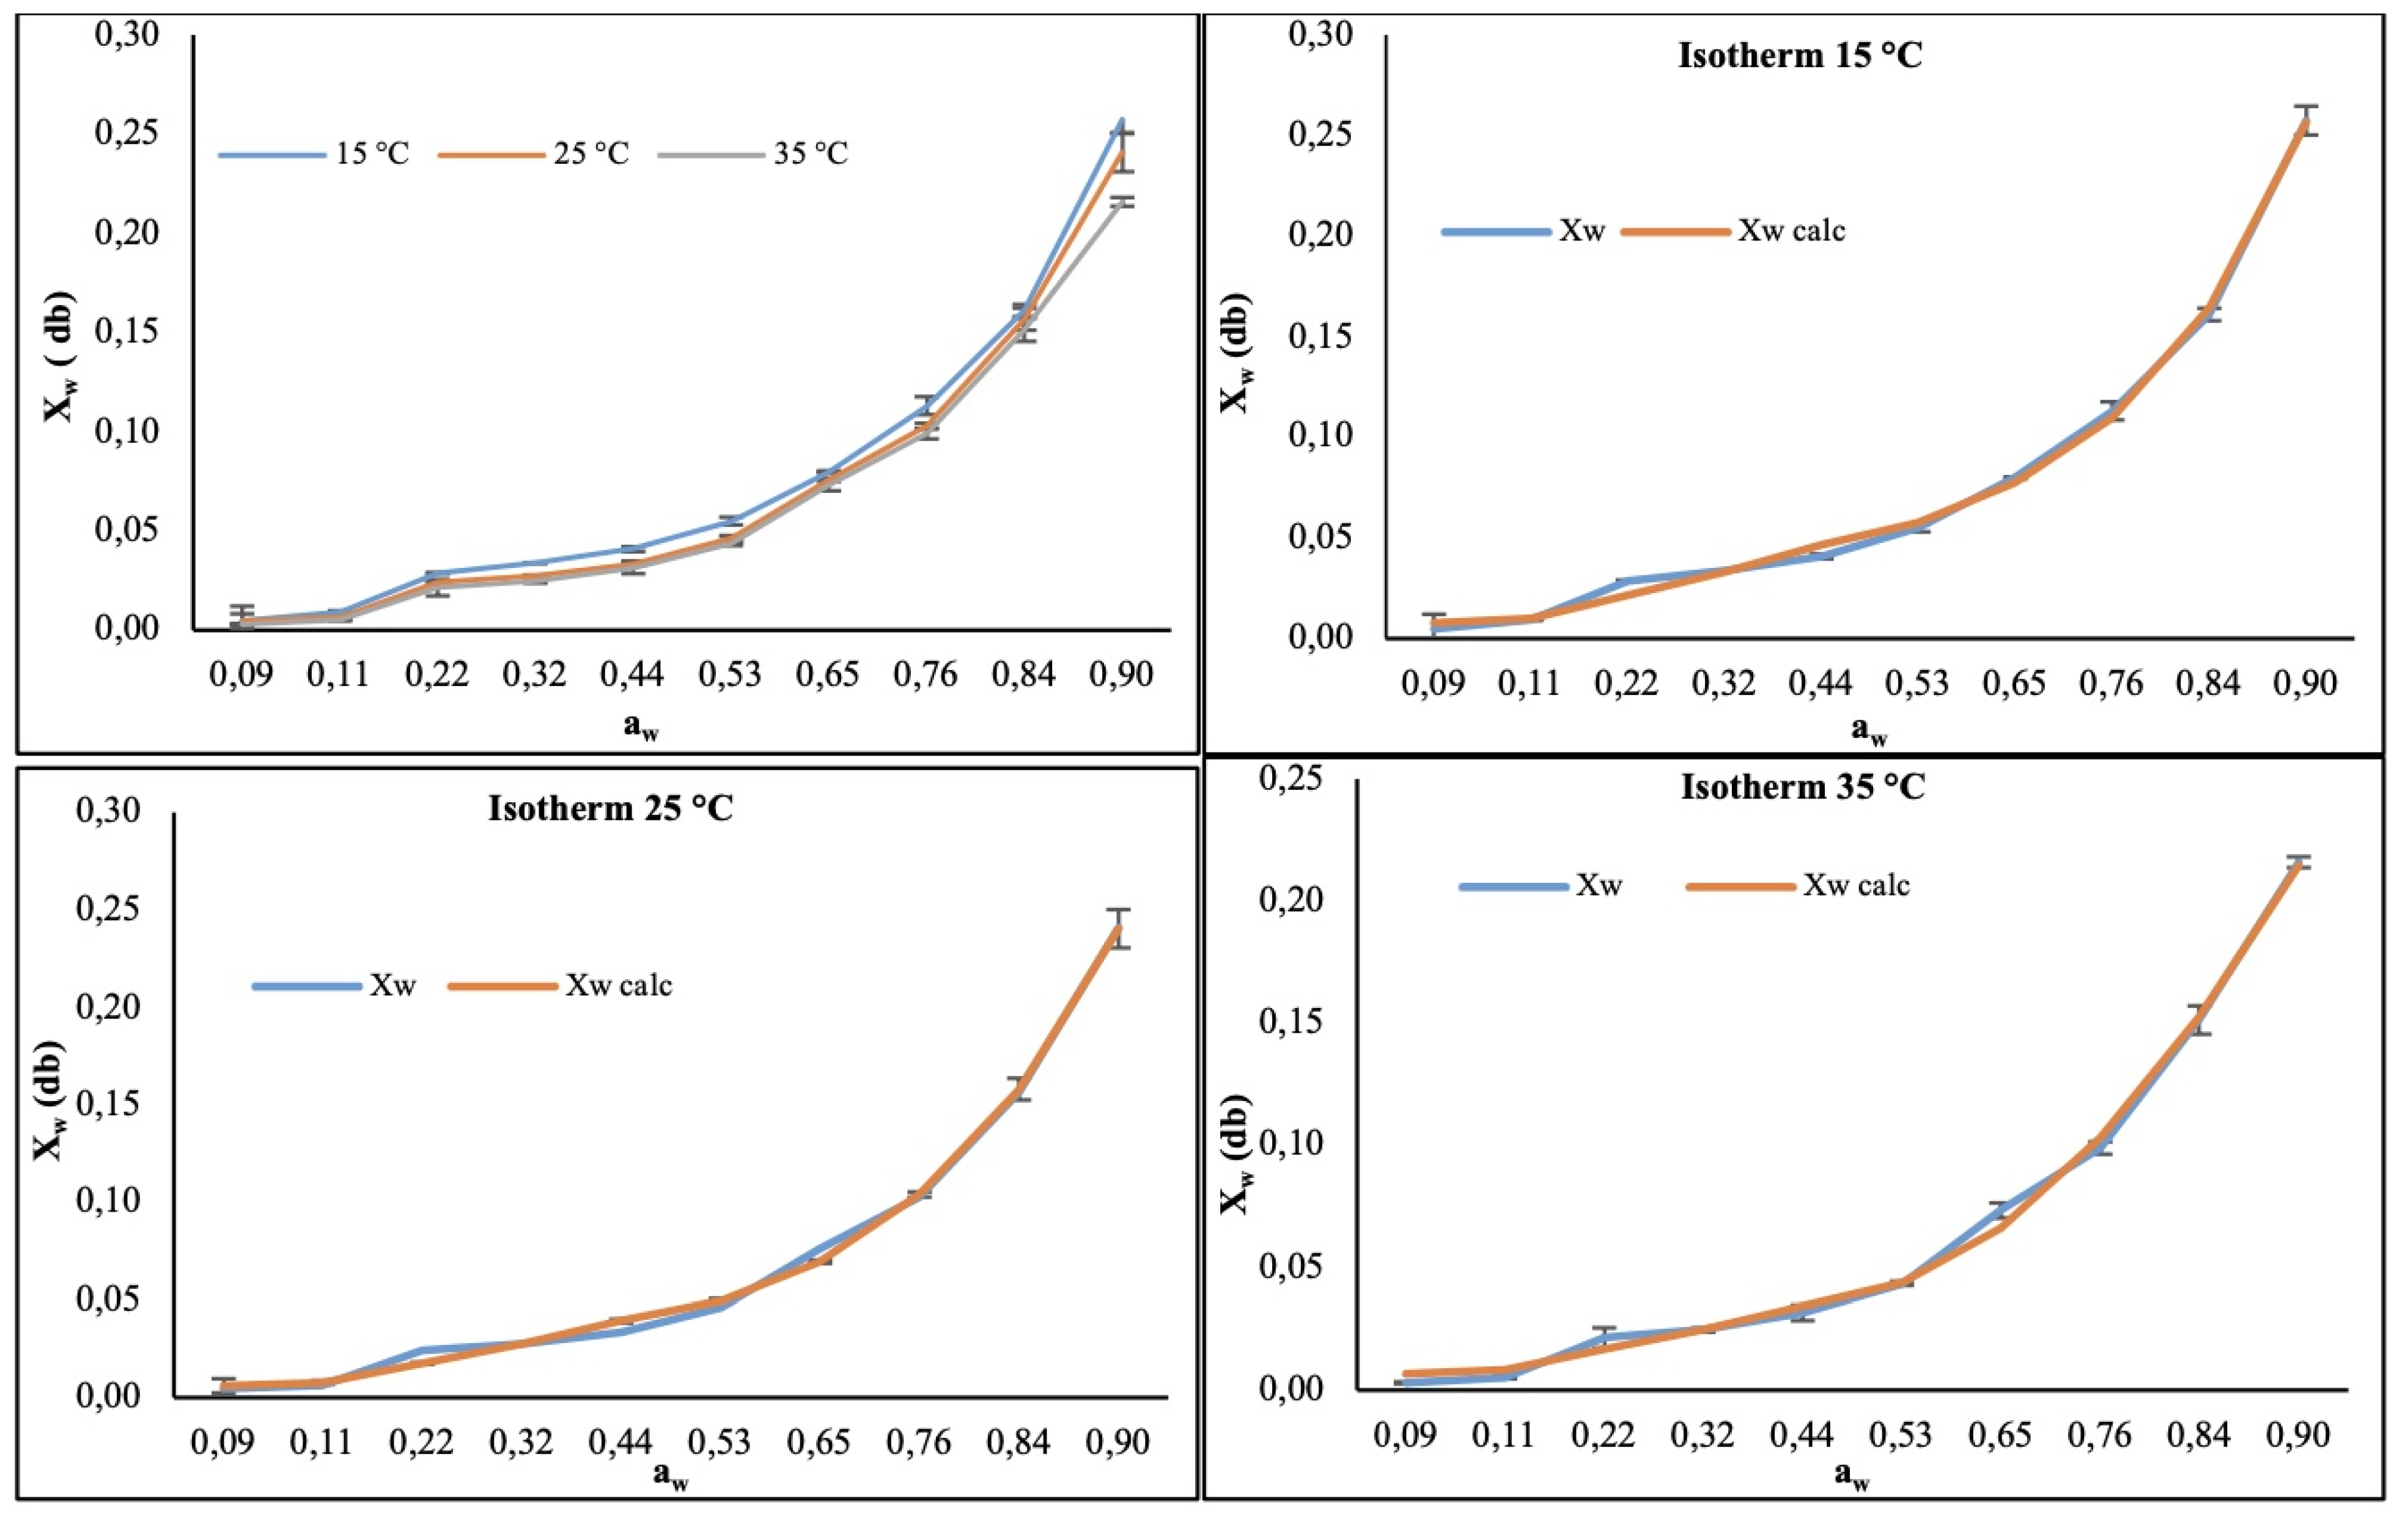
Figure 2.
Isosteric sorption heat of the CP+FAC.
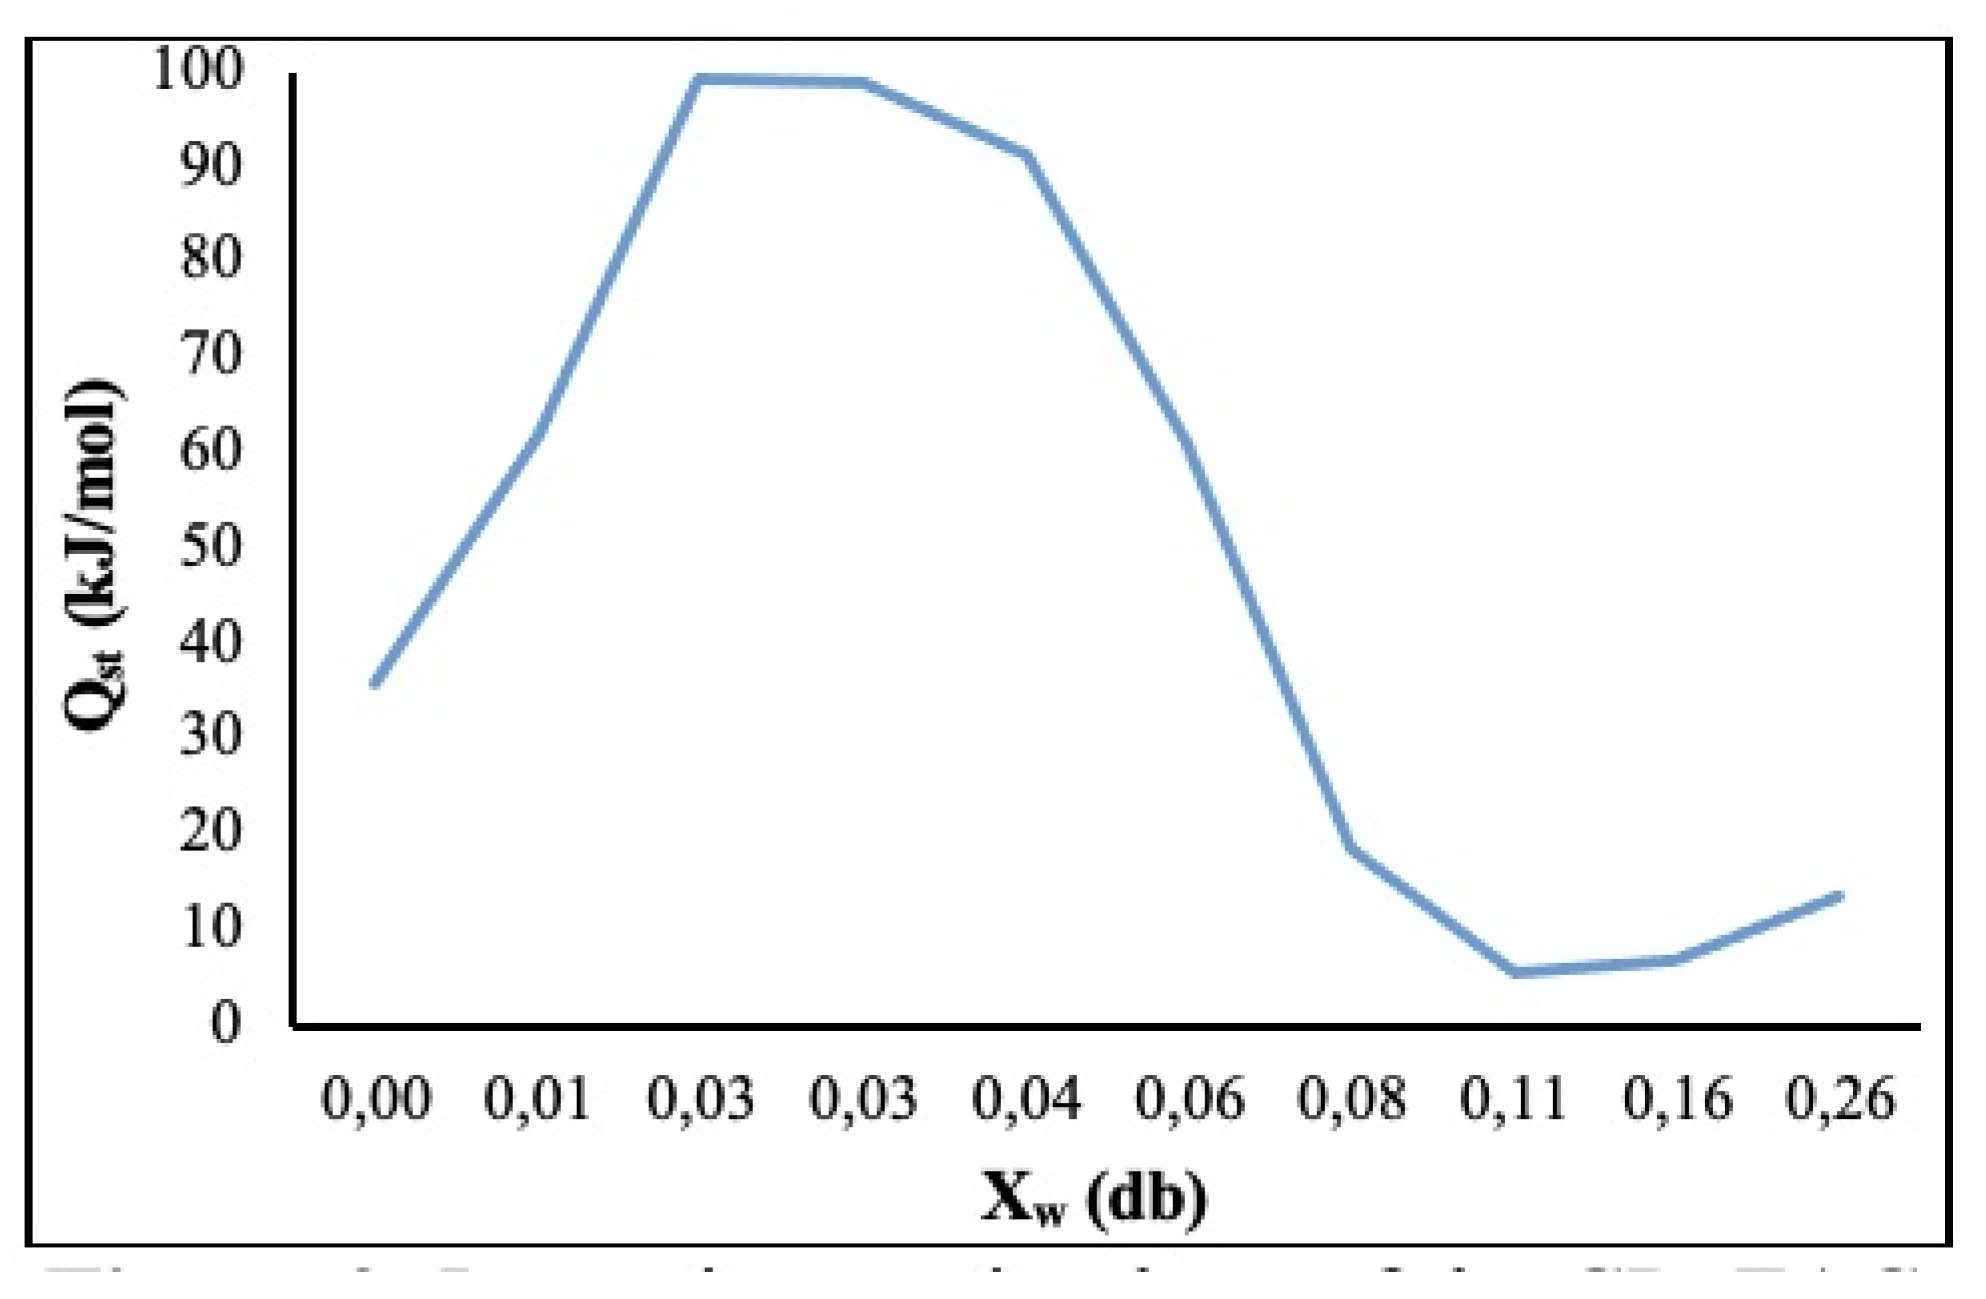
Figure 3.
Spreading pressure of the CP+FAC.
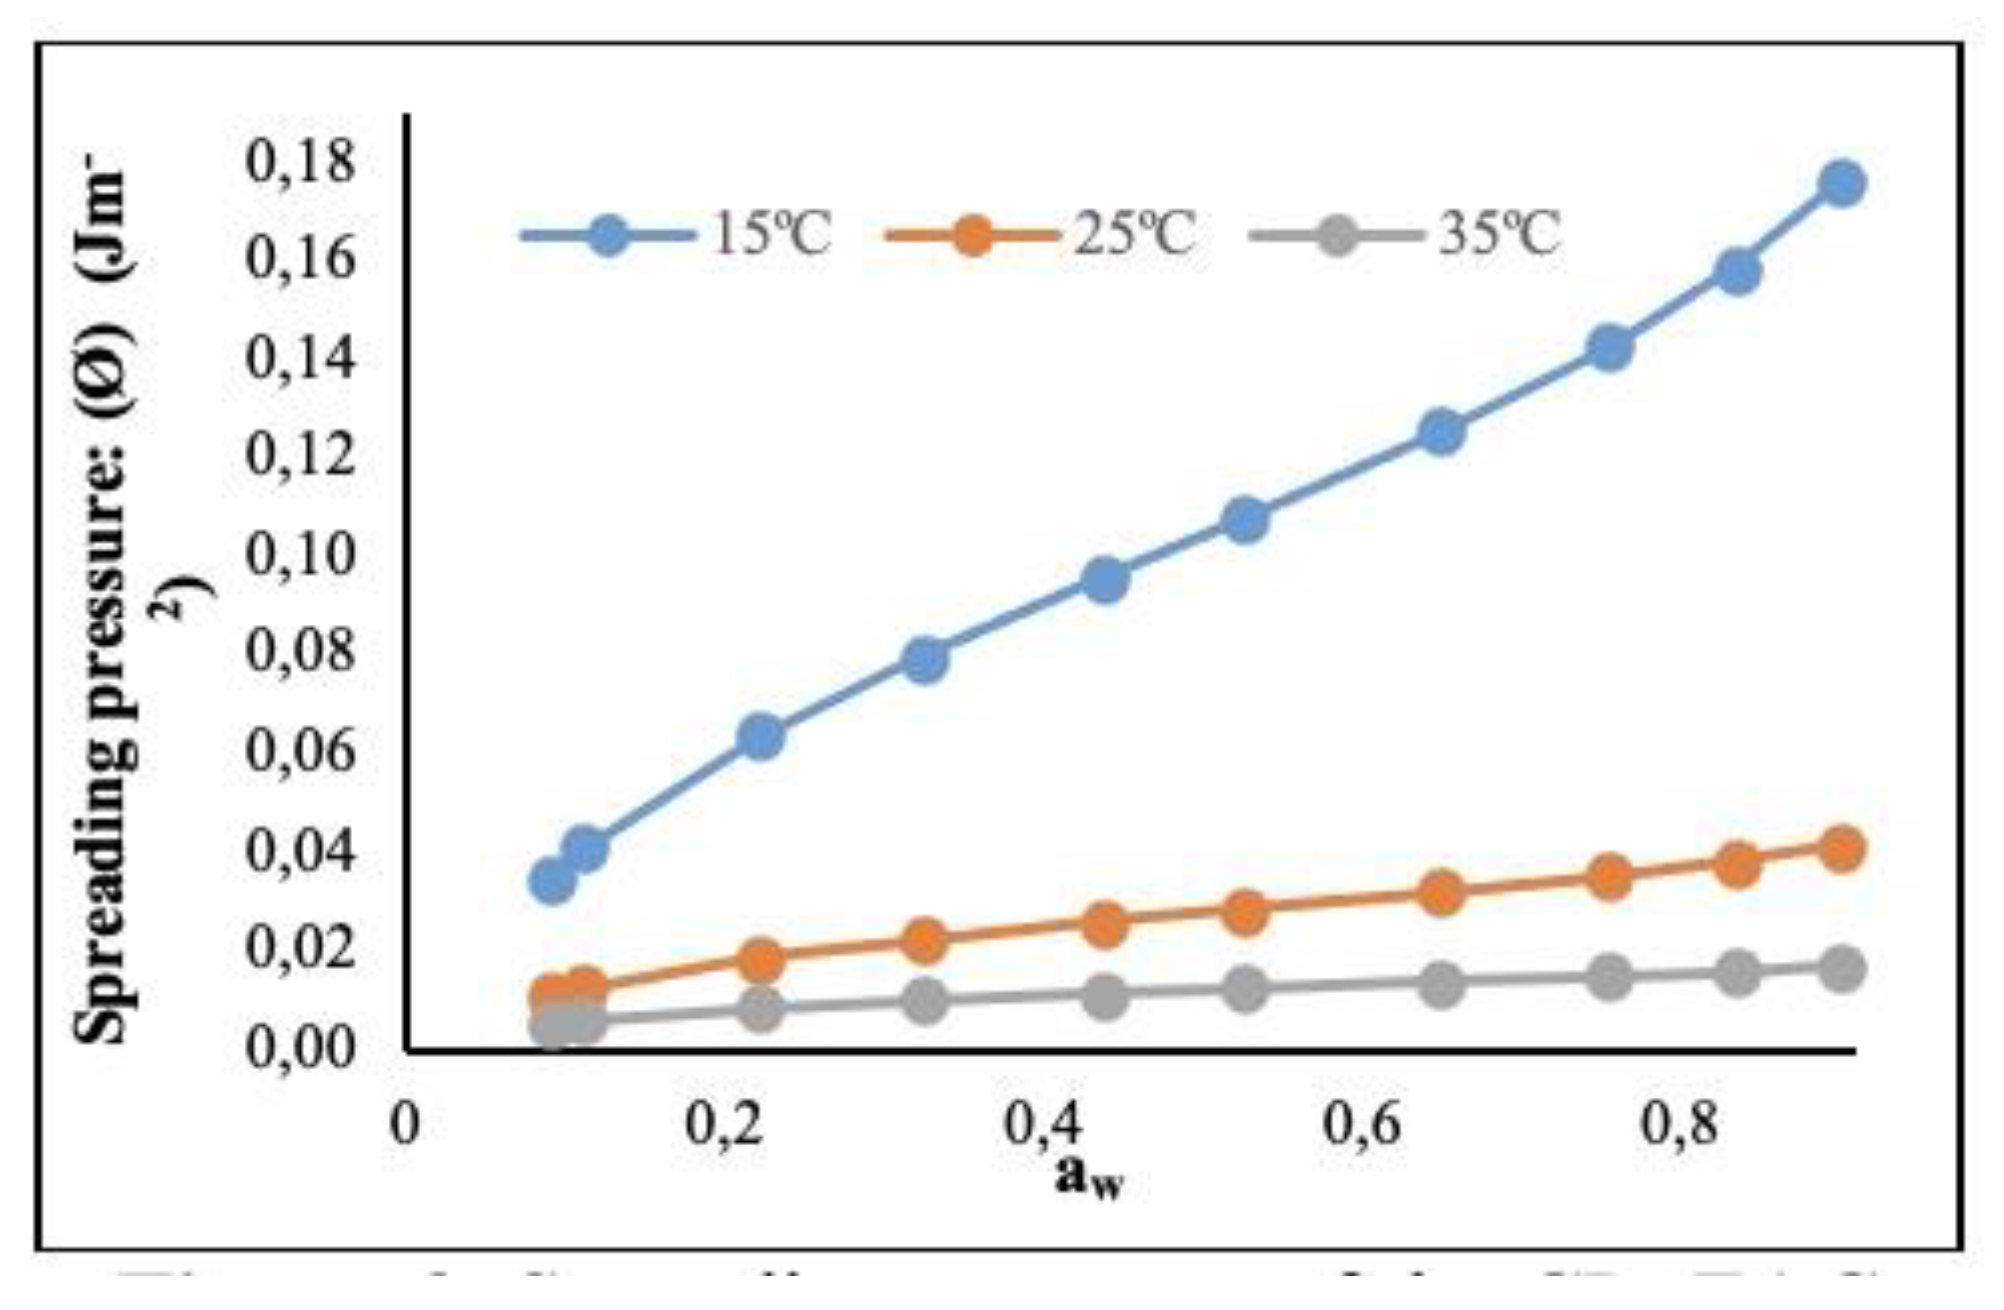
Figure 4.
Differential sorption entropy of the CP+FAC.
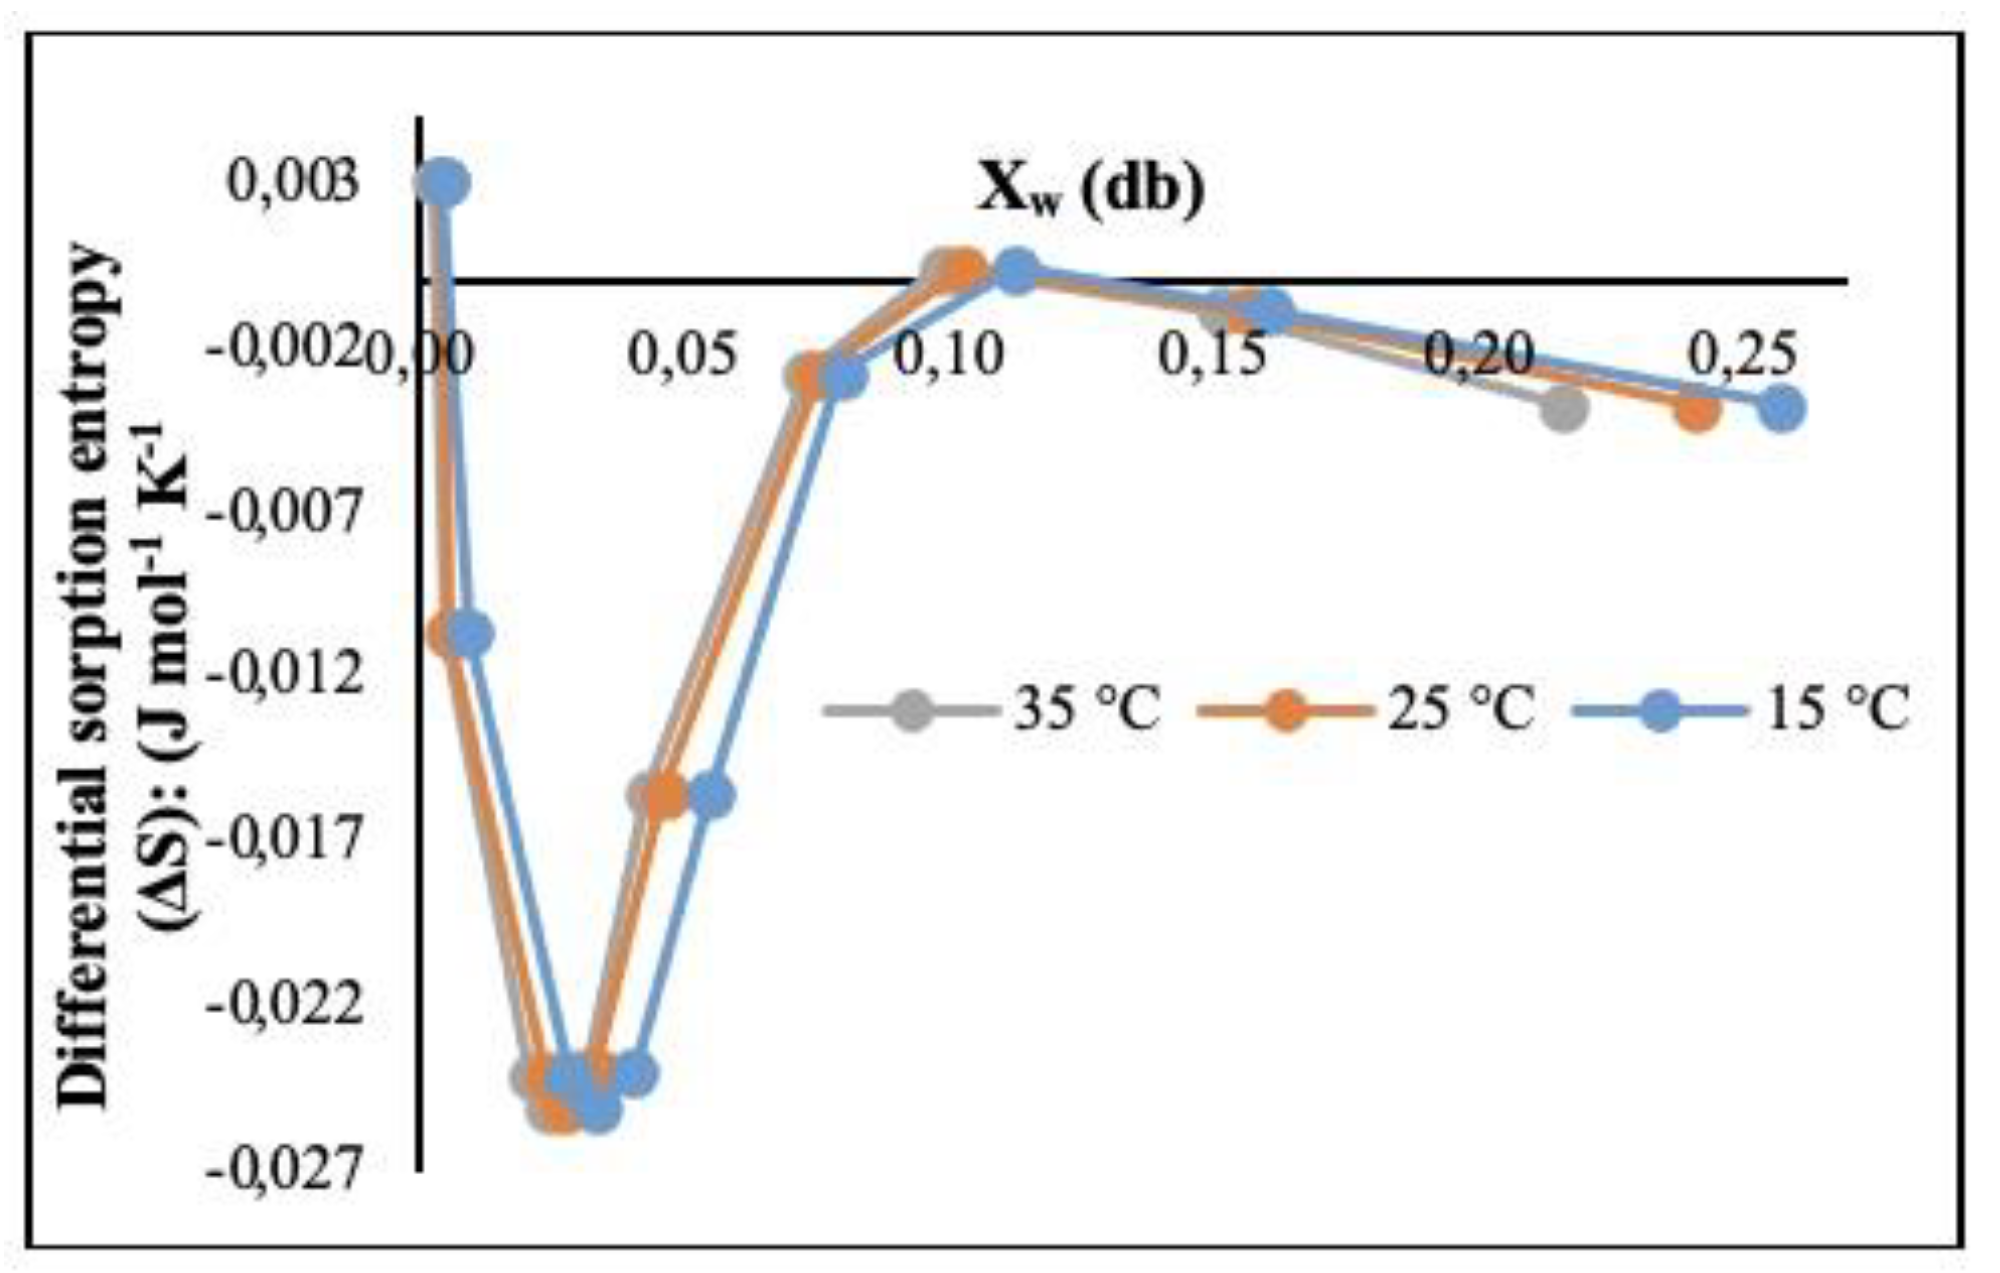
Figure 5.
Net integral enthalpy of the CP+FAC.
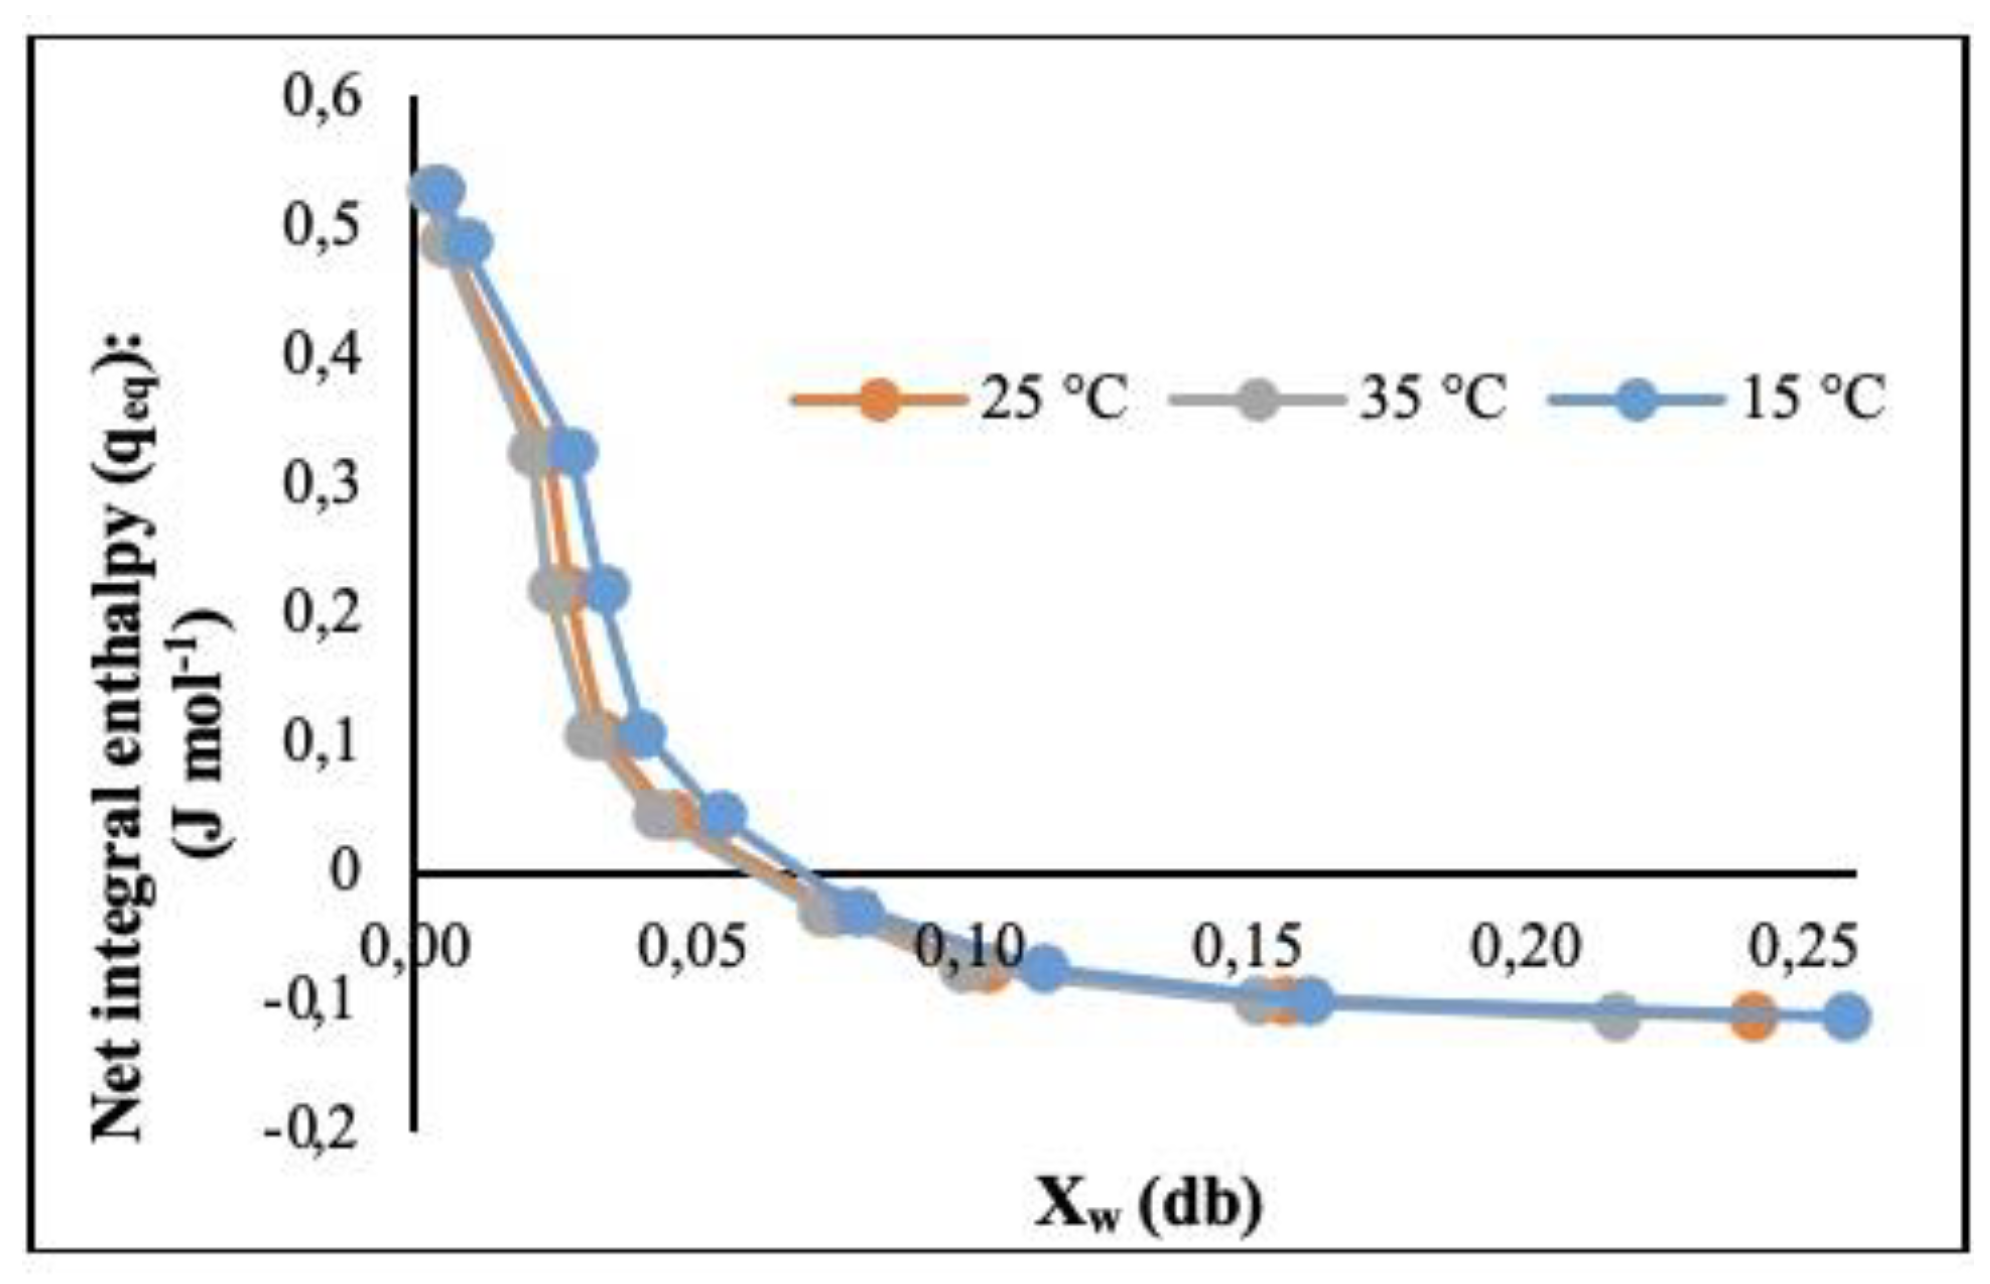
Figure 6.
Differential sorption entropy of the CP+FAC.
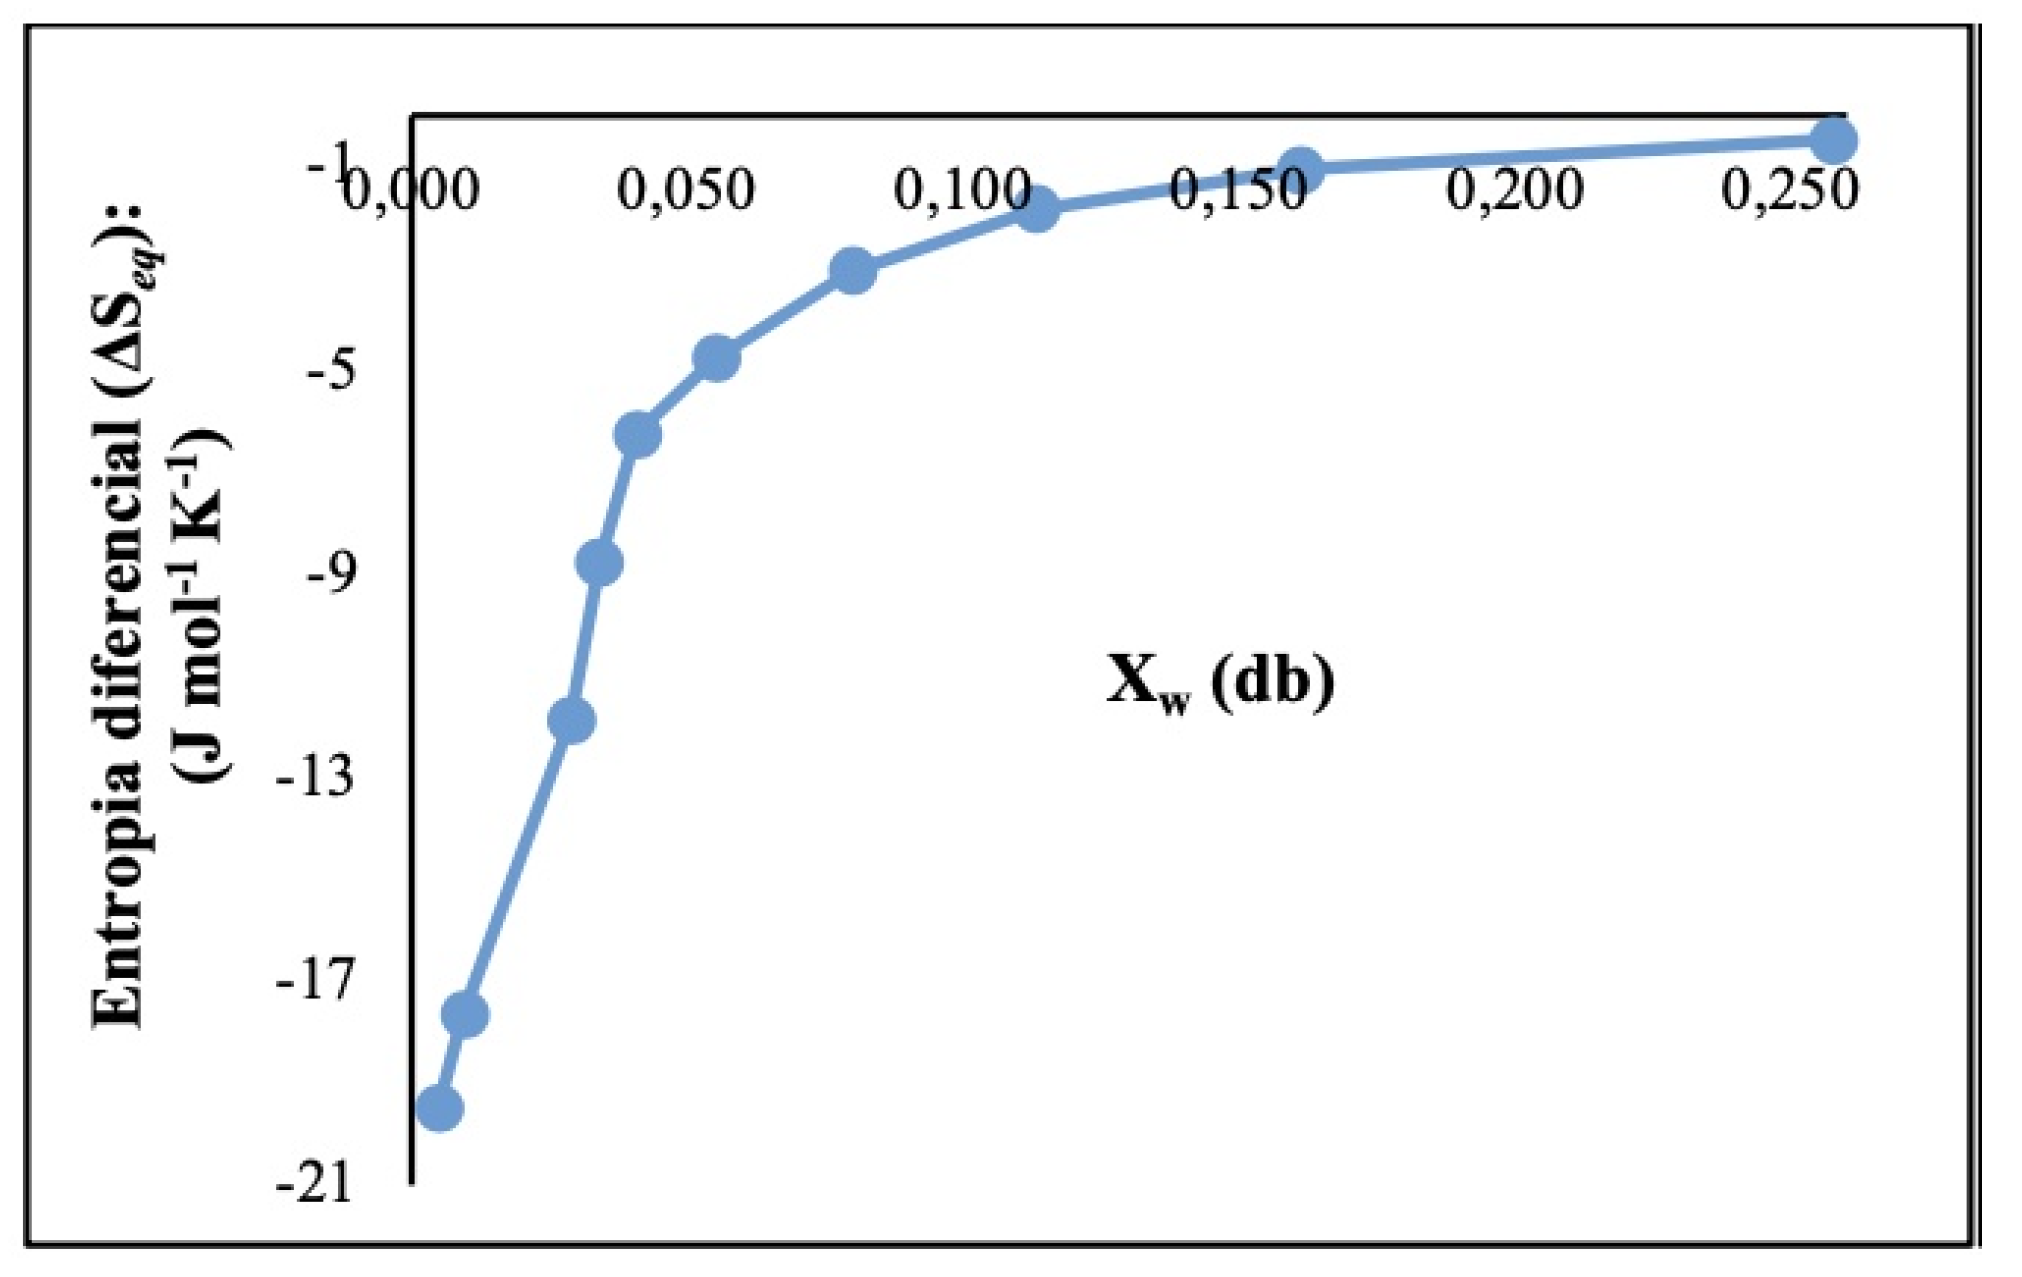
Figure 7.
DSC analysis of the CP+FAC under different aw.
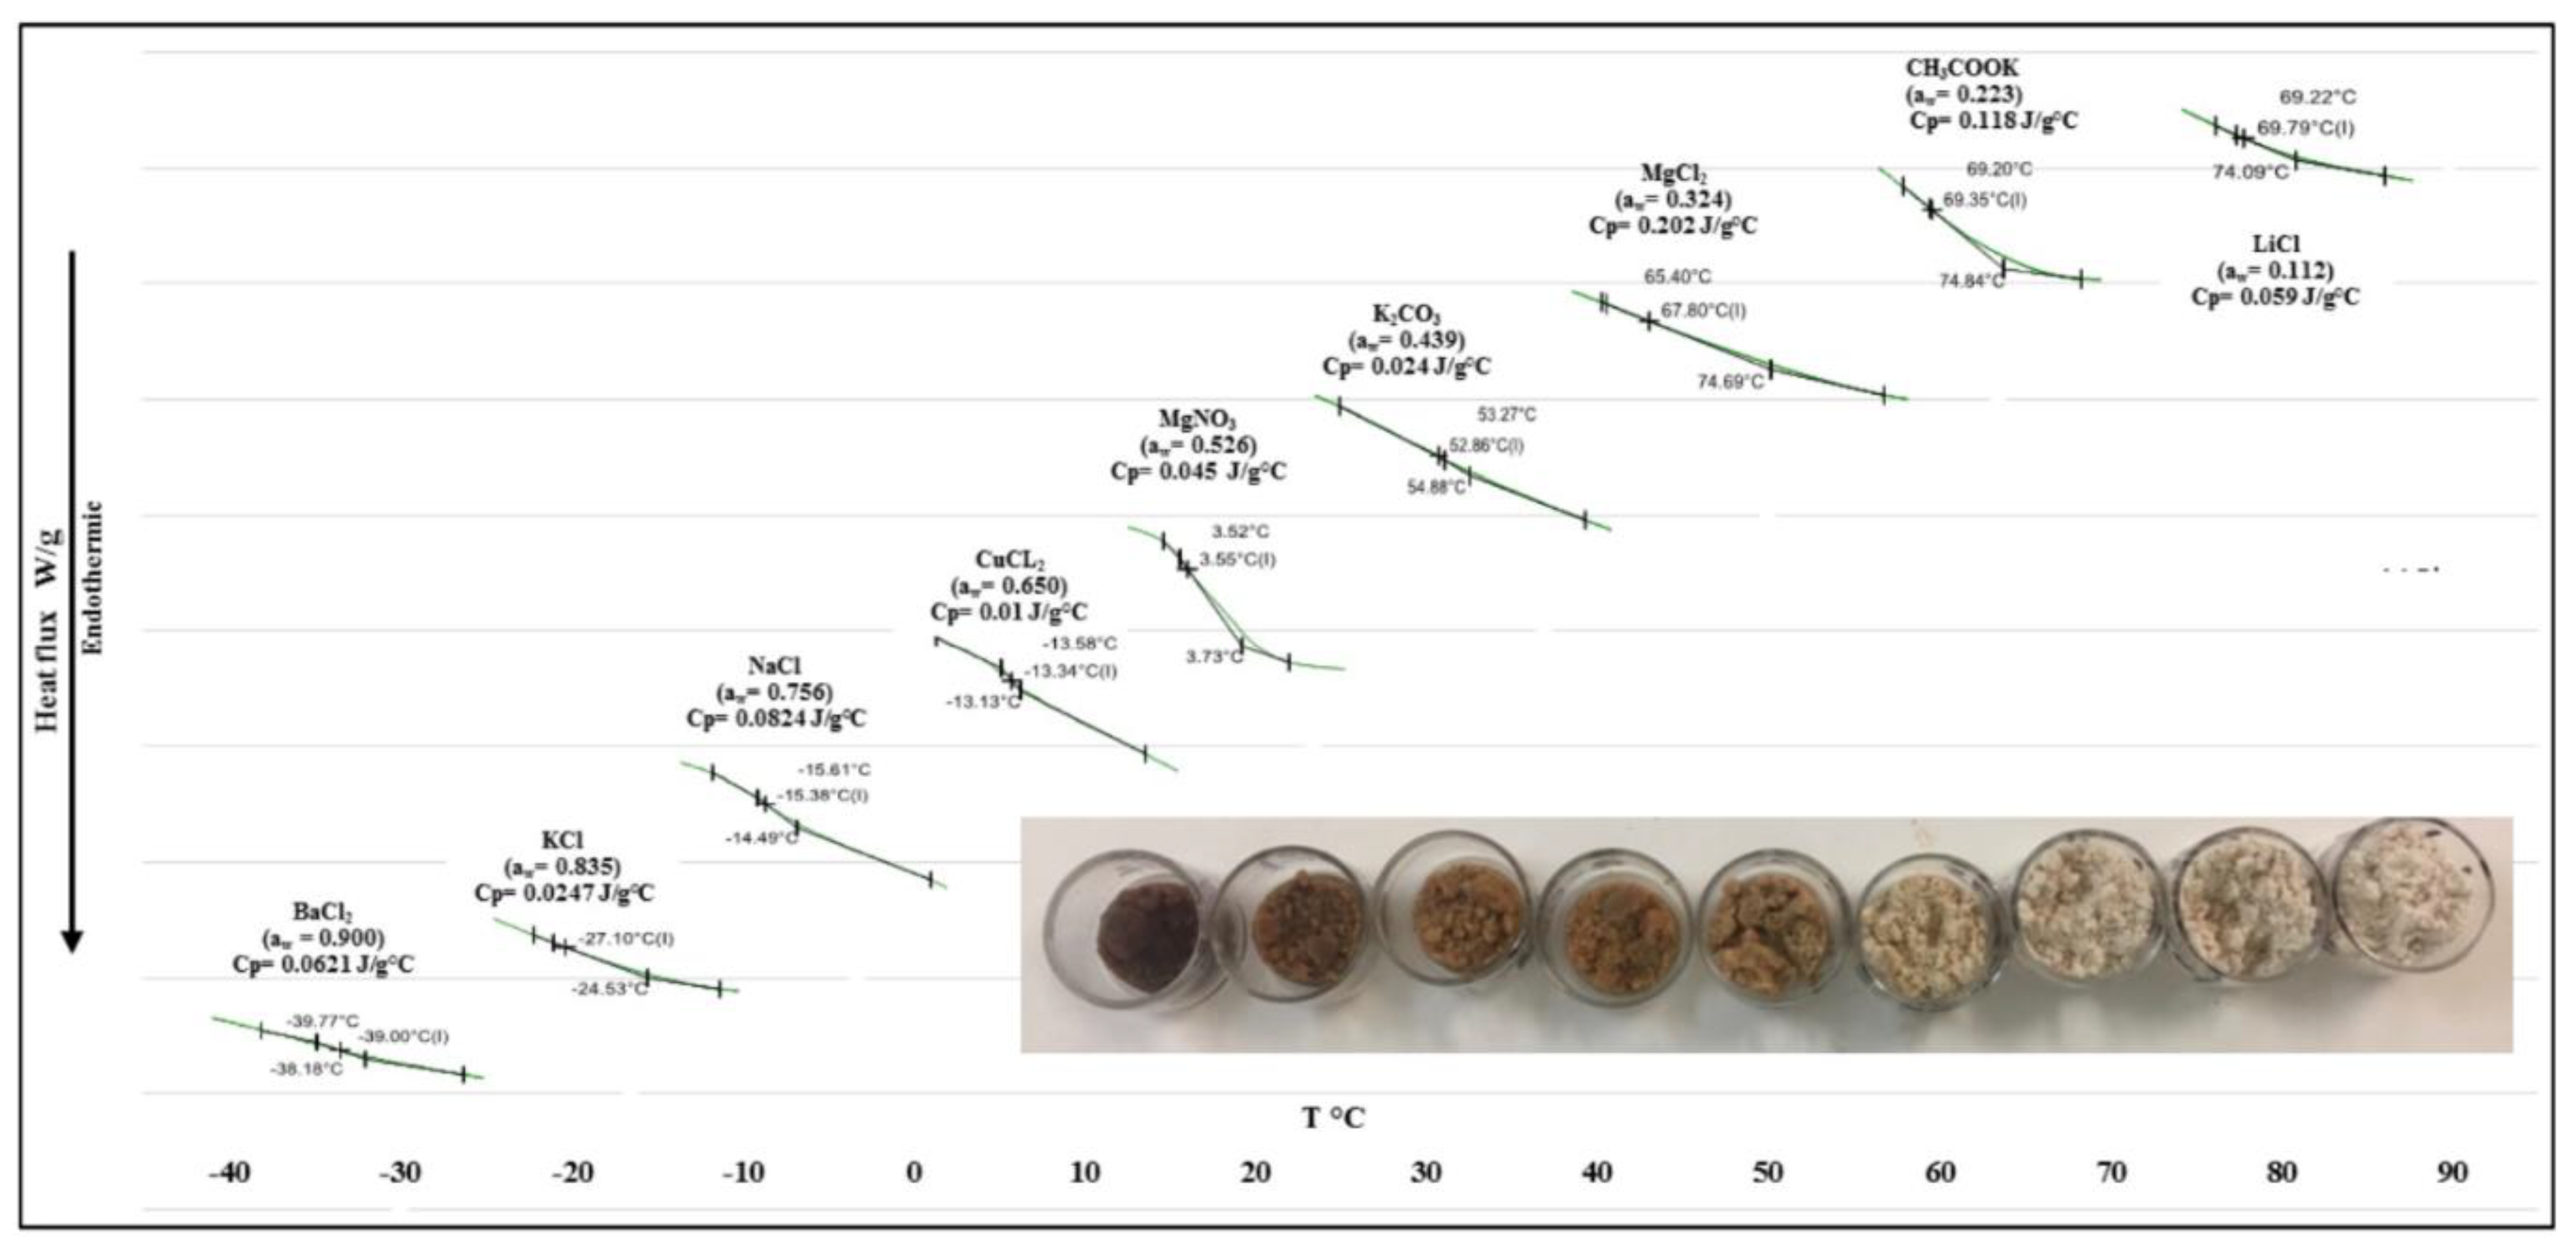
Figure 8.
Experimental glass transition (Tg) curve and modelled through the Gordon and Taylor model in the CP+FAC.
Figure 8.
Experimental glass transition (Tg) curve and modelled through the Gordon and Taylor model in the CP+FAC.

Figure 9.
Variation of glass transition temperature (Tg) and the moisture sorption isotherm vs. water activity (aw) in the CP+FAC stored at 35 °C.
Figure 9.
Variation of glass transition temperature (Tg) and the moisture sorption isotherm vs. water activity (aw) in the CP+FAC stored at 35 °C.
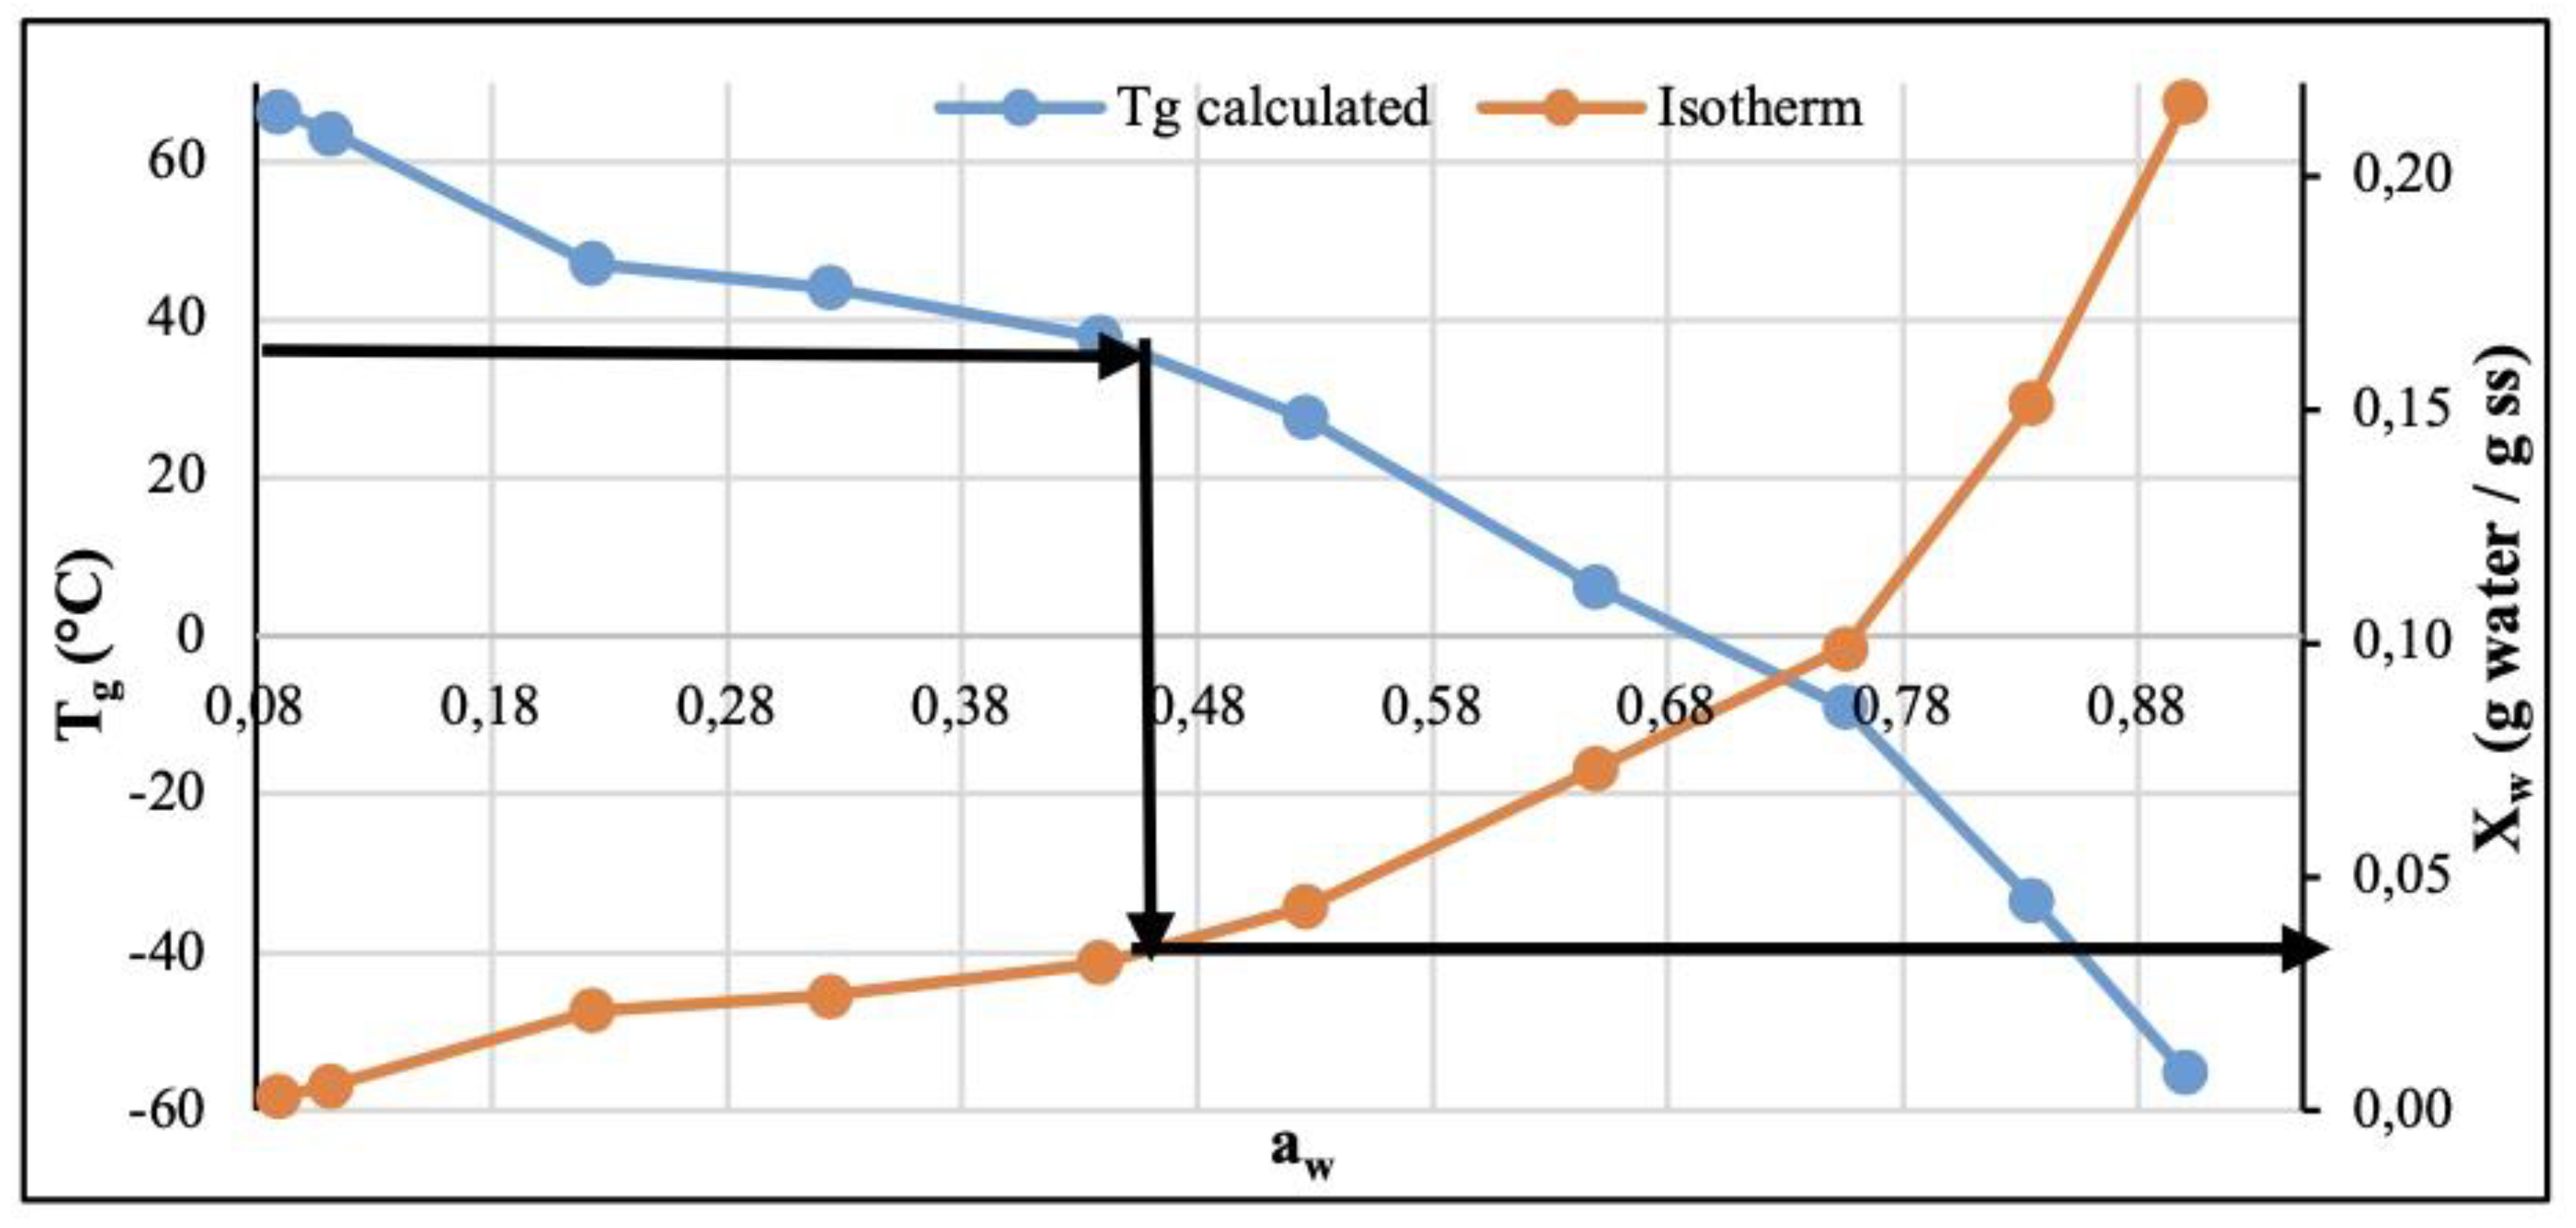
Figure 10.
Particle size distribution in the CP+FAC stored at 35 °C-N2 in times of storage: a: day 0 and b: day 180.
Figure 10.
Particle size distribution in the CP+FAC stored at 35 °C-N2 in times of storage: a: day 0 and b: day 180.
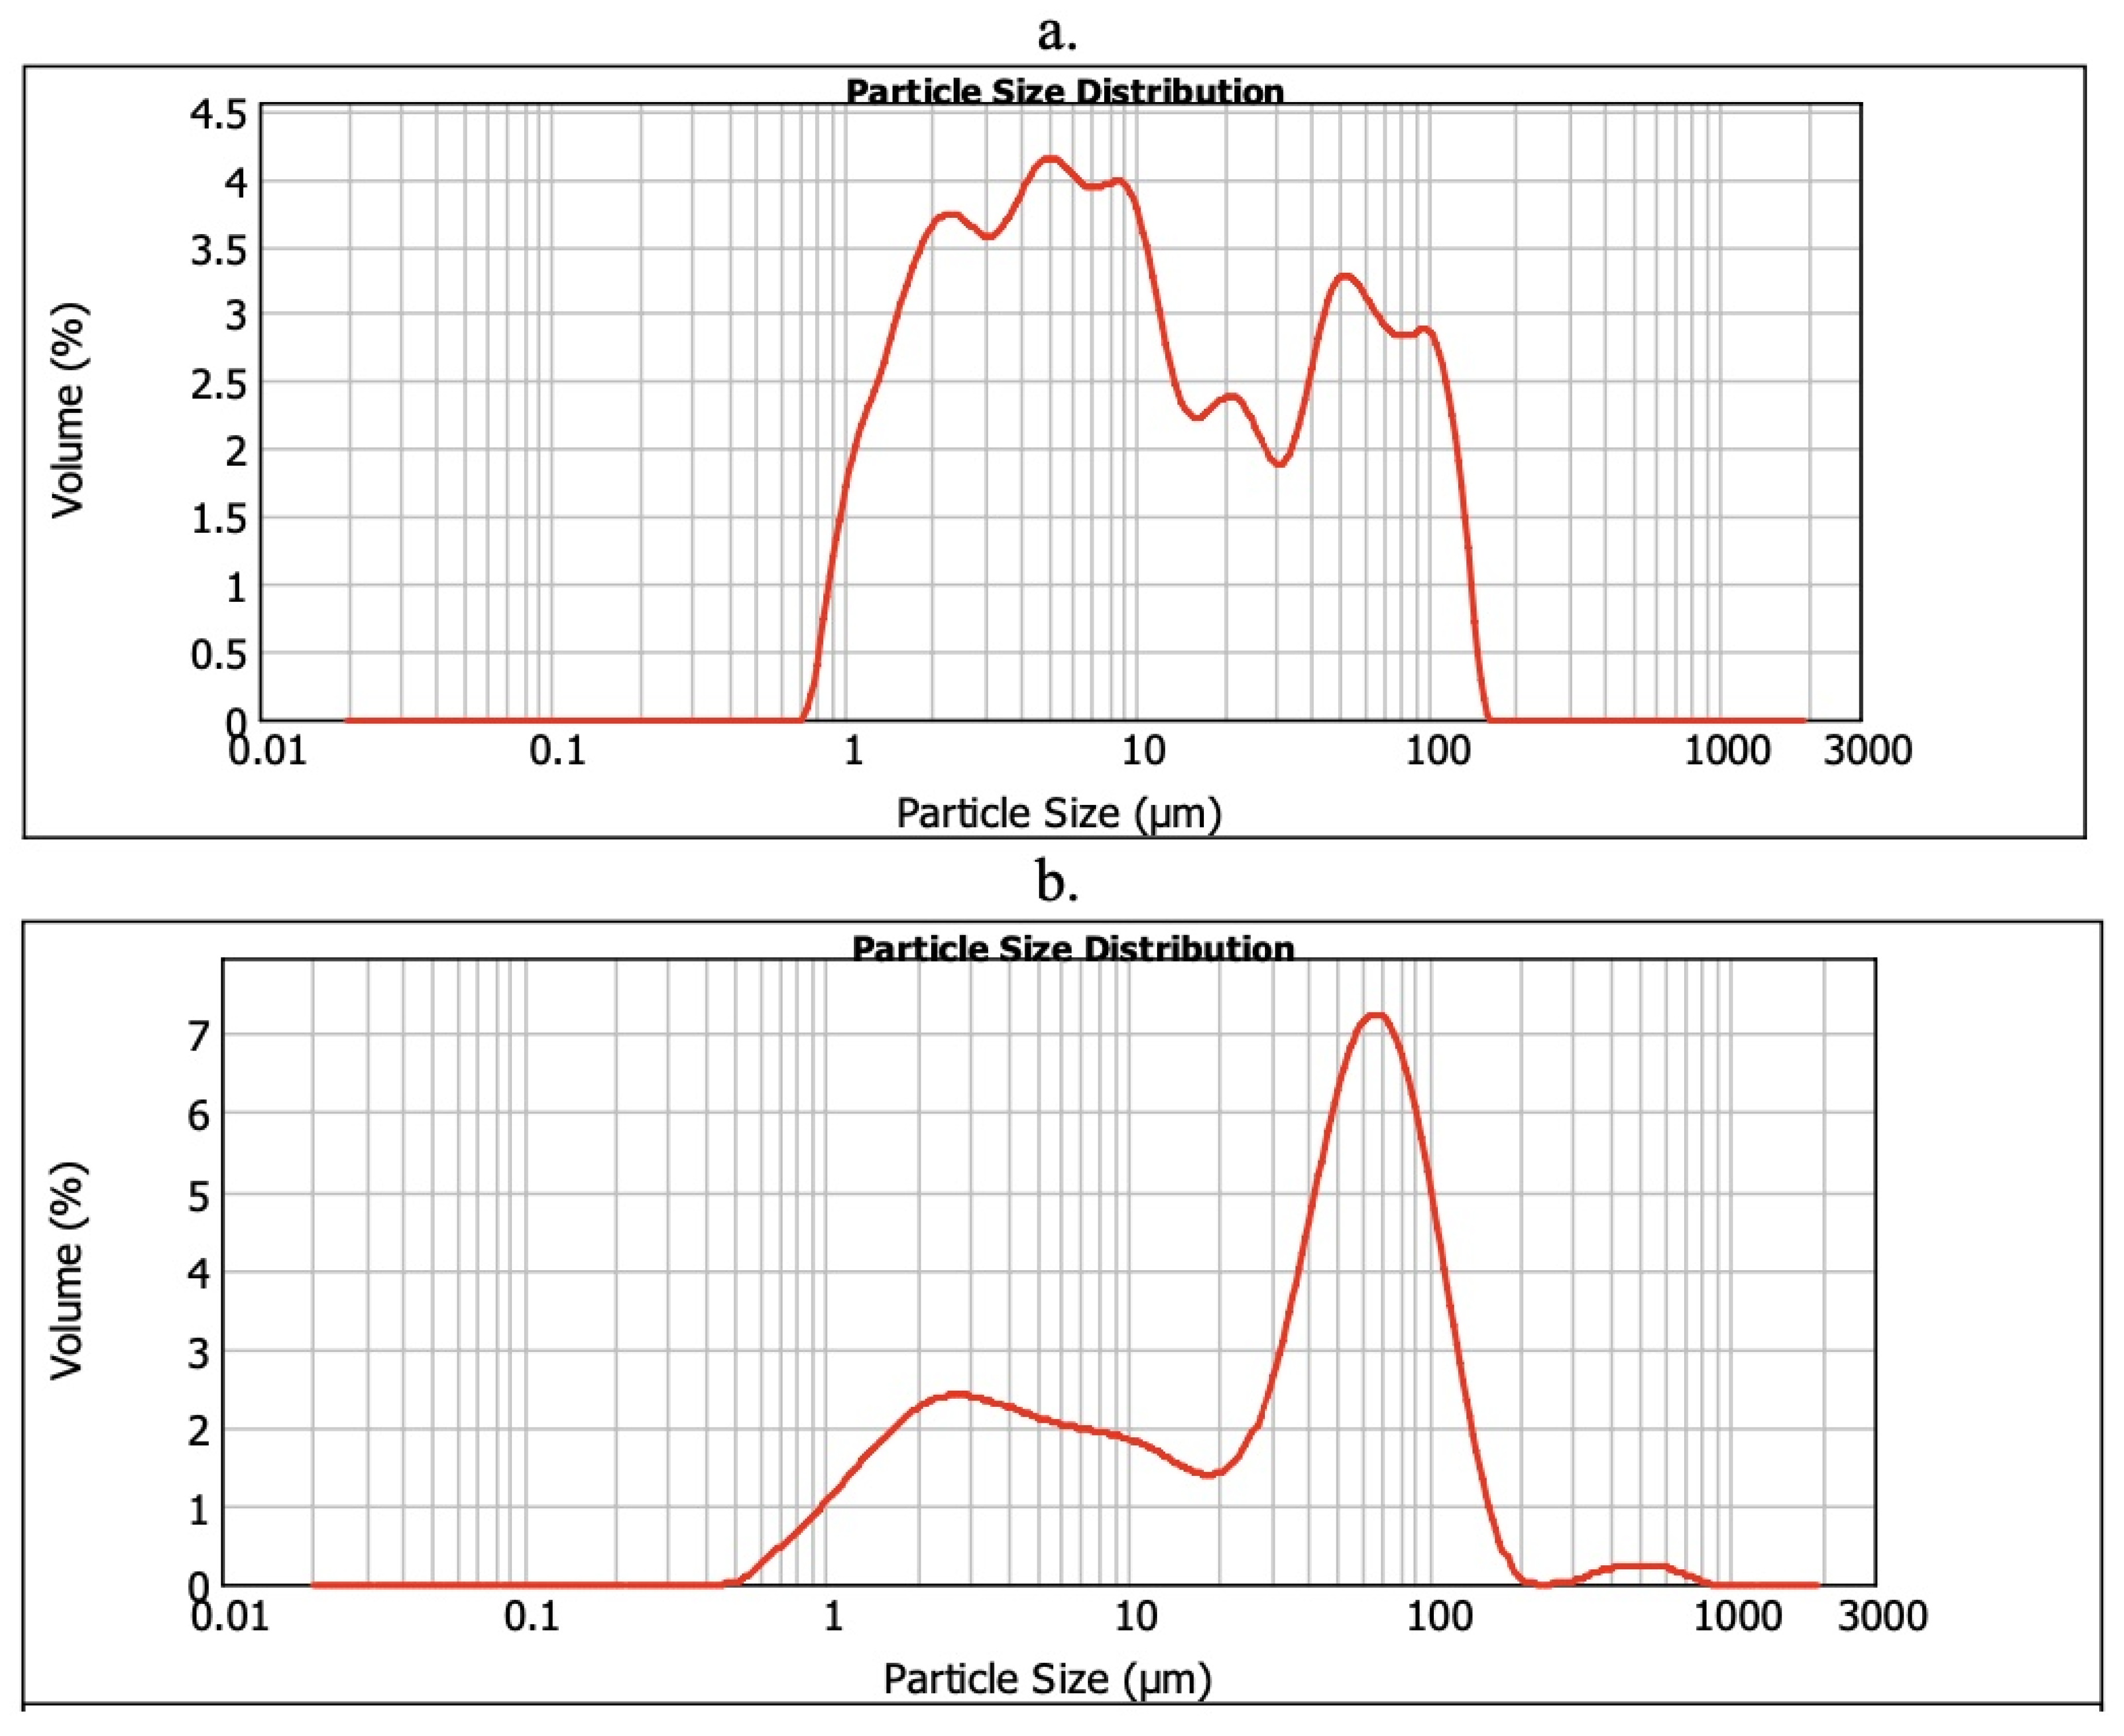
Figure 11.
Micrographs of the CP+FAC stored at 35 °C-N2 for storage times: a. day 0 and b. day 180.
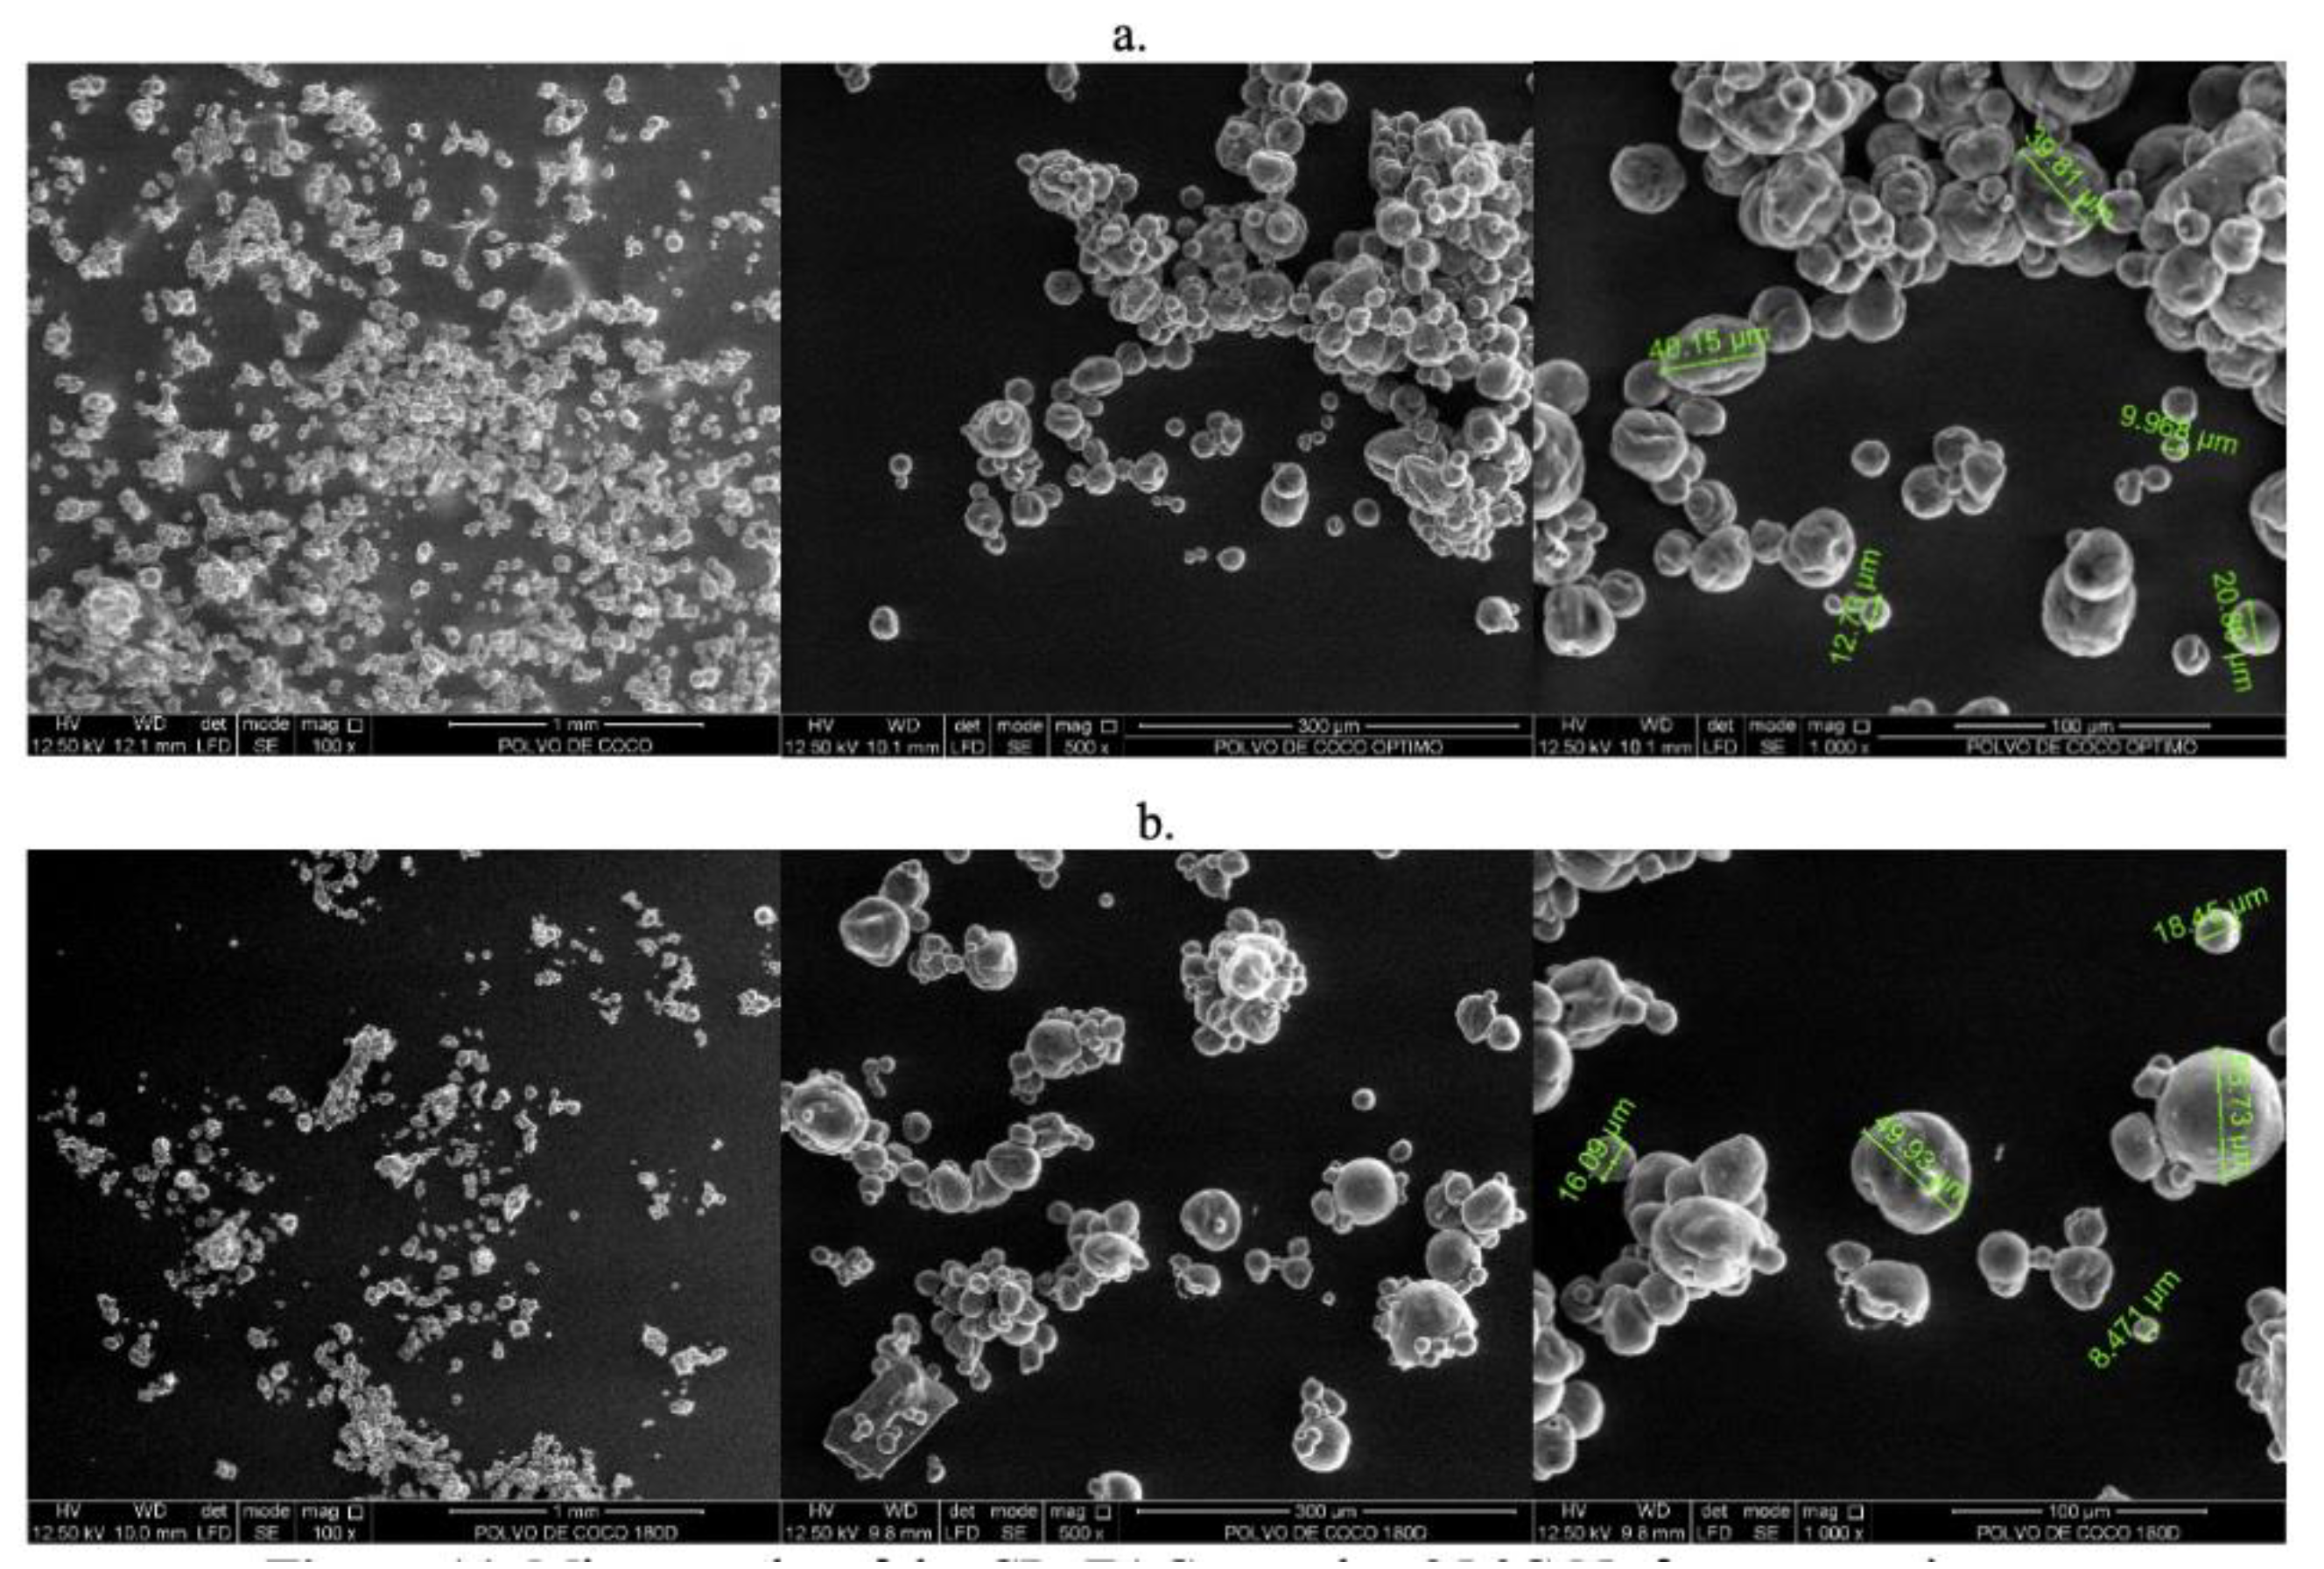

Table 1.
Mathematical models used to fit the water sorption isotherms in CP+FAC.
| Model | Mathematical expression |
|---|---|
| GAB [19] | |
| BET [20] | |
| OSWIN [21] | |
| SMITH [22] | |
| HALSEY [23] | |
| HENDERSON [24] | |
| CHUNG and PFOST [25] | |
| PELEG [26] | |
| CAURIE [27] |
Where: moisture content (Xw) in dry base; mo: humidity of the monolayer; a, b, c1, c2, m1, m2, n1, n2, A, B, C, K: are adjustment parameters of each model, which were estimated with the Polymath® program version 6.0; T: Temperature K.
Table 2.
Statistical parameters of the goodness of fit of the most precise mathematical models.
| Model | Variable | 15 °C | 25 °C | 35 °C |
|---|---|---|---|---|
| GAB | C | 2.64 | 4.261 | 1.811 |
| mo | 0.0715 | 0.0573 | 0.0364 | |
| K | 0.921 | 0.93 | 0.941 | |
| R2 | 0.988 | 0.994 | 0.997 | |
| ERSM | 0.53 | 0.415 | 0.266 | |
| BET | C | 6.555 | 5.921 | 6.365 |
| mo | 0.0254 | 0.0254 | 0.0234 | |
| R2 | 0.987 | 0.994 | 0.984 | |
| ERSM | 0.296 | 0.294 | 0.347 | |
| PELEG | A | 0.467 | 0.103 | 0.076 |
| B | 1.308 | 1.18 | 1.009 | |
| C | 0.118 | 0.395 | 0.294 | |
| D | 10.668 | 9.249 | 6.639 | |
| R2 | 0.998 | 0.997 | 0.997 | |
| ERSM | 0.198 | 0.199 | 0.276 |
Disclaimer/Publisher’s Note: The statements, opinions and data contained in all publications are solely those of the individual author(s) and contributor(s) and not of MDPI and/or the editor(s). MDPI and/or the editor(s) disclaim responsibility for any injury to people or property resulting from any ideas, methods, instructions or products referred to in the content. |
© 2024 by the authors. Licensee MDPI, Basel, Switzerland. This article is an open access article distributed under the terms and conditions of the Creative Commons Attribution (CC BY) license (http://creativecommons.org/licenses/by/4.0/).
Copyright: This open access article is published under a Creative Commons CC BY 4.0 license, which permit the free download, distribution, and reuse, provided that the author and preprint are cited in any reuse.


