Preprint
Article

This version is not peer-reviewed.

Physiological factors Influencing Climate-Smart Agriculture: Daylength-Mediated Interaction Between Tillering and Flowering in Rice

A peer-reviewed article of this preprint also exists.

Submitted:

26 November 2024

Posted:

27 November 2024

You are already at the latest version

Abstract

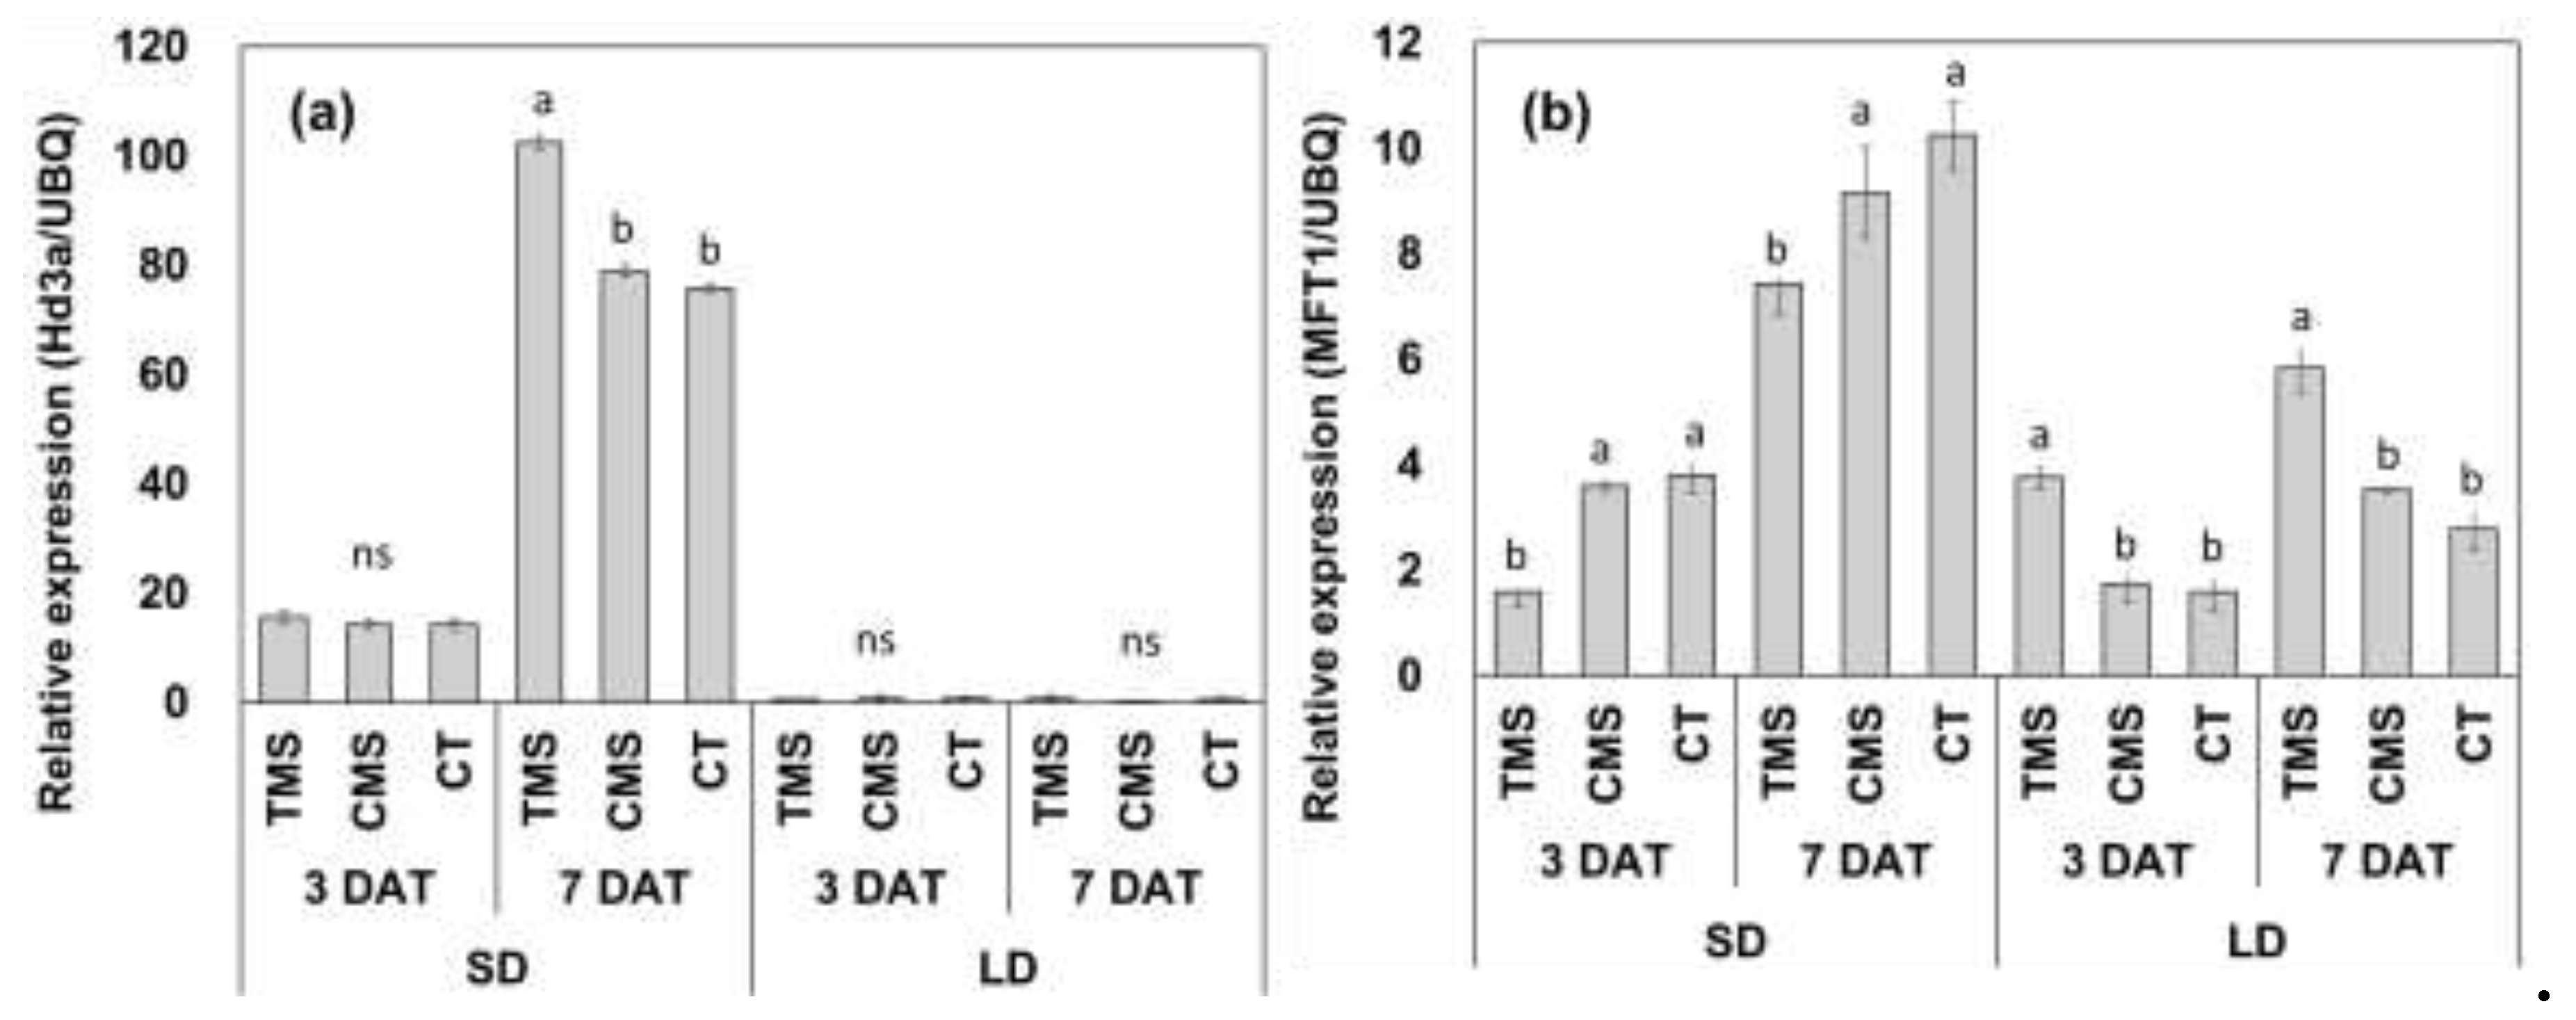
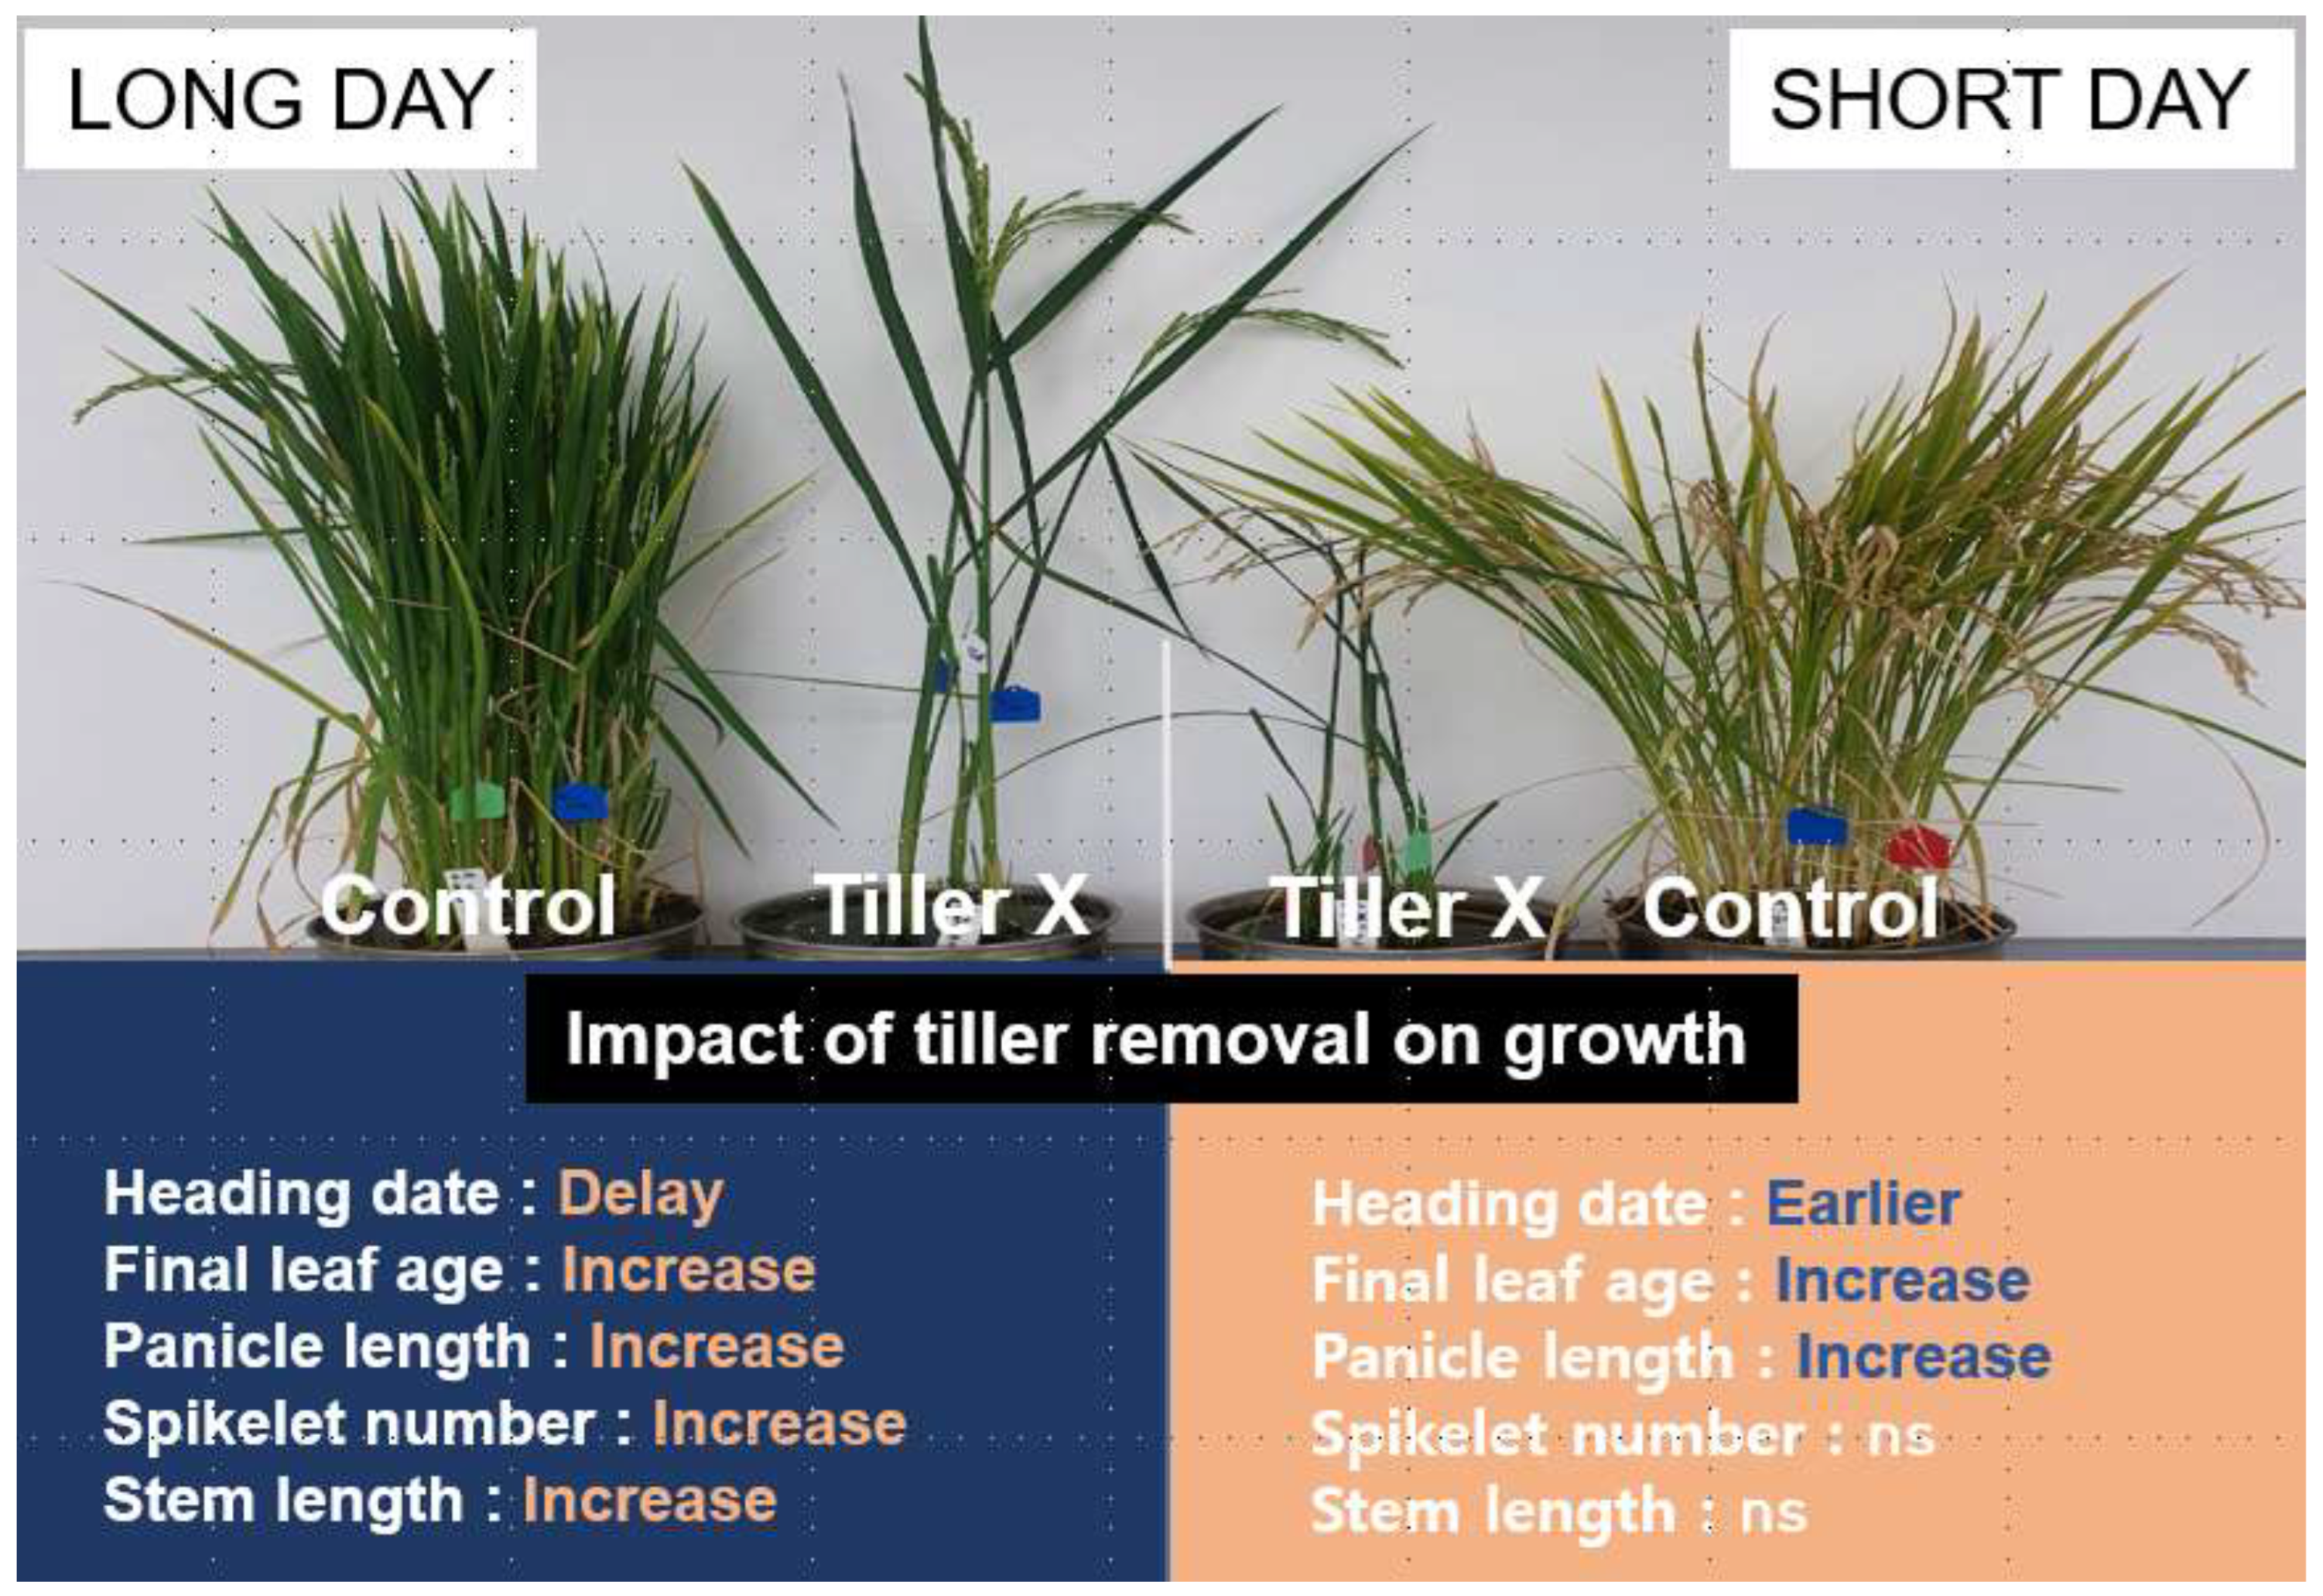
Control of rice tillering and flowering is crucial for reducing greenhouse gas emissions from paddy fields, a key goal of climate-smart agriculture. However, the interaction between tillering and flowering remains debated and poorly understood. We subjected plants of the rice cultivars ‘Saenuri’ and ‘Odae,’ to short- and long-day conditions after removing their tillers, and observed growth and flowering responses. Different daylength conditions yielded contrasting results. Plants in tiller-removal groups grown under short days flowered early compared to controls, whereas the opposite was observed under long days. Further, the expression of the florigen gene, Hd3a, which promotes flowering, increased in the tiller-removal group under short days compared to the control. Conversely, the expression of the OsMFT1 gene, which delays flowering and increases the number of spikelets per panicle, was upregulated under long days, and the phenotypic results were consistent. The number of spikelets per panicle in ‘Saenuri’ and ‘Odae’ plants in the tiller-removal groups under long day conditions increased approximately 3.4 and 2.2 times, respectively, compared to the corresponding control groups. Our findings on tillering and flowering responses to daylength provide a new perspective for the interpretation of studies related to the interaction between tillering and flowering in rice.

Keywords: 
;  ;  ;  ;  ;  ;  

1. Introduction

In the realm of agriculture, particularly in livestock and crop production, methane is a greenhouse gas that contributes significantly to global warming [1,2]. Methane production is primarily favored by a reducing state of the soil, as is the case during rice cultivation under waterlogged conditions [3]. Therefore, alternative cropping schemes, including alternate wetting and drying systems of rice intensification, and other such water management practices were tested for their potential to reduce soil methane emissions [4,5].
Soil methane emission into the atmosphere occurs primarily through the aerenchyma tissue of rice tillers [6] and can be reduced by shortening the growth period [3]. Therefore, controlling the extent of rice tillering and the tiller-growing period is imperative for reducing methane emissions and promoting climate-smart rice production.
Rice tillering exhibits considerable variation, attributed to both environmental and genetic factors [7,8]. Furthermore, the number of panicles associated with tillering significantly impacts annual yield because of the large variation among yield components [7,9]. Factors that affect rice tillering include crop management practices such as planting density, fertilization rates, and irrigation depth. In addition, environmental factors such as light intensity and quality, temperature, and daylength also exert marked effects of rice tillering [10-13]. Particularly, daylength is a critical environmental factor influencing the development of tillers and plays a major role in regulating growth duration through phenological responses [14,15]. Specifically, the optimum daylength for the promotion of tillering contrasts with that which accelerates flowering and shortens the vegetative growth period [16,17,18,19,20].
Floral induction is essential for flowering [21,22], and as it initiates a shift toward reproductive growth, it serves as a key regulator of the vegetative growth period [23,24,25]. Further, because tillering mainly occurs during the vegetative growth period, it is strongly influenced by developmental processes such as floral induction [13]. Specifically, FLOWERING LOCUS C (FLC) and FRIGIDA (FRI), two floral repressors in the vernalization pathway, reportedly regulate tillering in Arabidopsis thaliana [13,26], and similar related studies were reported in other species [27,28]; thus, in wheat, for example, tillering and spikelet number are influenced by the overexpression of five FLOWERING LOCUS T (FT)-like genes [29].
Since the initial discovery of the MOC1 gene as a crucial regulator of rice tillering, several studies were conducted at both physiological and molecular levels [30,31]. Thus, for example, the correlation between vegetative growth (e.g., tiller and leaf development depending on nitrogen supply) and flowering time was investigated [8,30]. Additionally, the involvement of plant hormones in shoot branching induction, specifically cytokinin and auxin, was reviewed [32]. Further, studies have highlighted the significance of strigolactone in suppressing the outgrowth of tiller buds [32,33,34].
At the molecular level, various studies confirmed the interaction between tillering and flowering responses using gene-edited mutants related to these processes [34,35,36,37,38,39]. Similar to the increase in tillering under conditions of delayed flowering [15,19,40], research has shown that tillering increases concomitantly with the overexpression or knockdown of genes, e.g., OsRFL, OsSOC1, and OsLUX [34,41,42]. Conversely, other studies have tillering to decrease along with delayed flowering [35,38]. However, to date, few studies have addressed these conflicting results.
We hypothesized that this lack of consistency among research reports is due to the differences in plant development (e.g., tillering, panicle formation, and flowering) that result from the specific daylength conditions used in different studies. Although the florigen activation complex (FAC) was found to affect growth phenomena such as tillering, in addition to flowering and floral induction [37], the interaction between tillering and flowering under specific daylength conditions has not been elucidated. Therefore, in the present study, we aimed to analyze the interaction between tillering and flowering responses in two rice cultivars by artificially restricting tillering and growing plants under controlled daylength.

2. Materials and Methods

2.1. Ethics Statement

This study was performed in accordance with Institute-approved guidelines and regulations. The test varieties were provided by SeoYeong Yang of the Rice Production and Physiology Division of the National Institute of Crop science (NICS). We obtained permission from the NICS to use these varieties (https://www.nics.go.kr/apo/breed.do?m=100000128&homepageSecod=nics).

2.2. Experimental Materials and Design

A pot experiment was conducted using a completely randomized design incorporating two factors of variation (daylength and tiller removal) at two levels of variation each (short and long day, and with and without tillers removed). Two experiments were conducted in a controlled environment facility (ENT Inc., Boocheon, Korea) at the National Institute of Crop Science in Jeonju, South Korea (35°49ʹ19ʺ N, 127°8ʹ56ʺ E), where light intensity, temperature, and humidity can be artificially controlled (Figure. S1). The lighting chamgers utilized in this facility are capable of controlling temperature, humidity, light length, and light intensity (Figure S1). Each chambers has a floor area of 3.8m2(2.4 in width and 1.6m in length) with a height of 2m. Lights were turned on at 7:30 h regardless of daylength treatment, such that daylength was adjusted by the lights-off time. Two rice cultivars representing ecotypes with different maturation times were used, namely, early maturing ‘Odae’ (Oryza sativa ssp. japonica, IT218242) and mid-late maturing ‘Saenuri’ (Oryza sativa ssp. japonica, IT235281).
Fifteen-day-old seedlings of both varieties were transplanted into 1/5000 a Wagner pots at a density of three plants per pot. A composite slow-release fertilizer was applied with 9, 4.5, and 5.7 kg nitrogen, phosphate, and potassium per 1000 m2, respectively, at a rate based on the area used by three plants (i.e., 0.042 m2; planting distance: 30 × 14 cm) instead of the entire pot area. Tillers were removed every 2–3 d starting 7 d after transplanting, and water was continuously applied at a depth of 2–3 cm or more. A plant with tillers removed is shown in Figure S2. These procedures were performed as previously described [15,25].

2.3. Experiment 1: Preliminary test of Growth And Heading Responses To Tiller Removal Under Short-Day Conditions

Temperature was set to 22 °C (maximum 28 °C/minimum 18 °C) and daylength was fixed to relatively short conditions (12 h 30 min light/11 h 30 min dark) from sowing to the heading stage [22,43]. The light intensity was set at 700 µmol m-2 s-1 photosynthetically active radiation (PAR) and the relative humidity was set at 65%.

2.4. Experiment 2: Analysis of Growth And Heading Upon Tiller Removal Under Short- And Long-Day Conditions

Before tiller removal, the temperature was set to 25 °C (maximum 30 °C/minimum 20 °C) for 22 d (15 d after sowing and 7 d after transplanting), and to minimize the induction of photosensitivity, daylength was set to 15 h [22,43], which is slightly longer than that generally used as a long-day condition (14 h 30 m light/9 h 30 m dark). The long-day condition was set before tiller removal to differentiate the photosensitive response to daylength conditions after tiller removal. Daylength conditions after tiller removal were matched between short (12 h light/12 h dark) and long (14 h 30 m light/9 h 30 m dark) days [22,43], and the temperature was set to 28 °C (maximum 33 °C/minimum 23 °C).
After the heading stage date, conditions were adjusted to 25 °C (maximum 30 °C/minimum 20 °C) and long day (14 h light/10 h dark) during the ripening stage. Temperature and daylength were changed again after the ripening stage , as 28 °C is deemed excessively high for the ripening stage, could present challenges in accurately evaluating grain weight. In addition, different daylength conditions can affect grain weight; therefore, we set the same daylength condition again for the ripening stage. These conditions were set to observe the effect of temperature and daylength up to the heading stage. The light intensity was set at 700 µmol m-2 s-1 PAR and the relative humidity at 65%.

2.5. Growth and Development Measurements

Plant height was measured from the ground to the top of the apical leaf tip. Stem length was measured from the ground to the uppermost internode. Leaf age was expressed as leaf number on the main stem. In both experiments, the heading date was calculated as the number of days (growth period) after transplanting, before panicle emergence from the leaf sheath. Panicle emergence was examined daily from 1300 to 1400 h. Fifteen plants were used to analyze heading date and growth. These procedures were performed as previously described [15].

2.6. RNA Extraction and Gene Expression

Two plant organs were sampled, namely the 2nd and 3rd leaves of the main stem and tiller, immediately frozen under liquid nitrogen, and stored at −80 °C until RNA extraction. Nine rice plants were analyzed per treatment, three of which were sampled for one repetition and used for analysis in three repetitions for real-time polymerase chain reaction (RT-PCR). Plant material for RNA extraction was sampled at 1000 h (2.5 h after lights were turned on) because Hd3a, RFT1, Ehd1, Ghd7, and MFT1 reportedly maintain a high expression level for 0–4 h after plant exposure to light [44]. Total RNA was extracted according to the protocol of Chang et al. [45]. cDNA synthesis was performed using a Primescript RT reagent kit with gDNA eraser (TaKaRa Bio, Inc., Kusatsu, Japan). For RT-PCR, SYBR Green (SYBR Realtime PCR Master Mix, Toyobo, Japan) was used as a fluorescent dye. The analysis was conducted using a Roter-Gene 6000 (Corbett Research, Australia). Primer sequences are listed in Table S1. The procedures were performed as previously described [15].

2.7. Statistical Analysis

Data were analyzed using R software (v.2.2), in which analysis of variance (ANOVA) was conducted, followed by Duncan’s multiple range test to evaluate significant differences at P < 0.05. The following equation (1) [46] was used to model the development of plant height, leaf age, and tiller number based on the number of growing days from transplanting:
F = H m a x   o r   L m a x   o r   T m a x 1 + e t t m * r F
where Hmax is the final plant height; Lmax is the final leaf age; Tmax is the final number of tillers; rF is the rate of development up to final plant height, leaf age, or tiller number; t is the number of days after transplanting; and tm is the timepoint at which half of the final plant height or leaf age or tiller number was achieved, each referring to the timepoint when plant height, leaves, or tillers reached the maximum rate of development; in turn, Hmax, Lmax, Tmax, rF, and tm are coefficients determined by nonlinear regression analysis performed using Sigmaplot v11.1. These procedures were performed as previously described [15].

3. Results

3.1. Daylength-Mediated Effects of Tiller Removal On Plant Growth and Development

Daylength is expected to vary during rice cultivation. In this study, we investigated the variations in growth and development of the main stem, with and without tillers, depending on daylength conditions. The data showed that under long days plant height (Hmax) tended to increase in both cultivars in the tiller-removal treatment (TR) group compared to that in the control. However, under short days, which supposedly promote flowering [15], Hmax decreased in the TR group for ‘Saenuri’ but did not change for ‘Odae’ (Figure 1a, b; Table 1). Under short days, Hmax of ‘Odae’ was 89.8 and 89.9 cm in the control and TR groups, respectively, whereas those of ‘Saenuri’ were 75.3 and 72.4 cm in the control and TR groups, respectively. Furthermore, under long days, the rate of increase in plant height (rF) was lower in the TR than that in the control group, although the period of increase (tm) in plant height was prolonged in the TR group, compared to that recorded in the control group (Figure 1a,b; Table 1). However, under short days, rF was higher in the TR than in the control group; concomitantly, tm was shorter for ‘Saenuri,’ whereas in ‘Odae,’ it differed slightly compared with that observed under long days.
Meanwhile, Lmax of the main stem was higher in the TR group than that in the control for both varieties across the experimental conditions (Figure 1c,d; Table 1). Evidently, Lmax was more influenced by the period of leaf age (tm) than by the rate of leaf age (rF), which varied between daylength conditions. Specifically, under short-day conditions, it was slightly lower in the tiller removal treatment in both cultivars; however, it differed between the two cultivars under long days (Figure 1c,d; Table 1). In contrast, tm was longer in the tiller-removal treatment groups under all conditions for both cultivars (Figure 1c,d; Table 1). Additionally, Tmax was lower under short than under long days for both cultivars (Figure 1e,f; Table 1).
Differences in growth at the heading stage, i.e., after vegetative growth was completed, in response to tiller removal as per daylength are shown in Figure 2. Similar to the results described for plant height (Figure 1a,b), stem length was greater in the tiller removal than in the control group under long days, whereas no difference was observed under short days (Figure 2a,b). Panicle length was only slightly greater in the tiller removal treatment under short days but showed a substantial increase under long days (Figure 2c,d).
Overall, the TR treatment increased vegetative growth and biomass of the main stem under long days; however, under short days, biomass was either smaller or did not significantly differ between the TR and control treatments (Figure 1, 2; Table 1).

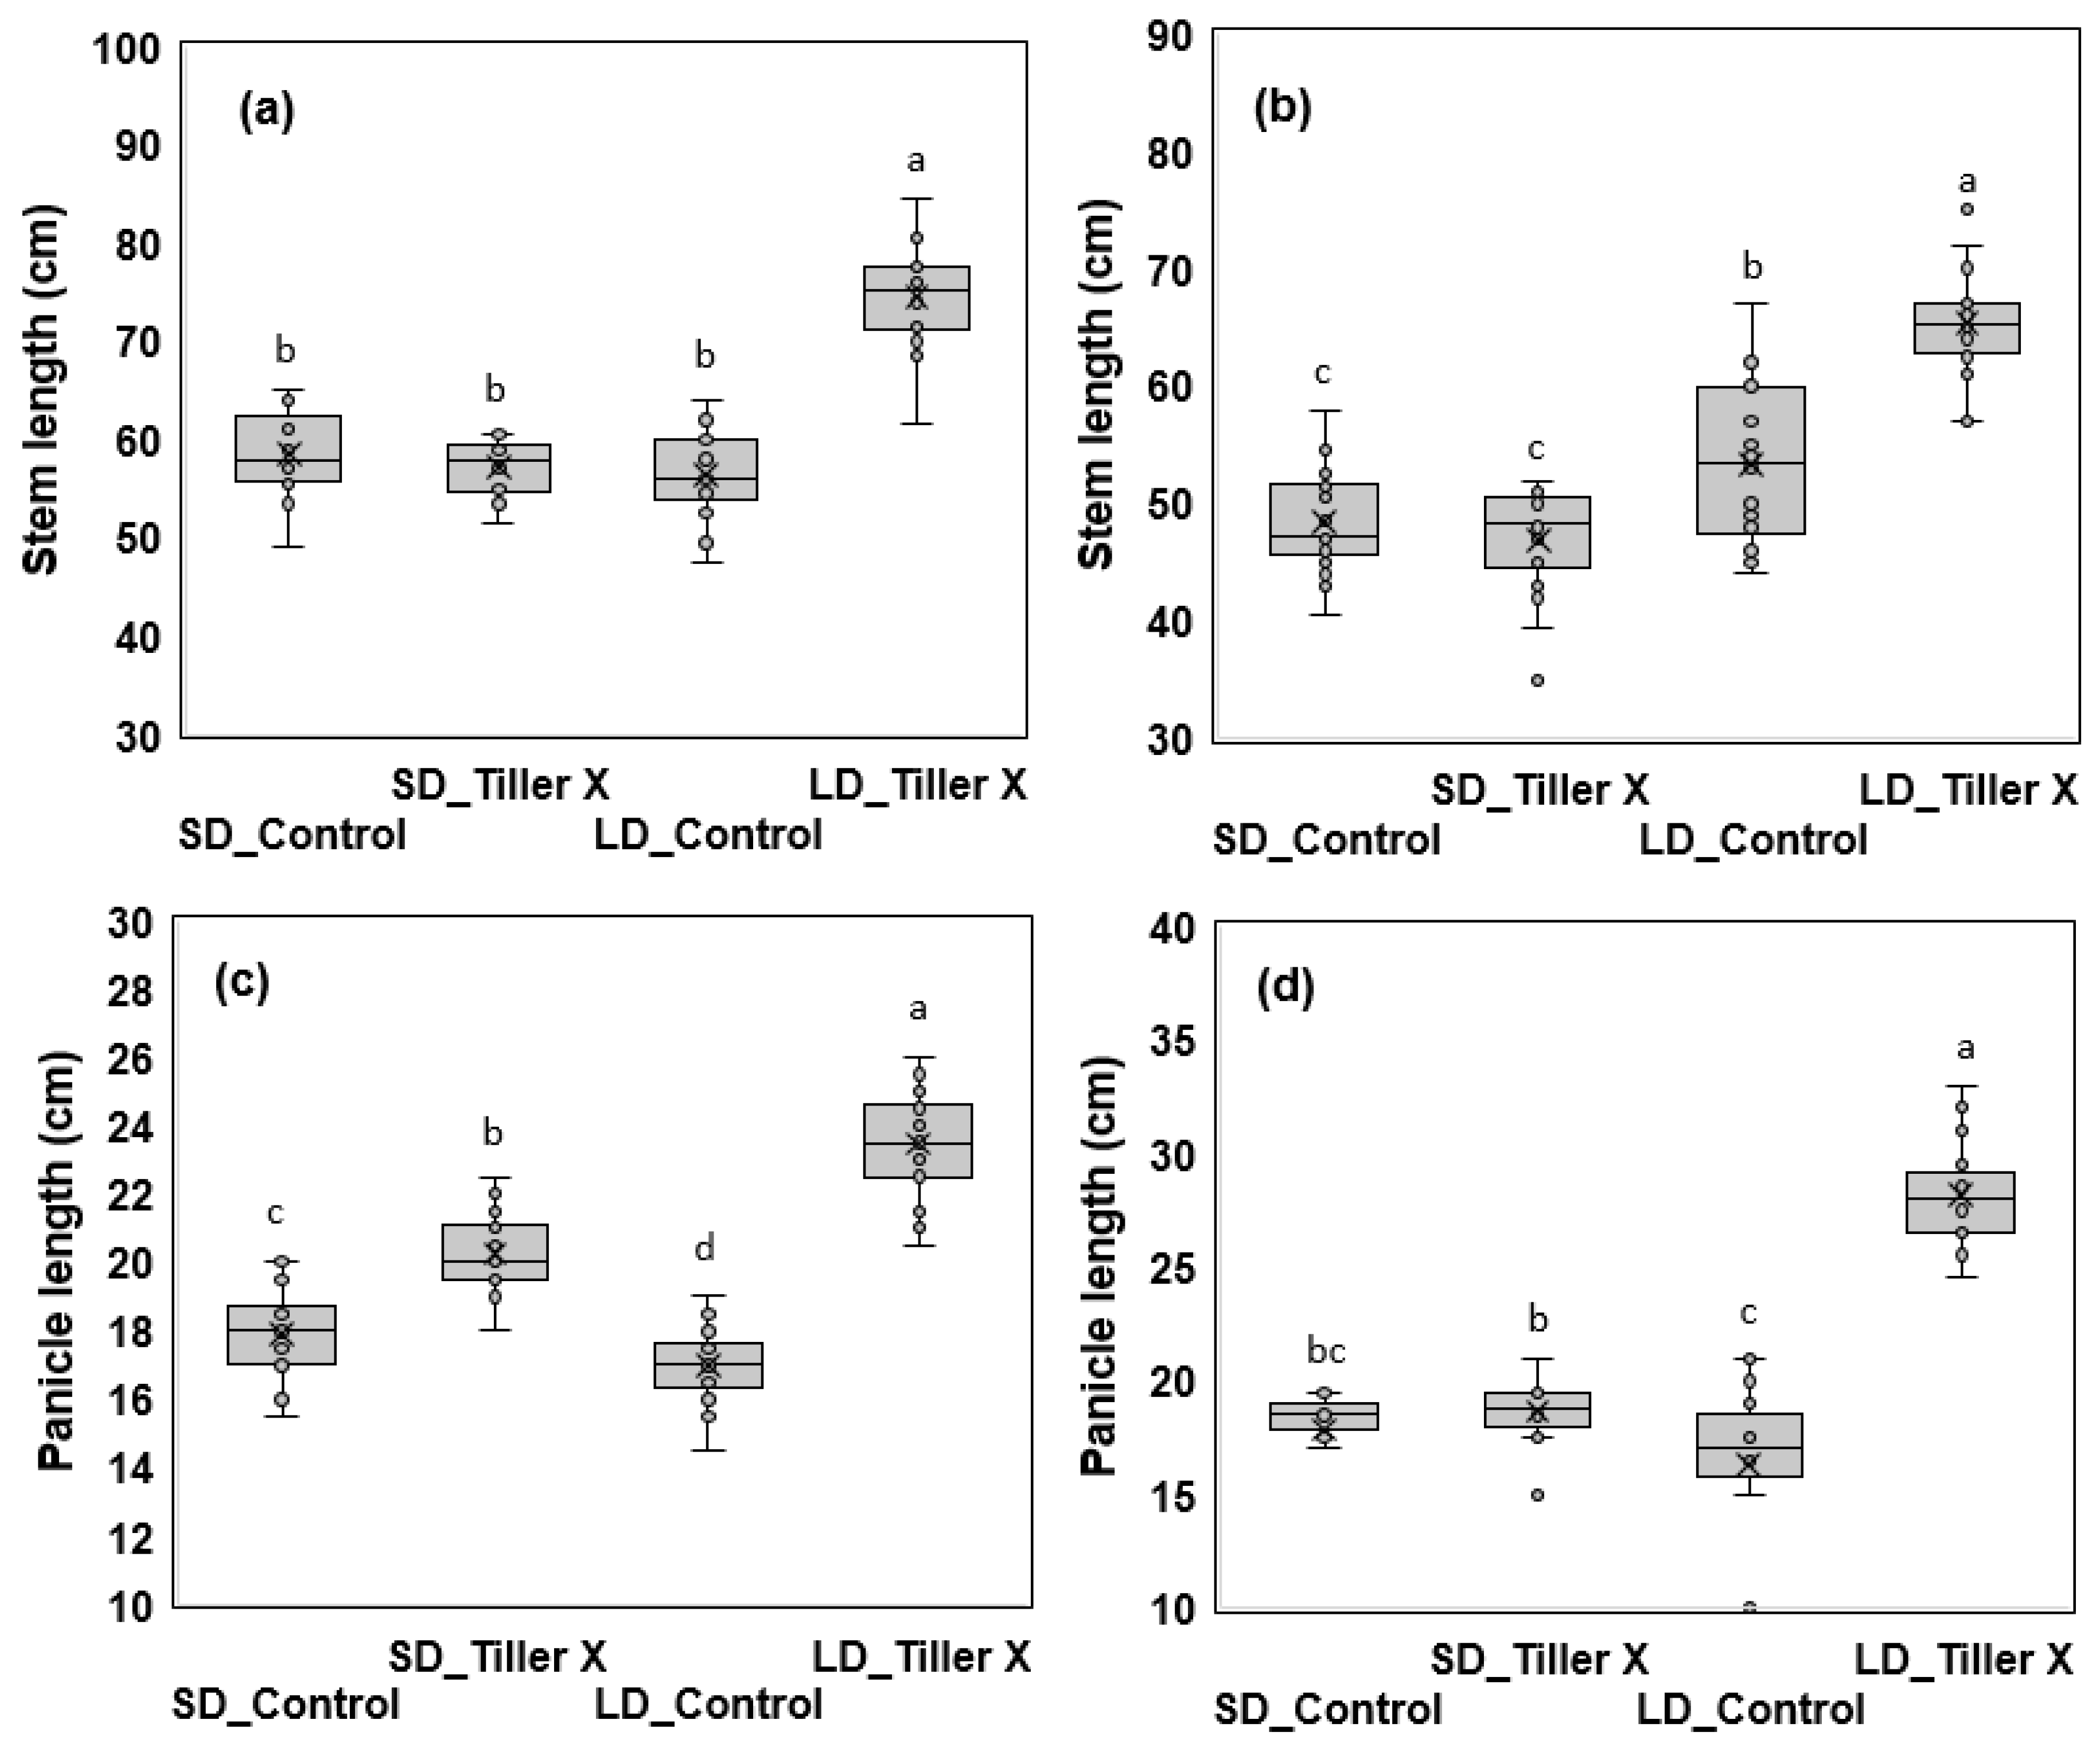
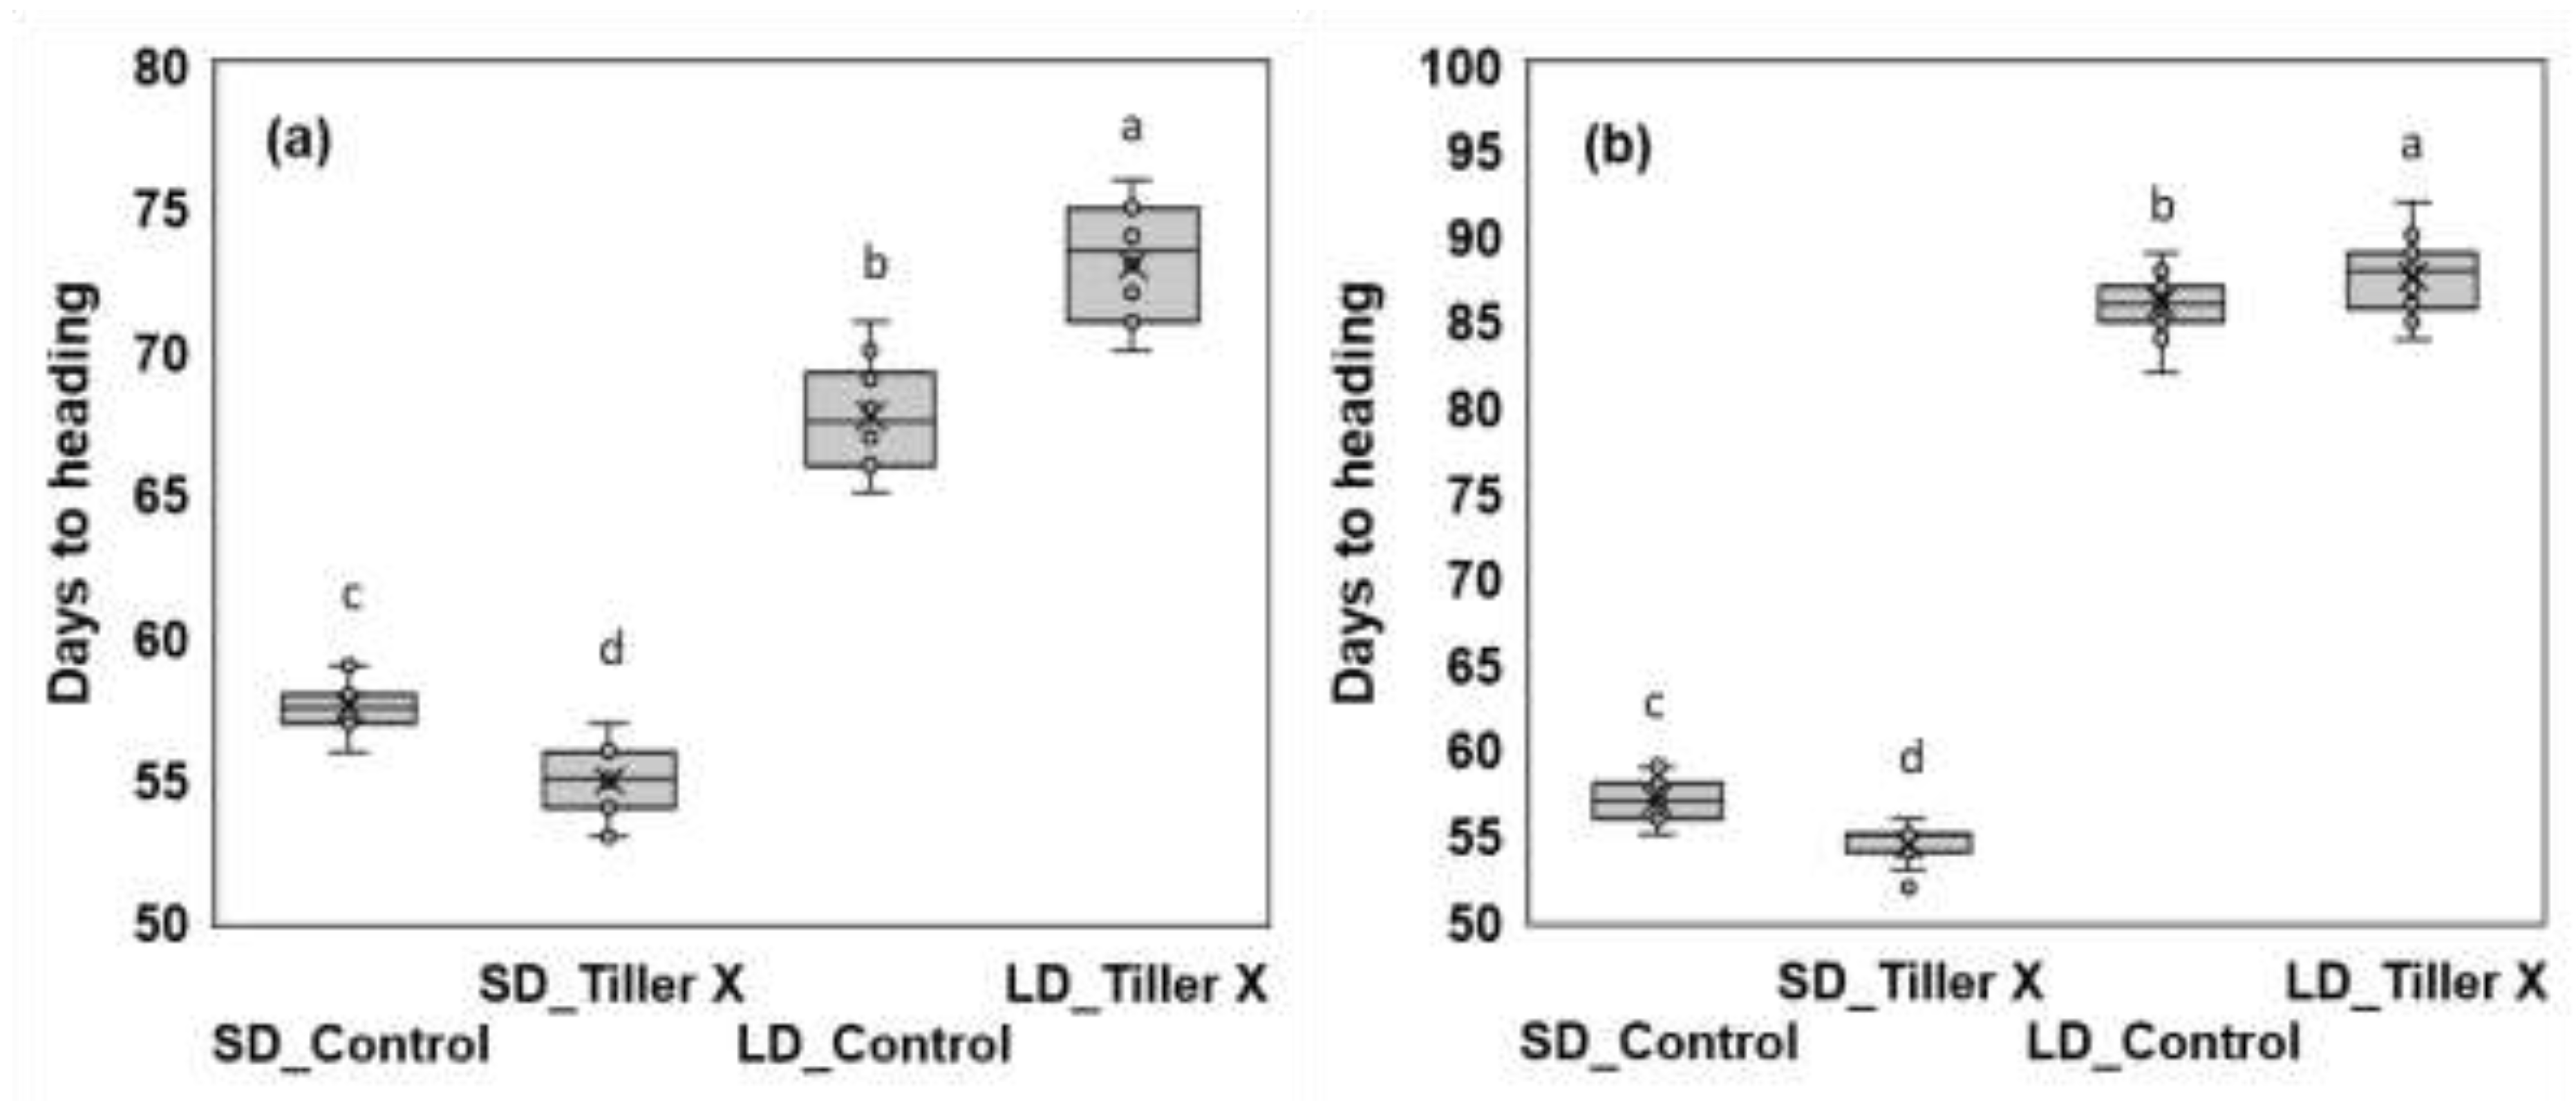
3.2. Effect of Tiller Removal on Heading Response and Yield Components

When other relevant factors, such as fertilization, are controlled, tiller development is generally enhanced as a result of the longer growth duration [16,19,20]. Under the short-day conditions used in Experiment 1, days to heading (DTH) was shortened in the TR compared to that in the control treatment group for both cultivars (Figure S3). Further, in Experiment 2, we evaluated DTH under two daylength conditions (Figure 3) and found that under short days, DTH was shortened in the TR compared to that in the control group, similar to the results of Experiment 1. Conversely, DTH was longer in the TR than in the control group under long days (Figure 3). The ANOVA revealed that DTH did not show any significant difference due to TR but showed a highly significant difference as a result of the interaction between daylength and TR (Table S3).
Among yield components, spikelet number per panicle (SPP) showed the largest change associated with TR and daylength treatments (Table 2). In particular, SPP was lower under short than under long days for both control and TR groups (Table 2). Additionally, SPP showed a greater daylength-mediated variation in the TR than in the control group (Table 2). Furthermore, in the ‘Saenuri’ cultivar, SPP was the lowest (62.2) and highest (235.0) in the TR group under short and long days, respectively, with a 3.78-fold difference between the two extreme values (Table 2). The proportion of ripened grain slightly decreased in the TR treatment, particularly under short days, in which case SPP actually increased significantly (Table 2). Further, 1000-grain weight did not significantly differ between the experimental groups for either cultivar (Table 2). Similar results were found for Experiment 1 (Table S2).
Florigen gene Hd3a-expression levels significantly increased under short than under long days at 3 and 7 d after treatment (DAT, Figure 4a). At 7 DAT under short days, Hd3a levels were 102.4, 79.0, and 75.8 in the main stem of the treatment (TMS), control (CMS), and in the tillers of the control (CT, Figure 4a) groups, respectively. In addition, the expression of Hd3a in the main stem of the TR group tended to increase under short days and increased over time after TR treatment. However, under long days, Hd3a expression decreased compared to its level before daylength treatment, with no discernible difference between TR groups.
The MOTHER OF FT AND TFL1 (MFT1) gene reportedly increases SPP and is associated with delayed flowering [47]. Similar to the heading and SPP responses induced by daylength and TR treatments, MFT1 expression differed considerably between daylength conditions. In particular, the MFT1 expression level was higher in the CMS and CT than in the TMS groups under short days (Figure 2c); however, the opposite trend was observed under long days (Figure 2c).
Other flowering-related genes were analyzed together (Figure S4). Thus, for example, RFT1, which is another florigen gene that controls flowering under short and long days [22] showed relative expression levels of 61.1, 55.5, and 55.1 in the TMS, CMS, and CT groups, respectively, under short days (Figure S4a). Similarly, the relative expression levels of Ehd1, which enhances the expression of Hd3a and RFT1 under short-day conditions [19], were 20.1, 19.2, and 14.7 in the TMS, CMS, and CT groups, respectively (Figure S4b). Meanwhile, the relative expression levels of Ghd7 under long days, which suppresses the expression of Hd3a and RFT1 under such conditions [22], were 1.9, 1.7, and 1.4 in the TMS, CMS, and CT groups, respectively (Figure S4c).

4. Discussion

Rice is grown over a wide range of latitudes globally; therefore, the plant grows under different daylength conditions depending on the specific location. Even within the same region, it will grow under different daylength conditions depending on climate change or planting season [48].
Tillering is greatly affected by temperature and daylength [7]. Generally, short days and high temperature lead to earlier flowering as a result of the restriction of tillering imposed by the shortened vegetative growth period [10,49]. However, to date, the interaction between tillering and flowering has not been fully unraveled and in fact remains a controversial issue.
Several studies reported a negative relationship between tillering and flowering 7,10,18,20]. The FAC is a structure in which Hd3a binds to 14-3-3 proteins that act as intracellular receptors, and OsFD, a transcription factor in the bzip region, is attached to this complex and promotes floral induction [37]. These FACs activate OsMADS 14 and 15, genes located downstream from Hd3a that promote floral formation and development [37]. However, other OsFD-like transcription factors bound to FAC participate in lateral branching in the axillary meristem [41] and leaf development [50]. Therefore, Hd3a promotes lateral branching in the axillary meristem and leaf development over floral induction [37]. In addition, OsLUX-overexpressing mutants show reduced photoperiod sensitivity and a prolonged juvenile phase, which in turn results in an increased number of tillers and delayed heading 42].
However, tillering and flowering were also reported as positively correlated [35,38]. The number of tillers reportedly increases with flowering induced by the overexpression of OsRFL, which regulates the flowering activator OsSOC1. Conversely, RFL knockdown results in the restriction of development of secondary tillers and panicle branches, and delay in flowering [35]. Similarly, when the expression of OsWDRa or OsTRx1 of the COMPASS-like complex was reduced by RNA interference under long and short days, secondary branches and grain number decreased concomitant with delayed heading [38].
Here, we found that these contrasting results may be influenced by daylength (Figure 5). The data showed that, when tillers were removed, the heading stage was reached earlier under short days, whereas it was delayed under long days (Figure 3, S2). Similar results were observed when tiller development was restricted [37]. It is likely that, in conjunction with the FAC complex, Hd3a may promote floral induction rather than lateral branching in the axillary meristem under conditions of restricted tiller development [37]. Based on this hypothesis, we analyzed the florigen Hd3a in the main stem and tiller under each of these treatment conditions (Figure 4a). We observed that under short days the relative expression levels of the florigen genes increased with treatment time. Furthermore, under short days the relative expression levels of both florigens (Hd3a and RFT1) in the main stem, from which the tillers were removed, increased compared to those in the control (Figure 4a, S3a). This change in gene expression may provide a novel insight into the early heading stage transition after tiller removal under short days.
Meanwhile, Hd3a had a less prominent role under long than under short days, whereas SPP increased markedly in the TR group under long days (Table 2). For cultivar ‘Saenuri’ under short days, SPP of the TR group (59.3) was less than that of the control group (62.2); however, under long days, SPP for the TR group (235) was 3.4 times greater than that of the control group (69.1) (Table 2). In general, the heading date is delayed in situations of expanding quantitative growth, such as an increase in SPP due to excessive nitrogen supply [51]. To interpret these results, we analyzed the expression of the MFT1 gene under each treatment, given its role in the formation of spikelets and branches while suppressing flowering [47]. In contrast to short-day conditions, the expression of MFT1 in CMS and CT groups decreased compared to that in the TMS groups under long days (Figure 4b). Further, the SPP of TMS groups increased under long days (Table 2). Therefore, the phenotype of rice plants, including heading date and SPP, corresponded to the expression of MFT1.
Summarily, under short-day conditions, in which case floral induction is optimal, Hd3a may play a more prominent role in floral induction of the main stem than that in tillering (i.e., lateral bud formation) in the TR treatment; thus, the time required to reach the heading stage may be shortened (Figure 2a). In contrast, the difference in SPP between TR and control groups under long days was significantly greater than that under short days. Additionally, the characteristics of the expression of the related gene, MFT1, also showed the same pattern; specifically, MFT1 expression significantly increased in the TR group than in the control group only under long days. Furthermore, the expression levels of MFT1 showed the opposite pattern to those of Hd3a and RFT1 under short days (Figure 2c). Meanwhile, the larger increase in SPP in the TR treatment was the primary factor contributing to the observed delay in flowering under long days, in contrast to that of the results obtained under short days.

5. Conclusions

It is essential to implement climate-smart crop production schemes to address the current challenges in meeting global food security requirements and effectively managing critical variables during the cropping season. Our study effectively identified the plant physiological traits required to optimize growth timing and shorten the rice tillering period and the time to flowering, while maintaining high crop productivity. In particular, our study revealed that tillering and flowering, whose study has frequently rendered conflicting results, showed daylength-dependent variability. Furthermore, our findings have the potential to contribute to a novel interpretation of these phenomena, ultimately enhancing the effectiveness of plant efforts to adapt to ongoing climate change by manipulating the daylength dependency of the interaction between rice tillering and flowering.

Supplementary Materials

The following supporting information can be downloaded at the website of this paper posted on Preprints.org, Figures S1: Facility at the national institute of crop science; Figures S2: Architecture of a ‘Saenuri’ rice plant; Figure S3: Number of growing days from sowing to heading stage in the two rice cultivars for control and tiller removal treatments; Figure S4: Changes in (a) RFT1, (b) Ehd1, and (c) Ghd7 mean relative expression levels in ‘Saenuri’ rice plants for the tiller removal treatment under contrasting daylength conditions; Table S1: List of primer sequences of Oryza sativa used for qRT-PCR; Table S2: Changes in rice plant growth and development traits after tiller removal; Table S3: Analysis of variance (ANOVA) for growth duration, stem length, and panicle length caused by tiller removal under contrasting daylength conditions.

Author Contributions

H.S.L. and J.Y.S. conceived and supervised the project. H.S.L. designed the experiments. H.S.L. and J.H.K. conducted the gene expression analysis and field experiments. H.S.L., S.Y.Y., S.H.J., and J.K.B. analyzed the data and drafted the manuscript. All authors discussed the results and contributed to the paper.

Funding

This work was supported by the Rural Development Administration National Research Project (Project Name: Investigation of metabolic mechanism controlling thermoresponsive flowering time at high temperature), Project No. PJ01486003.

Data availability

All data and analyses are included in the main manuscript or Supporting Information. The source data for Figures 1–5, Tables 1 and 2, Figures S1–S3, and Tables S1–S3 are provided as Source Data files.

Acknowledgments

We thank Editage for English language editing.

Conflicts of interest

The authors declare no conflicts of interest.

References

  1. Milich, L. The role of methane in global warming: Where might mitigation strategies be focused? Glob. Environ. Change 1999, 9, 179–201. [CrossRef]
  2. Broucek, J. Production of methane emissions from ruminant husbandry: A review. J. Environ. Prot. 2014, 5, 1482–1493. [CrossRef]
  3. Minami, K.; Neue, H.U. Rice paddies as a methane source. Clim. Change 1994, 27, 13–26. [CrossRef]
  4. Ly, P.; Jensen, L.S.; Bruun, T.B.; de Neergaard, A. Methane (CH4) and nitrous oxide (N2) emissions from the system of rice intensification (SRI) under a rain-fed lowland rice ecosystem in Cambodia. Nutr. Cycl. Agroecosystems 2013, 97, 13–27.
  5. Setyanto, P.; Pramono, A.; Adriany, T.A.; Susilawati, H.L.; Tokida, T.; Padre, A.T.; Minamikawa, K. Alternate wetting and drying reduces methane emission from a rice paddy in Central Java, Indonesia without yield loss. Soil Sci. Plant Nutr. 2018, 64, 23–30. [CrossRef]
  6. Kwon, Y.; Lee, J.Y.; Choi, J.; Lee, S.M.; Kim, D.; Cha, J.K.; Park, H.; Kang, J.W.; Kim, T.H.; Chae, H.G.; Kabange, N.R.; Oh, K.W.; Kim, P.J.; Kwak, Y.S.; Lee, J.H.; Ryu, C.M. Loss-of-function gs3 allele decreases methane emissions and increases grain yield in rice. Nat. Clim. Change 2023, 13, 1329–1333. [CrossRef]
  7. Liang, W.H.; Shang, F.; Lin, Q.T.; Lou, C.; Zhang, J. Tillering and panicle branching genes in rice. Gene 2014, 537, 1–5. [CrossRef]
  8. Zhang, S.; Zhang, Y.; Li, K.; Yan, M.; Zhang, J.; Yu, M.; Tang, S.; Wang, L.; Qu, H.; Luo, L.; Xuan, W.; Xu, G. Nitrogen mediates flowering time and nitrogen use efficiency via floral regulators in rice. Curr. Biol. 2021, 31, 671–683.e5. [CrossRef]
  9. Wang, Y.; Lu, J.; Ren, T.; Hussain, S.; Guo, C.; Wang, S.; Cong, R.; Li, X. Effects of nitrogen and tiller type on grain yield and physiological responses in rice. AoB Plants 2017, 9, plx012. [CrossRef]
  10. Yoshida, S. Effects of temperature on growth of the rice plant (Oryza sativa L.) in a controlled environment. Soil Sci. Plant Nutr. 1973, 19, 299–310. [CrossRef]
  11. Kakizaki, Y. Effect of different temperatures given to the culm-base of rice plant on the emergence and elongation of its tiller under controlled environment. Jpn. J. Crop Sci. 1991, 60, 82–90. [CrossRef]
  12. Jackson, S.D. Plant responses to photoperiod. New Phytol. 2009, 181, 517–531. [CrossRef]
  13. Rameau, C.; Bertheloot, J.; Leduc, N.; Andrieu, B.; Foucher, F.; Sakr, S. Multiple pathways regulate shoot branching. Front. Plant Sci. 2014, 5, 741. [CrossRef]
  14. Lee, H.; Choi, M.; Lee, Y.; Hwang, W.; Jeong, J.; Yang, S.; Lim, Y.; Lee, C.; Choi, K. Temperature-dependent differences in heading response at different growth stages of rice. Korean J. Crop Sci. 2019, 64, 213–224. [CrossRef]
  15. Lee, H.; Hwang, W.; Jeong, J.; Yang, S.; Jeong, N.; Lee, C.; Choi, M. Physiological causes of transplantation shock on rice growth inhibition and delayed heading. Sci. Rep. 2021, 11, 16818. [CrossRef]
  16. Hussien, A.; Tavakol, E.; Horner, D.S.; Muñoz-Amatriaín, M.; Muehlbauer, G.J.; Rossini, L. Genetics of tillering in rice and barley. Plant Genome 2014, 7. [CrossRef]
  17. Nakamichi, N. Adaptation to the local environment by modifications of the photoperiod response in crops. Plant Cell Physiol. 2015, 56, 594–604. [CrossRef]
  18. Brambilla, V.; Martignago, D.; Goretti, D.; Cerise, M.; Somssich, M.; de Rosa, M.; Galbiati, F.; Shrestha, R.; Lazzaro, F.; Simon, R.; Fornara, F. Antagonistic transcription factor complexes modulate the floral transition in rice. Plant Cell 2017, 29, 2801–2816. [CrossRef]
  19. Cho, L.-H.; Yoon, J.; An, G. The control of flowering time by environmental factors. Plant J. 2017, 90, 708–719. [CrossRef]
  20. Yang, W.; Kang, S.; Choi, J.-S.; Lee, D.-W.; Lee, S.-K.; Chae, M.-J. Heading response of rice varieties under temperature and day-length conditions of low-temperature regions in North Korea. Korean J. Crop Sci. 2021, 66, 190–200.
  21. Nishida, H.; Okumoto, Y.; Nakagawa, H.; Ichitani, K.; Inoue, H.; Tanisaka, T. Analysis of tester lines for rice (Oryza sativa L.) heading-time genes using reciprocal photoperiodic transfer treatments. Ann. Bot. 2001, 88, 527–536. [CrossRef]
  22. Song, Y.; Gao, Z.; Luan, W. Interaction between temperature and photoperiod in regulation of flowering time in rice. Sci. China Life Sci. 2012, 55, 241–249. [CrossRef]
  23. Tamaki, S.; Matsuo, S.; Wong, H.L.; Yokoi, S.; Shimamoto, K. Hd3a protein is a mobile flowering signal in rice. Science 2007, 316, 1033–1036. [CrossRef]
  24. Tamaki, S.; Tsuji, H.; Matsumoto, A.; Fujita, A.; Shimatani, Z.; Terada, R.; Sakamoto, T.; Kurata, T.; Shimamoto, K. FT-like proteins induce transposon silencing in the shoot apex during floral induction in rice. Proc. Natl. Acad. Sci. U.S.A. 2015, 112, E901–E910. [CrossRef]
  25. Tsuji, H.; Taoka, K.I.; Shimamoto, K. Regulation of flowering in rice: Two florigen genes, a complex gene network, and natural variation. Curr. Opin. Plant Biol. 2011, 14, 45–52. [CrossRef]
  26. Andrés, F.; Coupland, G. The genetic basis of flowering responses to seasonal cues. Nat. Rev. Genet. 2012, 13, 627–639. [CrossRef]
  27. Kinoshita, A.; Richter, R. Genetic and molecular basis of floral induction in Arabidopsis thaliana. J. Exp. Bot. 2020, 71, 2490–2504. [CrossRef]
  28. Martignago, D.; Siemiatkowska, B.; Lombardi, A.; Conti, L. Abscisic acid and flowering regulation: Many targets, different places. Int. J. Mol. Sci. 2020, 21, 9700. [CrossRef]
  29. Dixon, L.E.; Farré, A.; Finnegan, E.J.; Orford, S.; Griffiths, S.; Boden, S.A. Developmental responses of bread wheat to changes in ambient temperature following deletion of a locus that includes FLOWERING LOCUS T1. Plant Cell Environ. 2018, 41, 1715–1725. [CrossRef]
  30. Li, X.; Qian, Q.; Fu, Z.; Wang, Y.; Xiong, G.; Zeng, D.; Wang, X.; Liu, X.; Teng, S.; Hiroshi, F.; Yuan, M.; Luo, D.; Han, B.; Li, J. Control of tillering in rice. Nature 2003, 422, 618–621. [CrossRef]
  31. Liao, Z.; Yu, H.; Duan, J.; Yuan, K.; Yu, C.; Meng, X.; Kou, L.; Chen, M.; Jing, Y.; Liu, G.; Smith, S.M.; Li, J. SLR1 inhibits MOC1 degradation to coordinate tiller number and plant height in rice. Nat. Commun. 2019, 10, 2738. [CrossRef]
  32. Barbier, F.F.; Dun, E.A.; Kerr, S.C.; Chabikwa, T.G.; Beveridge, C.A. An update on the signals controlling shoot branching. Trends Plant Sci. 2019, 24, 220–236. [CrossRef]
  33. Luo, L.; Li, W.; Miura, K.; Ashikari, M.; Kyozuka, J. Control of tiller growth of rice by OsSPL14 and strigolactones, which work in two independent pathways. Plant Cell Physiol. 2012, 53, 1793–1801. [CrossRef]
  34. Wang, F.; Han, T.; Song, Q.; Ye, W.; Song, X.; Chu, J.; Li, J.; Chen, Z.J. The rice circadian clock regulates tiller growth and panicle development through strigolactone signaling and sugar sensing. Plant Cell 2020, 32, 3124–3138. [CrossRef]
  35. Rao, N.N.; Prasad, K.; Kumar, P.R.; Vijayraghavan, U. Distinct regulatory role for RFL, the rice LFY homolog, in determining flowering time and plant architecture. Proc. Natl. Acad. Sci. U.S.A. 2008, 105, 3646–3651. [CrossRef]
  36. Purwestri, Y.A.; Susanto, F.A.; Tsuji, H. Hd3a florigen recruits different proteins to reveal its function in plant growth and development. In: Jurić, S. (Ed.), Plant Engineering; INTECH Press: Philippines, Pennsylvania, 2017; pp. 49–67.
  37. Tsuji, H. Molecular function of florigen. Breed. Sci. 2017, 67, 327–332. [CrossRef]
  38. Jiang, P.; Wang, S.; Jiang, H.; Cheng, B.; Wu, K.; Ding, Y. The COMPASS-like complex promotes flowering and panicle branching in rice. Plant Physiol. 2018, 176, 2761–2771. [CrossRef]
  39. Patil, S.B.; Barbier, F.F.; Zhao, J.; Zafar, S.A.; Uzair, M.; Sun, Y.; Fang, J.; Perez-Garcia, M.D.; Bertheloot, J.; Sakr, S.; Fichtner, F.; Chabikwa, T.G.; Yuan, S.; Beveridge, C.A.; Li, X. Sucrose promotes D53 accumulation and tillering in rice. New Phytol. 2022, 234, 122–136. [CrossRef]
  40. Ku, B.-I.; Kang, S.-K.; Sang, W.-G.; Choi, M.-K.; Lee, K.-J.; Park, H.-K.; Kim, Y.-D.; Kim, B.-K.; Lee, J.-H. Variation of panicle differentiation stage by leaf growth according to rice cultivars and transplanting time. Korean J. Crop Sci. 2013, 58, 353–361. [CrossRef]
  41. Tsuji, H.; Tachibana, C.; Tamaki, S.; Taoka, K.-I.; Kyozuka, J.; Shimamoto, K. Hd3a promotes lateral branching in rice. Plant J. 2015, 82, 256–266. [CrossRef]
  42. Cai, Z.; Zhang, Y.; Tang, W.; Chen, X.; Lin, C.; Liu, Y.; Ye, Y.; Wu, W.; Duan, Y. LUX arrhythmo interacts with ELF3a and ELF4a to coordinate vegetative growth and photoperiodic flowering in rice. Front. Plant Sci. 2022, 13, 853042. [CrossRef]
  43. Nagalla, A.D.; Nishide, N.; Hibara, K.-I.; Izawa, T. High ambient temperatures inhibit Ghd7-mediated flowering repression in rice. Plant Cell Physiol. 2021, 62, 1745–1759. [CrossRef]
  44. Lee, Y.S.; An, G. OsGI controls flowering time by modulating rhythmic flowering time regulators preferentially under short day in rice. J. Plant Biol. 2015, 58, 137–145. [CrossRef]
  45. Chang, S.; Puryear, J.; Cairney, J. A simple and efficient method for isolating RNA from pine trees. Plant Mol. Biol. Rep. 1993, 11, 113–116. [CrossRef]
  46. Black, J.W.; Leff, P. Operational models of pharmacological agonism. Proc. R. Soc. Lond. B Biol. Sci. 1983, 220, 141–162. [CrossRef]
  47. Song, S.; Wang, G.; Hu, Y.; Liu, H.; Bai, X.; Qin, R.; Xing, Y. OsMFT1 increases spikelets per panicle and delays heading date in rice by suppressing Ehd1, FZP, and SEPALLATA-like genes. J. Exp. Bot. 2018, 69, 4283–4293. [CrossRef]
  48. Wang, X.; Han, J.; Li, R.; Qiu, L.; Zhang, C.; Lu, M.; Huang, R.; Wang, X.; Zhang, J.; Xie, H.; Li, S.; Huang, X.; Ouyang, X. Gradual daylength sensing coupled with optimum cropping modes enhances multilatitude adaptation of rice and maize. Plant Commun. 2023, 4, 100433. [CrossRef]
  49. Ahn, S.; Vergara, V.S. Studies on responses of the rice plant to photoperiod III. Response of Korean varieties. Korean J. Crop Sci. 1969, 5, 45–50.
  50. Tsuji, H.; Nakamura, H.; Taoka, K.-I.; Shimamoto, K. Functional diversification of FD transcription factors in rice, components of florigen activation complexes. Plant Cell Physiol. 2013, 54, 385–397. [CrossRef]
  51. Ding, C.; You, J.; Chen, L.; Wang, S.; Ding, Y. Nitrogen fertilizer increases spikelet number per panicle by enhancing cytokinin synthesis in rice. Plant Cell Rep. 2014, 33, 363–371. [CrossRef]
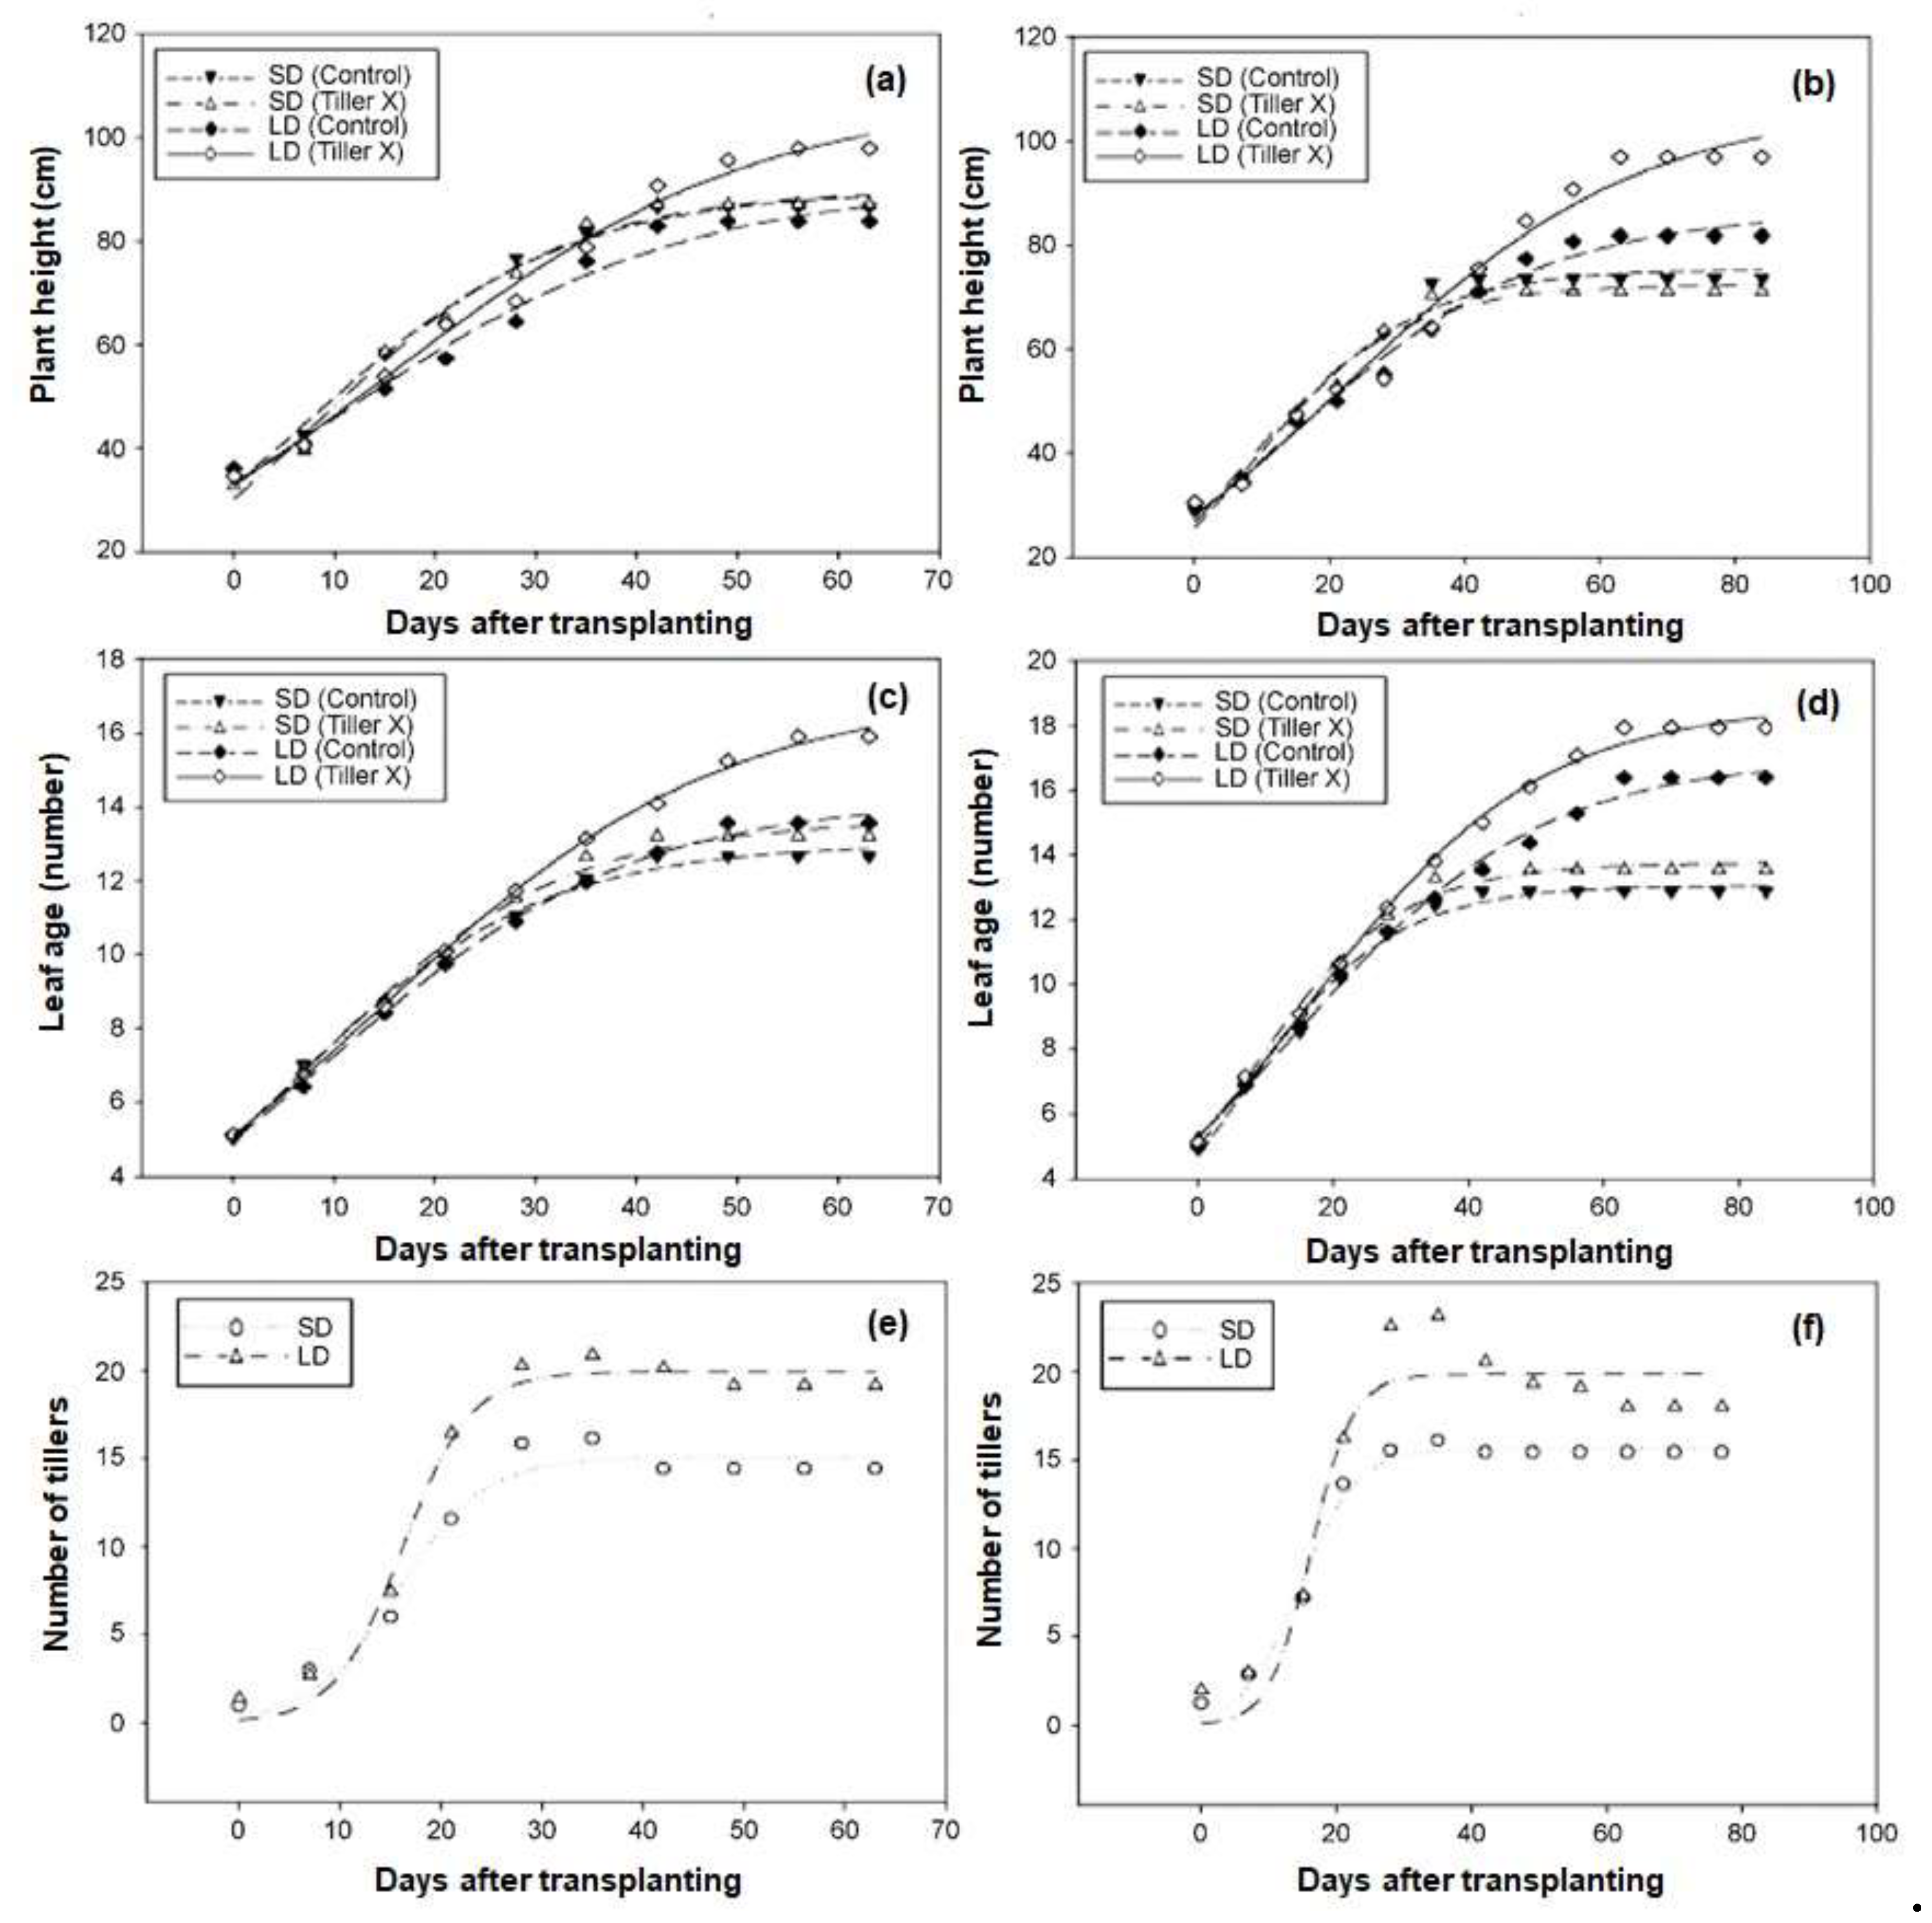
Figure 1. Logistic model of rice plant height, leaf age, and tiller development from sowing to heading stage date after transplant for tiller removal treatments according to daylength. (a) ‘Odae,’ plant height; (b) ‘Saenuri,’ plant height; (c) ‘Odae,’ leaf age; (d) ‘Saenuri,’ leaf age; (e) ‘Odae,’ tiller number; (f) ‘Saenuri,’ tiller number. SD: short day. LD: long day. Tiller X refers to tiller removal (TR) treatment. Curves were fitted to a logistic equation, as in Table 1.
Preprints 140886 g001
Figure 2. Boxplot graph of the differences in growth with tiller removal and daylength conditions at heading date. (a) ‘Odae, stem length; (b) ‘Saenuri, stem length; (c) ‘Odae’ panicle length; (d) ‘Saenuri panicle length. SD: short day. LD: long day. Tiller X refers to tiller removal treatment. Letters above bars indicate significant differences (P < 0.05) according to Duncan’s multiple range test.
Preprints 140886 g002
Figure 3. Boxplot graph of days to heading upon tiller removal and under contrasting daylength conditions. (a) ‘Odae,’ (b) ‘Saenuri.’ SD: short day. LD: long day. Tiller X refers to tiller removal treatment. Letters above bars indicate significant differences (P < 0.05) according to Duncan’s multiple range test.
Preprints 140886 g003
Figure 4. Changes in (a) Hd3a, and (b) MFT1 mean relative expression levels in ‘Saenuri’ rice plants in the tiller removal treatment groups according to daylength conditions, compared with that of the relative expression level before treatment (standard). TMS: leaves of tiller removal main stem. CMS: : leaves of control rice plant-main stem. CT: : leaves of control rice plant-tiller. DAT: days after treatment. SD: short day. LD: long day. Letters above bars indicate significant differences (P < 0.05) according to Duncan’s multiple range test. “ns” indicates non-significant (P ≥ 0.05). Vertical lines on bars represent SE (n = 3).
Preprints 140886 g004
Figure 5. Changes in plant growth and phenology responses to daylength conditions and tiller removal.
Preprints 140886 g005
Table 1. Parameters of the logistic function used to describe plant height, leaf age, and tiller development from sowing to heading stage date after transplanting for the tiller removal treatments according to daylength.
Varieties Treatment Plant height
(cm)
Leaf age
(ea)
Tiller number
(ea)
Hmax  rF†† tm††† R2 Lmax  rF tm R2 Tmax rF tm R2
‘Odae’ SD Control 89.8
(1.74)
0.078
(0.007)
7.2
(0.89)
0.98 13.0
(0.14)
0.081
(0.005)
5.6
(0.51)
0.99 15.1
(0.49)
0.232
(0.051)
15.7
(1.04)
0.96
Tiller X 89.9
(1.71)
0.082
(0.007)
8.3
(0.86)
0.98 13.6
(0.19)
0.079
(0.005)
7.0
(0.65)
0.99 - - - -
LD Control 91.0
(3.89)
0.057
(0.008)
9.7
(1.90)
0.97 14.2
(0.17)
0.066
(0.003)
9.3
(0.54)
0.99 19.9
(0.47)
0.294
(0.056)
16.2
(0.66)
0.98
Tiller X 108.3
(4.29)
0.054
(0.006)
15.4
(1.84)
0.98 17.1
(0.21)
0.058
(0.002)
14.5
(0.54)
0.99 - - - -
‘Saenuri’ SD Control 75.3
(1.27)
0.081
(0.008)
8.1
(1.06)
0.97 13.1
(0.10)
0.090
(0.005)
6.2
(0.52)
0.99 15.7
(0.23)
0.239
(0.029)
14.6
(0.56)
0.98
Tiller X 72.4
(1.03)
0.084
(0.008)
6.4
(0.94)
0.97 13.8
(0.13)
0.089
(0.006)
6.4
(0.63)
0.98 - - - -
LD Control 86.4
(1.89)
0.053
(0.004)
13.8
(1.25)
0.98 16.9
(0.23)
0.054
(0.003)
14.3
(0.79)
0.99 19.9
(0.77)
0.324
(0.123)
16.2
(1.21)
0.91
Tiller X 107.0
(4.41)
0.046
(0.005)
22.6
(2.41)
0.98 18.6
(0.17)
0.058
(0.002)
16.0
(0.54)
0.99 - - - -
SD: short day, LD: long day. Tiller X refers to the TR treatment. † Hmax is the final plant height, Lmax is the final leaf age from the main stem, and Tmax is the final number of tillers. †† rF is the rate of development up to the final plant height, leaf age, and tiller number. ††† t is the number of days after transplantation; tm is the time point at which the plant reached half of its final height, leaf age, and tiller number. ** P < 0.01.
Table 2. Changes in yield components upon tiller removal according to daylength from sowing to heading stage date.
Varieties Treatment Panicle
number
(ea)
Spikelet number per panicle
(ea)
Ripened
Grain
(%)†††
1000-
Grain weight
(g)†††
‘Odae’
SD
Control 13.0a 56.9c 95.6a 28.1a
Tiller X 1.0b 74.1b 84.3b 28.1a

LD
Control 13.5a 58.2c 95.6a 28.4a
Tiller X 1.0b 127.1a 78.5c 28.4a
‘Saenuri’
SD
Control 13.8a 62.2b 93.8a 28.9a
Tiller X 1.0b 59.3b 72.6c 30.3a

LD
Control 14.0a 69.1b 89.7a 28.0a
Tiller X 1.0b 235.0a 79.7b 28.3a
Analysis of variance (ANOVA)
Variety (V) ns *** *** ns
Daylength (D) ns *** ns ns
Tiller (R) *** *** ** ns
Interaction (V*D) ns *** ns ns
Interaction (V*R) ns *** *** ns
Interaction (D*R) ns *** *** ns
Interaction (V*D*R) ns *** *** ns
SD: short day, LD: long day. Tiller X refers to the TR (tiller removal) treatment. ns: non-significant (P ≥ 0.05), *, **, ***: significant at P < 0.05, 0.01, and 0.001. Letters indicate significant differences (P < 0.05). † Number of days from sowing to heading date (main stem). †† Final leaf age from the main stem; final tiller number was the highest up to the heading date. ††† After heading, plants were treated with the same temperature and daylength conditions.3.3 Florigen- and spikelet formation-related gene expression.
Disclaimer/Publisher’s Note: The statements, opinions and data contained in all publications are solely those of the individual author(s) and contributor(s) and not of MDPI and/or the editor(s). MDPI and/or the editor(s) disclaim responsibility for any injury to people or property resulting from any ideas, methods, instructions or products referred to in the content.
Copyright: This open access article is published under a Creative Commons CC BY 4.0 license, which permit the free download, distribution, and reuse, provided that the author and preprint are cited in any reuse.
Prerpints.org logo

Preprints.org is a free preprint server supported by MDPI in Basel, Switzerland.

Subscribe

Disclaimer

Terms of Use

Privacy Policy

Privacy Settings

© 2025 MDPI (Basel, Switzerland) unless otherwise stated