Submitted:
20 November 2024
Posted:
20 November 2024
You are already at the latest version
Abstract
The wine industry uses filtration systems to remove particles that could compromise the quality of wine before bottling. These systems, based on surface filtration media, trap particles that cause a clogging effect reducing the available area and decreasing the bottling flow rate. This clogging has a significant economic impact, as it deteriorates production times and increases operational costs, mainly due to higher labor demands.
To obtain timely information on the performance of the filtering and bottling system, the industry uses indicators such as the maximum volume index, the filtration index, and the modified filtration index, which measure clogging potential. These are obtained through laboratory tests conducted at constant pressure under controlled conditions to replicate the industrial process. Traditional de-vices use pressurized tanks, where an inert gas at 30 psi pushes the fluid through a filter disc. However, these systems have disadvantages, such as requirement of intensive operational han-dling and the associated risks with high pressure devices.
To address these challenges, a new constant-pressure system for wine filtration testing was de-veloped, utilizing a pneumatic pumping system without the need for a pressurized tank. This device, equipped with pressure regulators and hydraulic connections, reduces analysis time by 66.2% while improving operational safety. The validation of the device included statistical anal-yses showing that the samples processed by both devices were statistically similar. Additionally, a user survey revealed a high level of satisfaction with the new device compared to the traditional pressurized tank system. This approach has led to a tangible solution that is closely aligned with the specific needs of the industry, highlighting the practical application of scientific knowledge to address real industry challenges.
Keywords:
clogging potential
; wine filtration
; applied science
1. Introduction
The wine industry uses filtration systems to ensure the product’s stability and innocuity before bottling, removing microorganisms such as bacteria and yeast that could affect the product’s quality[1,2]. This process is essential to ensure that the wine maintains its characteristics during storage and provides an optimal consumer experience[3,4].
These filtration systems consist of pleated surface filters, arranged in several stages that progressively reduce solid content until microbiological stability is achieved[5,6]. Filters are made of porous synthetic materials, designed to mechanically retain particles as the wine flows through the filtering medium, allowing final product to be bottled while retaining undesired particles[7].
Due to the complex nature of wine production and the use of additives, the particles present in the wine vary significantly in concentration, size distribution, and mechanical properties. In addition to microorganisms, these particles may include crystalline precipitates, colloids, and other solids that can affect filtration performance[8,9]. Some of these particles exhibit deformable or disaggregating properties, complicating their assessment through conventional methods. This creates a variable interaction with the filtering medium, impacting operational efficiency and increasing costs[10].
1.1. Impact of Clogging Potential on the Bottling Process
The bottling stage in the wine production process is critical, as it amount for approximately 30% of the total costs[11]. During this stage, the final filtration of the wine takes place simultaneously with the bottling process, which means that any change in flow rate, pressure, or other operational variables directly impacts the efficiency of the bottling line[12]. The accumulation of solids in the filtering stage reduces the effective filtration area, decreasing the flow rate and increasing the pressure differential between within the filtering machine[9]. This results in a progressive increase in processing time due to constant decreasing in flow rate[12].
This situation affects the fulfillment of orders within work shifts, which in turn increases operational costs. Additionally, the need to replace or clean the filters more frequently increases the downtime of the production line[13]. Moreover, at a global level, the wine industry faces significant challenges as consumption decreases due to the emergence of new products and production costs continue to rise. In this context, timely measurement and control of the wine's clogging potential are essential for adding value and managing both costs and their variability[14]
1.2. Measurement of Clogging Potential in Wine
To address the challenges associated with the variability in particle content and its impact on the entire bottling process, various methods are employed to measure clogging potential, replicating the operational conditions of industrial filtration[15]. The most common methods, such as the Laurenty Filtration Index (FI), the Modified Filtration Index (MFI), and the Maximum Filterable Volume (Vmax), are conducted under standardized conditions: constant pressure of 30 psi, a temperature of 20°C, and the use of a 25 mm diameter membrane with a pore size of 0.65 µm. Although these methods share these testing conditions, they differ in how they calculate the level of filter obstruction[16].
The Laurenty Filtration Index (FI), represented in equation (1), measures the time difference between filtering two known volumes of wine (200 mL and 400 mL). Meanwhile, the Modified Filtration Index (MFI), expressed in equation (2), introduces an additional 300 mL volume to reduce variability in the results and provide more accurate measurements. Finally, the Maximum Filterable Volume (Vmax), represented in equation (3), estimates the maximum volume that can be filtered before significant clogging occurs, providing a measure of filter performance under constant pressure[15].
Figure 1 presents the function that describes the relationship between processing time and total volume filtered under these standardized testing conditions. Although the three methods share the same operational conditions, their differences in calculating clogging potential make them complementary tools for operational decision-making, enabling better planning and control of filtration processes[17].
1.3. Description of the Systems Used in the Industry
The device used to perform clogging tests at constant pressure consists of several components described in Figure 2. They replicate operational filtration conditions in a controlled laboratory environment. The equipment consists of a 1-liter pressure tank (a) that holds the wine sample. This tank is connected to a pressure regulator valve (b), adjustable between 0 and 5 bar, ensuring that the pressure remains constant during the test. A gas shut-off valve (c) controls the supply of inert gas, such as nitrogen or compressed air (d), which pressurizes the system[18]. Additionally, the device is equipped with a pressure relief valve (e) to ensure system safety by preventing the pressure from exceeding set limits. A top connection (f) facilitates the opening of the tank to introduce the wine sample. At the bottom of the tank, a connection (g) allows for the installation of the filtration medium, which is held by a 25 mm filter holder (h). To regulate the start and end of the test, a ball valve (i) is used to control the flow of the wine sample.The system includes a stopwatch (j) to measure the filtration times, and a graduated cylinder (k) to measure the volume of filtered wine. These components enable precise, controlled testing, providing reliable data on clogging potential under standardized conditions.
1.4. Limitations of Current Constant Pressure Systems
The use of the constant pressure device presents significant limitations that impact both efficiency and safety in industrial environments. Due to the nature of the current test, it is necessary to extract a sample from the finished product tank and transport it to the laboratory for analysis. The device allows for fixed volume of sample as it requires to fill the pressurized tank independently and cannot be connected to the production line. This is particularly important as it imposes a limitation in dynamic processes, where a single 500 mL sample may not accurately represent the entirety of a lot that can exceed 100,000 liters[15].
Additionally, the use of a pressurized tank at 30 psi poses risks for the operator. If the procedure for relieving pressure is not properly followed or if any part of the system fails or becomes dislodged, the operator could suffer serious injury due to the sudden release of pressure. This inherent risk in handling pressurized systems requires careful operation to prevent accidents[19].
Lastly, the required time to perform an analysis with this device is considerable, as more than 70% of the total time is spent on setup tasks such as cleaning, depressurize the tank, and prepare the next sample. This reduces efficiency in production environments where fast, continuous measurements are needed, limiting the ability to frequently analyze during the filtration and bottling process[18].
1.5. Novelty and Contribution of the Study: Driving Science Towards Practical Solutions
Faced with the challenges confronting the global wine industry, this study provides a deep understanding of the problems and their practical implications for operational decision-making, especially in the bottling process. A practical solution has been developed that significantly contributes to value creation in the industry and enhances worker safety. Through a comprehensive methodology that includes experimental design, statistical data analysis, and the application of user-level questionnaires, the proposed device is thoroughly and effectively evaluated. Based on scientific knowledge of clogging processes and the hydraulic behavior of wine, this research enriches operational decision-making in the bottling process by introducing a reliable device that not only directly contributes to productivity and cost reduction but also significantly increases worker safety, providing tangible benefits for industry.
2. Development of a System for Clogging Tests at Constant Pressure Without the use of a Pressure Tank
The development of a novel device designed to measure clogging potential in wine production processes is presented. It considers a constant pressure system that does not require the use of a pressurized tank. This innovation contributes to reducing operational risk, enables direct analysis of samples from the production line and optimizes the time required for analysis by simplifying cleaning and handling processes. The following sections discuss the fundamental design principles, provide a detailed breakdown of the device’s parts and components and describe its operation. A statistical comparison, based on experimental methods, is conducted for the obtained results with the proposed device and those generated by the conventional system used in the industry. Finally, a user-level evaluation is provided regarding the performance and usability of the new device in comparison with the pressurized tank system.
2.1. Design Considerations
The design of the device considered a set of key factors, widely addressed in previous studies, ensuring stable and safe operation. These factors, guarantee that the device operates efficiently under various operational conditions. Additionally, they focus on aspects that facilitate the achievement of reproducible and reliable results, meeting necessary technical requirements for the filtration process and ensuring the safe handling of the system[20].
- Hydraulic factors: For the development of the device, critical hydraulic aspects were considered to ensure continuous flow and maintain constant pressure throughout the entire filtration process. To achieve this, a propulsion system powered by a compressed gas is controlled by a pressure regulator[21].
- Ergonomics and safety: The device was designed to be easy to operate. The height of the equipment was calculated to facilitate handling by the operator, reducing physical effort and fatigue during operation. Additionally, permanent connections were implemented in the system, eliminating the need for frequent reconnections of hoses and accessories, which reduces the risk of leaks and improves overall process safety[22].
- Durability and material compatibility: The materials used in the construction of the device were selected for their durability, ensuring resistance in use intensive operating conditions. Additionally, the chemical compatibility of the components with the various fluids passing through the system was evaluated, ensuring that no degradation or unwanted reactions occur[23].
- Maintenance and accessibility: The modular design of the equipment facilitates access to its components, simplifying maintenance tasks and reducing downtime. This modular structure allows for quick and efficient replacements and repairs, ensuring continuous operation without extended interruptions.
- Control and monitoring : The device's control system is designed to be accessible, with a clear display of key parameters such as pressure and flow rate. This enables real-time monitoring, making it easier for the operator to supervise the process without requiring complex interventions.
2.2. Principles of Operation and Functionality
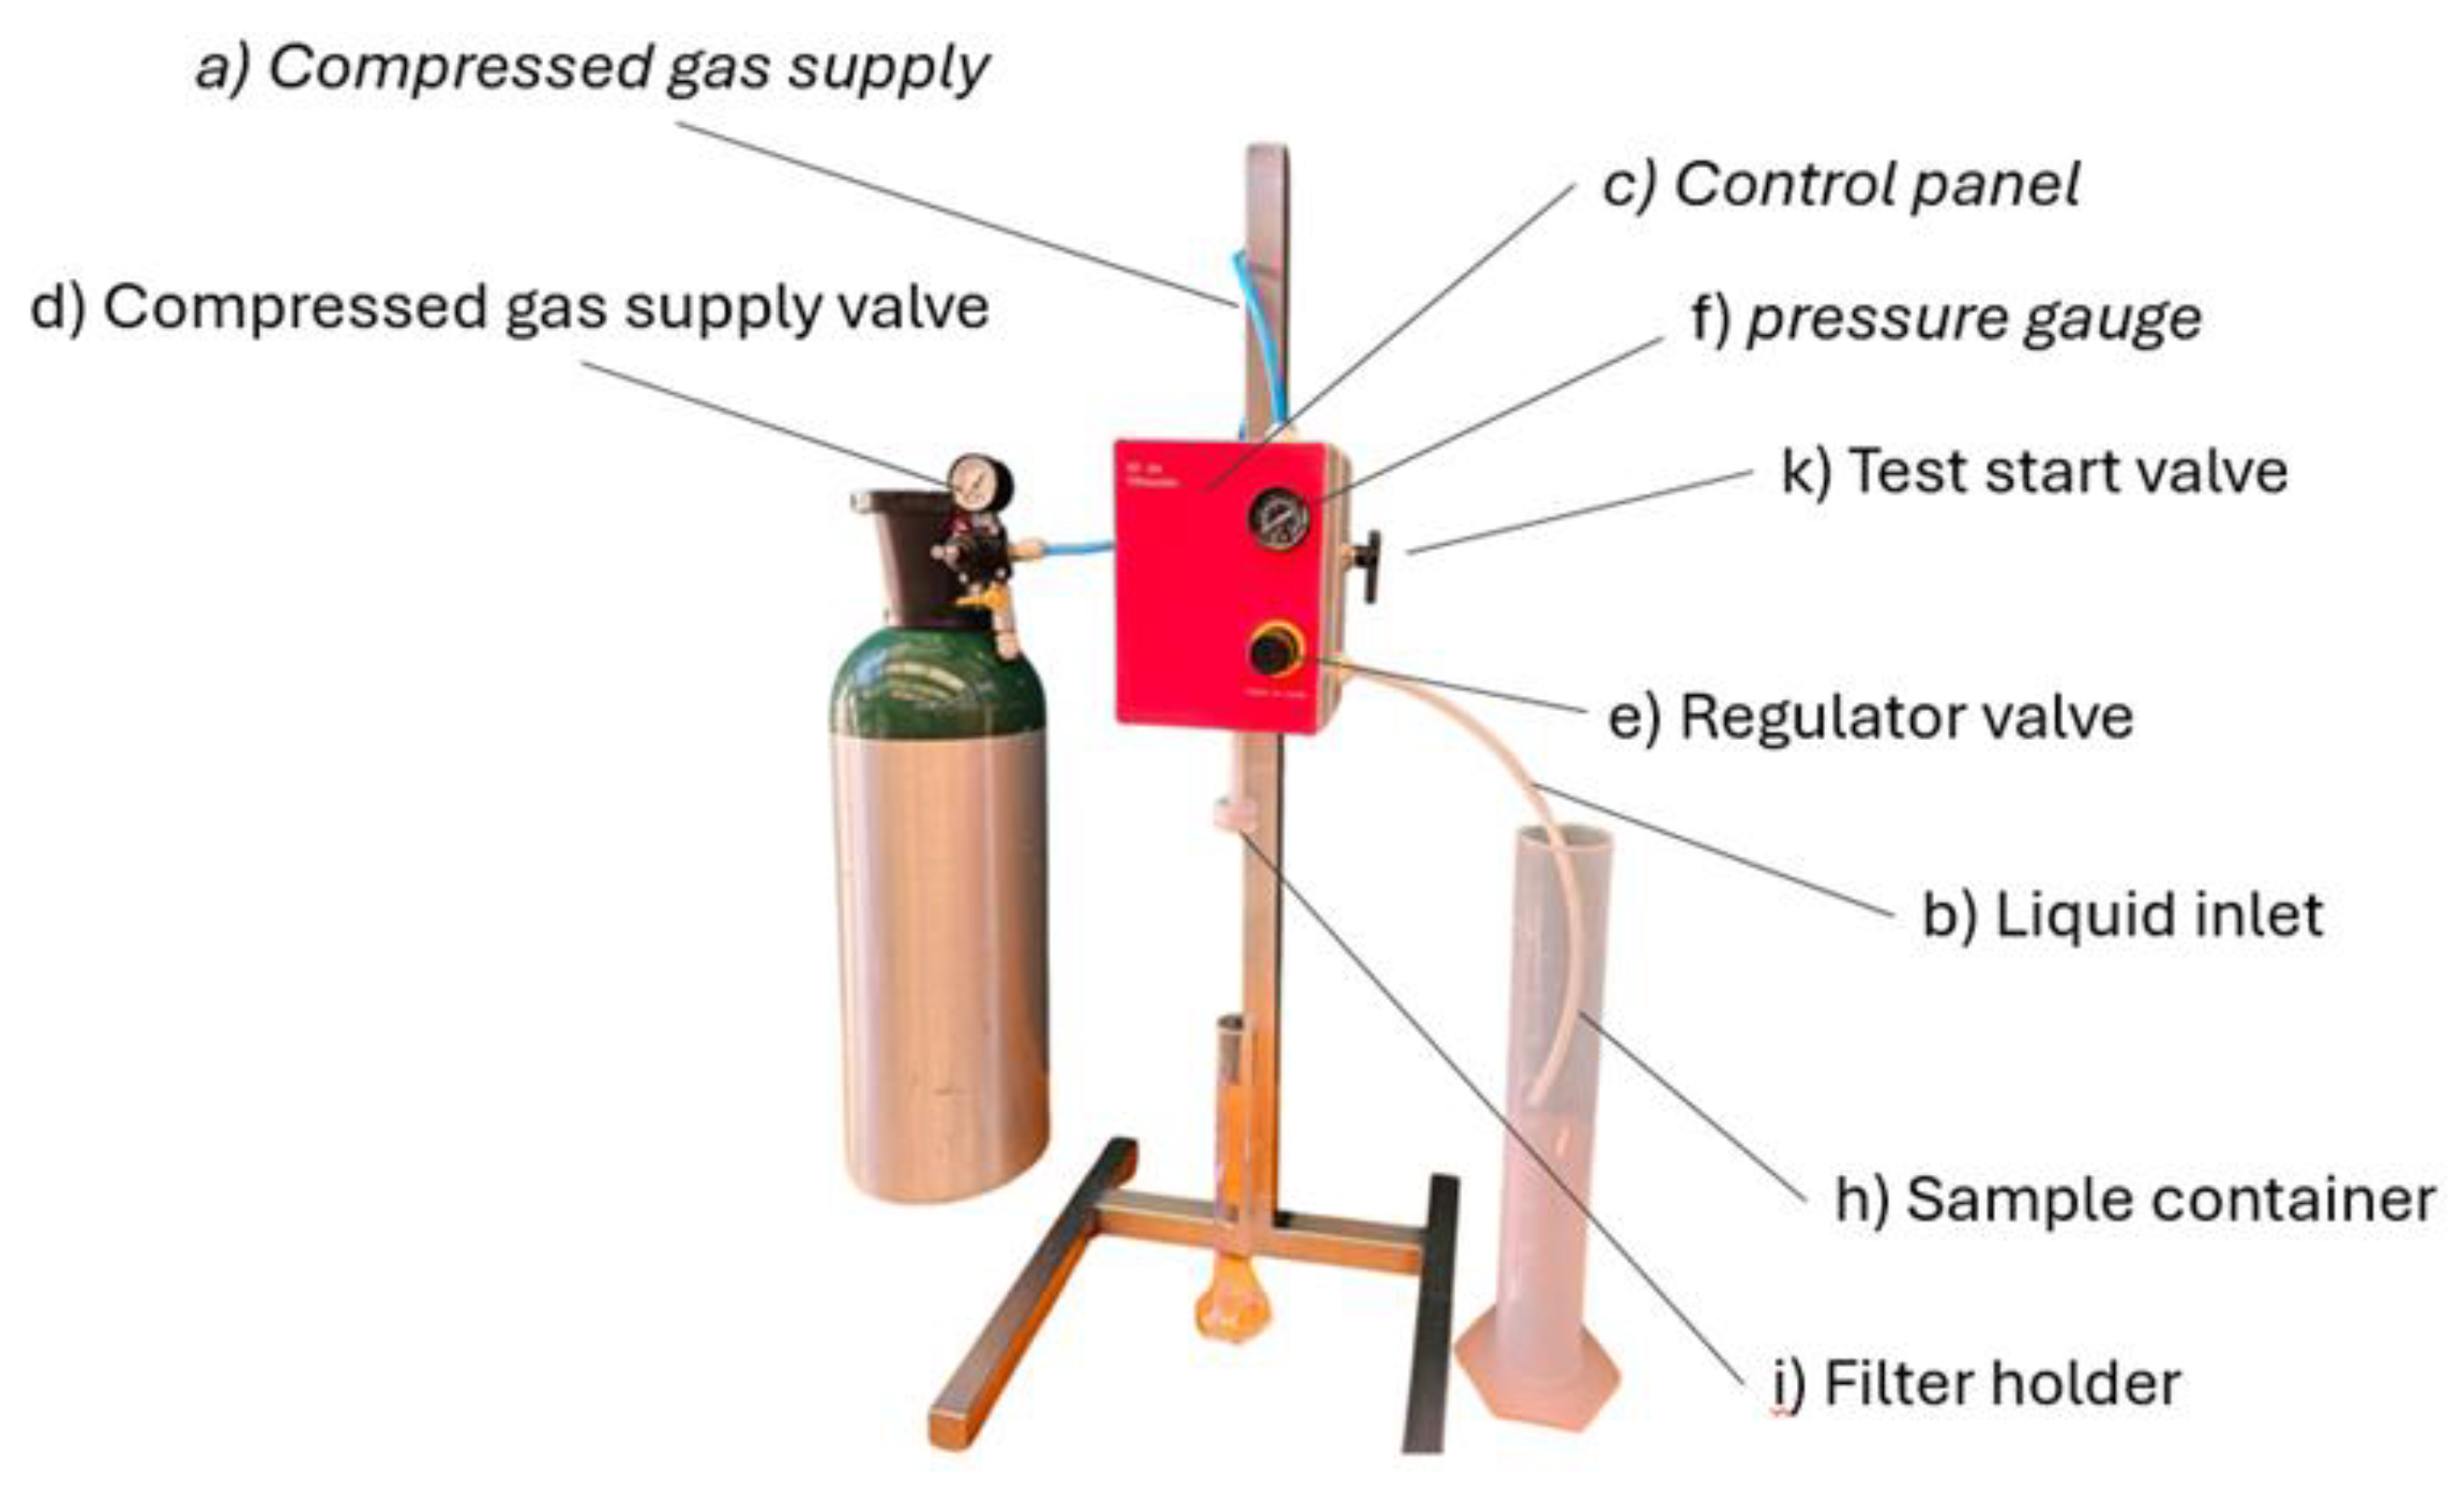
The proposed device allows for the measurement of filtration indexes without the need for a pressurized tank. To achieve this, the propulsion system is activated by compressed gas integrated with a pneumatic control system within a control panel. Through flexible connections, the system is linked to both the analyzed liquid and the gas supply.
The system consists of several components. Figure 3 shows the diagram with the involved components. The system includes a membrane gas pressure regulator (a), which adjusts the gas pressure to the required level through the activation of a valve, allowing the value to be displayed on the control pressure gauge (b). The gas supply (c) can be a pressurized cylinder or a compressed gas line, which contains a primary pressure regulator (d) set at a pressure higher than the one required for the test. The compressed gas used may be nitrogen, CO₂, compressed air or another gas that can be safely released into the environment without posing a risk to the operator.
The pressure regulator (a) controls the working pressure of the pneumatic pump (e) through hoses or pipes. The pump is connected to a container (f) holding the liquid to be analyzed, using both flexible and rigid hoses (g). The flow rate of the fluid is controlled by a mechanical ball valve (h), ensuring quick opening and closing. Once the valve (h) is opened, the fluid flows into the filter holder (i) and is collected in a graduated container (j).
2.3. Description of the Procedure for Filtration Testing and Sample Change
For the utilization of the filtration device, the compressed gas supply (a) and liquid inlet (b) are connected to the control panel (c), ensuring that both connections are properly sealed to prevent leaks. Once the system is connected, the compressed gas supply valve (d) is opened, ensuring setting the initial pressure to a higher level than required for the test. Using the regulator valve (e), the pressure is then adjusted to the specified test level, being monitored by the value on the pressure gauge (f) until the desired pressure is reached.
Subsequently, the liquid inlet hose is inserted into the container holding the sample (h). The filter holder (i), which contains the filtering medium, is connected to the control panel, ensuring proper installation. With the system ready, the valve (k) is opened to start the test, and the time is recorded from the first drop of filtrate, a key parameter for evaluating filtration efficiency under the established conditions.
If a sample change is required, the residual volume of wine in the system, which is less than 80 ml, must be removed. This procedure is performed by opening the ball valve (k), which automatically activates the pump, allowing air to enter by suction and emptying the system in approximately 2 seconds.
To clean the system, water at room temperature is passed through for 5 seconds, followed by repeating the air suction process (o). This cycle ensures that the system is free of residues, leaving it ready to process the next sample without risk of contamination.
Figure 4.
Functional prototype of the proposed system.
3. Materials and Methods
3.1. Performance Validation of the Device
3.2. Comparison of Analytical Results
To determine whether the analytical results obtained using both systems are statistically similar, consecutive measurements were taken from a set of samples under controlled conditions. The results were analyzed using statistical tests, including the median and data distribution. Additionally, the paired Student's t-test was applied to evaluate whether the observed differences between the two systems were statistically significant. Since previous studies suggest that these results follow a normal distribution, the t-test was deemed appropriate for this comparative validation[26].
3.3. Evaluation of the Accumulated Volume Distribution Over Time
Given that the indexes used in the wine industry are based on similar measurement conditions, but differ in their calculation, an analysis of the performance of the function describing the relationship between time and filtered volume is proposed[27]. To assess whether the distribution of accumulated volume data over time is statistically similar in both systems, measurements were obtained using a calibrated balance connected to a computer via an RS232 interface. Since the balance measures weight, while the test focuses on volume, an adjustment was made by applying the density and temperature of the wine sample to convert the weight values into volume. A graphical application was developed in Visual Basic to record and plot the accumulated volume at 1-second intervals, with the data exported for further analysis in R. The graphical interface used for this process is shown in Figure 5. The resulting distributions were compared using statistical tests, including the Kolmogorov-Smirnov test, to validate whether the two curves follow a statistically similar distribution[28].
3.4. Measurement of Processing Time
To evaluate the processing time associated with each system, a detailed work protocol was developed and provided to three laboratory operators, each with over 10 years of experience in filtration analysis. Each operator was tasked with processing five different samples using both systems, carefully recording the time taken for each stage of the process. The recorded times were then subjected to a comparative analysis to identify any significant differences in the temporal performance of the two evaluated devices.
3.5. User-Level Validation
To evaluate the system from the users' perspective, a structured survey was designed and administered to operators who had been previously trained in the use of the proposed device. The survey included closed-ended questions and questions based on the Likert scale, as well as open-ended questions, with the goal of capturing both quantitative responses and more personal, detailed perceptions of the user experience[29]. These operators used the equipment for a period of 15 days, replacing the pressurized tank filtration system. The survey was administered to operators from four different wine production companies in order to evaluate various aspects of the device’s design and gather suggestions for potential improvements[30].
4. Results
In this section, the obtained results are presented and a critical analysis is performed, with the aim of determining whether the evidence supports that the use of a device without a pressure tank can be a viable alternative to replace the pressurized tanks used in laboratory tests to estimate the clogging potential of wine.
4.1. Comparison of Analytical Results
The results obtained from the analysis of 10 different wine samples, in which the measurement was repeated 8 times, are presented in Table 1. In this table, device A corresponds to the conventional system that uses a pressure tank, while device B is the equipment under evaluation that does not require a pressure tank. To determine whether the results of the consecutive measurements followed a normal distribution, the Shapiro-Wilk normality test was applied. The p-values obtained were greater than 0.05, the expected range to confirm the normality of the data, which allowed the use of parametric tests in the subsequent analysis. Subsequently, the Student's t-test for independent samples was used with the aim of establishing whether there were significant differences between the results obtained with devices A and B in the 10 samples studied. The samples were selected considering the entire range of values typically used in the industry for the clogging indicator, thus guaranteeing the representativeness and applicability of the results. Statistical analyses revealed that there are no significant differences between devices A and B in the evaluated parameters (Vmax, FI, and FMI), as the p-values obtained in the Student's t-test were greater than 0.05 in all cases (see Table 1). This indicates that, from the point of view of the results, both methods provide statistically similar analytical results.
4.2. Valuation of the Accumulated Volume Distribution Over Time
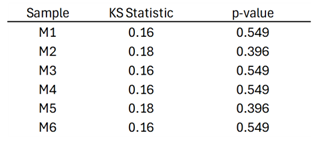
The results obtained, presented in Table 2, show that the distributions of accumulated volume over time generated by both devices (device A and device B) are statistically similar. The Kolmogorov-Smirnov (KS) statistic values range from 0.16 to 0.18, with p-values greater than 0.05 in all samples evaluated (M1-M6), indicating no significant differences between the compared distributions. These results establish that both measurement systems produce statistically similar results under the same operating conditions.
The analysis of the accumulated data distributions provides a foundation for exploring new indices in the wine industry, beyond those commonly used such as Vmax, FI, or FMI. The fact that both devices (A and B) yield comparable results in terms of the relationship between time and accumulated volume suggests that it would be feasible to evaluate other combinations of these variables. This could lead to the development of new indices that contribute to operational decision-making based on analytical evidence, allowing for a more comprehensive approach to process analysis and quality control.
4.3. Measurement of Processing Time
Through the analysis of the process described in Figure 6, four necessary stages were established to process the sample and measure the processing time.
The first stage, called Device Preparation, encompasses the set of steps required to connect the equipment to the compressed air network, place the filter medium, and enable the valves and connections required for the test.
The second stage corresponds to the Preparation and Introduction of the Sample. In this phase, the sample is introduced into the equipment for analysis. This involves opening valves, preparing the device, and all necessary actions to have the system enabled and ready to start the test.
The third stage is the Measurement, which extends from the opening of the start valve until the end of the test. During this phase, the corresponding measurements are taken, recording the data necessary for subsequent analysis.
The fourth and final stage is the Cleaning. This stage begins with the removal of the wine from the internal circuit of the equipment and continues with the cleaning of all parts and components involved, in order to leave the device ready to be used again.
The results presented in Figure 6 show an average reduction of 52% in the total processing time, considering all stages of the process. However, if the measurement stage, which does not depend on the device and is subject to the sample being analyzed, is excluded, the reduction in processing time increases to 66.2%. This significant improvement in processing time increases the laboratory's capacity to handle higher demand for analyses or allows the current laboratory operators to be reassigned to other complementary tasks.
The cleaning stage is the most impacted by the change to a device without a pressure tank, with a time reduction of 86.2%. The sample preparation and injection stage experiences a 64.9% reduction, while device preparation is reduced by 55.2%. On the other hand, the measurement stage does not show statistically significant differences.
4.4. User-Level Validation
The results obtained from the evaluation of user perceptions, presented in Figure 7, show a significant improvement in most stages of the process associated with the use of the new device. These findings are consistent with the expectations and the value proposition of the developed device, compared to the previous method used in the industry, which relied on a pressure tank. Regarding the ease of device preparation, 80% of respondents reported a significant improvement, rating this aspect as "Much better," while 20% rated it as "Better." This result suggests that the new system has greatly simplified the initial configuration procedures, contributing to a reduction in non-productive time in routine processes. The evaluation of the time required for preparation revealed that 100% of operators perceived a substantial improvement, rating it as "Much better." This finding reinforces the operational efficiency of the new device by reducing the time needed for setup, thereby maximizing productivity. As for the speed of sample preparation and injection, 60% of operators rated this process as "Much better" and 40% as "Better." While the improvement is clear, the distribution of responses suggests that further improvements to the device may still be possible. However, in its current state of development, it already makes a significant contribution.
Additionally, the efficiency of sample preparation and injection was positively evaluated, with 60% of users rating it as "Better" and 40% as "Much better." This indicates that the new device has significantly improved consistency in these stages, although the balance of responses suggests that the perception of efficiency may be influenced by external factors, such as the sample type or the operator's experience.
Regarding the measurement time, no significant differences were observed, as 100% of respondents indicated that this stage is "The same" compared to the previous method. This result could be explained by the fact that measurement time depends more on the intrinsic properties of the sample than on the device itself.
Important improvement was seen in the ease of cleaning, with 100% of operators rating this aspect as "Much better." This result suggests that the design of the new device has significantly simplified the cleaning process, which is essential for maintaining high hygiene standards and reducing downtime between analyses. In line with this, the cleaning time was unanimously rated as "Much better," confirming the new system’s efficiency in reducing the time allocated to this stage. This is key for optimizing workflow in laboratories with high operational demand.
Regarding safety conditions, 80% of users rated them as "Much better" and 20% as "Better," indicating a general perception that the new device is safer and more reliable, reducing risks associated with handling the equipment and contributing to a safer working environment.
The total processing time was unanimously rated as "Much better" by 100% of respondents. This reflects an overall optimization of the process, from device preparation to the completion of cleaning tasks. This finding highlights that the new device has not only improved individual process stages but has also had a positive impact on overall efficiency, increasing the laboratory's processing capacity.
Lastly, users provided several suggestions to further improve the design and operation of the device. A recurring recommendation was the incorporation of a computer connection for automatic data capture during analysis, which would streamline data recording and allow calculations to be performed immediately. This type of improvement would not only reduce the risk of manual data entry errors but also optimize the time spent evaluating and analyzing results, further maximizing process efficiency.
5. Discussion
This study was initiated from the identification of relevant problems in the industry and focused on the development and validation of a device designed to replace an existing one that, due to its inherent characteristics, required long preparation times and exposed workers to significant risks during its operation and cleaning. An integral methodology was adopted, including critical aspects of design, use, and exhaustive validation, based both on analytical results and the perception of the end users. This methodology not only improved the operational characteristics of the device but also provided a deep understanding of its safety, efficiency, and practical applicability in work environments. Thus, the approach taken not only solved a specific problem but also established a precedent for the future evaluation of similar technologies, constituting a significant contribution to the design of equipment and systems. This work demonstrated how the practical application of scientific knowledge can generate tangible solutions that meet the current needs of the industry.
5.1. Validation of the Performance of the New Device
The results of the comparative analysis between the proposed new constant-pressure system and the traditional method based on a pressure tank demonstrate that, under the standard conditions established in the measurement procedure, there are no statistically significant differences in the evaluated parameters (Vmax, FI, and FMI). The statistical tests applied, including the Shapiro-Wilk normality test and Student's t-test for independent samples, yielded p-values greater than 0.05 in all cases, indicating that the null hypothesis of equality between the methods is not rejected[31]. This confirms that both devices provide equivalent analytical results when operated under controlled and standardized conditions. This evidence validates the capability of the new device to replace the conventional method without compromising the precision or reliability of the measurements in the context of standard operating conditions. The successful replication of traditional clogging indices further suggests that the new system is suitable for implementation in the analysis process of the clogging potential of wine before bottling.
It is important to highlight that the standard conditions include critical parameters such as a constant pressure of 30 psi, controlled temperature, and the use of specific filtration membranes, which were strictly maintained during the tests[12]. Rigorous adherence to these parameters ensures that the comparisons between both methods are valid and that any potential differences are attributable to the device and not to variations in experimental conditions.
However, it is essential to consider that this validation was carried out under standardized and controlled conditions. Therefore, the extrapolation of these results to different operational conditions should be approached with caution. It is important to note that the traditional system based on a pressure tank has also not been widely studied in terms of the variation of test conditions. Factors such as temperature variations or different pressures could influence the performance of both the new device and the traditional system in scenarios not contemplated in this study[8].
Additionally, the evaluation of the distribution of accumulated filtered volume over time showed that the curves generated by both systems are statistically similar, with Kolmogorov-Smirnov statistic values and p-values greater than 0.05 in all analyzed samples. This similarity indicates that the dynamic behavior of the filtration process is consistently replicated by the new device. The implications of this finding are significant, as they allow for the consideration of developing new clogging indicators based on different combinations of time and volume variables[32]. These new indicators could provide a more detailed understanding of the clogging process and offer additional tools for operational decision-making based on analytical evidence.
The analysis of processing times revealed an average reduction of 52% in total time when using the new device, increasing up to 66.2% when excluding the measurement stage, which is independent of the equipment used. The cleaning stage benefited the most, with an 86.2% decrease in the required time. These improvements in operational efficiency are especially relevant in industrial environments with high analytical demand, as they allow increasing the laboratory's processing capacity and optimizing the allocation of human resources[33]. Specifically, the significant reduction in processing time enhances the laboratory's analytical capacity and improves the response time to internal demands.
The user-level validation showed high satisfaction with the new device, reporting significant improvements in ease of preparation, configuration time, ease and time of cleaning, and safety conditions. All users (100%) positively rated the reduction in preparation and cleaning time, while 80% perceived improvements in safety conditions. These perceptions are fundamental for the successful adoption of new technologies in industrial environments, as operator acceptance directly influences the effectiveness and sustainability of their implementation. Additionally, the suggestions received, such as the integration of an automatic data capture system, indicate clear opportunities for future improvements to the device, which could further optimize analytical procedures and reduce the risk of errors in manual data recording.
Finally, the implementation of the new constant-pressure system effectively addresses the cost and efficiency challenges faced by the wine industry. By reducing processing times and the use of human resources, the device increases the laboratory’s analytical capacity, allowing for a higher volume of analyses in less time and improving the response to internal demands. Additionally, by providing precise measurements of a fluid’s clogging potential, the equipment not only benefits wine bottling companies but also has the potential to be applied in other industries that require this type of analysis for informed decision-making. This versatility makes the device a useful and potentially valuable tool for improving productivity, reducing operational costs, and strengthening competitiveness across various industrial sectors.
5.2. Limitations of the Study and Future Research
The results of the study validate the device and demonstrate its effectiveness under the standard conditions defined for the tests used in measuring clogging potential. These conditions include specific parameters of pressure, temperature, filter medium, and type of fluid, which were strictly maintained during the trials. While the proposed device is suitable for replacing the pressure tank under these standard conditions, it is important to recognize that the study is limited to this specific set of variables. Therefore, variations in these parameters are not considered in this study, and additional research is required to validate the device's performance and the validity of the results under different operational conditions.
Future research should focus on developing new indicators to measure clogging potential by incorporating additional variables that affect the filtration process. It is essential to consider the actual conditions of the bottling process in laboratory tests to increase the representativeness of the measurements. Adjusting test parameters, such as pressure, flow rate, and the specific characteristics of the wine used in production, would help ensure that the measurements more accurately reflect behavior under real operational conditions. Additionally, exploring the use of this device in filtration tests in other industries, such as bioprocessing, refineries, and other processes where it is necessary to study clogging potential and pressure tank systems are used for measurement, could offer similar advantages in terms of safety, operational efficiency, and analytical precision. This expansion of the application scope would validate the device's versatility and contribute to technological advancement in areas where the optimization of filtration processes is important.
6. Conclusions
The statistical analysis conducted confirms that the proposed device based on the use of a pneumatic pumping system produces statistically similar results to those obtained with conventional pressure tank systems, as evidenced by the comparisons of the distributions and analytical results. These findings indicate that the device can be used as a reliable alternative for measuring clogging potential in the wine industry, while maintaining the accuracy of current methods
The developed device has demonstrated a significant reduction in operation times, particularly in the sample preparation and introduction stages (64.9%) and cleaning (86.2%), leading to an overall reduction of 52% in total processing time. When excluding the measurement stage, the total reduction increases to 66.2%. Additionally, the elimination of the pressurized tank enhances safety by minimizing the risks associated with high-pressure systems. This improvement frees up operational time, increasing the laboratory’s analytical capacity and allowing personnel to be reassigned to other critical tasks. These factors make the device a more efficient and safer option for implementation in industrial environments.
The results of the user survey showed a high level of satisfaction with the proposed device in terms of handling, design, and safety. Additionally, the evidence obtained indicates that the majority of users believe that incorporating an automated data reading and capture system would improve the process by enabling continuous recording and immediate calculation of key indicators. This evidence is important to consider in future developments or improvements to the device, as it would help enhance accuracy, reduce manual errors, and improve decision-making based on real-time data.
The results of this study clearly demonstrate how the application of science to industrial challenges can generate innovative and effective solutions. In particular, this work establishes a solid technical and methodological foundation for future advancements in the measurement of clogging potential in different fluids. In this context, it is essential to emphasize the importance of integrating scientific knowledge with a deep understanding of industrial processes and challenges, as this facilitates the development of tools and solutions designed to effectively support operational decision-making. This approach contributes to operational efficiency while simultaneously enhancing process safety and fostering value creation in the industry.
Author Contributions
Conceptualization, L.L.O., J.C., H.d.F.-M.; methodology, L.L.O., J.C., H.d.F.-M.; software, L.L.O.; validation, L.L.O., J.C., H.d.F.-M.; formal analysis, L.L.O., J.C., H.d.F.-M.; investigation, L.L.O., J.C.; resources, L.L.O., H.d.F.-M.; data curation, L.L.O., J.C., H.d.F.-M.; writing—original draft preparation, L.L.O.; writing—review and editing, J.C., H.d.F.-M.; visualization, L.L.O.; supervision, J.C., L.L.O.; project administration, L.L.O., H.d.F.-M.; funding acquisition, H.d.F.-M. All authors have read and agreed to the published version of the manuscript.
Funding
The research work of H. de la Fuente-Mella was partially supported by Proyecto FONDECYT Regular. Código del Proyecto: 1230881. Agencia Nacional de Investigación y Desarrollo de Chile (ANID).
Institutional Review Board Statement
Not applicable.
Informed Consent Statement
Not applicable.
Data Availability Statement
The data used to support the findings of this study are available from the corresponding author upon request.
Conflicts of Interest
The authors declare no conflicts of interest.
References
- J. Ubeda y A. Briones, «Microbiological quality control of filtered and non-filtered wines», Food Control, vol. 10, n.o 1, pp. 41-45, feb. 1999, Accedido: 26 de noviembre de 2023. [En línea]. Disponible en: https://linkinghub.elsevier.com/retrieve/pii/S095671359800156X.
- K. Perić, M. Tomašević, N. Ćurko, M. Brnčić, y K. Kovačević Ganić, «Non-Thermal Technology Approaches to Improve Extraction, Fermentation, Microbial Stability, and Aging in the Winemaking Process», Appl. Sci., vol. 14, n.o 15, p. 6612, jul. 2024. [CrossRef]
- C. M. Sheridan, F. F. Bauer, S. Burton, y L. Lorenzen, «A critical process analysis of wine production to improve cost, quality and environmental performance», Water Sci. Technol., vol. 51, n.o 1, pp. 39-46, ene. 2005, Accedido: 28 de noviembre de 2023. [En línea]. Disponible en: https://iwaponline.com/wst/article/51/1/39/11224/A-critical-process-analysis-of-wine-production-to.
- A. Vernhet, «Red Wine Clarification and Stabilization», en Red Wine Technology, Elsevier, 2019, pp. 237-251. [CrossRef]
- Y. El Rayess y M. Mietton-Peuchot, «Membrane Technologies in Wine Industry: An Overview», Crit. Rev. Food Sci. Nutr., vol. 56, n.o 12, pp. 2005-2020, sep. 2016. [CrossRef]
- Y. Zhang, A. Xu, X. Lv, Q. Wang, C. Feng, y J. Lin, «Non-Invasive Measurement, Mathematical Simulation and In Situ Detection of Biofilm Evolution in Porous Media: A Review», Appl. Sci., vol. 11, n.o 4, p. 1391, feb. 2021. [CrossRef]
- K. Sutherland, Filters and filtration Handbook, 5e éd. Oxford: Elsevier/Butterworth-Heinemann, 2008.
- A. Seabrook, B. Nazaris, y J. Barthoux, «Filtration: Factors around wine filterability», Aust. N. Z. Grapegrow. Winemak., n.o 674, pp. 48-50, 2020.
- M. Rosária, M. Oliveira, A. C. Correia, y A. M. Jordão, «Impact of Cross-Flow and Membrane Plate Filtrations under Winery-Scale Conditions on Phenolic Composition, Chromatic Characteristics and Sensory Profile of Different Red Wines», Processes, vol. 10, n.o 2, p. 284, ene. 2022. [CrossRef]
- P. Catania, M. Vallone, D. Planeta, y F. Pipitone, «Analysis of the filtration efficiency of white wines using different filter aids», J. Agric. Eng., vol. 41, n.o 1, p. 7, mar. 2010, Accedido: 14 de noviembre de 2023. [En línea]. Disponible en: http://www.agroengineering.org/index.php/jae/article/view/jae.2010.1.7.
- E. Marone, M. Bertocci, F. Boncinelli, y N. Marinelli, «The cost of making wine: A Tuscan case study based on a full cost approach», Wine Econ. Policy, vol. 6, n.o 2, pp. 88-97, 2017.
- B. Zoecklein, B. Gump, y F. Nury, Wine analysis and production. Springer Science & Business Media, 2013.
- Z. Feng, W. Pan, Y. Wang, y Z. Long, «Modeling filtration performance of pleated fibrous filters by Eulerian-Markov method», Powder Technol., vol. 340, pp. 502-510, dic. 2018, Accedido: 4 de diciembre de 2023. [En línea]. Disponible en: https://linkinghub.elsevier.com/retrieve/pii/S0032591018307654.
- International Organisation of Vine and Wine, «World Wine Production Outlook». 2023. [En línea]. Disponible en: https://www.oiv.int/sites/default/files/documents/OIV_World_Wine_Production_Outlook_2023.pdf.
- Y. Peleg y R. C. Brown, «Method for Evaluating the Filterability of Wine and Similar Fluids», J. Food Sci., vol. 41, n.o 4, pp. 805-808, jul. 1976, Accedido: 28 de noviembre de 2023. [En línea]. Disponible en: . [CrossRef]
- J.-J. Descout, J. Bordier, J. Laurenty, y G. Guimberteau, «Contribution à l’étude des phénomènes de colmatage lors de la filtratïon des vins sur filtre écran», OENO One, vol. 10, n.o 1, p. 93, mar. 1976.
- «Bowyer, P., Edwards, G., & Eyre, A. (2012). NTU vs wine filterability index–what does it mean for you. The Australian and New Zealand Grapegrower and Winemaker, 585, 76-80.».
- A. Alarcon-Mendez y R. Boulton, «Automated Measurement and Interpretation of Wine Filterability», Am. J. Enol. Vitic., vol. 52, n.o 3, pp. 191-197, 2001.
- Columbia University, «Compressed gas safety manual for research operations». 2020. [En línea]. Disponible en: https://research.columbia.edu/sites/default/files/content/EHS/Lab%20Safety/CompressedGas/CompressedGasManual.pdf.
- A. Kossiakoff, S. M. Biemer, S. J. Seymour, y D. A. Flanigan, Systems engineering: principles and practice, Third edition. en Wiley series in systems engineering and management. Hoboken, NJ: John Wiley & Sons, Inc, 2020.
- R. B. Boulton, V. L. Singleton, L. F. Bisson, y R. E. Kunkee, «The Fining and Clarification of Wines», en Principles and Practices of Winemaking, Boston, MA: Springer US, 1999, pp. 279-319. [CrossRef]
- F. Tosi, «Design for Ergonomics», en Design for Ergonomics, vol. 2, en Springer Series in Design and Innovation, vol. 2. , Cham: Springer International Publishing, 2020, pp. 31-45. [CrossRef]
- W. D. Seider, D. R. Lewin, J. D. Seader, S. Widagdo, R. Gani, y K. M. Ng, Product and process design principles: synthesis, analysis and evaluation, Fourth edition. New York: Wiley, 2017.
- P. E. Vermaas, «Design Methodology and Engineering Design: From Technical Problem Solving to Social Exploration», en Engineering Identities, Epistemologies and Values, vol. 21, S. H. Christensen, C. Didier, A. Jamison, M. Meganck, C. Mitcham, y B. Newberry, Eds., en Philosophy of Engineering and Technology, vol. 21. , Cham: Springer International Publishing, 2015, pp. 147-159. [CrossRef]
- A. Dean, D. Voss, y D. Draguljić, Design and Analysis of Experiments. en Springer Texts in Statistics. Cham: Springer International Publishing, 2017. [CrossRef]
- Y. Peleg, R. C. Brown, P. W. Starcevich, y R. Asher, «Method for Evaluating the Filterability of Wine and Similar Fluids», Am. J. Enol. Vitic., vol. 30, n.o 3, pp. 174-178, 1979, Accedido: 28 de noviembre de 2023. [En línea]. [CrossRef]
- P. Czekaj, F. López, y C. Güell, «Membrane fouling during microfiltration of fermented beverages», J. Membr. Sci., vol. 166, n.o 2, pp. 199-212, mar. 2000. [CrossRef]
- P. Sedgwick, «A comparison of parametric and non-parametric statistical tests», BMJ, vol. 350, n.o apr17 1, pp. h2053-h2053, abr. 2015, Accedido: 22 de noviembre de 2023. [En línea]. [CrossRef]
- O. B. Sayeed, «Questionnaire Design for Survey Research», en Essays on Research Methodology, D. S. Hegde, Ed., New Delhi: Springer India, 2015, pp. 185-211. [CrossRef]
- De Leeuw, E. D., Hox, J., & Dillman, D., International handbook of survey methodology. Routledge. Routledge., 2012.
- N. Tang y S.-M. Lee, Eds., Statistical Methods in Data Science and Applications. MDPI, 2024. [CrossRef]
- A. Vallet-Courbin et al., «A New Test of Filterability for Unprocessed Wines Evaluation of the Enzyme Efficiency», J. Food Eng. Technol., vol. 10, n.o 2, pp. 55-66, dic. 2021. [CrossRef]
- F. De La Garza y R. Boulton, «The Modeling of Wine Filtrations», Am. J. Enol. Vitic., vol. 35, n.o 4, pp. 189-195, 1984.
Figure 1.
Relationship between time and filtered volume, highlighting the values used for the calculation of Vmax, FI, FMI.
Figure 1.
Relationship between time and filtered volume, highlighting the values used for the calculation of Vmax, FI, FMI.
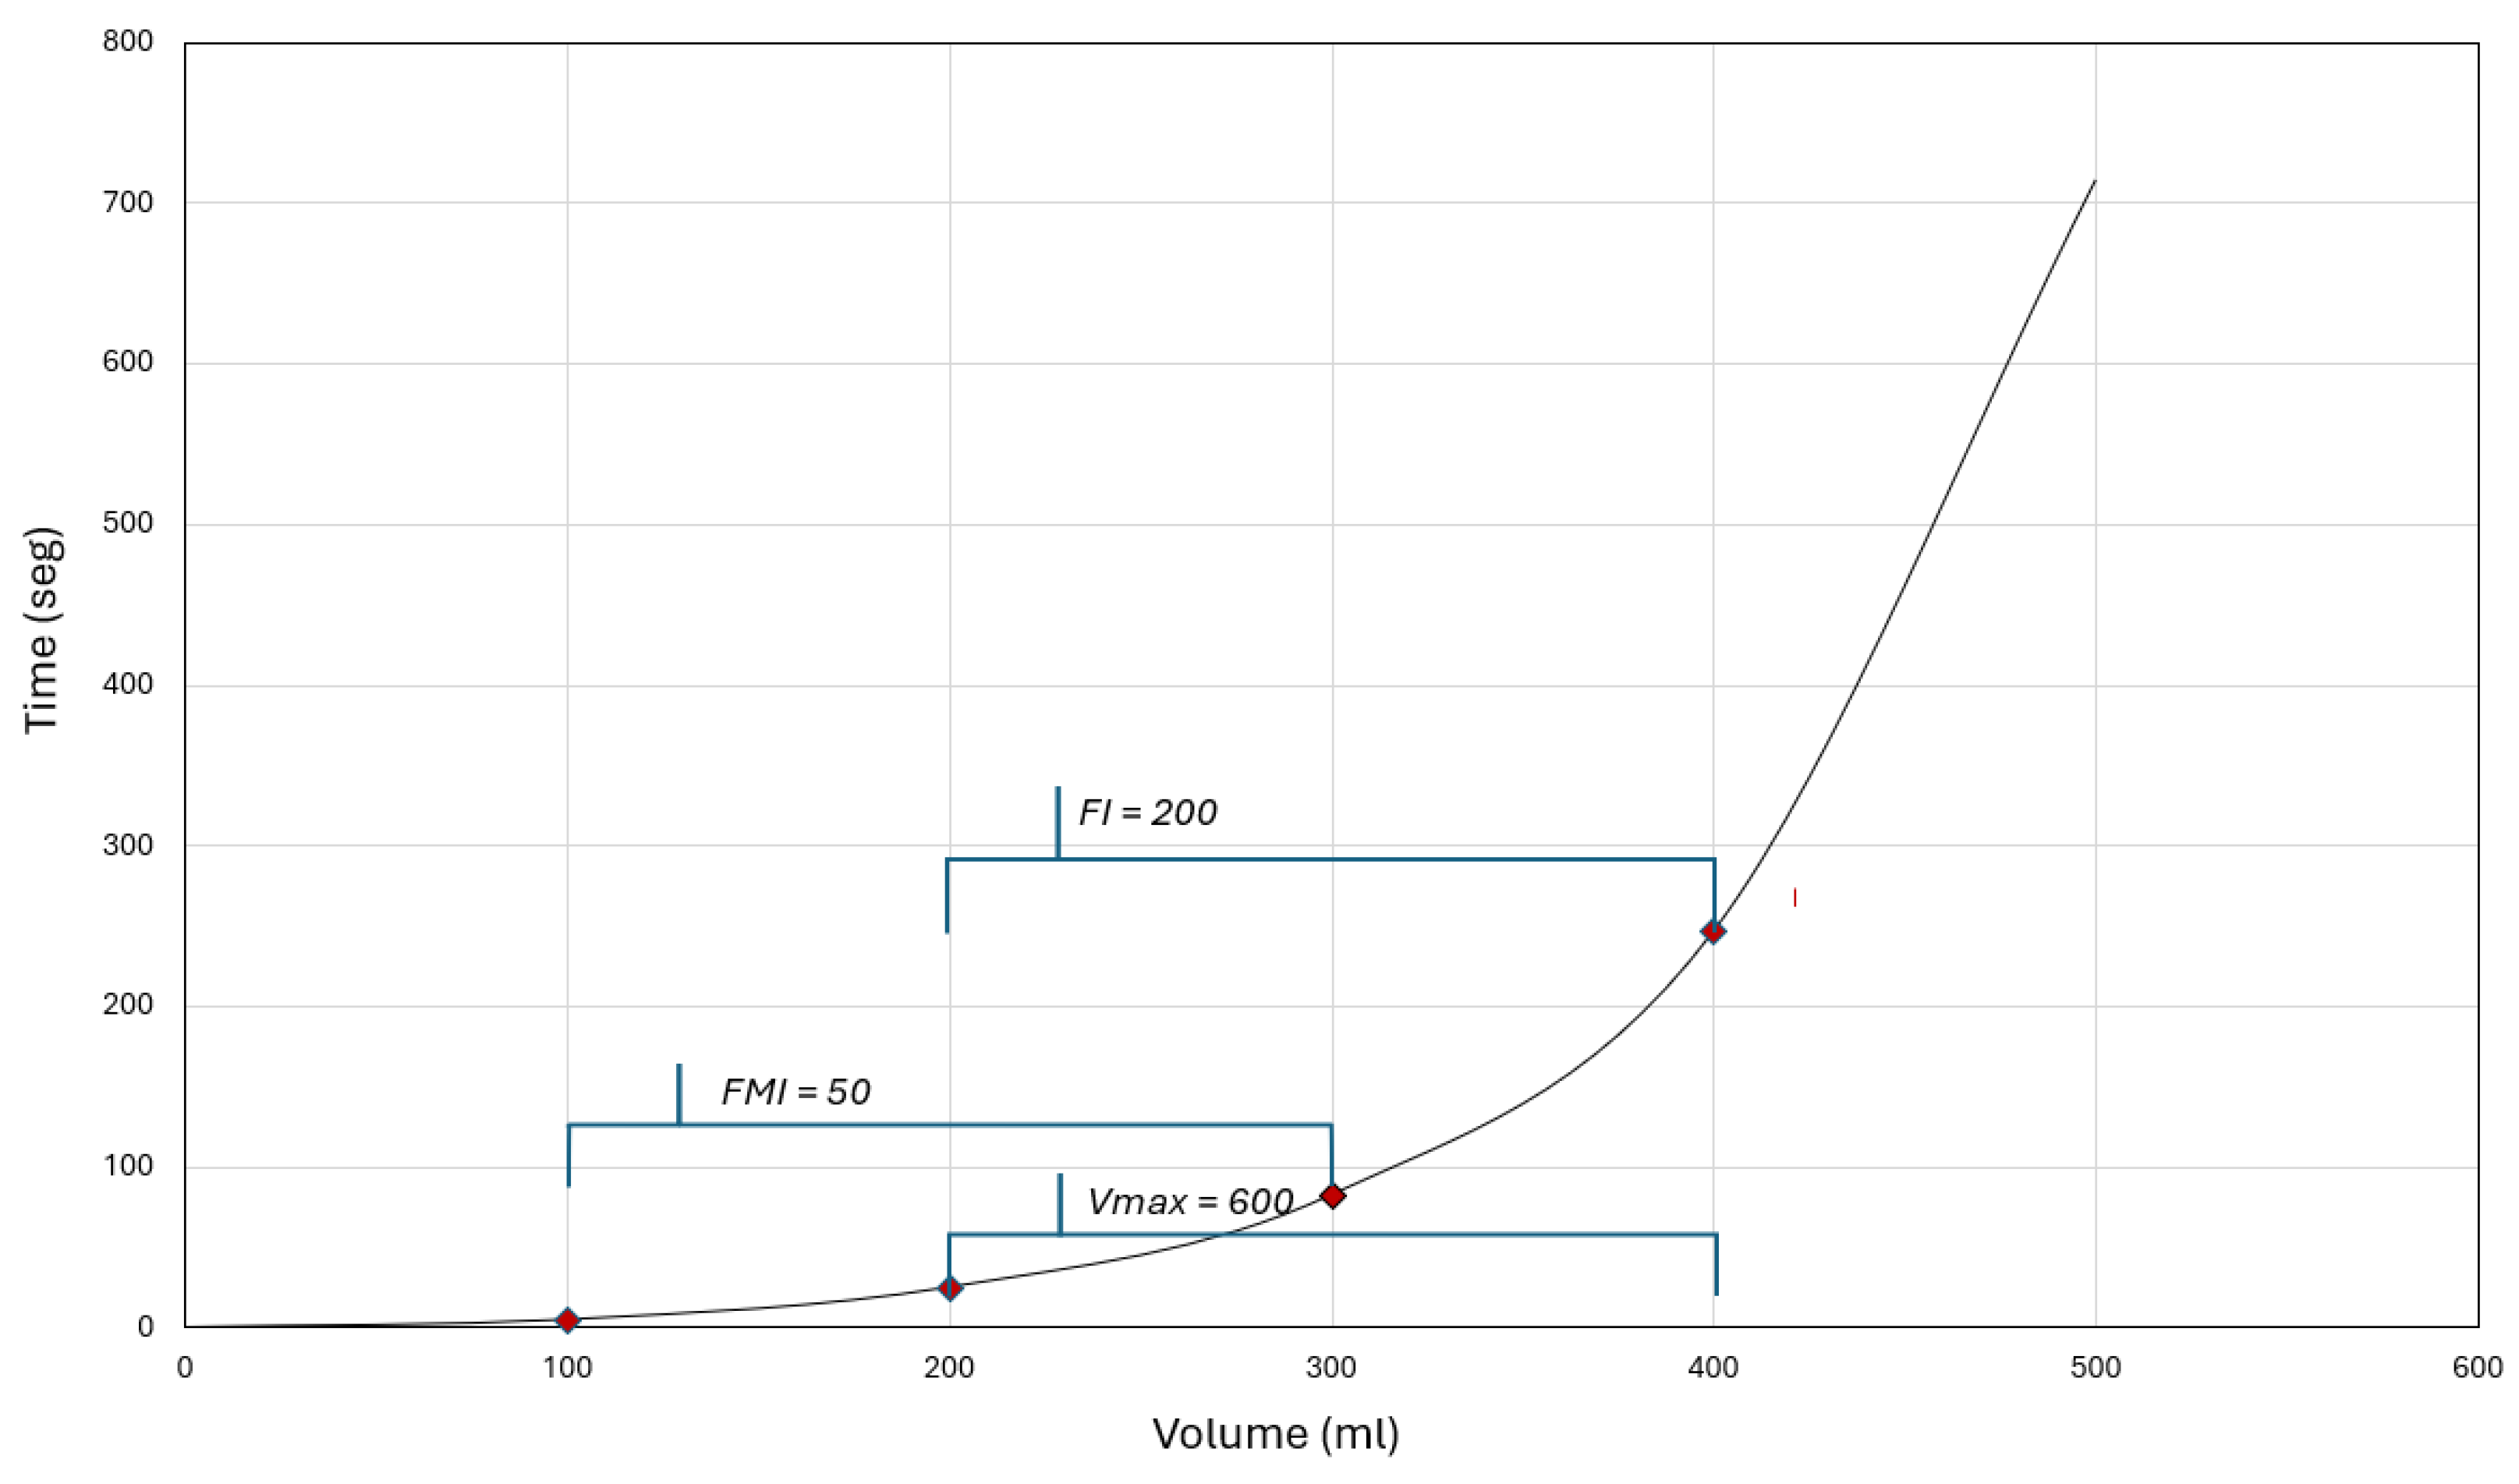
Figure 2.
Parts and components of the system based on the use of a pressure tank.
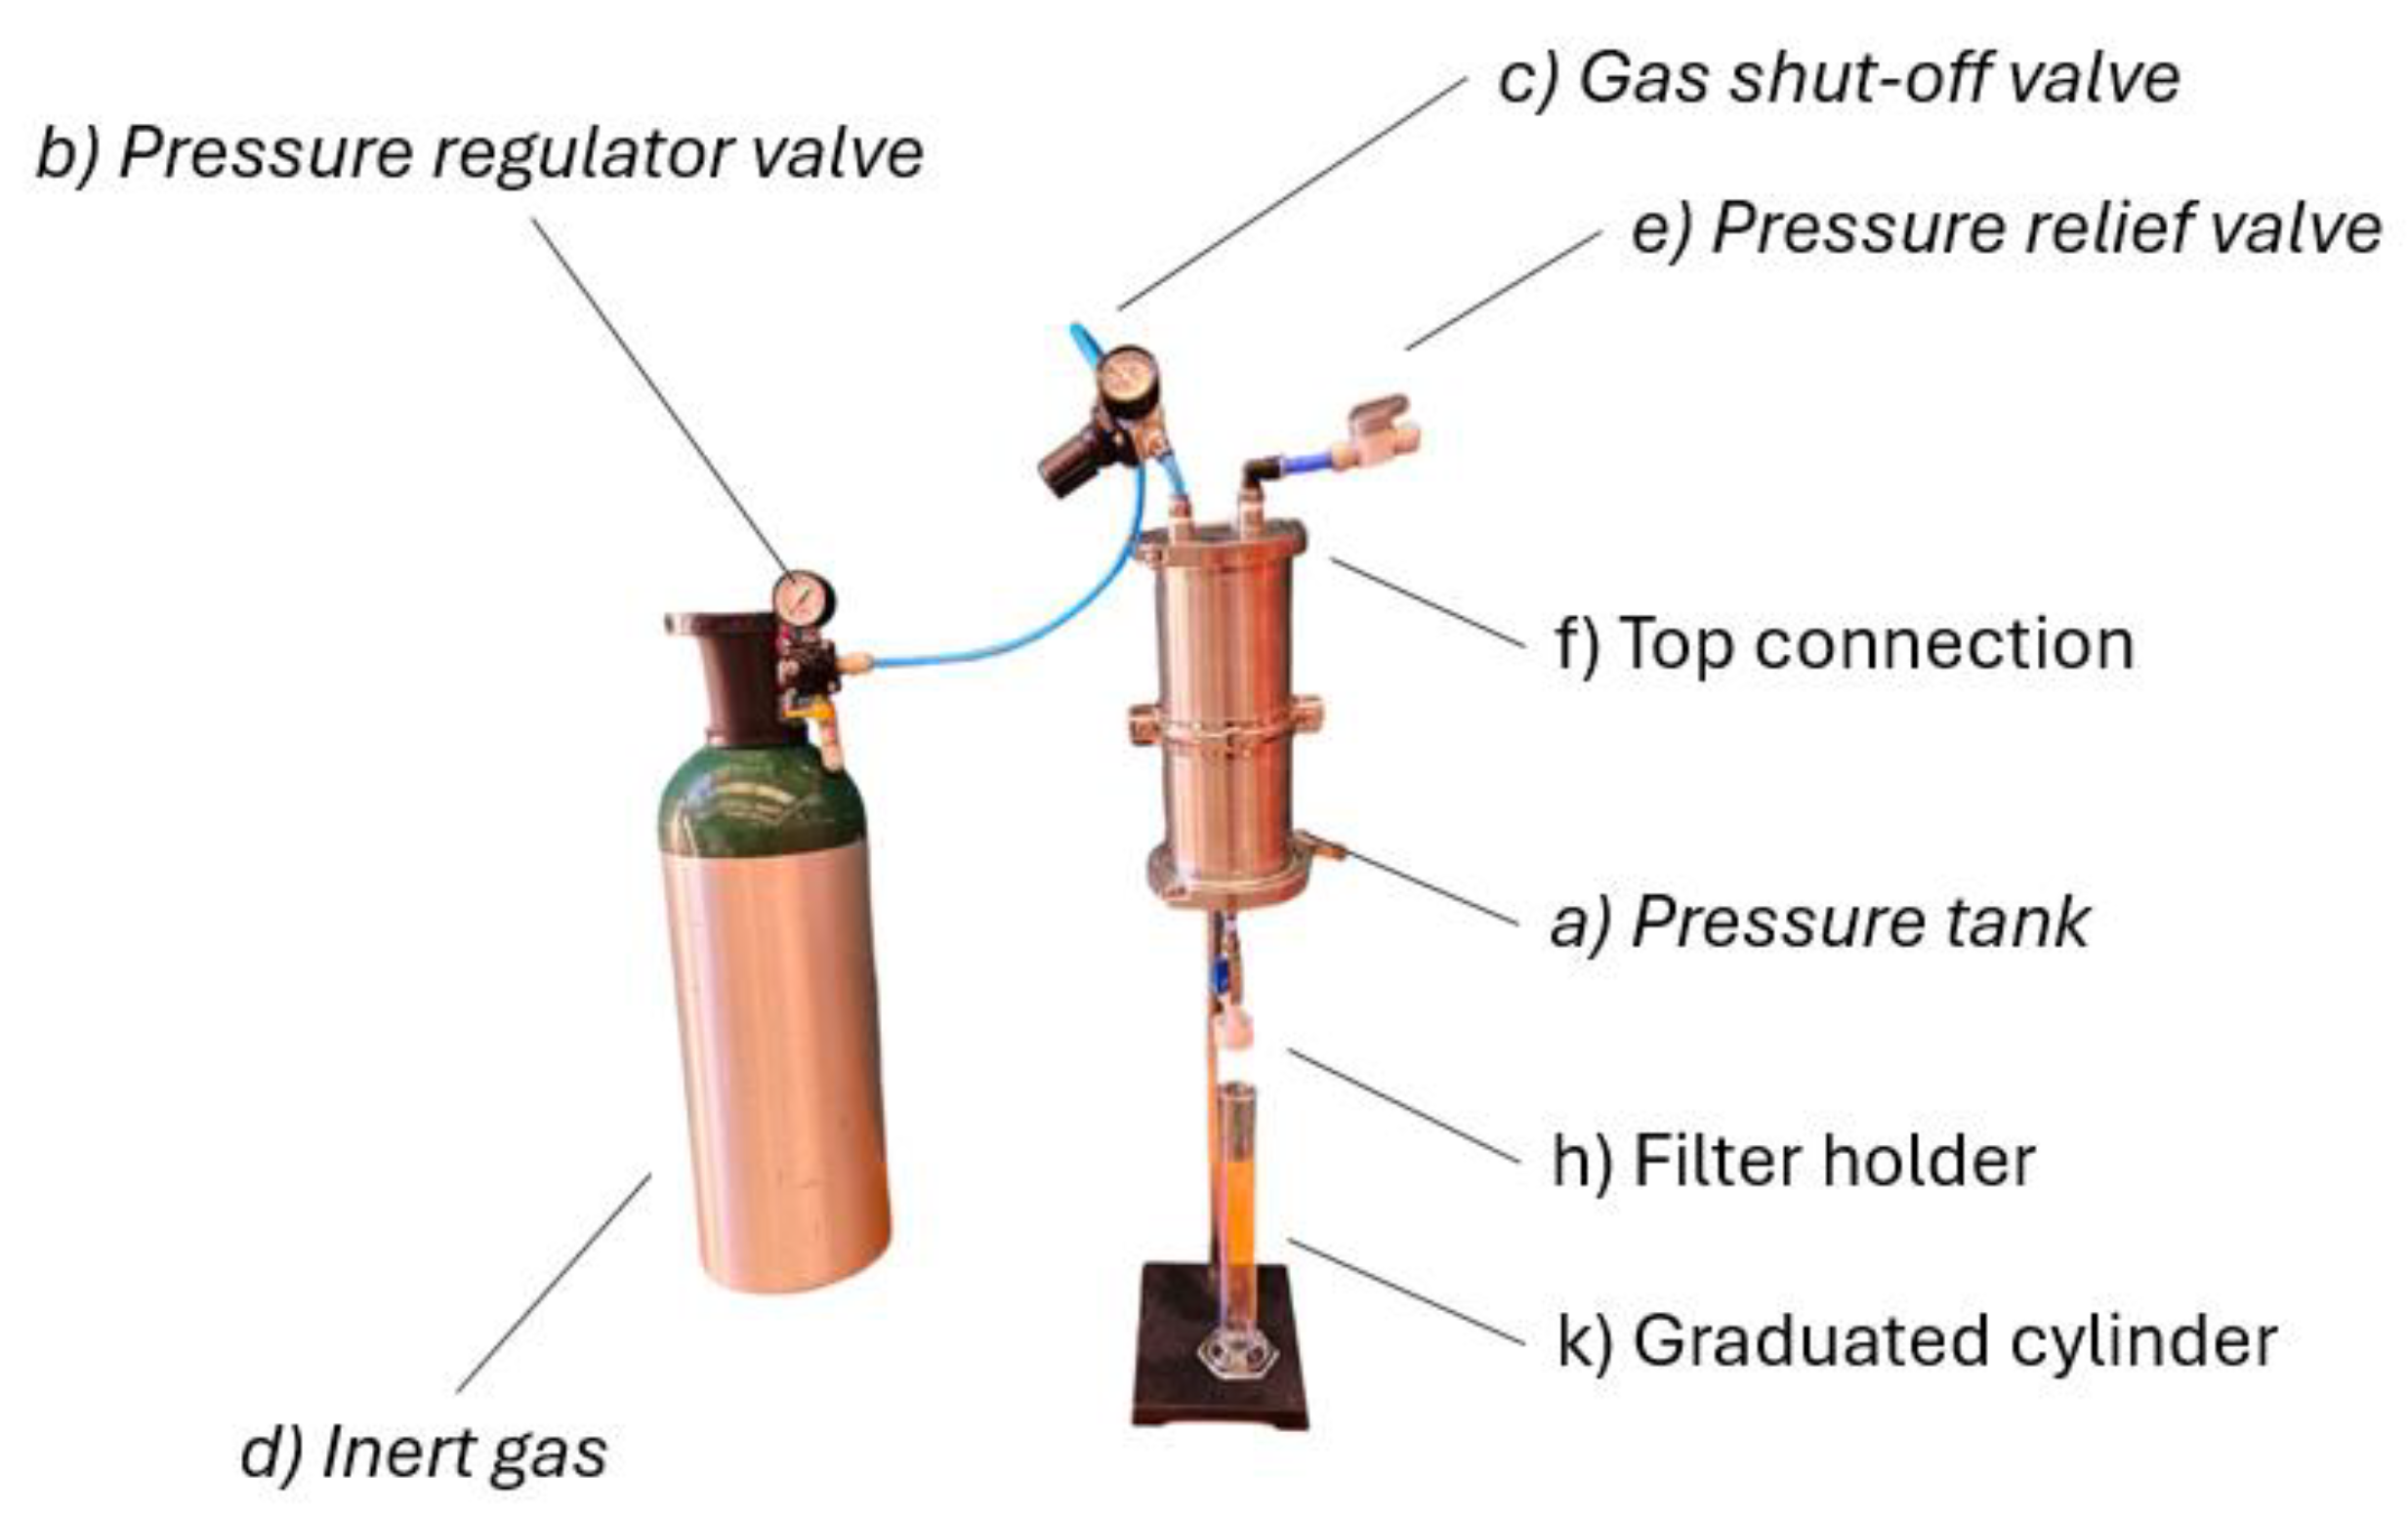
Figure 3.
Diagram of components of the proposed system based on the use of a pneumatic pumping system with constant pressure.
Figure 3.
Diagram of components of the proposed system based on the use of a pneumatic pumping system with constant pressure.
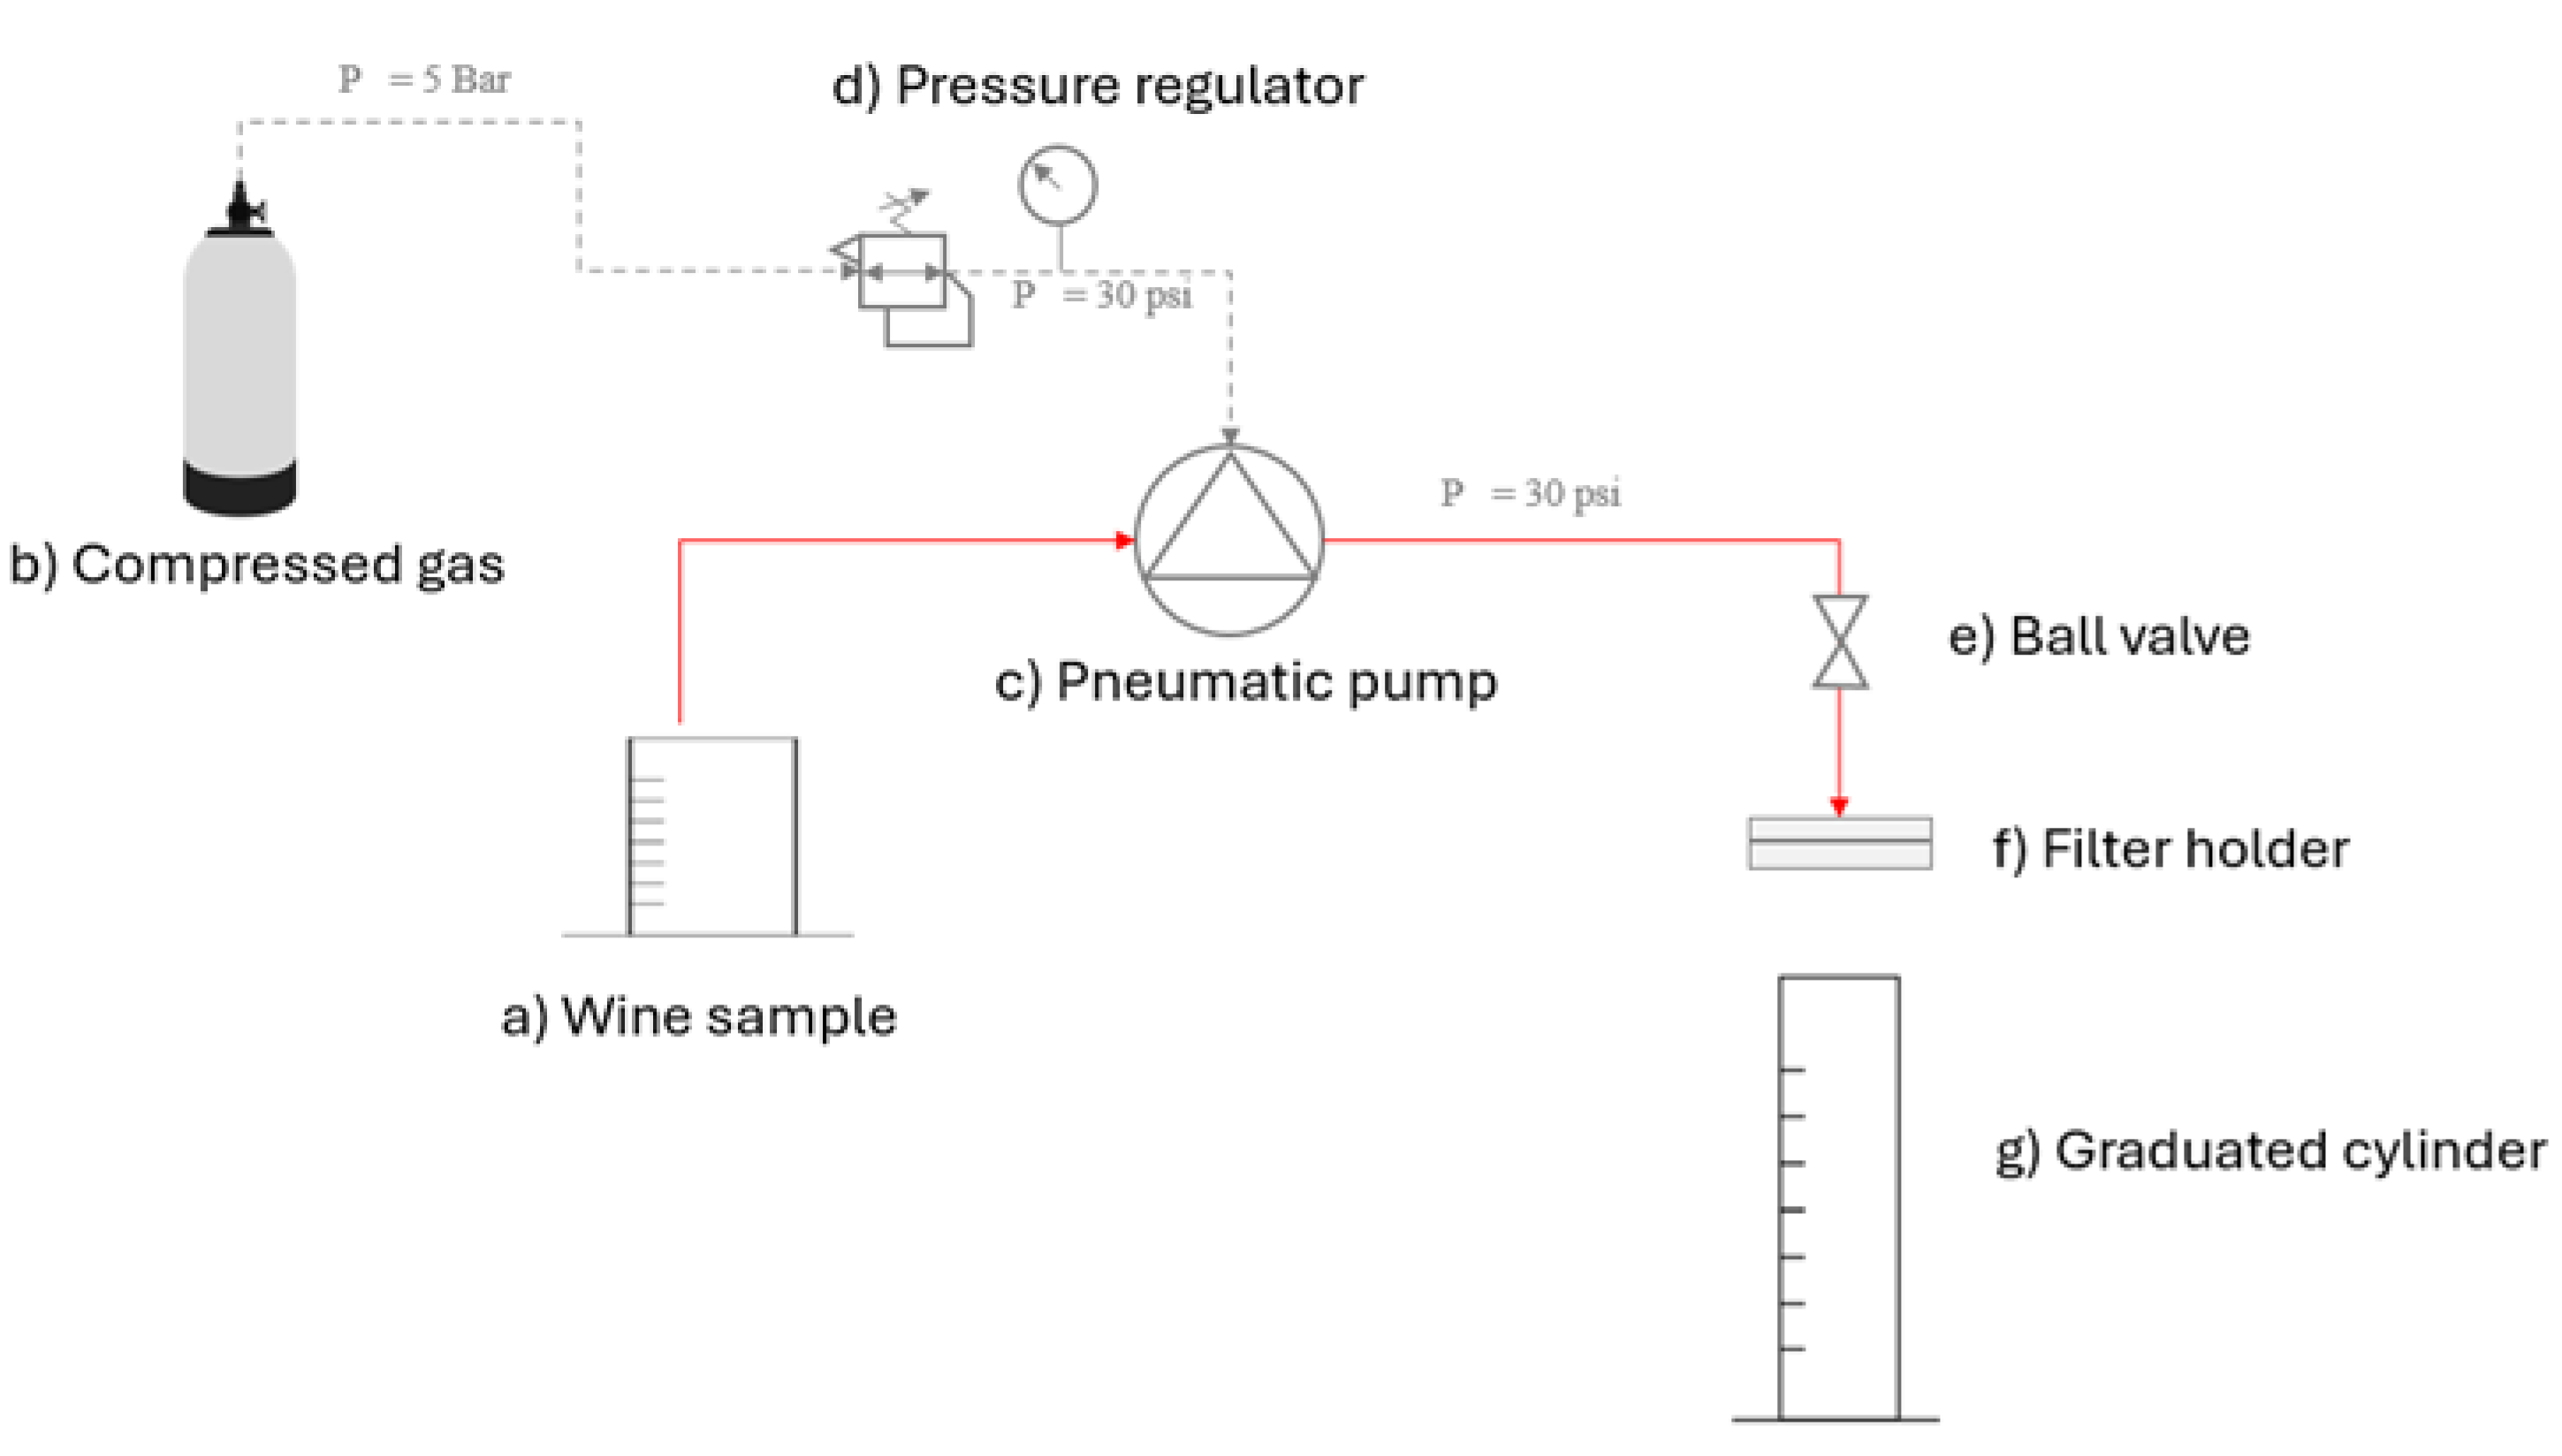
Figure 5.
Graphical interface used for data capture.
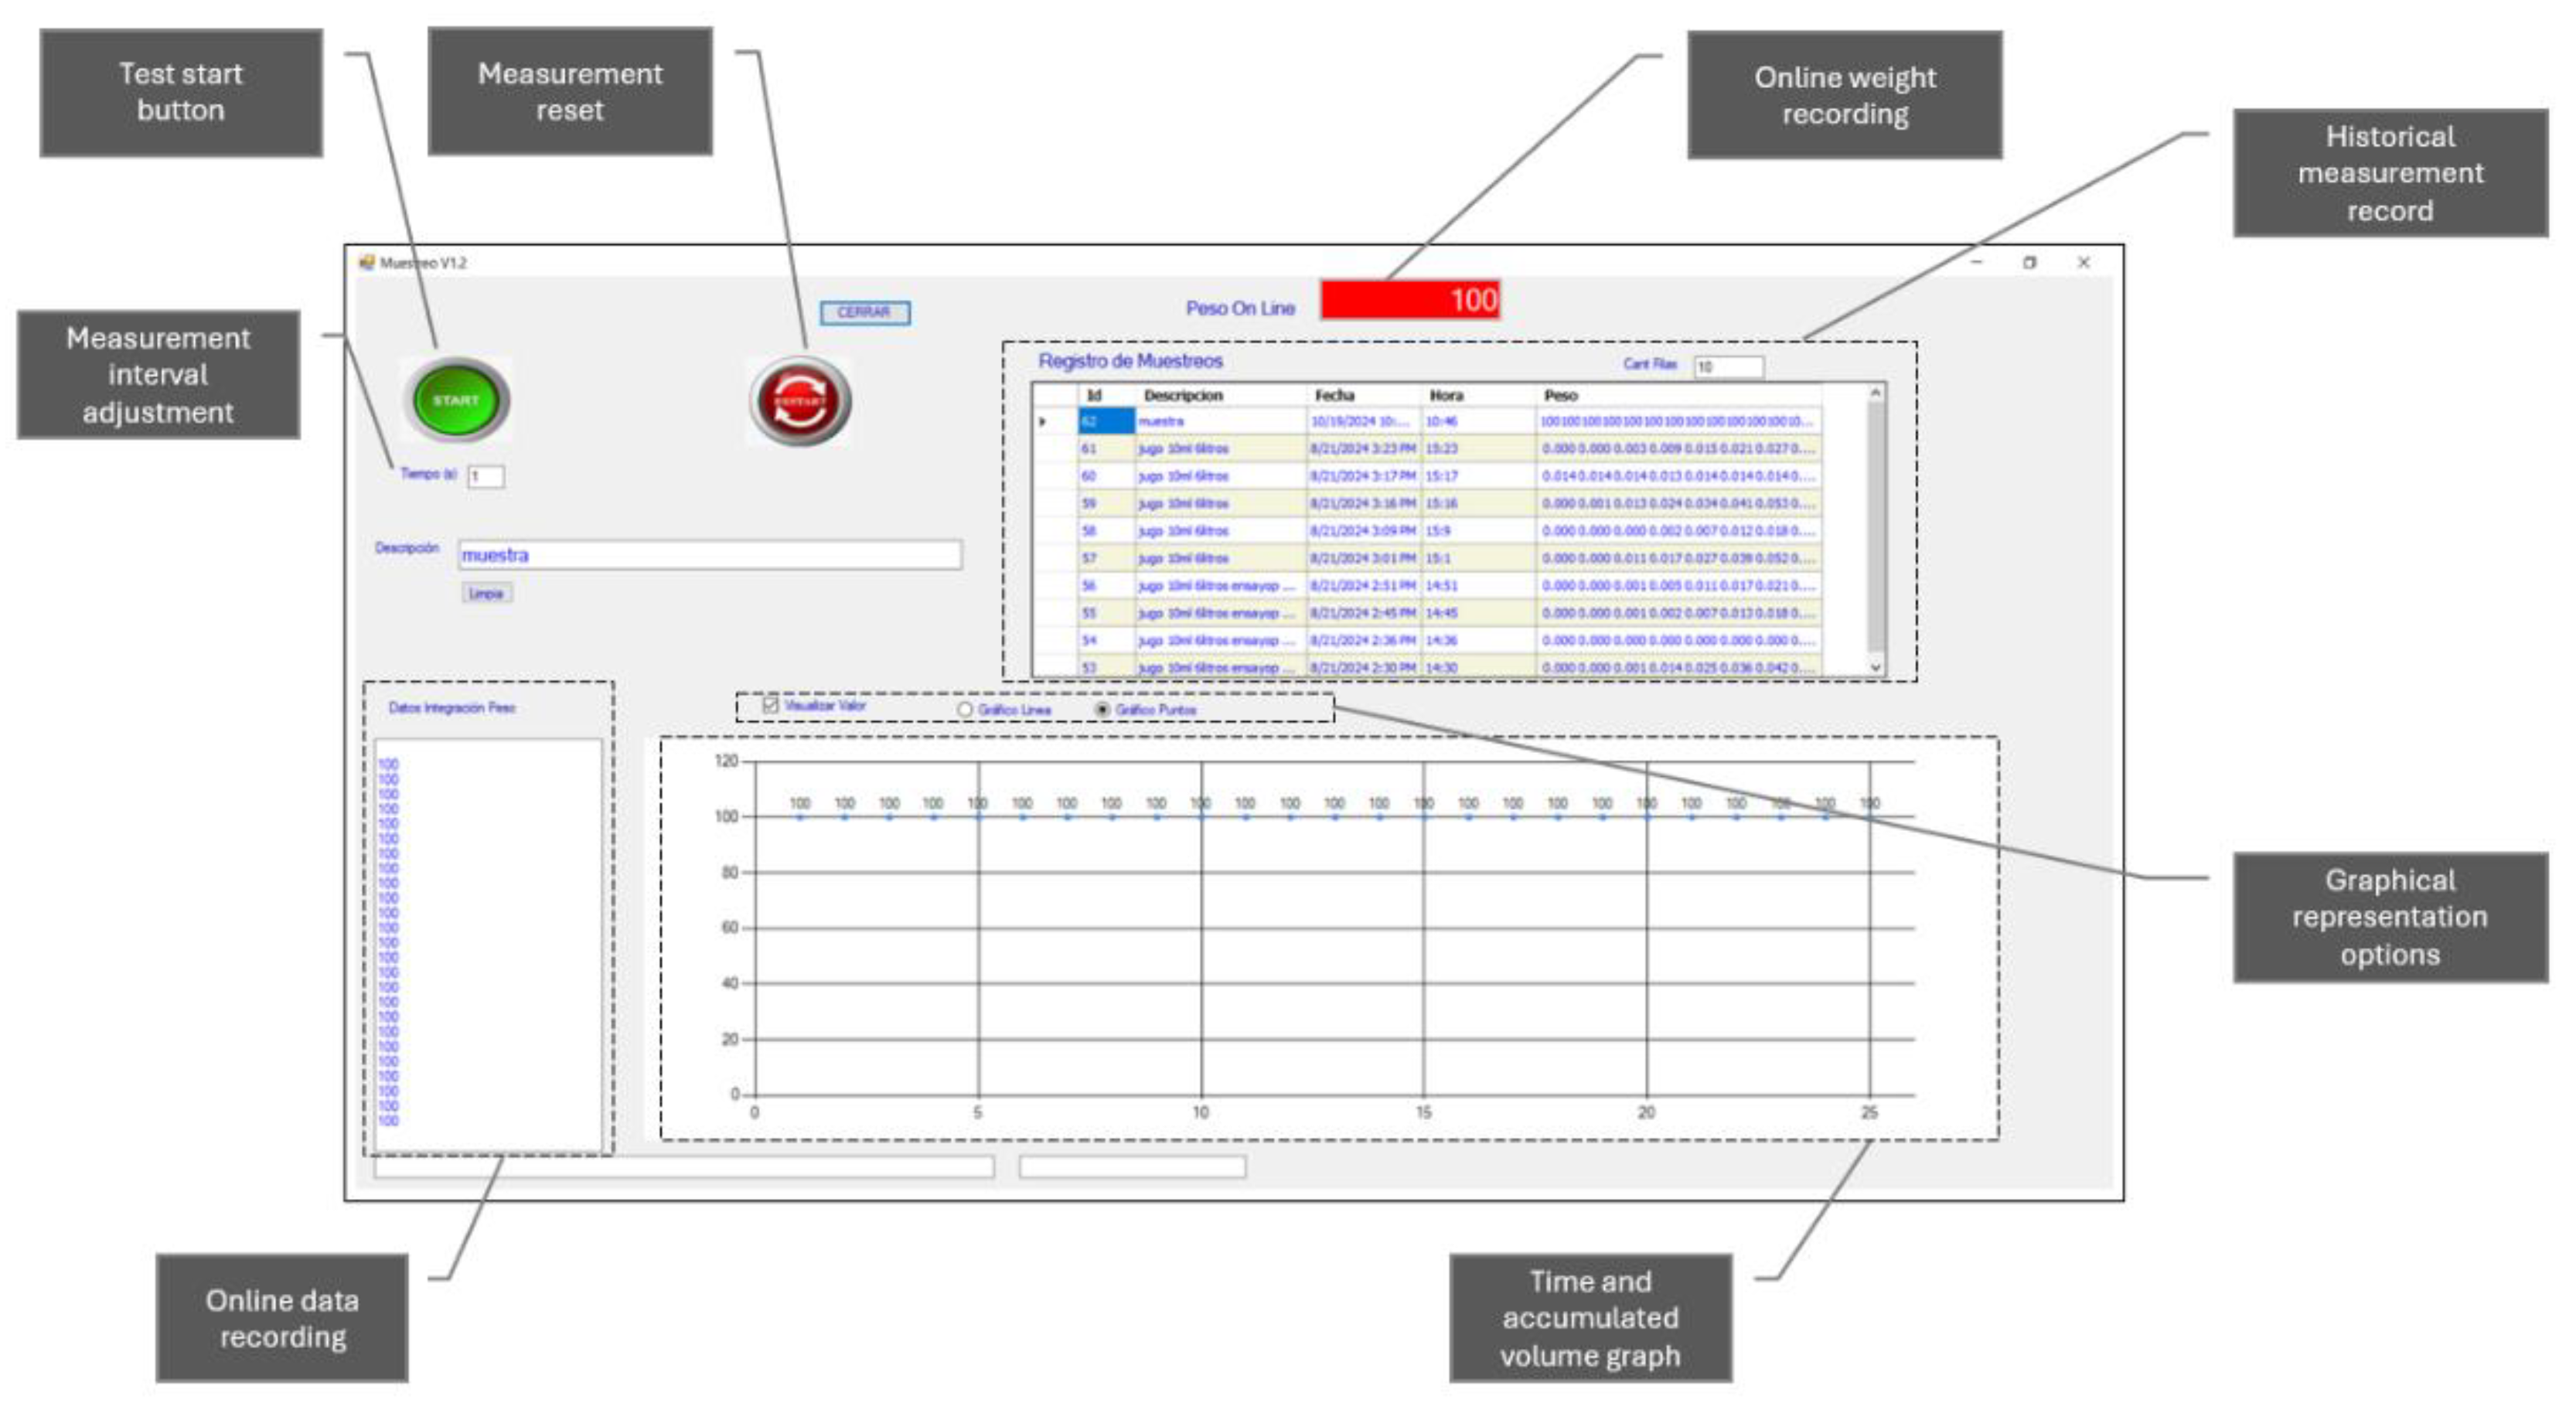
Figure 6.
Result of the average times measured at each stage of the measurement process.
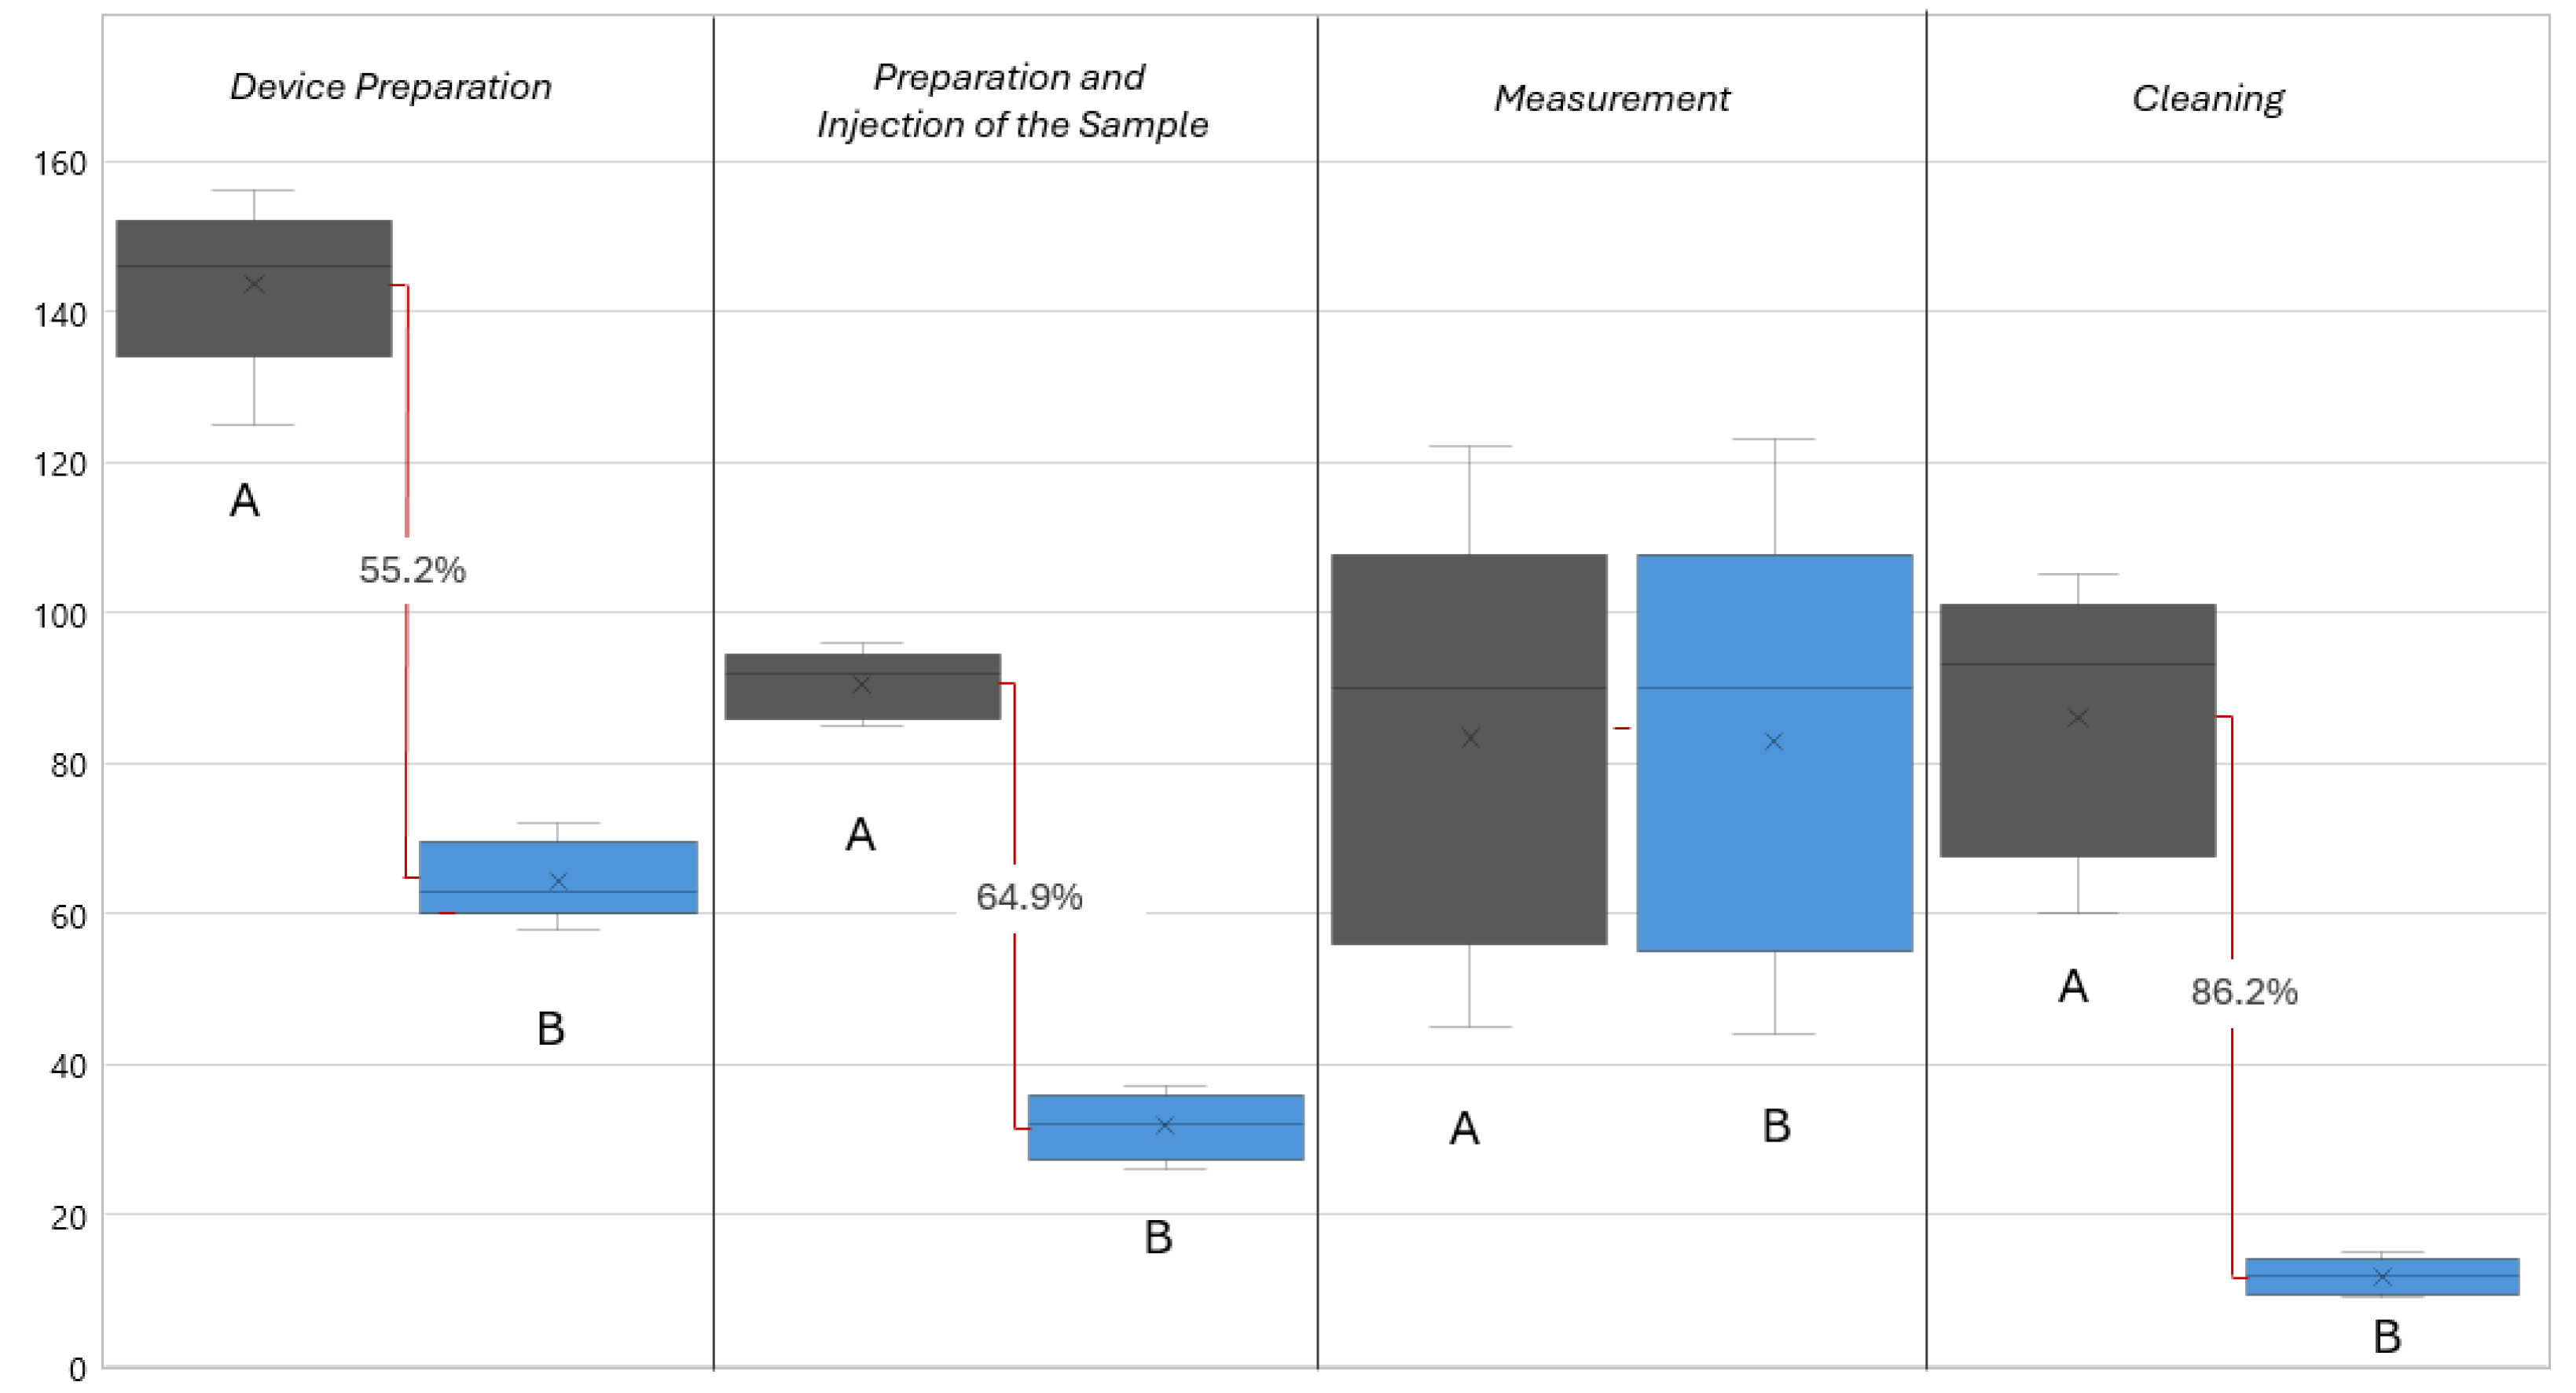
Figure 7.
Result of the user survey.
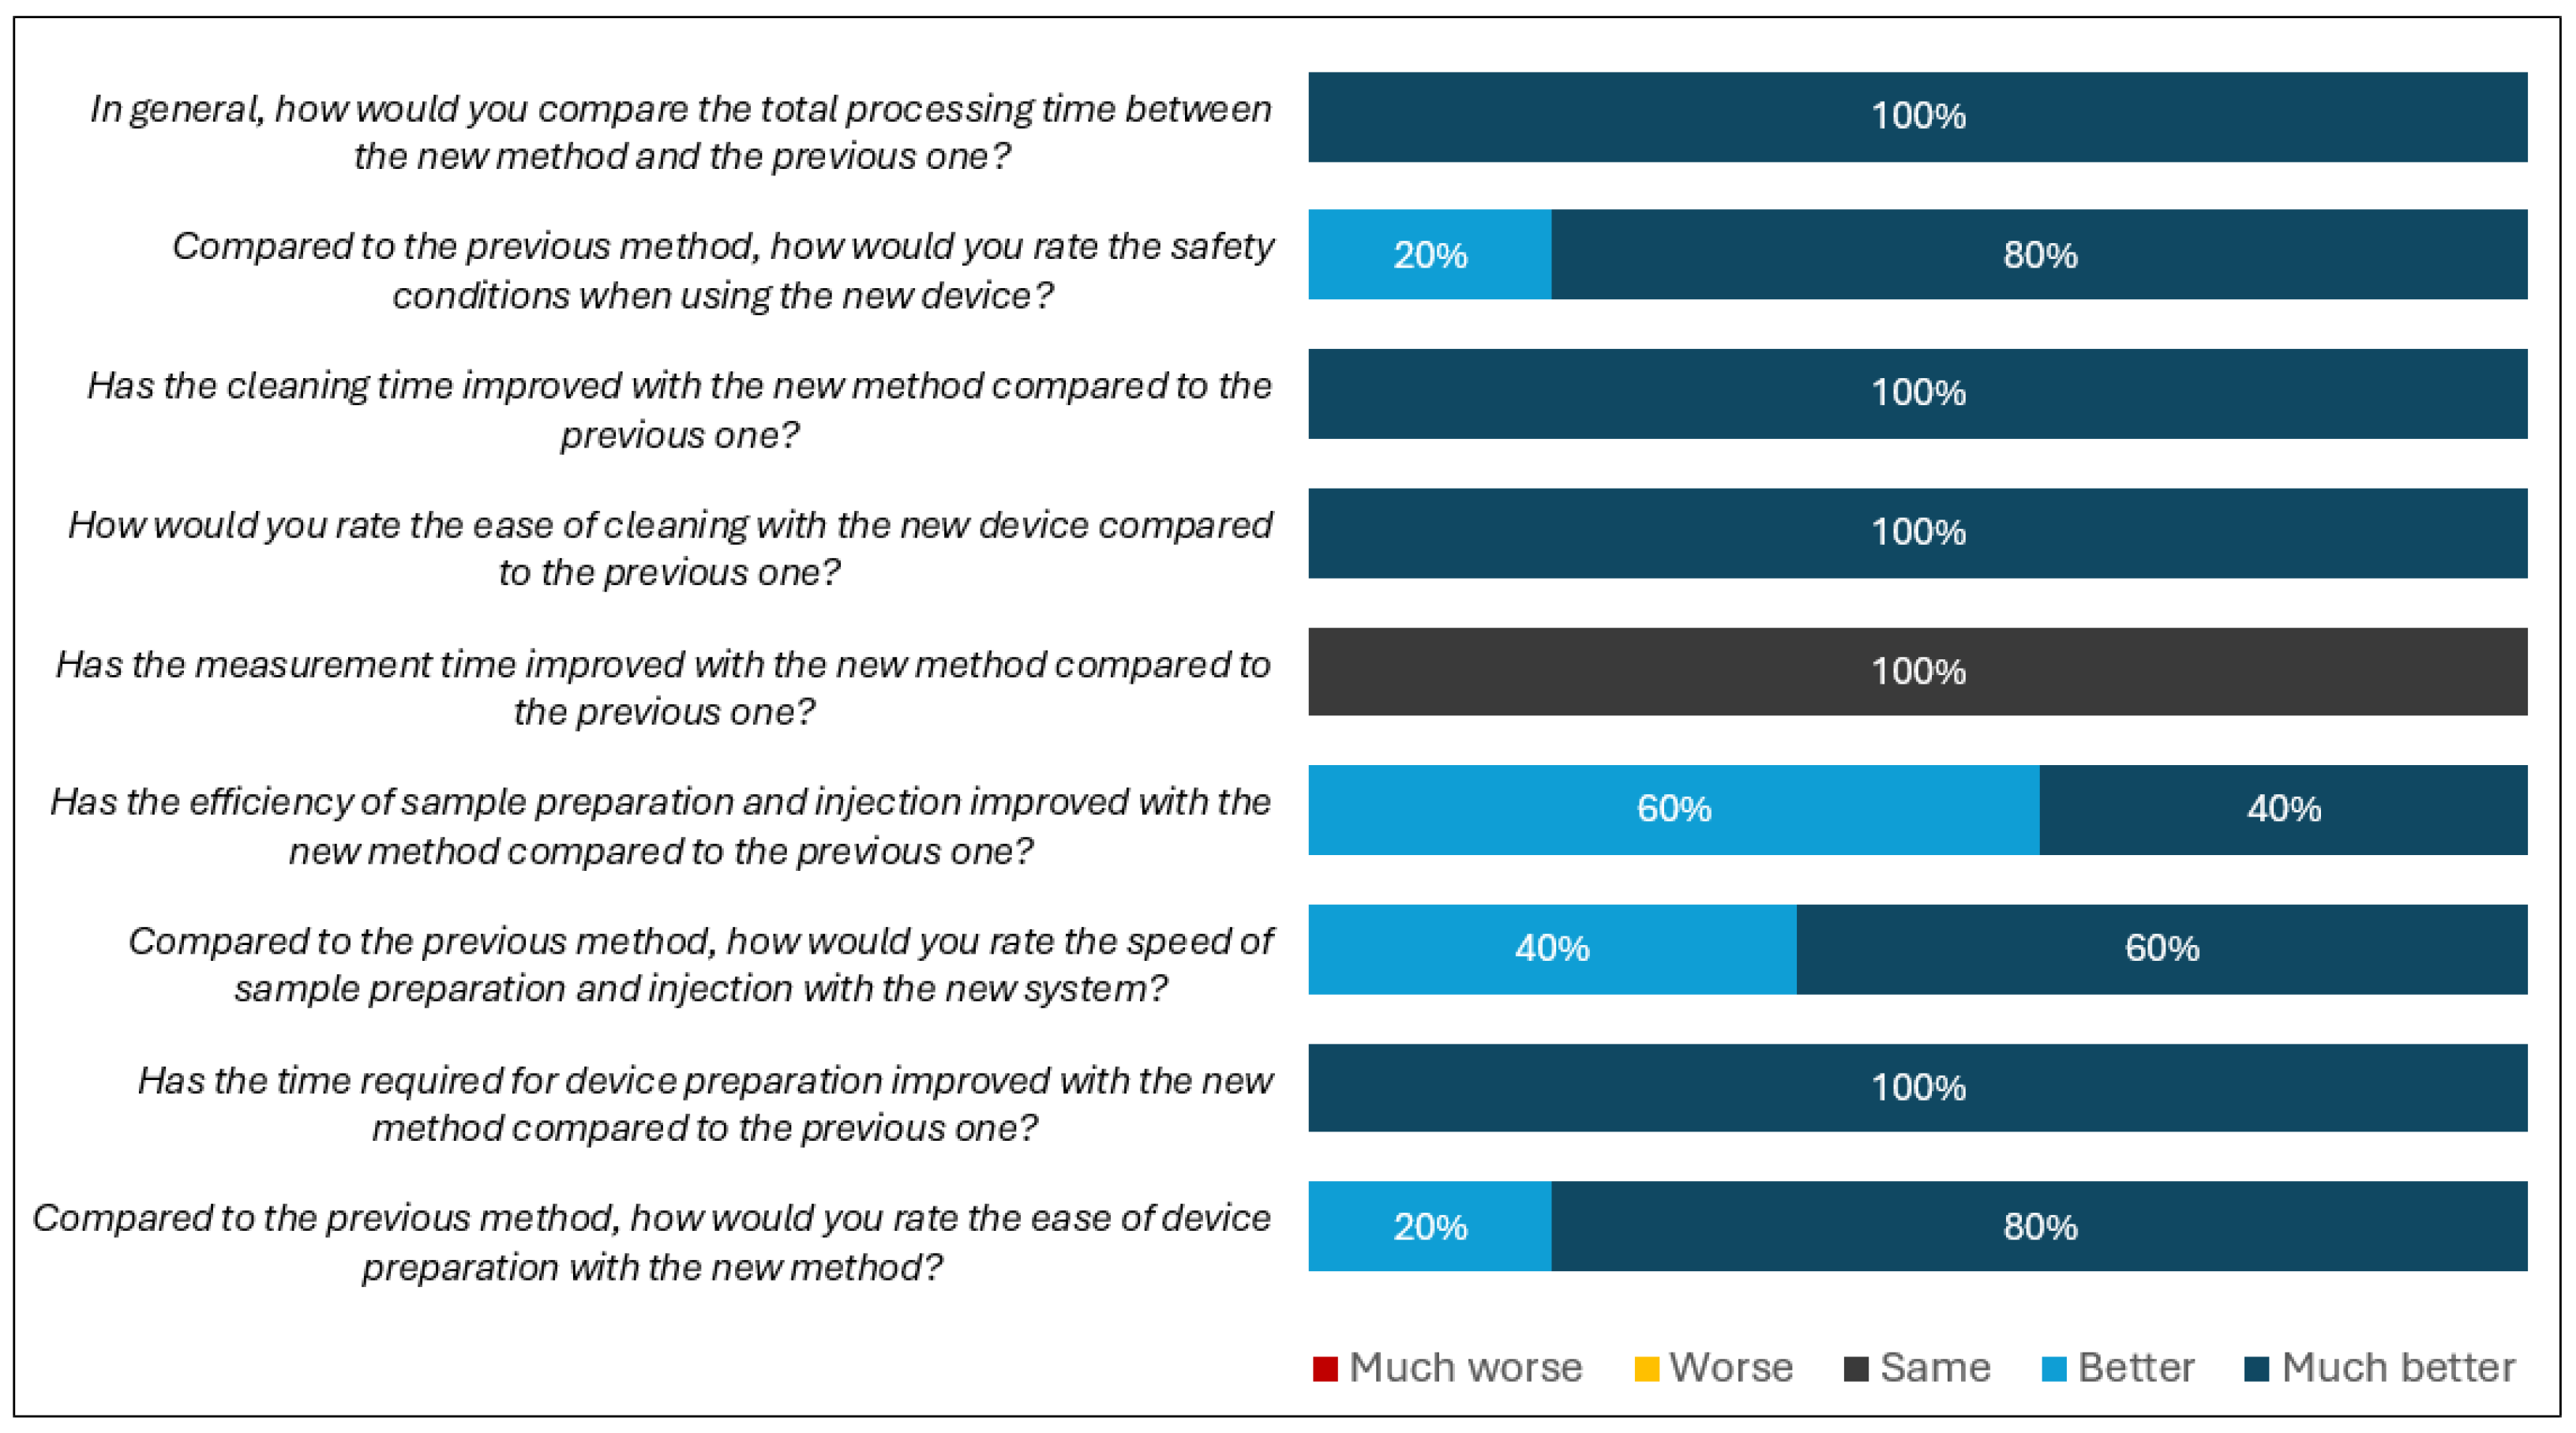

Table 1.
Comparative analysis of the wine samples analyzed by Vmax, FI, and FMI.
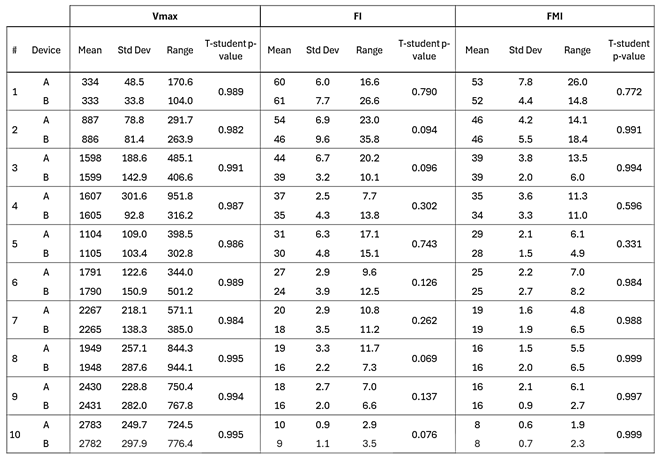 |
Table 2.
CResult of the KS statistic and p-value for the 6 samples.
 |
Disclaimer/Publisher’s Note: The statements, opinions and data contained in all publications are solely those of the individual author(s) and contributor(s) and not of MDPI and/or the editor(s). MDPI and/or the editor(s) disclaim responsibility for any injury to people or property resulting from any ideas, methods, instructions or products referred to in the content. |
© 2024 by the authors. Licensee MDPI, Basel, Switzerland. This article is an open access article distributed under the terms and conditions of the Creative Commons Attribution (CC BY) license (http://creativecommons.org/licenses/by/4.0/).
Copyright: This open access article is published under a Creative Commons CC BY 4.0 license, which permit the free download, distribution, and reuse, provided that the author and preprint are cited in any reuse.


