

Submitted:
12 November 2024
Posted:
13 November 2024
You are already at the latest version
Abstract
The excessive use of fossil fuels and the increasing generation of solid waste, driven by population growth, industrialization, and economic development, have led to serious en-vironmental, energy, and public health issues. In light of this problem, it is crucial to adopt sustainable solutions that promote the transition to renewable energy sources, such as bi-ogas. Although progress has been made in optimizing biogas production, there is still no adaptable model for various environments that allows for the determination of optimal quantities of different organic wastes, simultaneously considering their composition, moisture content, control of critical factors for biogas production, as well as the biodigest-er's capacity and other relevant elements. In practice, the dosing of waste is done empiri-cally, leading to inefficiencies that limit the potential for biogas production in real scenari-os. The objective of this article is to propose a linear optimization model with nonlinear constraints that maximizes biogas production, taking into account fundamental parame-ters such as moisture percentage, pH, carbon-to-nitrogen ratio (C/N), substrate volume, or-ganic matter, volatile solids (VS), and the potential biogas production from different wastes. This model allows for the estimation of optimal quantities in kg of organic waste according to the capacity of the biodigester, aiming to achieve maximum biogas produc-tion. The results obtained for the proposed scenarios, complemented by a sensitivity anal-ysis using the Monte Carlo method, demonstrate that the model can be considered an effi-cient tool for optimizing biogas production and waste dosing in rural settings, with a con-fidence level of 95%. In addition to improving efficiency in biogas production, the model maximizes the utilization of organic waste, promoting clean and sustainable technologies. This model provides a distinctive value by offering a comprehensive methodology for bio-gas production, establishing a tool of great relevance for future research related to anaero-bic digestion processes.
Keywords:
biogas
; optimization
; volatile solids
; solid waste
; biodigester: moisture percentage
; pH
; C/N
; production potential
1. Introduction
Nowadays, garbage and poor solid waste management is one of the most important problems in the world, which have been increasing as a result of rapid population growth, rapid industrialization and economic development, causing the emergence of various social problems related to the environment, well-being and health mainly [1]. Solid waste includes a variety of materials, many of which are highly reusable, such as glass, paper, plastic, cardboard and metals. On the other hand, organic waste can be used for the production of compost, biofertilizers and biogas [2].
The bioeconomy is characterized by the sustainable and integrated conversion of renewable biological material into a range of bioproducts and bioenergy to replace fossil fuel-based production pathways. The transition to a bio-based economy is necessary due to resource scarcity, to address environmental challenges and changing market demands [3]. For this reason, the bioeconomy has become a very important strategy for various sectors since it offers sustainable alternatives, particularly in the energy industry, where electricity, heat and fuel can be produced through the use of raw materials of biological origin [4].
The production of Biogas from urban organic solid waste and agricultural organic solid waste is considered worldwide as an alternative of great interest, contributing to the diversification of the energy matrix as well as to the development of distributed generation derived from biomass as a renewable energy source, promoting the emergence and incorporation of technologies aimed at improving energy efficiency levels [5]. In the particular case of Colombia, since 2019 a great step has been taken towards the so-called “Energy Transition”, through which it seeks to diversify the electrical matrix with the incorporation of more non-conventional sources of renewable energy, where biogas is considered one of the most promising alternatives taking into account that Colombia is an agricultural country par excellence.
Energy is an indispensable part of modern society and is considered one of the most important indicators of socio-economic development. However, despite technological advances, there are around three billion people worldwide, located mainly in rural areas of developing countries, who lack electricity in their homes, and even continue to satisfy their energy needs for cooking through traditional means, by burning raw biomass (firewood, crop residues and animal manure), where this type of practice is considered a major source of environmental, social, economic and public health problems [6]. In order to achieve sustainable development in these regions, it is necessary to have access to clean and renewable energy sources that are available in their environment. Given this situation, it is proposed to make better use of biomass resources that may be present in rural environments (mainly animal feces, kitchen waste and green waste), through the generation of Biogas, known as Renewable Natural Gas (RNG), which is classified as a clean, efficient, renewable and reliable energy source, which can be used as a source of heat and electricity [7].
Biogas is obtained through an environmentally friendly process known as anaerobic digestion of waste, and is considered a renewable energy source, as both humans and animals will continue to generate waste on an ongoing basis. Organic waste has the potential to produce large amounts of methane during its decomposition. Methane is a highly potent greenhouse gas, capable of retaining heat in the atmosphere in greater proportion than carbon dioxide. To reduce greenhouse gas emissions and mitigate the risk of waterway pollution, organic waste can be harnessed for biogas production [8]. This biogas can be stored and used as a clean, renewable and reliable source of energy, especially in applications such as cooking, lighting and heating. Unlike other renewable energy sources, biogas is not dependent on weather conditions, making it a more reliable option, while at the same time reducing the release of methane into the atmosphere and decreasing dependence on fossil fuels [9].
Implementing biogas systems allows waste management processes to be converted into an income opportunity, as well as a profitable, renewable and sustainable source of electricity, heat or fuel, promoting a reduction in dependence on fossil fuels, greenhouse gas emissions, improving environmental quality and generating new local jobs derived from this type of practices. Biomass and biogas systems also provide the opportunity to recycle nutrients into the food supply, reducing the need for both petrochemical and extracted fertilizers [10].
Biogas production has been the subject of multiple studies exploring both process optimization and performance prediction, employing various methodologies and technological approaches. However, significant challenges remain in terms of the accuracy and adaptability of the models developed, as well as in the implementation of emerging technologies. Studies such as that of [11] have addressed the optimization of biogas production from kitchen waste, pointing out the importance of factors such as waste type and temperature in the efficiency of the process. However, their experimental approach showed limitations, as gas production did not reach the expected levels according to the design criteria, highlighting the need to improve optimization methods for variable environments.
Research that integrates prediction models based on artificial intelligence (AI), such as the work of [12], have demonstrated advances in model accuracy through the application of neural networks and optimization algorithms. Despite this, the inherent complexity of anaerobic digestion processes and differences in waste composition between regions limit the direct applicability of these models in certain contexts. This gap highlights the need to adapt models to local conditions and simplify their implementation.
More recent studies, such as that of [13], have proposed the integration of emerging technologies such as the Internet of Things (IoT) and machine learning to optimize biogas production in real time. These approaches allow for continuous monitoring and adjustment of key parameters, such as pH and temperature, improving process efficiency. However, large-scale implementation of these smart systems still faces challenges, especially in terms of infrastructure and costs. Other works have explored the use of advanced pretreatments in lignocellulosic biomass (LCB) to improve biogas production, such as the study of [14]. While these methods show great potential, operational and economic feasibility remains a challenge, underlining the need for further techno-economic and life cycle studies to assess the sustainability of these technologies.
Despite significant advances in biogas production modelling and optimization, gaps remain in adapting models to diverse contexts and integrating emerging technologies. Although several models have been proposed to optimize biogas production, there is still no widely accepted model that allows for accurately determining the optimal amounts of different types of organic waste based on their composition, such as proteins, carbohydrates, fats and moisture content. Most current models focus on specific factors or ideal conditions, without comprehensively integrating waste characteristics and digester capacity together. As a result, in practice, waste dosing is often carried out empirically, which can lead to inefficiencies and limit the potential for biogas production in real-world scenarios.
This article seeks to address these limitations by developing a Linear optimization model with non-linear constraints, which considers the particularities of the biomass used, with the objective of maximizing biogas production from different types of waste and the level of influence of factors such as: pH, % moisture, C/N ratio, % organic matter, % volatile solids (VS) and the biogas production potential for each type of waste, allowing to estimate the optimal quantities of each type of waste.in terms of weight (kg) to achieve the maximum amount of biogas, according to the volume of the biodigester and loading capacity.
2. Materials and Methods
2.1. What Is Biogas?
Biogas is an energy-rich gas produced by anaerobic decomposition or thermochemical conversion of biomass. Biogas is composed primarily of methane (CH4), the same compound as natural gas, and carbon dioxide (CO2). The methane content of raw (untreated) Biogas can vary between 40% and 60%, with the remaining percentage being made up of CO2, water vapor, and other gases. Biogas is traditionally combusted and used for heat and electricity generation in the same way as natural gas. In turn, Biogas can be treated (Renewable Natural Gas RNG or biomethane) and injected into natural gas pipelines or used as fuel for vehicles [15].
Anaerobic decomposition of biomass occurs when anaerobic bacteria (bacteria that live without the presence of free oxygen) carry out the process of decomposing biomass, generating Biogas as a result. Anaerobic bacteria are found naturally in various places such as: soil, swamps, lakes, in the digestive tract of humans and animals, among others. An important aspect is that Biogas can be produced under controlled conditions through the use of special tanks called “anaerobic digesters” or “Biodigesters”. The material resulting from the anaerobic digestion process is called digestate, which is rich in nutrients and can be used as fertilizer [6].
Biogas offers multiple benefits, not only energy-related, but also environmental and economic. It acts as a renewable and reliable source of energy, reducing the release of methane and dependence on fossil fuels [16]. The digestate, a by-product of the process, has value as a fertilizer, reducing the need for chemicals and improving agricultural efficiency. In addition, work is being done on certifying the digestate, which could generate new business opportunities [17].
The main sources of waste suitable for biogas production include food waste, landfills, animal waste, wastewater treatment and agricultural waste. Food waste, which makes up a large proportion of global waste, has significant energy potential, capable of supplying the needs of up to 1,400 households per year [18]. Landfills also emit large amounts of methane, and countries like the United States have taken advantage of this source to generate electricity and natural gas [19]. Furthermore, animal manure residues, common in rural areas, are not only a source of biogas, but their anaerobic digestion reduces harmful emissions and pathogens [20]. On the other hand, although wastewater treatment plants have digesters, their infrastructure to take advantage of the biogas generated is limited [21]. For the particular case of the proposed model, only food waste, animal manure residues and some agricultural waste will be considered, taking into account that these are the types of waste that are most commonly available in rural environments.
2.2. Important Factors in Biodigesters to Optimize Biogas Production
In a biodigester, it is very important not to completely fill the volume of the container with organic material, since it is necessary to reserve a space for the accumulation of biogas produced during the anaerobic digestion process. Generally, it is recommended to fill between 60% and 75% of the total capacity of the biodigester with substrate, while the remaining 25% to 40% should be used for storing the biogas generated [22]. This proportion ensures that the gas produced does not generate an overpressure that could compromise the structure of the biodigester or reduce the efficiency of the process. In most practical applications, the volume of the substrate is considered to be 70% of the total capacity of the biodigester [23].
In addition, it is recommended to incorporate an agitation system, either manual or mechanical, to improve the homogenization of the substrate inside the biodigester. Regular agitation facilitates the uniform distribution of nutrients and microorganisms, prevents the formation of crusts on the surface and improves the efficiency of anaerobic digestion by ensuring that all the substrate is in contact with the methanogenic bacteria [7]. This, in turn, contributes to more efficient biogas production and more complete decomposition of the waste. In turn, the retention time or hydraulic residence time (HRT) must be considered, which is another critical parameter in the operation of a biodigester, since it determines the period necessary for the organic material to completely decompose. Under optimal conditions, this time varies between 20 and 40 days, depending on the composition of the substrate and the operating temperature. This interval ensures stable biogas production and complete digestion of the biomass.
The volume and composition of biogas produced depends on multiple factors, including the type of substrate used (animal manure, food waste, agricultural waste, etc.) as well as operating conditions such as temperature, pH and retention time [24]. For example, substrates with a high proportion of carbohydrates and proteins tend to generate higher volumes of biogas, while those with a high content of lignin or cellulose can reduce the efficiency of the process by being more difficult to degrade by methanogenic bacteria [25]. Table 1 and Table 2 show the average densities of various types of animal, food and agricultural waste most common in rural environments, in order to allow a practical estimate of the volume that the substrate could occupy in the biodigester based on the weight of each type of waste that can be used for biogas production [21].
To maximize biogas production, it is advisable to mix manure of different species with other organic waste such as food scraps or agricultural waste, in order to adjust the C/N ratio of the total mixture and in turn, improve the stability of the digestion process [26]. The manure of some species with low C/N (such as chicken manure) can acidify the medium, so it is necessary to add waste that allows the pH to be controlled and kept in an optimal range to ensure efficient biogas production [18]. Some manures, such as bovine or horse manure, contain high levels of fiber, which can cause delays in the decomposition process, but at the same time, can be considered as an agent that helps to stabilize the process. However, the use of manures with a more liquid texture, such as pig manure, promotes rapid biogas production, but in turn, requires adjustments in the mixture to control excess moisture. Below are some of the most outstanding factors in the mixture of organic waste for biogas production [27]:
- % Moisture: It’s the pproportion of water present in the residue.Moisture affects the fluidity of the waste and its ability to mix properly in the digester. Ideally, it should be between 50-60% in the digester. Manures with high moisture content (such as pig manure) may require dry material to balance.
- %Total Solids (TS): It corresponds to the amount of residue that is not water (100% - % moisture).Higher values such as chicken manure suggest that they may require water or dilution to facilitate anaerobic digestion.
- C/N (Carbon/Nitrogen) ratio: The C/N ratio is critical to the activity of anaerobic bacteria. An ideal ratio is between 20:1 and 30:1.
- % SubjectOrganic (MO): It refers to the proportion of organic matter within the total solids.which can be decomposed by anaerobic bacteriaand which is essential for the production of biogas, A high organic matter content increases the efficiency of biogas production.
- % Volatile Solids (VS): Corresponds to the fraction oforganic matter that can be converted into biogas during anaerobic digestion.This is a determining factor in estimating the amount of biogas that can be generated by each type of waste. High VS values imply a greater potential for biogas production.
- Biogas Produced (BP): It is the amount of biogas expressed in that can be generated from organic solid waste, which is calculated as the product corresponding to the amount of VS in [kg] and the Biogas Production Potential (PP) specific for each type of waste in [/kg VS].
A comparison of the factors is presented in Table 3 and Table 4 most outstanding for the production of biogas in various types of organic waste. Information considered very usefuland which is directly related to the estimation of the coefficients of the optimization model proposed to maximize biogas production [18,22,28,29].
2.3. Critical Parameter Control
There are some suggested methods for adding some types of waste of a specific nature through which it is possible to achieve certain levels of control in parameters of great importance during the biogas production process such as the C/N ratio, pH, moisture, temperature and odor control specifically. Table 5 below describes these methods [30]:
2.4. Proposed Methodology for Estimating pH in a Mixture of Organic Waste
To estimate the approximate pH value of a waste mixture, a common technique can be used which consists of weighting the pH values of each waste by its buffering capacity and its proportion in the mixture [8]. Although this methodology does not offer absolute accuracy due to the inherent complexity of the acid-base behavior of waste, it can provide a useful estimate to predict the pH of the mixture under real conditions. It is important to note that the acid-base interaction between waste is not linear, as it depends on factors such as the concentration of hydrogen ions in solution, the presence of buffer substances, and possible chemical reactions that occur during anaerobic digestión [29]. Despite these limitations, this approach can be a practical tool in planning anaerobic digestion processes and biogas production.
Table 6 and Table 7 present the average pH values and buffering capacity for different types of animal, food and agricultural waste most common in rural environments, according to the proposed model as factors of great influence in the anaerobic digestion process and biogas production.
Animal waste, such as cattle, goat, sheep and horse manure, has a high buffering capacity, which helps maintain a relatively stable pH during the anaerobic digestion process. This stability is crucial to create optimal conditions for biogas production, as the process requires a pH close to neutrality (between 6.5 and 7.5). In contrast, food and agricultural waste, such as fruit peels, coffee grounds and stale bread, tend to be more acidic and have a low buffering capacity [31]. This can cause a decrease in the pH of the system, increasing the risk of acidification that inhibits the activity of methanogenic bacteria responsible for biogas production. For this reason, it is necessary to adjust the pH by adding materials with a higher buffering capacity, such as calcium carbonate or ash, to avoid imbalances that affect the efficiency of the process.
The proposed procedure to estimate the pH in the mixture is as follows:
- Assign a weighting factor to the damping capacity as follows:
| Damping capacity | Weighting factor (WF) |
| High | 3 |
| Average | 2 |
| Low | 1 |
- 2.
- Calculate the weighted pHfor each residue i using the following mathematical expression:
- Weighted pH of residue i
- pH of residue i
- Buffering capacity of the residue i
- Proportion in the mixture of residue i, with
- : Weight in kg of the residue i
- : Weight in kg of the total mixture
- 3.
- Calculate the average pH value of the mixture by taking the quotient between the sum of the weighted pHs obtained for each residue and the sum of the weights.
In order to understand the proposed methodology, the following example will be solved: It is desired to calculate the pH of a mixture composed of the following types of waste and its weight in kg.
Waste used:
- 20 kg of bovine manure
- 10 kg of pig manure
- 5 kg of fruit peels
- 8 kg of vegetable waste
- 5 kg of eggshells
- 2 kg of coffee grounds
The calculations corresponding to the factors , established in the proposed methodology for the estimation of the average pH of the waste mixture are summarized in Table 8.
The result obtained in the example using the weighted methodology for estimating the pH in the mixture was 6.77, which indicates an environment conducive to biogas production. This value is within the optimal pH range (6.5-7.5), which is essential to maximize the activity of methanogenic bacteria and, therefore, biogas production. If the estimated pH had fallen outside this range, it would be necessary to incorporate waste with a high buffering capacity, such as animal manure or calcium carbonate, to correct the excessive acidity or alkalinity. This adjustment would help stabilize the pH within the optimal range and ensure the efficiency of the anaerobic digestion process.
2.5. Biogas Production Calculation
Biogas production can be preliminarily calculated based on empirically established average values related to biomass composition and conversion efficiency of each type of waste using the Biogas Production Potential (/kg SV). Through which, it is possible to estimate the amount of biogas produced expressed in that can be produced for each kilogram of volatile solids (VS) of biomass [32].
Table 9 and Table 10 present a consolidated range of average values that have been established empirically by various studies for some types of animal, food and agricultural waste mainly. Additionally, some relevant aspects related to the characteristics of the waste and its impact on the biogas production process are included, such as the fiber, protein or carbohydrate content, whichThey may reflect dynamic behavior depending on the specific conditions of the biodigester and the efficiency of the process [13,33].
The general equation for estimating the Total Biogas Production is given by the following expression:
where,
- Biogas production potential of component i (m3/kg).
- Weight of volatile solids (VS) component i in the mixture, expressed in [kg]. can be calculated from the following expression:
- Total Solids Fraction of Waste i
- Organic matter fraction of the residue i
- Volatile Solids Fraction of the waste i
- : Weight in kg of the residue i
2.6. Average Percentages Recommended in the Mixture of Waste as an Empirical Measure for Biogas Production
Table 11 and Table 12 describe the recommended percentages that are used empirically to estimate adequate biogas production using different types of manure (alone or mixed with other types of animal feces), food and agricultural waste, their importance for biogas production, and how they influence parameters such as pH, moisture and odor control.
2.7. Proposed Optimization Model
This paper proposes the design of a Linear Programming model with Nonlinear Constraints as a strategy for solving the proposed problem. The objective of the model is to optimize , subject to a set of constraints that include both linear and nonlinear constraints, represented mathematically as follows:
Objective function:
where,
- It represents the maximum amount of biogas that is desired to be obtained, expressed in [m3].
- : Contribution in of biogas produced by the amount of of waste i, where
- : Corresponds to the coefficients related to the volatile solids (VS) component in the mixture and the biogas production potential for waste i. The value of the coefficients can be calculated from the following mathematical expression:
- They referthe weight in [kg] of each type of waste i required in the mixture to maximize biogas production in the proposed model. Additionally, are the decision variables that must be optimized in the proposed model.
- Number of residues in the mixture
The values corresponding to the coefficients are presented in Table 13 and Table 14 based on the proportions related to moisture, total solids, organic matter, volatile solids and biogas production potential, fordifferent types of animal, food and agricultural waste most common in rural environments, according to the proposed model.
Linear constraints: Linear constraints are expressed as inequalities of the form:
where is a matrix of coefficients of linear constraints and is a vector defining upper bounds for these constraints.
For the proposed model, it must be taken into account that the weights for the waste that can be used for biogas production comply with the following linear restrictions:
Additionally, the volume of the total substrate () must be less than or equal to 70% of the volume of the biodigester (). For the model, the volume occupied by each type of waste was calculated using the quotient between the weight () and the density () of each one. Thus, the following restriction was established:
In turn, in the case of having animal waste and in coherence with the experimental recommendations made by some studies, an additional restriction is established in the model where the total volume of animal waste allowed must be between 20% and 40% of the Volume of the substrate, with k=8 being the total number of types of animal waste related to the model.Thus establishing the following restriction:
Nonlinear constraints: Nonlinear constraints involve expressions modeled as nonlinear functions that must satisfy inequality () or equality () conditions, where represents the nonlinear function in the j-th constraint. The following nonlinear constraints were established for the proposed model:
Control restrictions based on the (C/N) ratio for waste mixing: For the proposed model, calculating the Carbon-Nitrogen (C/N) ratio in the total mixture is an essential factor to ensure that the biodigester operates efficiently and maximizes biogas production. To estimate the resulting (C/N) value in the mixture, the carbon (C) and nitrogen (N) contents of each biomass component (organic waste, animal waste, etc.) and their proportions in the mixture must be known. The mathematical expression that allows calculating the C/N ratio of the mixture is the following:
Considering that theideal C/N ratio for efficient anaerobic digestion should be between 20:1 and 30:1, then the following restrictions are defined:
Therefore, for the control of the (C/N) ratio the results are as follows:
Control restrictions based on the average pH of the mixture: Starting from the expression for the average pH we obtain that:
Considering that the ideal pH range for efficient anaerobic digestion it must be between 6.5 and 7.5, then the following restrictions are defined:
Therefore, the constraints for controlling the resulting average pH are as follows:
Control restrictions based on average moisture content of the mixture: Moisture in the biodigester is essential for the microorganisms that decompose organic matter to function properly. It is recommended that moisture be between 50% and 60% for optimal biogas production. The expression to calculate the percentage of moisture in a waste is as follows:
The procedure for calculating moisturein the mixture is very similar to that used to calculate the (C/N) ratio using weighted estimation, therefore:
Considering that the ideal range of moisture percentage for efficient anaerobic digestion should be between 50 and 60, then the following restrictions are defined:
Therefore, the restrictions for controlling the resulting average moisture percentage are as follows:
3. Results
3.1. Optimization Algorithm for Maximizing Biogas Production
An algorithm was developed in Python using the libraries numpy and scipy.optimize to implement an optimization model that maximizes biogas production in a biodigester. This model considers the availability of various types of waste and integrates a set of previously described restrictions, which reflect the most important physical-chemical properties that significantly affect biogas production, seeking to establish optimal conditions for anaerobic fermentation of the substrate.
The initial parameters of the model include the total capacity of the biodigester, which was set at 160 liters for the proposed scenarios. Of this volume, 70% is assumed to be the maximum limit for the substrate. The model also incorporates a binary availability vector, where a value of 1 indicates the presence of a specific waste and 0 its absence, in accordance with the general relationship of the proposed design. This vector allows the filtering of the physical-chemical characteristics considered in the calculations, such as pH, C/N ratio, moisture percentage and biogas production coefficients, among others, providing flexibility to the model and facilitating its adaptation to any combination of waste in specific contexts. This structure optimizes the biogas maximization process by adapting to different waste configurations. Table 15 presents the average values of the physical-chemical properties integrated in the proposed model for the most common types of waste in rural environments.
The objective function of the proposed model is defined as the sum of the contributions of each waste to biogas production, using average coefficients specific for each type of waste. To maximize the total biogas production, the objective function is formulated with a negative sign, since the minimize function of scipy.optimize is used to solve the model. In addition, multiple linear and non-linear constraints were implemented with the aim of controlling physical-chemical factors within the optimal limits recommended to maximize biogas production based on the amount of waste. These constraints include:
- pH restrictions: The average pH of the substrate should be between 6.5 and 7.5, the ideal range for microbiological activity.
- C/N ratio: Establish a carbon/nitrogen ratio between 20 and 30, in order to maximize biogas production and minimize the formation of inhibitory compounds.
- Moisture: Control the moisture percentage so that it remains within the optimal range between 50% and 60%.
- Substrate Volume Restriction: Limit the volume of the substrate to 70% of the total capacity of the biodigester, ensuring sufficient space for the biogas generated.
As a result of the analysis carried out and articulating the various factors mentioned above that significantly influence biogas production, the algorithm developed for the proposed model is the following:
Optimization Algorithm for Maximizing Biogas Production |
Input:
|
|
3.2. Proposed Scenarios
This section presents two proposed scenarios in order to evaluate the effectiveness of the optimization model to maximize biogas production that was developed in Python. Each scenario simulates a configuration of available organic waste using a binary availability vector, where a value of “1” indicates the presence of the waste in the biodigester and a value of “0” its absence. The model takes into account the capacity of the biodigester, the specific coefficients of each waste for biogas production, and the optimized physical-chemical constraints for each mixture. The specific configuration for each of the scenarios is presented below, accompanied by the results obtained in the model, evaluating the values obtained by the objective function and the physical-chemical parameters related to the resulting substrate for the anaerobic fermentation process.
Scenario 1:
|
Binary availability vector (1 if the residue is available, 0 if not) |
Optimization result obtained |
| availability = { ‘Bovine’: 0, ‘Pig’: 1, ‘Hen/Chicken’: 0, ‘Horse’: 0, ‘Sheep’: 0, ‘Rabbit’: 0, ‘Goat’: 0, ‘Duck/Goose’: 0, ‘Fruit remains (peels)’: 1, ‘Vegetable waste’: 1, ‘Cereal crop residues (straw)’: 0, ‘Potato peels’: 1, ‘Eggshells’: 1, ‘Coffee residue’: 0, ‘Corn residues (leaves, stalks)’: 0, ‘Stale bread/bread scraps’: 0, ‘Nut and seed shells’: 0, ‘Leftover cooked rice’: 1, ‘Cooked vegetable leftovers’: 1, ‘Vegetable oils and fats’: 0, ‘Pasta’: 0, ‘Leaves and plant remains’: 1 } |
Bovine: 0.00 kg Pork: 14.56 kg Chicken: 0.00 kg Horse: 0.00 kg Sheep: 0.00 kg Rabbit: 0.00 kg Goat: 0.00 kg Duck/Goose: 0.00 kg Fruit remains (peels): 26.66 kg Vegetable waste: 0.00 kg Cereal crop residues (straw): 0.00 kg Potato peels: 0.00 kg Eggshells: 20.67 kg Coffee grounds: 0.00 kg Corn residues (leaves, stalks): 0.00 kg Stale bread/bread scraps: 0.00 kg Nut and seed shells: 0.00 kg Leftover cooked rice: 3.58 kg Cooked vegetable scraps: 0.00 kg Vegetable oils and fats: 0.00 kg Pasta: 0.00 kg Leaves and plant remains: 0.00 kg Average pH: 6.63 C/N ratio avg: 20.00 Average moisture: 60.00 Maximum Substrate Volume in [L]: 112.0 Estimated Substrate Volume in [L]: 112.00 Value of the objective function in [L]: 2219.98 Value of the objective function in [m3]: 2.22 |
In the first scenario, a condition of limited waste availability was considered, mainly fruit scraps, cooked vegetables, cooked rice, egg and potato peels, as well as pig manure. These wastes were selected due to their relative accessibility in rural environments and their average biogas production characteristics. As a result of the optimization process in the first scenario, a notable load recommendation was obtained for pig waste (14.56 kg), egg shells (20.67 kg), and fruit scraps (26.66 kg), prioritizing those that, due to their characteristics, maximize methane generation and facilitate a homogeneous substrate composition.
The results related to the control parameters obtained in this scenario showed a pH of 6.63, a C/N ratio of 20.00 and a moisture level of 60.00%, values that are within the optimal ranges for microbiological activity in anaerobic digestion and minimize the formation of inhibitors, which favors a continuous methane production process. In turn, the optimization model predicts an estimated biogas volume of 2219.98 liters (2.22 m3), reflecting a moderate production efficiency compared to the total substrate volume. This result suggests that, although the selected wastes are suitable, the absence of certain wastes with high biogas production, such as bovine waste or uncooked vegetables, limit the maximum performance. However, the scenario provides a viable context for biodigesters in areas where waste availability is variable or limited.
Scenario 2:
|
Binary availability vector (1 if the residue is available, 0 if not) |
Optimization result obtained |
| availability = { ‘Bovine’: 1, ‘Pig’: 0, ‘Hen/Chicken’: 0, ‘Horse’: 0, ‘Sheep’: 0, ‘Rabbit’: 0, ‘Goat’: 0, ‘Duck/Goose’: 0, ‘Fruit remains (peels)’: 1, ‘Vegetable waste’: 1, ‘Cereal crop residues (straw)’: 1, ‘Potato peels’: 1, ‘Eggshells’: 0, ‘Coffee waste’: 1, ‘Corn residues (leaves, stalks)’: 0, ‘Stale bread/bread scraps’: 0, ‘Nut and seed shells’: 0, ‘Leftover cooked rice’: 1, ‘Cooked vegetable leftovers’: 1, ‘Vegetable oils and fats’: 0, ‘Pasta’: 1, ‘Leaves and plant remains’: 0 } |
Bovine: 15.68 kg Pork: 0.00 kg Chicken: 0.00 kg Horse: 0.00 kg Sheep: 0.00 kg Rabbit: 0.00 kg Goat: 0.00 kg Duck/Goose: 0.00 kg Fruit remains (peels): 1.00 kg Vegetable waste: 0.00 kg Cereal crop residues (straw): 1.95 kg Potato peels: 0.00 kg Eggshells: 0.00 kg Coffee grounds: 0.00 kg Corn residues (leaves, stalks): 0.00 kg Stale bread/bread scraps: 0.00 kg Nut and seed shells: 0.00 kg Leftover cooked rice: 33.60 kg Cooked vegetable scraps: 0.00 kg Vegetable oils and fats: 0.00 kg Pasta: 21.81 kg Leaves and plant remains: 0.00 kg Average pH: 6.50 C/N ratio avg: 20.00 Average moisture: 60.00 Maximum Substrate Volume: 112.0 Estimated Substrate Volume: 112.00 Value of the objective function in [L]: 8719.19 Value of the objective function in [m3]: 8.72 |
The second scenario introduces a greater diversity of wastes, including cattle waste, cereal crops, fruit waste, potato peels, coffee grounds, and other cooked foods such as pasta and rice. This combination responds to the hypothesis that a greater diversity of substrates can increase biogas production, taking advantage of the different methane generation coefficients of each waste, while seeking to maintain the control parameters within the appropriate intervals.
The results of the optimization process in this scenario suggest a priority allocation to waste with high biogas production potential, such as bovine waste (15.68 kg) and pasta (21.81 kg), in addition to significant quantities of cooked rice (33.6 kg). These wastes were selected not only for their biogas production coefficients, but also because, when combined, they meet the optimal physical-chemical limits. The model managed to establish a combination of wastes that allows estimating in the substrate a pH of 6.50, a C/N ratio of 20.00 and a moisture of 60.00%, values that are ideal for maximizing methanogenesis by providing an environment conducive to microbiological activity, while limiting inhibition caused by acidic or ammoniacal compounds. This balance ensures a stable anaerobic environment, necessary to maximize methane production and reduce the risks of inhibition in the digestive process.
Additionally, the model predicts a biogas production of 8.72 m3 for the resulting substrate, highlighting a significant improvement in efficiency compared to the first scenario. This increase in biogas volume not only demonstrates the importance of diversifying the waste in the mix, but also highlights the model’s ability to select waste that is able to maximize production within the physical limits of the biodigester. The optimization performed in this scenario reflects how the availability of waste with a high methanogenic capacity increases the efficiency of the biodigester, making this combination a viable and efficient alternative in environments with greater access to a variety of organic waste.
3.3. Sensitivity Analysis
To perform the sensitivity analysis of the proposed scenarios, the Monte Carlo method was used, through which it was possible to evaluate how the volume of biogas production responds to fluctuations in the properties of the organic waste used. To carry out the process, the quantities obtained in terms of the weight in kg of each type of waste that form part of the optimal substrate for biogas production proposed by the model were considered. From this point, 1000 simulations were carried out for each proposed scenario, randomly establishing different values within the intervals established as minimum and maximum for each of the parameters such as: pH, C/N ratio, percentage of moisture, biogas potential coefficients and waste densities. This statistical methodology allowed not only to identify the most probable values of biogas production, but also to evaluate the sensitivity of the process to each parameter, providing a comprehensive view of the variability and robustness of the system. The results obtained include detailed metrics of dispersion and central tendency, such as confidence intervals and quartiles, which support the interpretation of the potential effects of each variable on the expected biogas production. Figure 1, Figure 2, Figure 3 and Figure 4 present the histogram, most probable value and box plots, accompanied by Table 16 and Table 17 that describe the statistical results of each of the parameters evaluated for scenarios 1 and 2.
In it scenario 1, the sensitivity analysis applied to biogas production allowed to evaluate the effects of variability in the input parameters (pH, % moisture, C/N ratio and substrate volume) on the volume of biogas produced in liters, using the Monte Carlo method. The results show that the biogas volume has a most probable value of 2354.17 L, with a mean of 2241.83 L and a close median of 2240.92 L, indicating a symmetrical distribution of the variable. The standard deviation of 407.20 L reflects a significant variability, and the interquartile range (IQR) of 657.07 L confirms the dispersion of the data within the 95% confidence interval (2216.59 to 2267.07 L). This suggests that, in the evaluated scenario, biogas production is sensitive to variations in the input factors, with a relatively consistent central prediction around the mean values and a high dispersion in the extreme values.
The factors corresponding to pH, moisture and C/N ratio describe a low variability, reflecting stability and efficient control in the system. pH presents a most probable value of 6.57, with a close mean and median (6.63 and 6.62 respectively), with a standard deviation of 0.19, which shows that despite the fluctuations of the system, the pH tends to remain within a very narrow range. This behavior is also reflected in the 95% confidence interval (6.62 to 6.64), suggesting that pH variations have little influence on biogas performance in this context. Moisture describes a most probable value of 60.35% and a mean of 60.02%, reflecting a similar stability to pH, with an IQR of 2.04 and a confidence interval that is centered around stable values. On the other hand, the C/N ratio shows an equally stable and little dispersed behavior, with a most probable value of 19.84, and with close mean and median (19.98 and 19.95). Its IQR of 1.06 and low standard deviation of 0.72 reinforce the low sensitivity of this parameter to variability in process conditions, which is beneficial for uniformity in biogas production. Establishing a stable environment in relation to pH, moisture and C/N ratio is very favorable during the digestion process, since it avoids sudden variations that could negatively affect the efficiency of the anaerobic process.
However, the volume of the substrate shows a greater dispersion due to the variability that may be present in the density levels of each type of waste that is part of the substrate, reflecting a most probable value of 107.32 L and a mean of 112.78 L, thus reflecting its dynamic nature in the process. In turn, this parameter presents an IQR of 11.15 and a confidence interval of 112.36 to 113.19 L, which suggests that, although the volume of substrate has a greater dispersion, it continues to remain in a relatively stable range and in coherence with the restrictions established in the proposed model, in order not to exceed 70% of the volume of the biodigester.
In scenario 2, the results describe specific variability patterns in each factor analyzed for biogas production, similar to those observed in scenario 1, although with certain differences in the concentration and dispersion of values. For biogas volume, the most likely value is 8636.70 L, while the mean and median are 8741.37 and 8732.47 L, respectively. The greatest dispersion in this scenario is observed with a standard deviation of 1019.35 L and an IQR of 1476.65 L, indicating a relatively wide production range. However, the 95% confidence interval (8678.11 to 8804.62 L) suggests that most values are concentrated in a range higher than that of the first scenario, possibly due to the restrictions established in the proposed model in order to maintain control over the input factors.
For the factors pH, moisture, C/N ratio, and substrate volume, variability is low and behavior is stable, ensuring a favorable environment for anaerobic digestion. pH remains in an optimal zone, with a most probable value of 6.46, mean of 6.49, and median of 6.48, along with an IQR of 0.21 and a narrow confidence interval (6.48 to 6.50), indicating stability in the process. Moisture also reflects slight variability, with a most probable value of 60.24%, a mean of 60.01%, and an IQR of 2.33%, suggesting a controlled impact on production. Similarly, the C/N ratio presents a most probable value of 20.04 and an IQR of 1.32, confirming that this factor has a stable influence on the process. Finally, the substrate volume is the most constant factor, with a most probable value of 112.26 L, mean of 112.20 L, and a tight confidence interval (112.06 to 112.35 L), which allows for greater precision in controlling the substrate used. The stability observed in this scenario reaffirms the effectiveness of the model in managing operational factors, favouring controlled and predictable biogas production.
4. Discussion
The results obtained in this study illustrate the complex interaction between different types of organic waste during biogas production. Model optimization showed that waste with higher production coefficients, such as fruit waste and vegetable waste, play a key role in maximizing biogas yield. Furthermore, sensitivity analysis using the Monte Carlo method showed that small variations in substrate composition can have a considerable impact on biogas production, thus highlighting the importance of careful waste selection. The average pH of the optimized substrate remained within the ideal range (6.5-7.5), suggesting that the combination of selected wastes favors an optimal environment for microbial activity. This finding aligns with previous research highlighting the relevance of an adequate balance in the C/N ratio for biogas production efficiency [34].
The second scenario highlights the importance of considering a greater diversity of wastes, as the combination of different types of substrates allowed to achieve a significantly higher biogas production, thus optimizing the efficiency of the biodigester. This finding suggests that, in future applications, the inclusion of a diverse set of wastes may be a key strategy to maximize the energy yield of biodigesters, benefiting both rural communities and industrial facilities. In this regard, the analysis of the effect of the C/N ratio revealed that an adequate proportion favors fermentation and methane production. The results of the sensitivity analysis underline that small variations in the waste ratio can drastically affect biogas production, corroborating previous findings indicating that an inadequate C/N balance can limit microbial activity and, therefore, the efficiency of the anaerobic digestion process [35].
The comparative analysis of the two proposed scenarios reveals significant differences in biogas production, highlighting the impact of input conditions and the sensitivity of the system to certain parameters. In scenario 2, biogas production is significantly higher, both in terms of probable and average value, generating a waste mix with better conditions for microbiological activity under optimized conditions. However, this production advantage also promotes greater variability, suggesting that the system is more susceptible to fluctuations in input parameters related to substrate composition and its nutrients. From a real-world perspective, the model predicts an increase in biogas production capacity, with the possibility of requiring constant monitoring of the digestion process as well as greater control over the inputs used, in order to maintain stability in the system.
Control parameters such as pH, moisture and C/N ratio exhibit relative stability in both scenarios, with minimal variations that highlight their role as controllable variables within the anaerobic digestion process. The low dispersion observed in these factors indicates that the system manages to maintain an adequate environment for the activity of methanogenic bacteria, even when there are changes in other parameters, such as substrate volume or moisture. This regulation capacity is an advantage of great importance for the design and scalability of the biodigester, since it ensures that microbiological activity remains within an optimal range, thus protecting biogas yield, even when other factors experience higher levels of fluctuation [36]. Furthermore, since microbiological activity is sensitive to the balance between moisture and substrate composition, the observed values of the control parameters suggest robust efficiency in anaerobic digestion. This, in turn, could indicate the need to slightly adjust the water content in scenarios that seek to maximize production under more variable conditions, which is key to optimizing biogas yield.
The approach proposed in this study is distinguished by its integrative capacity, by evaluating the combined effect of multiple interdependent variables on biogas production. Unlike models such as those proposed by [11,34,37], whose predictive capacity is limited by not considering the interaction between factors, the proposed model allows for more complete and realistic simulation and analysis processes related to the performance of the biodigester under various operating conditions. The implementation of sensitivity analysis using Monte Carlo reinforces its robustness, allowing for the evaluation of the behavior of critical parameters such as pH, C/N ratio, moisture and production potential coefficients, which have a significant impact on biogas production, thereby allowing for the establishment of a fundamental approach to the analysis of anaerobic digestion, especially given the inherent variability of organic waste in real environments [38].
The implications of this model for the design and operation of biodigesters in rural settings are significant, especially in contexts where the availability and variability of organic waste are critical factors. The model allows farmers and waste managers to select optimal substrate combinations, maximizing biogas production and promoting energy sustainability. This ability to adjust substrate composition offers significant advantages, promoting improvements in biodigester efficiency that could reduce dependence on fossil fuels and contribute to the reduction of greenhouse gas emissions, aligning with the findings of [5].
In addition to its direct application in biodigester optimization, the model is presented as a useful tool for planning waste management policies in rural areas, supporting the implementation of biodigesters in communities where it was previously considered unfeasible. This increases the energy resilience of communities, contributing to environmental sustainability and the fulfillment of global emissions reduction targets. The resulting optimization of biogas production also offers versatile energy performance, applicable in various activities, such as electricity generation and water heating, with a direct impact on the energy sustainability of these communities.
Finally, the proposed model can be considered as a tool of greater interest within applied research processes compared to other existing models, taking into account adaptation methods for a wide range of waste types that may be present in rural or urban environments with high waste diversity, allowing optimization processes and the ability to adjust operating conditions through the systematic evaluation of variables, providing a valuable contribution to improving efficiency in biogas production.
5. Conclusions
The proposed model represents a significant advance in the optimization of biogas production from organic waste, in accordance with the results obtained during the analysis processes carried out in the different scenarios. The results highlight not only the superiority in biogas production of scenario 2, but also the need for careful management of operating conditions, particularly with regard to the variability of input parameters. The integration of multiple variables and their evaluation through a sensitivity analysis based on the Monte Carlo method provide a deeper understanding of the dynamics of the anaerobic digestion system. Additionally, the variability observed in biogas production highlights the importance of properly selecting the weight of each of the wastes that will form part of the resulting substrate, as well as maintaining rigorous control over factors such as pH, moisture and C/N ratio, which showed stability in each of the scenarios despite the fluctuations that could be present in each of the control parameters. These results are in line with existing literature that points out how an adequate balance between waste composition can optimize process efficiency. Furthermore, it is suggested that the implementation of a real-time monitoring system could complement the proposed model from an experimental context, allowing the possibility of making dynamic adjustments in the operating conditions of the biodigesters during the anaerobic digestion process, thereby allowing not only to improve the efficiency and performance of biogas production, but also contributing to sustainability in waste management and renewable energy generation. Finally, the model can be considered not only as a practical tool to maximize biogas production, but also establishes a solid framework for future research in the field of anaerobic digestion, focusing on improving sustainability and efficiency in energy production from organic waste.
Author Contributions
J.C.V.F.: Conceptualization, methodology, software, validation, formal analysis, investigation, data curation, supervision, project administration and funding acquisition; A.F.M.: validation, investigation, data curation, and supervision; J.E.B.: resources, visualization, supervision, project administration, and funding acquisition. All authors have read and agreed to the published version of the manuscript.
Funding
The authors appreciate the financial support provided by UNAD (PGINN0801ECBTI2024) during the development of this study.
Institutional Review Board Statement
Not applicable.
Informed Consent Statement
Not applicable.
Data Availability Statement
The raw data supporting the conclusions of this article will be made available by the authors on request.
Conflicts of Interest
The authors declare no conflicts of interest.
References
- Kokoulin AN, Uzhakov AA, Tur AI. The Automated Sorting Methods Modernization of Municipal Solid Waste Processing System. In: Proceedings - 2020 International Russian Automation Conference, RusAutoCon 2020. Institute of Electrical and Electronics Engineers Inc.; 2020:1074-1078. [CrossRef]
- Ravi S, Jawahar T. Smart city solid waste management leveraging semantic based collaboration. In: ICCIDS 2017 - International Conference on Computational Intelligence in Data Science, Proceedings. Vol 2018-January. Institute of Electrical and Electronics Engineers Inc.; 2018:1-4. [CrossRef]
- Hodson de Jaramillo E. Bioeconomía: el futuro sostenible. Rev la Acad Colomb Ciencias Exactas, Físicas y Nat. 2018;42(164):188. [CrossRef]
- Lewandowski I, Bahrs E, Dahmen N, Hirth T, Rausch T, Weidtmann A. Biobased value chains for a growing bioeconomy. GCB Bioenergy. 2019;11(1):4-8. [CrossRef]
- Bahrs E, Angenendt E. Status quo and perspectives of biogas production for energy and material utilization. GCB Bioenergy. 2019;11(1):9-20. [CrossRef]
- Joshi A, Jose J, Bansiwal N, Soni N. Study on Electricity Generation through biogas on small scale. 2017. [CrossRef]
- Giubi J, Bernal ;, Manuel, Cañete ;, Felicia. Biogas production from organic waste generated at the Hospital of Clinics: A preliminary study. An la Fac Ciencias Médicas. 2020;52(3):53-58. [CrossRef]
- Sen GP, Saxena BK, Mishra S. Feasibility Analysis of Community Level Biogas Based Power Plant in a Village of Rajasthan. In: Proceedings - 2020 International Conference on Advances in Computing, Communication and Materials, ICACCM 2020. Institute of Electrical and Electronics Engineers Inc.; 2020:385-389. [CrossRef]
- Vesga Ferreira JC, Sepulveda FAA, Perez Waltero HE. Smart Ecological Points, a Strategy to Face the New Challenges in Solid Waste Management in Colombia. Sustain 2024, Vol 16, Page 5300. 2024;16(13):5300. [CrossRef]
- Pérez Pérez N. Aprovechamiento de la cascarilla de café para generar energía eléctrica en la planta procesadora Representaciones Mego SRL en Jaén. Repos Inst - UCV. 2019. https://hdl.handle.net/20.500.12692/39688. Accessed May 5, 2021.
- Tenzin T, Wangdi S, Dorji G, et al. Optimization of biogas production from kitchen waste installed at college of science and technology. 2018 Int Conf Comput Power Commun Technol GUCON 2018. March 2019:956-960. [CrossRef]
- Li X, Wang Y. Prediction model of biogas production for anaerobic digestion process of food waste based on LM-BP neural network and particle swarm algorithm optimization. Proc - 2017 Chinese Autom Congr CAC 2017. 2017;2017-January:7629-7633. [CrossRef]
- Menaka D, Nandhakumar S, Abishek R, Raghavendran MR, Vishnu Hariharan AS. Smart Optimization of Biogas Production for Enhanced Gas Yield. 2023 Int Conf Data Sci Agents Artif Intell ICDSAAI 2023. 2023. [CrossRef]
- Wei H, Wang Z, Li H. Sustainable biomass hydrodeoxygenation in biphasic systems. Green Chem. 2022;24(5):1930-1950. [CrossRef]
- Dalpaz R, Konrad O, Cândido da Silva Cyrne C, Panis Barzotto H, Hasan C, Guerini Filho M. Using biogas for energy cogeneration: An analysis of electric and thermal energy generation from agro-industrial waste. Sustain Energy Technol Assessments. 2020;40:100774. [CrossRef]
- Fígoli I, Perna V, Horta G, Perco L, Reyes A, Sierra W. The role of biomass in Uruguay’s energy transformation. In: 2018 IEEE 9th Power, Instrumentation and Measurement Meeting, EPIM 2018. Institute of Electrical and Electronics Engineers Inc.; 2018:1-6. [CrossRef]
- Thoben K-D, Wiesner S, Wuest T. “Industrie 4.0” and Smart Manufacturing – A Review of Research Issues and Application Examples. Int J Autom Technol. 2017;11(1):4-16.
- Muthu D, Venkatasubramanian C, Ramakrishnan K, Sasidhar J. Production of Biogas from wastes Blended with CowDung for Electricity generation-A Case study. In: IOP Conference Series: Earth and Environmental Science. Vol 80. Institute of Physics Publishing; 2017:12055. [CrossRef]
- Siddappaji, Sujatha K, Radha RC. Technologies for segregation and management of solid waste: A review. In: 1st International Conference on Emerging Trends in Engineering, Technology and Science, ICETETS 2016 - Proceedings. Institute of Electrical and Electronics Engineers Inc.; 2016. [CrossRef]
- Blumberga D, Ozarska A, Indzere Z, Chen B, Lauka D. Energy, Bioeconomy, Climate Changes and Environment Nexus. 2019;23(3):370-392. [CrossRef]
- Sudha S, Vidhyalakshmi M, Pavithra K, Sangeetha K, Swaathi V. An automatic classification method for environment: Friendly waste segregation using deep learning. In: Proceedings - 2016 IEEE International Conference on Technological Innovations in ICT for Agriculture and Rural Development, TIAR 2016. Institute of Electrical and Electronics Engineers Inc.; 2016:65-70. [CrossRef]
- Wang J, Ma D, Lou Y, Ma J, Xing D. Optimization of biogas production from straw wastes by different pretreatments: Progress, challenges, and prospects. Sci Total Environ. 2023;905:166992. [CrossRef]
- Kabaivanova L, Hubenov V, Dimitrov N, Petrova P. Anaerobic Two-Phase Co-Digestion for Renewable Energy Production: Estimating the Effect of Substrate Pretreatment, Hydraulic Retention Time and Participating Microbial Consortia. Appl Sci 2024, Vol 14, Page 5311. 2024;14(12):5311. [CrossRef]
- Muha I, Linke B, Wittum G. A dynamic model for calculating methane emissions from digestate based on co-digestion of animal manure and biogas crops in full scale German biogas plants. Bioresour Technol. 2015;178:350-358. [CrossRef]
- Nahar G, Koley A, Garai S, Balachandran S, Ross AB. Enhancing Biogas Production Through the Co-Digestion of Fish Waste (FW) and Water Hyacinth (WH) Using Cow Dung as an Inoculum: Effect of FW/WH Ratio. Appl Sci 2024, Vol 14, Page 9880. 2024;14(21):9880. [CrossRef]
- Dadic B, Ivankovic T, Spelic K, Hrenovic J, Jurisic V. Natural Materials as Carriers of Microbial Consortium for Bioaugmentation of Anaerobic Digesters. Appl Sci 2024, Vol 14, Page 6883. 2024;14(16):6883. [CrossRef]
- Srivastava SK. Advancement in biogas production from the solid waste by optimizing the anaerobic digestion. Waste Dispos Sustain Energy. 2020;2(2):85-103. [CrossRef]
- Surendra KC, Ogoshi R, Reinhardt-Hanisch A, et al. Anaerobic digestion of high-yielding tropical energy crops for biomethane production: Effects of crop types, locations and plant parts. Bioresour Technol. 2018;262:194-202. [CrossRef]
- Peng S, Guo L, Li Y, Huang H, Peng J, Liu X. Biogas Production Prediction Based on Feature Selection and Ensemble Learning. Appl Sci 2024, Vol 14, Page 901. 2024;14(2):901. [CrossRef]
- Pardo LAÁ. Experiencias En La Generación de Energía a Partir de Biogás. Vol 35.; 2014. https://publicaciones.fedepalma.org/index.php/palmas/article/view/11041. Accessed May 4, 2021.
- Mandal S, Yasmin H, Sarker MRI, Beg MRA. Prospect of solar-PV/biogas/diesel generator hybrid energy system of an off-grid area in Bangladesh. In: AIP Conference Proceedings. Vol 1919. American Institute of Physics Inc.; 2017:20020. [CrossRef]
- Oguntoke O, Amaefuna BA, Nwosisi MC, Oyedepo SA, Oyatogun MO. Quantification of biodegradable household solid waste for biogas production and the challenges of waste sorting in Abeokuta Metropolis, Nigeria. Int J Energy Water Resour. 2019;3(3):253-261. [CrossRef]
- Mota-Panizio R, Hermoso-Orzáez MJ, Carmo-Calado L, Lourinho G, De Brito PSD. Biochemical Methane Potential of Cork Boiling Wastewater at Different Inoculum to Substrate Ratios. Appl Sci 2021, Vol 11, Page 3064. 2021;11(7):3064. [CrossRef]
- Appala VNSG, Pandhare NN, Bajpai S. Mathematical Models for Optimization of Anaerobic Digestion and Biogas Production. Energy, Environ Sustain. 2022:575-591. [CrossRef]
- Haddon A. Mathematical Modeling and Optimization for Biogas Production. November 2019. https://theses.hal.science/tel-02478779. Accessed October 8, 2024.
- Diniz P, da Costa L, da Silveira J, Barroso G, Barcellos W. Performance evaluation of controllers applied to power generator set operating with wastewater biogas. Electr Eng. 2021;103(1):753-768. [CrossRef]
- Saghouri M, Abdi R, Ebrahimi-Nik M, Rohani A, Maysami M. Modeling and optimization of biomethane production from solid-state anaerobic co-digestion of organic fraction municipal solid waste and other co-substrates. Energy Sources, Part A Recover Util Environ Eff. December 2024. [CrossRef]
- Mutaqin MI, Widyarani, Hamidah U, Janetasari SA, Muchlis, Sintawardarni N. Biogas Consumption Pattern in Indonesia: (A Case Study of Sumedang Community Biogas Plant, Indonesia). In: Proceeding - 2019 International Conference on Sustainable Energy Engineering and Application: Innovative Technology Toward Energy Resilience, ICSEEA 2019. Institute of Electrical and Electronics Engineers Inc.; 2019:113-118. [CrossRef]
Figure 1.
Histogram and most likely value of biogas production for scenario 1.
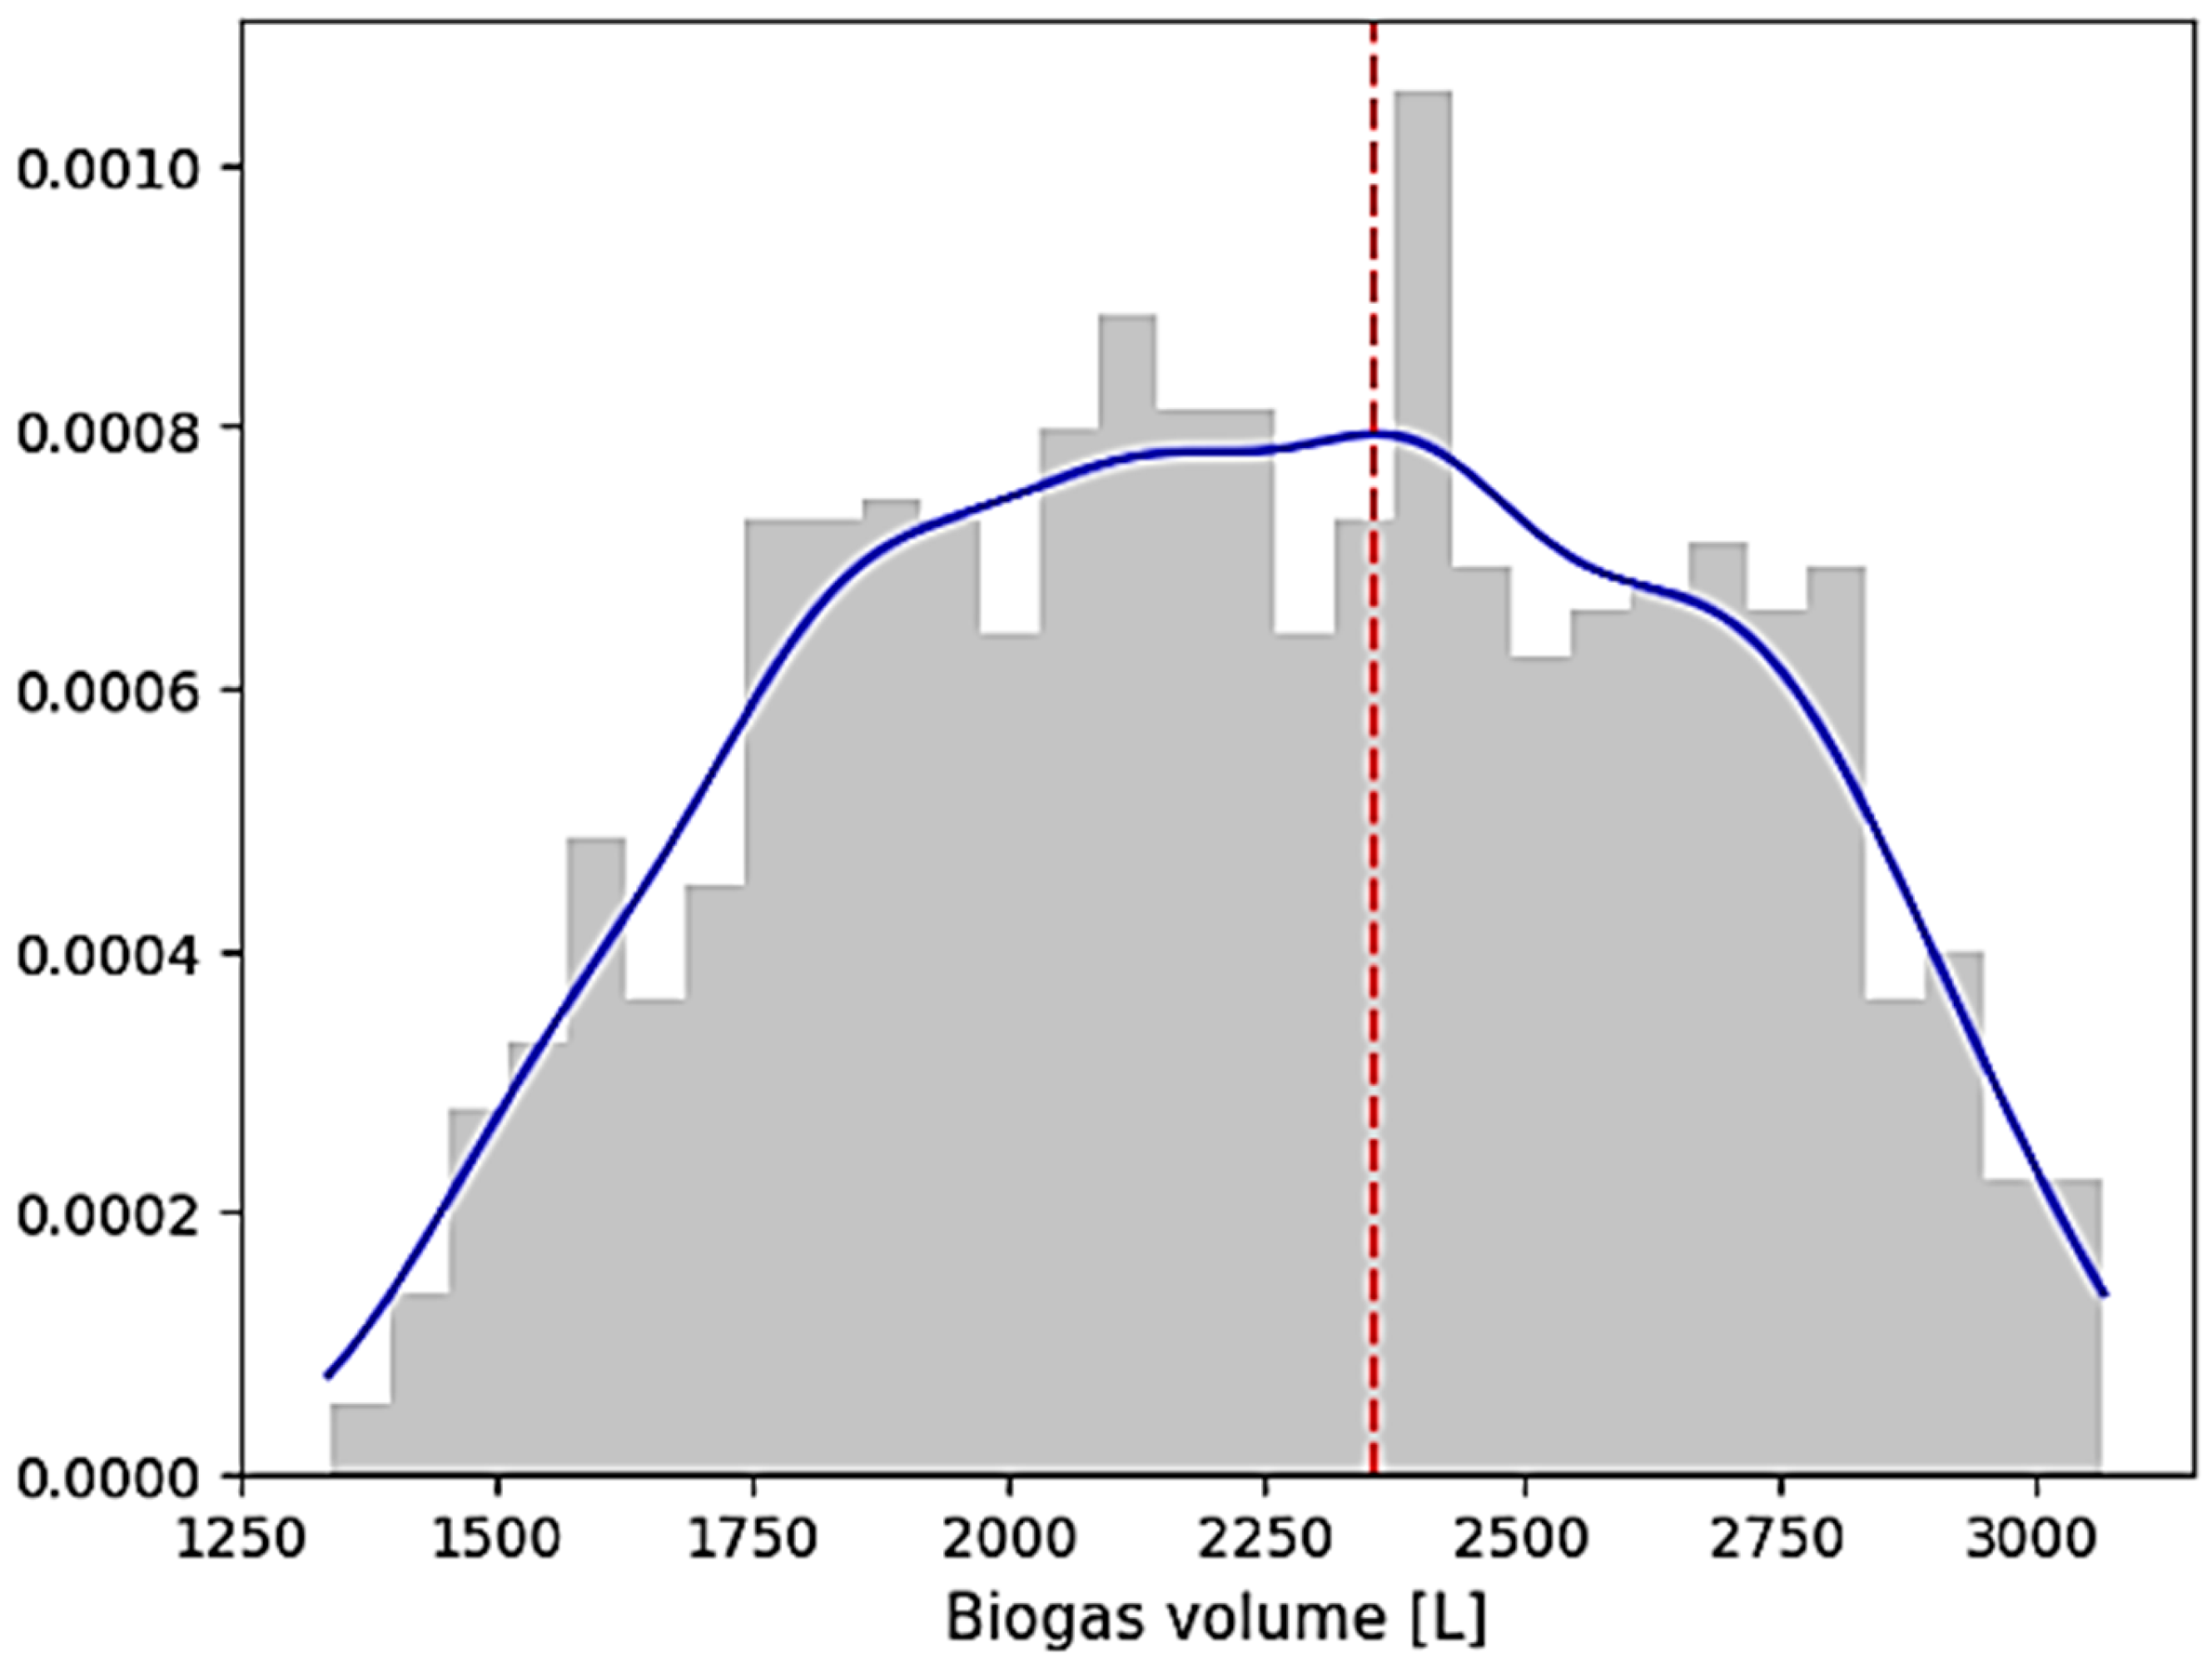
Figure 2.
Box plot for the volume of biogas produced for scenario 1.
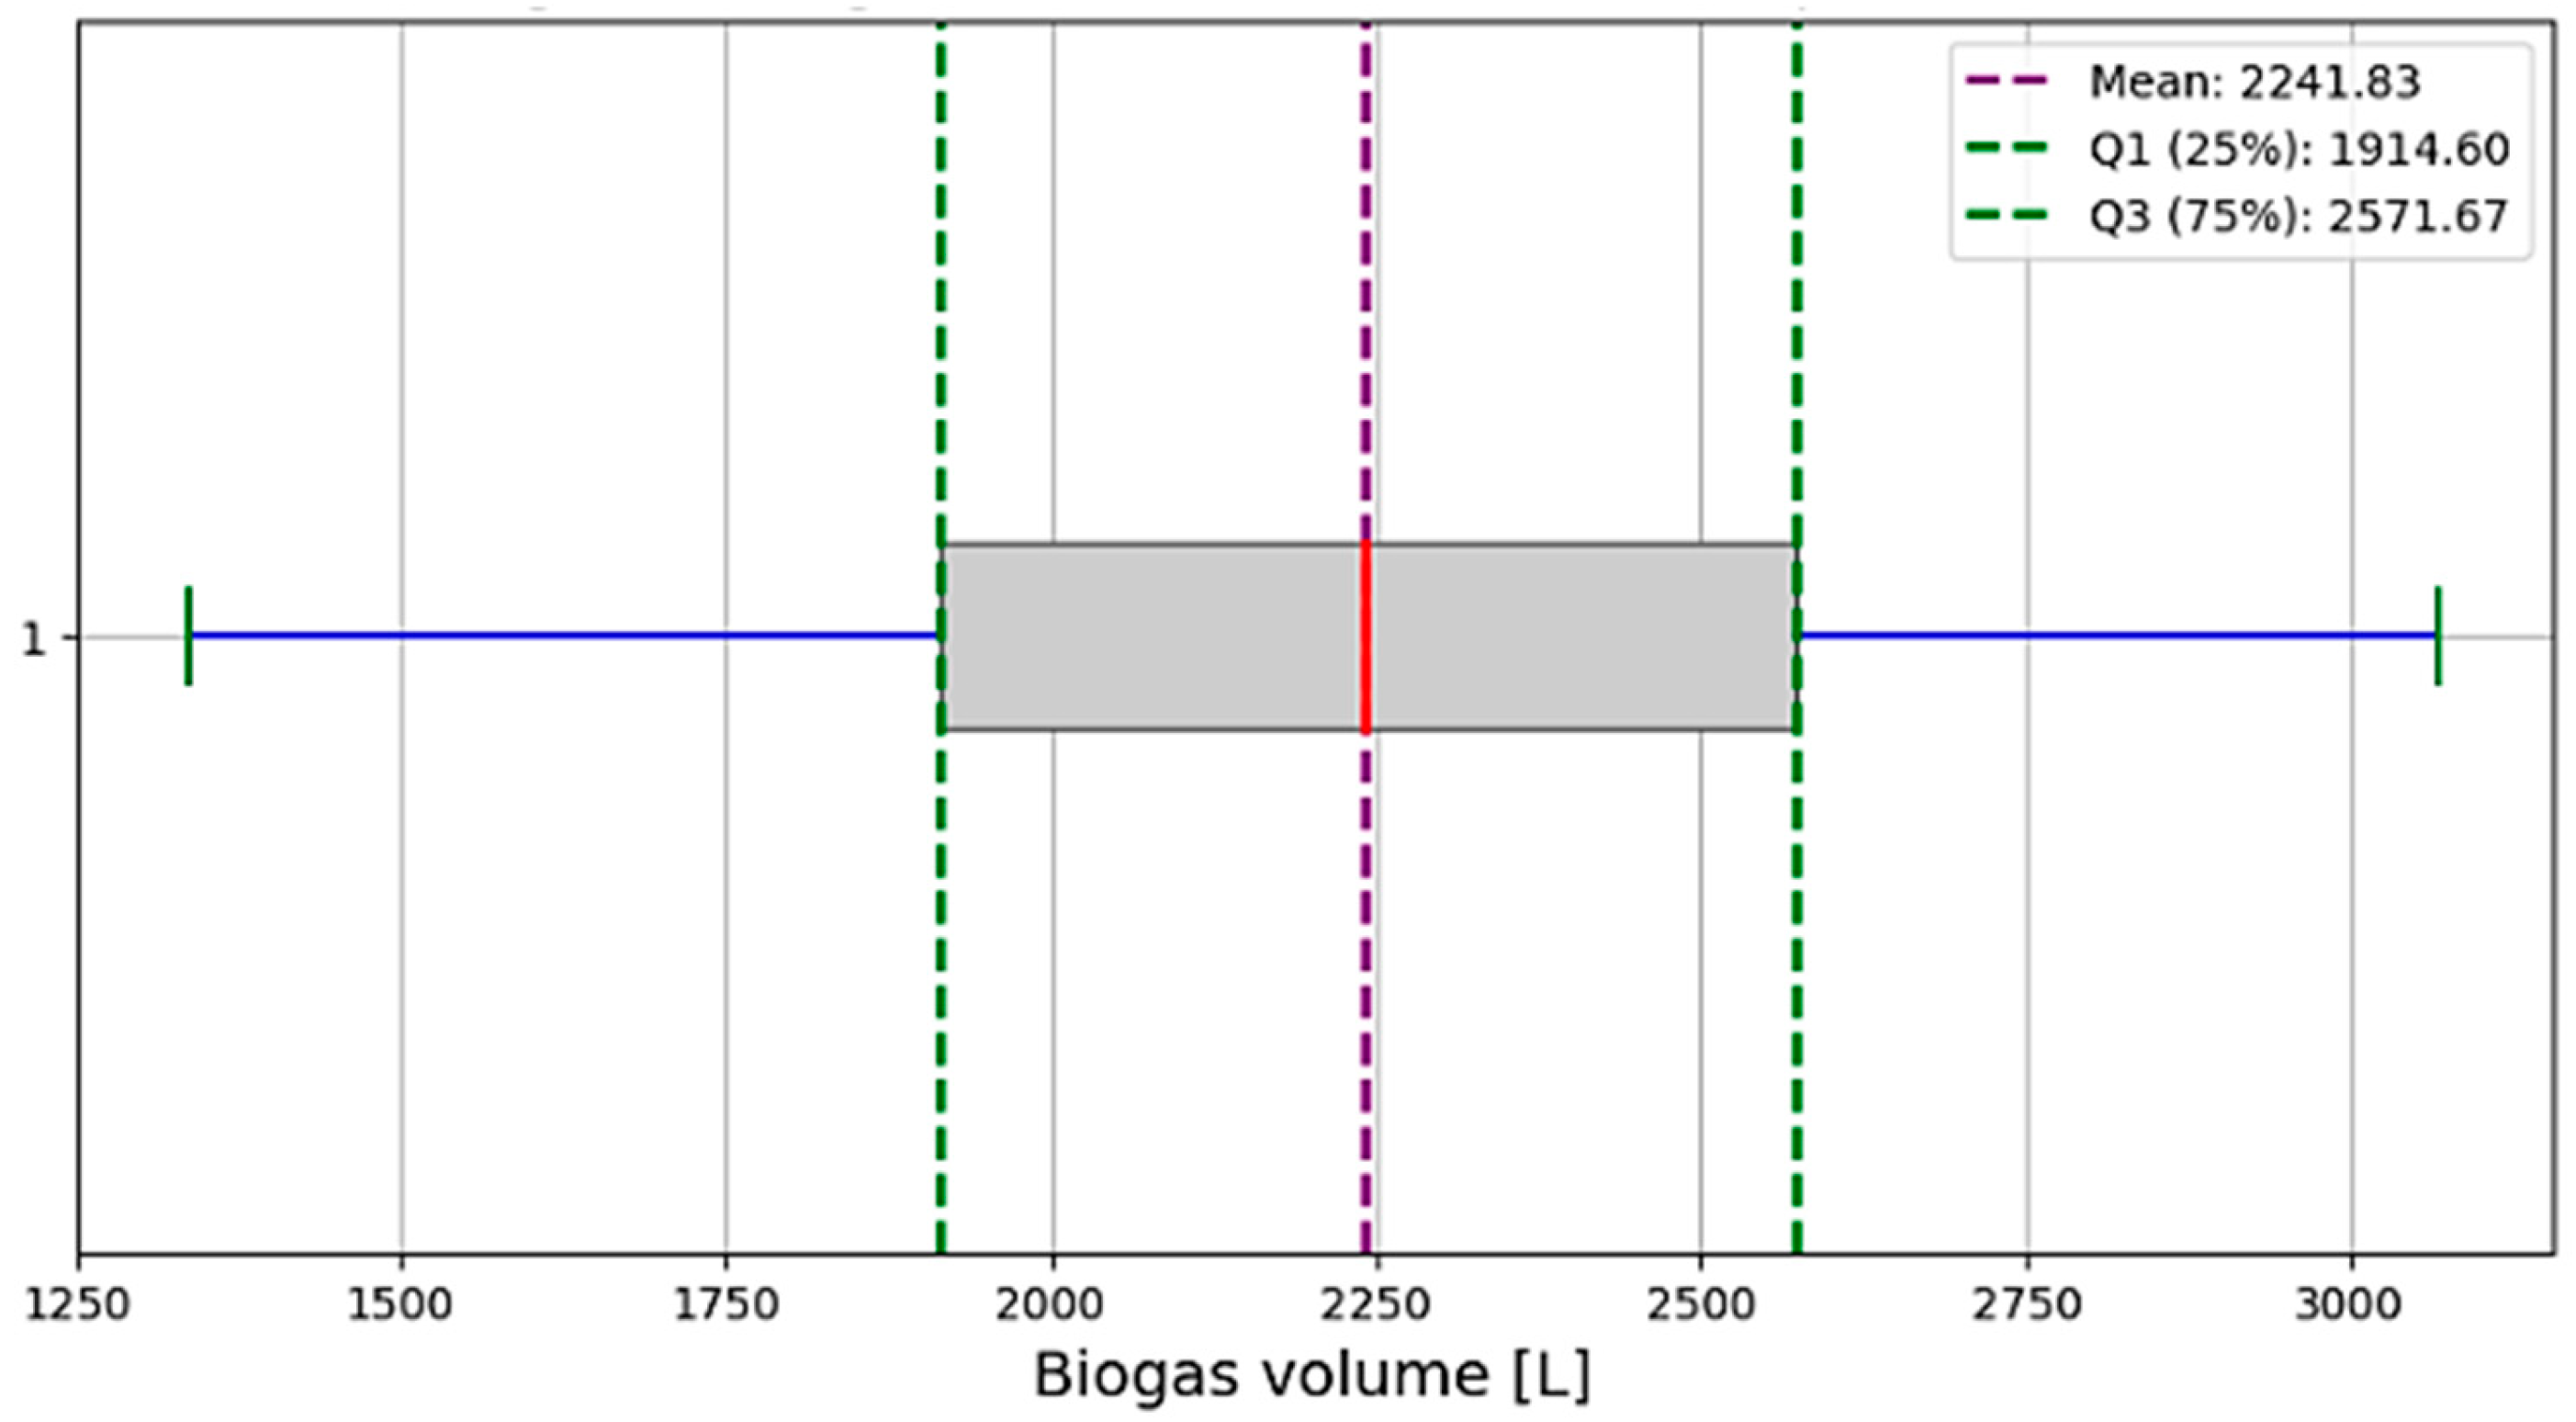
Figure 3.
Histogram and most likely value of biogas production for scenario 2.
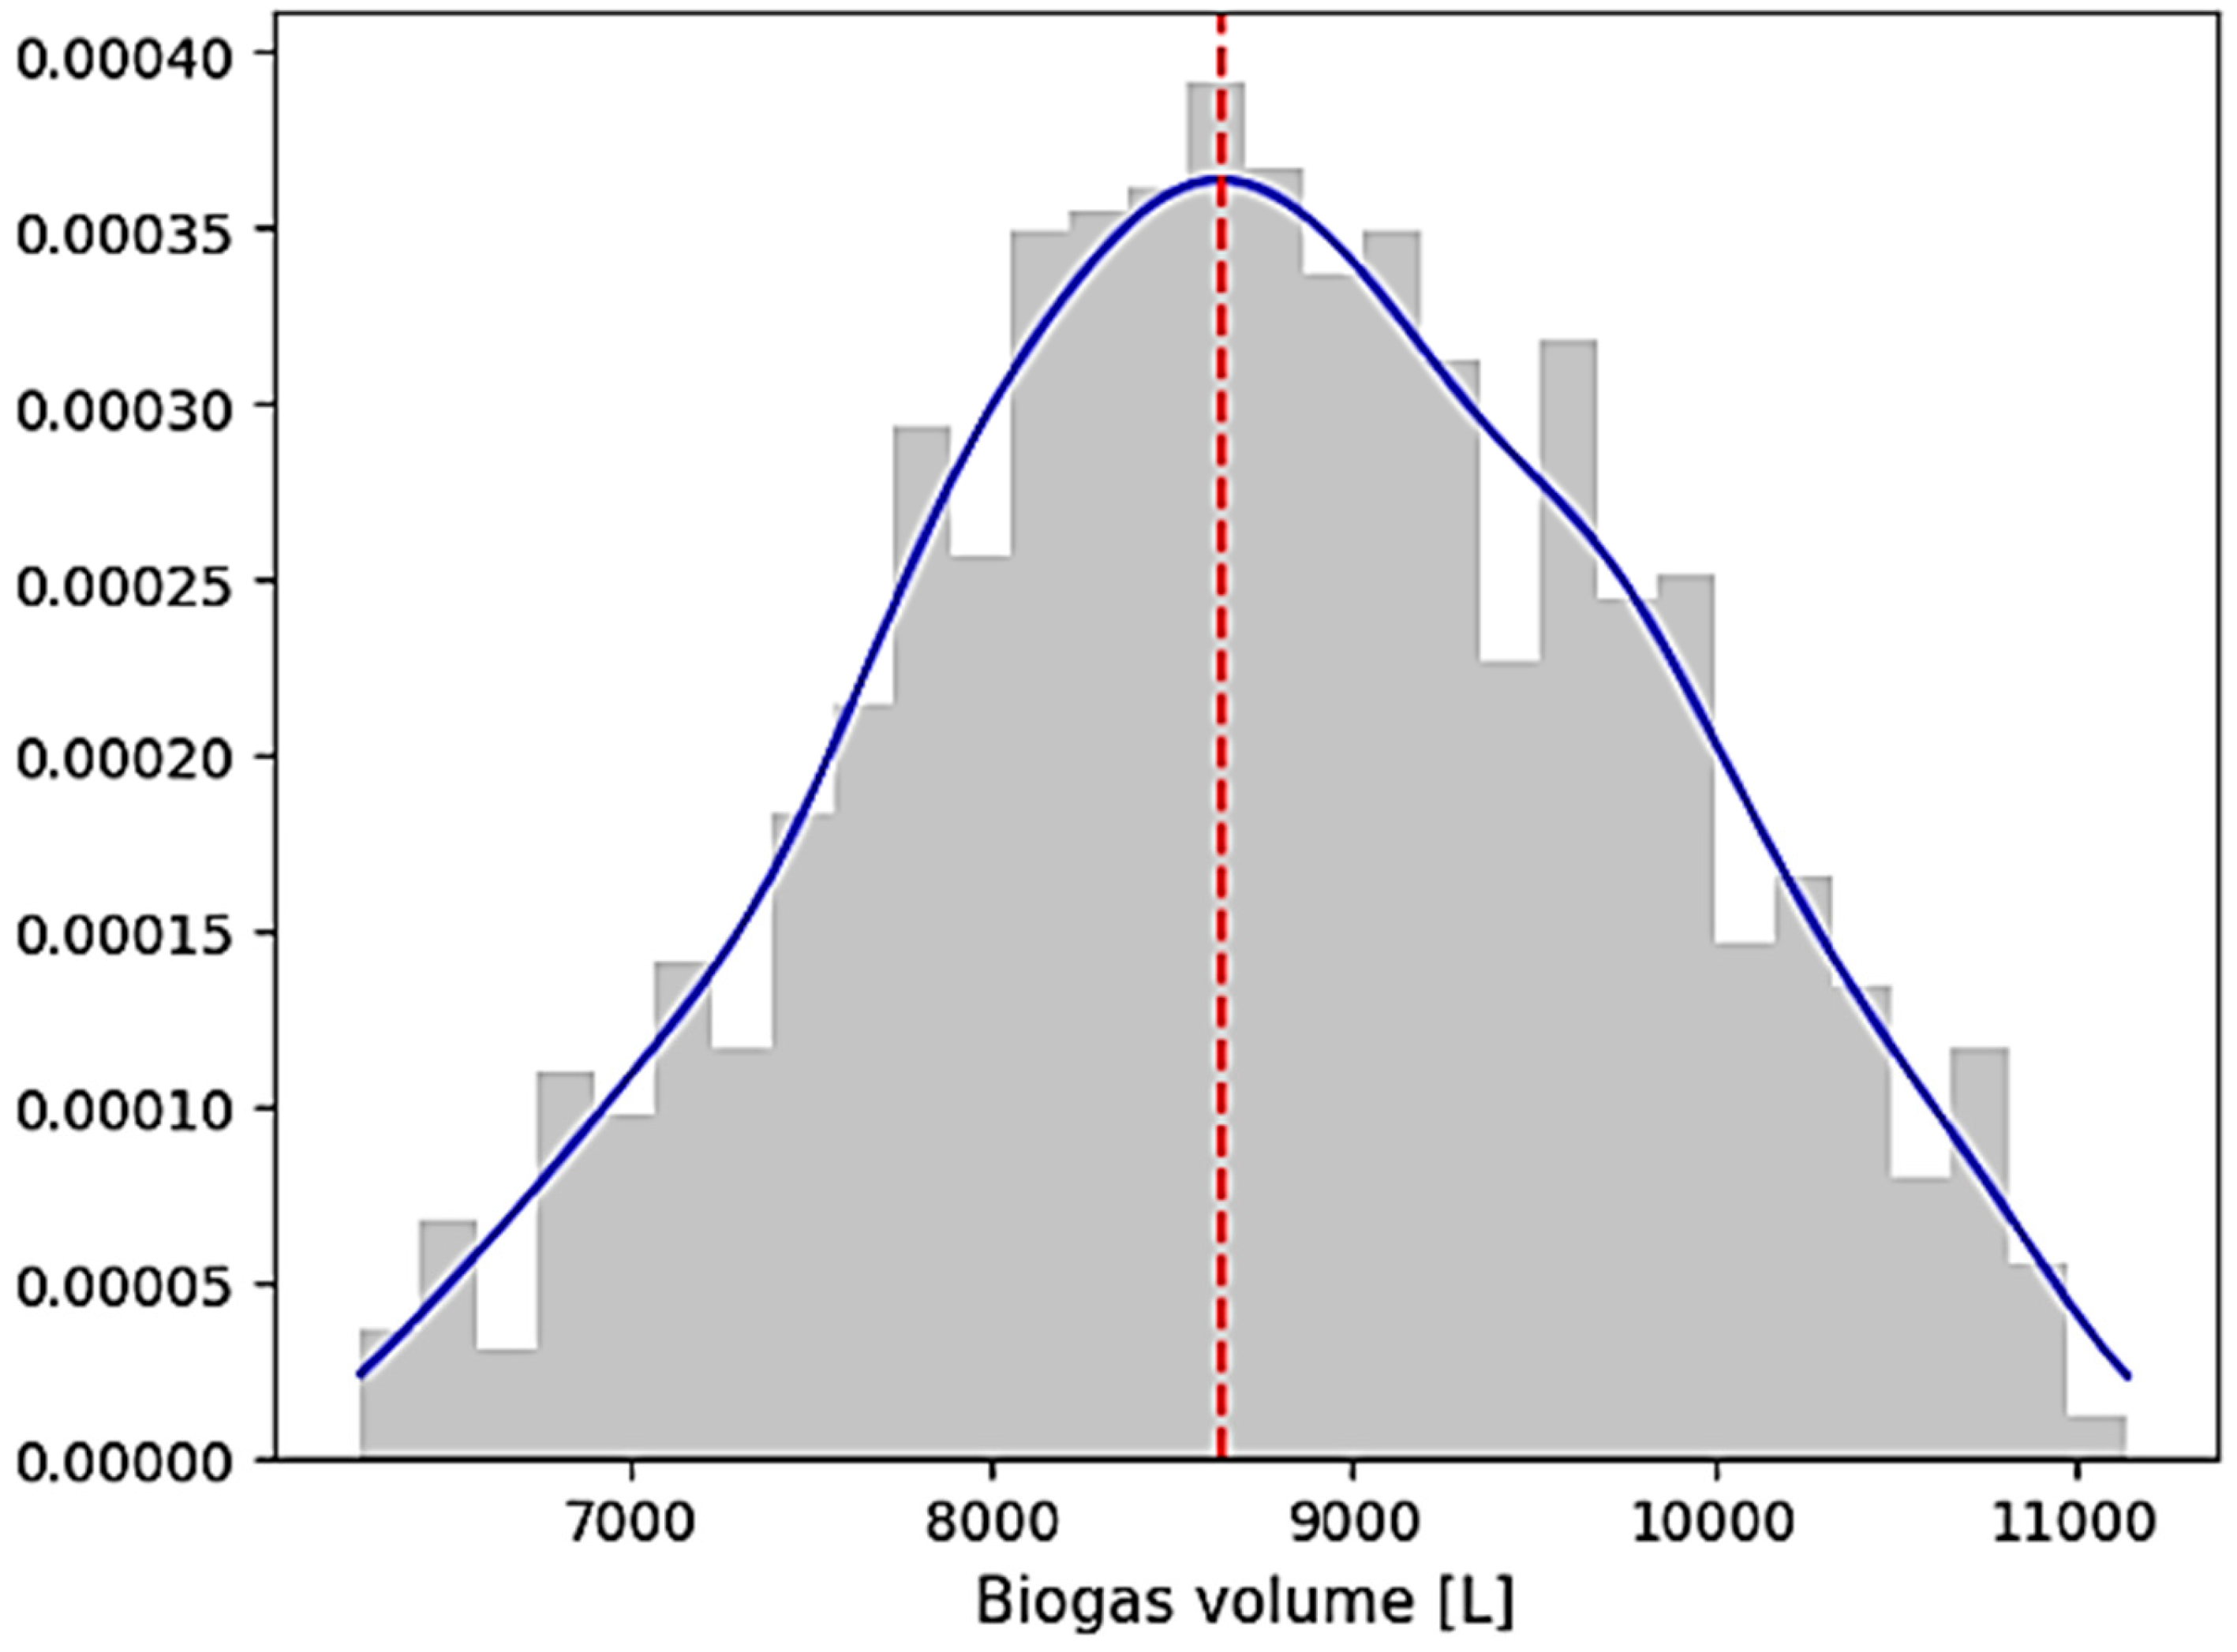
Figure 4.
Box plot for the volume of biogas produced for scenario 2.
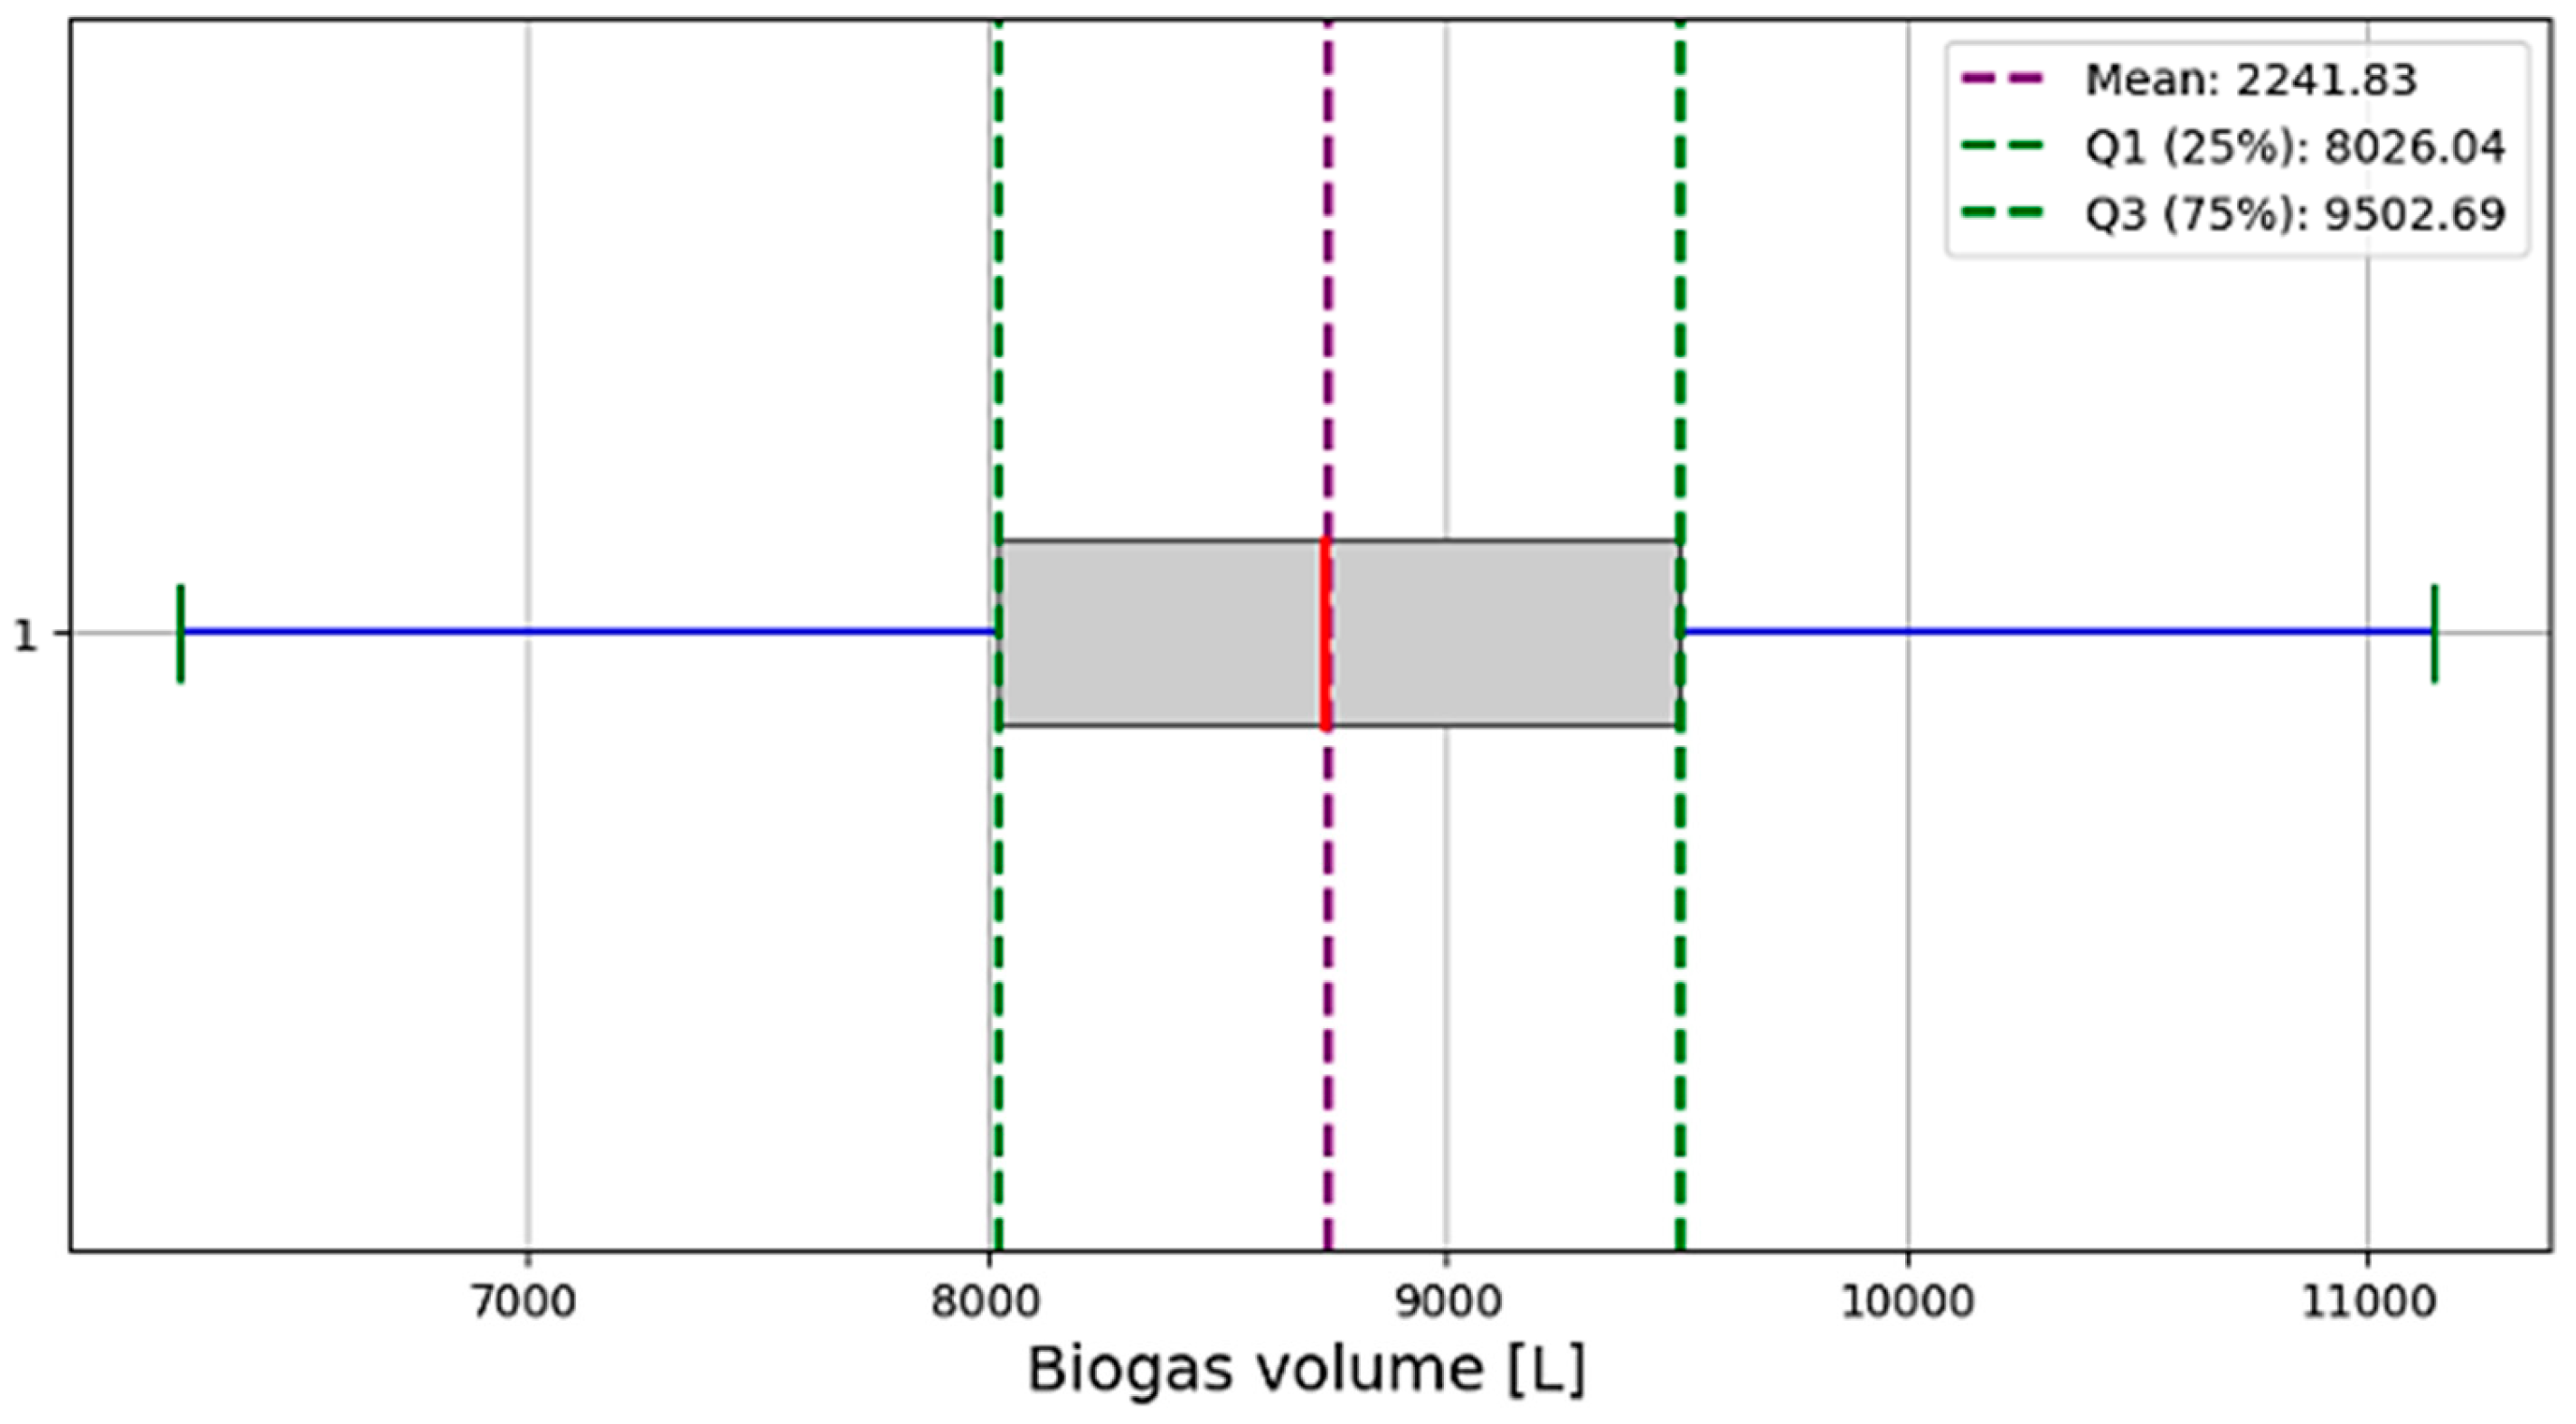

Table 1.
Densities for different types of animal waste.
| Species | Density (kg/L) | Density (kg/m3) |
|---|---|---|
| Bovine | 0.65 - 0.75 | 650 - 750 |
| Pig | 0.60 - 0.70 | 600 - 700 |
| Hen / Chicken | 0.50 - 0.60 | 500 - 600 |
| Horse | 0.70 - 0.80 | 700 - 800 |
| Sheep | 0.65 - 0.75 | 650 - 750 |
| Rabbit | 0.55 - 0.65 | 550 - 650 |
| Goat | 0.60 - 0.70 | 600 - 700 |
| Duck / Goose | 0.55 - 0.65 | 550 - 650 |
Table 2.
Densities for different types of food and agricultural waste.
| Waste | Density (kg/L) | Density (kg/m3) |
|---|---|---|
| Fruit remains (peels) | 0.40 - 0.60 | 400 - 600 |
| Vegetable waste | 0.50 - 0.80 | 500 - 800 |
| Cereal crop residues (straw) | 0.12 - 0.15 | 120 - 150 |
| Potato peels | 0.55 - 0.65 | 550 - 650 |
| Egg shells | 0.60 - 0.70 | 600 - 700 |
| Coffee grounds (coffee residue) | 0.55 - 0.65 | 550 - 650 |
| Corn residues (leaves, stalks) | 0.12 - 0.25 | 120 - 250 |
| Old bread / bread scraps | 0.35 - 0.45 | 350 - 450 |
| Nut and seed shells | 0.25 - 0.35 | 250 - 350 |
| Leftover cooked rice | 0.75 - 0.85 | 750 - 850 |
| Leftover cooked vegetables | 0.60 - 0.75 | 600 - 750 |
| Vegetable oils and fats | 0.80 - 0.90 | 800 - 900 |
| Pasta (cooked) | 0.65 - 0.75 | 650 - 750 |
| Leaves and plant remains | 0.10 - 0.20 | 100 - 200 |
Table 3.
Comparison of factors most outstanding in manure of different species.
| Species | % Moisture | % Total Solids | C/N ratio | % Organic Matter | % Volatile Solids (VS) | Other Important Aspects |
|---|---|---|---|---|---|---|
| Bovine | 85-88% | 12-15% | 18-25:1 | 75-80% | 70-75% | Contains high fiber, slow decomposition. Ideal for continuous flow biodigesters. |
| Pig | 88-92% | 8-10% | 10-14:1 | 85-90% | 80-85% | High concentration of nutrients and liquids, excellent for biogas production due to its rapid decomposition. |
| Hen/Chicken | 70-75% | 25-30% | 6-10:1 | 60-65% | 55-60% | High nitrogen content, requires mixing with other waste to improve the C/N ratio. |
| Horse | 75-80% | 20-25% | 20-30:1 | 60-65% | 55-60% | Manure with high fiber content and low liquid content, useful as a complement in biodigesters. |
| Sheep | 65-70% | 30-35% | 16-18:1 | 55-60% | 50-55% | Rapid decomposition, good option for mixtures with drier waste. |
| Rabbit | 65-70% | 30-35% | 10-12:1 | 50-55% | 45-50% | Small manure with high nitrogen content, excellent for biogas but requires dilution. |
| Goat | 70-75% | 25-30% | 14-16:1 | 50-55% | 50-55% | Similar to sheep manure, but with lower liquid content. |
| Duck/Goose | 80-85% | 15-20% | 8-12:1 | 60-65% | 55-60% | Contains high moisture and nitrogen, requires pH adjustment and C/N ratio. |
Table 4.
Comparison of factors most outstanding in food and agricultural waste.
| Food and agricultural waste | % Moisture | % Total Solids |
C/N ratio | % Organic Matter | % Volatile Solids (VS) |
Other Important Aspects |
|---|---|---|---|---|---|---|
| Fruit remains (peels) | 80% - 90% | 10% - 20% | 35:1 - 40:1 | 90% - 95% | 85% - 90% | High sugar content, rapid degradation. High carbon content, excellent for mixing with nitrogen-rich manure. Provides stability in anaerobic digestion. |
| Vegetable waste | 80% - 90% | 10% - 20% | 12:1 - 20:1 | 85% - 90% | 80% - 85% | High moisture, good nitrogen supply. Good carbon source, ideal for adjusting the C/N ratio in combination with these animals. |
| Cereal crop residues (straw) | 50% - 70% | 30% - 50% | 60:1 - 80:1 | 70% - 80% | 60% - 70% | High proportion of cellulose and lignin, slow degradation. Very high in carbon, requires to be combined with nitrogen-rich residues to avoid inhibiting digestion. |
| Potato peels | 75% - 85% | 15% - 25% | 20:1 - 25:1 | 80% - 85% | 75% - 80% | Rich in starches, moderately high in carbon, good for adjusting the C/N ratio when combined with more nitrogen-rich residues. |
| Egg shells | 5% - 10% | 90% - 95% | 2:1 - 5:1 | 30% - 40% | 10% - 20% | Rich in calcium, low anaerobic digestibility. |
| Coffee grounds | 50% - 60% | 40% - 50% | 20:1 - 25:1 | 80% - 85% | 75% - 80% | They contain lignin, a potential inhibitor in high quantities. C/N ratio close to ideal, favours biogas production but requires adjustment with other waste to avoid acidification. |
| Corn residues (leaves, stalks) | 50% - 70% | 30% - 50% | 40:1 - 60:1 | 65% - 75% | 60% - 70% | High cellulose content, slow degradation. High carbon content, needs to be mixed with nitrogen-rich waste to balance methane production. |
| Stale bread/bread scraps | 30% - 40% | 60% - 70% | 20:1 - 30:1 | 85% - 90% | 80% - 85% | High carbohydrate content, rapid degradation. Good C/N ratio, provides sufficient carbon to stabilize anaerobic digestion. |
| Nut and seed shells | 5% - 10% | 90% - 95% | 80:1 - 100:1 | 40% - 50% | 30% - 40% | They contain lignin and fats, which are slow to degrade. High levels of carbon, and must be combined with nitrogen-rich waste to obtain an adequate balance. |
| Leftover cooked rice | 50% - 60% | 40% - 50% | 15:1 - 20:1 | 85% - 90% | 80% - 85% | High carbohydrate content, good degradation. Low carbon ratio, excellent for improving anaerobic digestion efficiency when mixed with more fibrous materials. |
| Leftover cooked vegetables | 75% - 85% | 15% - 25% | 10:1 - 15:1 | 85% - 90% | 80% - 85% | High nitrogen content, good degradation. Low carbon content, needs to be mixed with carbon-rich materials to avoid acidification of the biodigester. |
| Vegetable oils and fats | 0-2% | 98-100% | 20-30:1 | 95-99% | 95-99% | High energy concentration improves biogas production. Its low moisture content requires mixing with wetter waste. |
| Pasta | 50-55% | 45-50% | 15-20:1 | 85-90% | 80-85% | Rapid degradation, ideal for co-digestion to balance acidity. Can generate volatile fatty acids if not well controlled. |
| Leaves and plant remains | 60-75% | 25-40% | 30-60:1 | 75-85% | 65-75% | They contain cellulose and lignin, which can slow down digestion. They provide structure to the mixture. Pretreatment recommended to improve biodegradation. |
Table 5.
Critical parameters for biogas production.
| Critical parameters | Description | Recommendations for its control |
|---|---|---|
|
C/N ratio (Carbon/Nitrogen) |
The ideal C/N ratio for efficient anaerobic digestion is between 20:1 and 30:1. It is essential to mix low C/N (high nitrogen) waste with high C/N (high carbon) materials to maintain a healthy bacterial environment. |
High C/N ratio (35:1 or more): High carbon waste, such as fruit peels, crop straw, or corn husks, are essential to stabilize the anaerobic digestion process, but they must be mixed with nitrogen-rich materials to prevent the process from becoming inefficient and slow. Moderate C/N Ratio (20-30:1): These residues, such as vegetable waste or cow manure, offer a good ratio of carbon to nitrogen. They are ideal for maintaining a stable balance in anaerobic digestion, favouring continuous and efficient biogas production. Low C/N Ratio (6-18:1): Nitrogen-rich wastes, such as chicken, pig or rabbit manure, have a low C/N ratio, which facilitates rapid decomposition and intense biogas production. However, excess nitrogen can cause acidification and reduce the efficiency of the biodigester, so they must be mixed with carbon-rich materials to optimize production. |
| pH | Waste with low C/N can reduce the pH of the biodigester, so it is important to monitor and adjust the pH to keep it between 6.5 and 7.5, the range in which methanogenic bacteria are most efficient. | The addition of waste such as eggshells or livestock manure helps maintain pH stability. |
| Moisture | Moisture should be maintained between 50% and 60% in order to maximize biogas production and ensure the efficiency of the biodigester. If Moisture > 60% (High): Biogas production decreases due to nutrient dilution and possible stratification, affecting process efficiency. If Moisture < 50% (Low): Biogas production is reduced because anaerobic bacteria cannot efficiently decompose biomass in a dry environment, which inhibits the digestion process. |
The addition of organic waste with different moisture levels can also influence the balance of the biodigester, since too high or too low moisture can affect the activity of anaerobic bacteria. If moisture is high, dry materials such as dry leaves, plant residues or sawdust can be added, which help maintain the structure of the biomass. If the moisture is low, water or waste with high water content, such as fruit and vegetable scraps, can be added to increase the moisture content. |
| Temperature | Temperature is one of the most important factors affecting microbial activity during the anaerobic digestion process. There are three thermal ranges where microorganisms work efficiently:
The mesophilic range is the most commonly used due to its stability and efficiency under standard conditions.The thermophilic range, although faster, requires greater control and energy to maintain high temperatures. |
Maintaining a constant temperature within the optimal range for the type of microorganisms present (mesophilic or thermophilic) is crucial for the efficiency of the process. To do this, it is recommended to:
|
| Odor control | During the biogas production process, bad odors come mainly from the anaerobic decomposition of organic matter, such as animal feces and kitchen waste. The responsible compounds include hydrogen sulfide (H₂S), as well as volatile fatty acids, ammonia (NH₃), and volatile organic compounds (VOCs). These gases are generated by the activity of microorganisms breaking down proteins, fats, and carbohydrates under anaerobic conditions. |
Odours can be minimised by adding residues rich in cellulose and lignin (plant remains), and avoiding excessive greasy or oily residues. |
Table 6.
Average pH values and buffering capacity for different types of animal waste.
| Type of Waste | Average pH | Cushioning Capacity (High, Medium, Low) |
|---|---|---|
| Bovine | 6.5 - 7.5 | High |
| Pig | 6.0 - 7.0 | Average |
| Hen/Chicken | 6.2 - 7.4 | Average |
| Horse | 6.5 - 7.5 | High |
| Sheep | 6.8 - 7.6 | High |
| Rabbit | 6.3 - 7.3 | Average |
| Goat | 6.8 - 7.6 | High |
| Duck/Goose | 6.0 - 7.0 | Average |
Table 7.
Average pH values and buffering capacity for different types of food and agricultural waste.
Table 7.
Average pH values and buffering capacity for different types of food and agricultural waste.
| Type of Waste | Average pH | Cushioning Capacity (High, Medium, Low) |
|---|---|---|
| Fruit remains (peels) | 4.0 - 5.5 | Low |
| Vegetable waste | 5.5 - 7.0 | Average |
| Cereal crop residues (straw) | 6.0 - 7.0 | Average |
| Potato peels | 6.0 - 7.0 | Average |
| Egg shells | 7.0 - 8.0 | High |
| Coffee grounds | 4.5 - 6.0 | Low |
| Corn residues (leaves, stalks) | 6.0 - 7.5 | Average |
| Stale bread/bread scraps | 5.0 - 6.5 | Low |
| Nut and seed shells | 5.5 - 6.5 | Low |
| Leftover cooked rice | 6.0 - 7.0 | Average |
| Leftover cooked vegetables | 6.0 - 7.5 | Average |
| Vegetable oils and fats | 6.0 - 6.5 | Low |
| Pasta | 5.5 - 6.5 | Average |
| Leaves and plant remains | 6.5 - 7.0 | High |
Table 8.
Calculations of the factors for the estimation of
| Residue | [kg] | Damping capacity | |||||
|---|---|---|---|---|---|---|---|
| Bovine manure | 20 | 7.0 | High | 3 | 20/50=0.4 | 8.4 | 1.2 |
| Pig manure | 10 | 6.5 | Average | 2 | 10/50=0.2 | 2.6 | 0.4 |
| Fruit peels | 5 | 4.5 | Low | 1 | 5/50=0.1 | 0.45 | 0.1 |
| Vegetable waste | 8 | 6.5 | Average | 2 | 8/50=0.16 | 2.08 | 0.32 |
| Egg shells | 5 | 7.5 | High | 3 | 5/50=0.1 | 2.25 | 0.3 |
| Coffee grounds | 2 | 5.0 | Low | 1 | 2/50=0.04 | 0.2 | 0.04 |
| Total | 15.98 | =2.36 | |||||
Table 9.
Biogas production potential from animal waste.
| Type of Waste | Biogas Production Potential [m3/kg VS] | Relevant Comment |
|---|---|---|
| Bovine | 0.20 - 0.30 | It depends on the fiber content. |
| Pig | 0.35 - 0.50 | High protein and fat content |
| Hen/Chicken | 0.40 - 0.55 | Generally high in nutrients |
| Horse | 0.18 - 0.28 | High fiber content, lower efficiency |
| Sheep | 0.22 - 0.32 | Contains more fiber, similar to bovine |
| Rabbit | 0.25 - 0.35 | Better results in mixed digestion systems |
| Goat | 0.22 - 0.33 | Fiber similar to sheep and cattle |
| Duck/Goose | 0.40 - 0.50 | Similar to chicken waste in efficiency |
Table 10.
Biogas production potential for some types of food and agricultural waste.
| Type of Waste | Biogas Production Potential [m3/kg VS] | Relevant Comment |
|---|---|---|
| Fruit remains (peels) | 0.30 - 0.45 | High in sugars, good efficiency |
| Vegetable waste | 0.20 - 0.35 | Variable water and fiber content |
| Cereal crop residues (straw) | 0.18 - 0.25 | Low in protein and fat, high in cellulose |
| Potato peels | 0.25 - 0.35 | Good conversion due to starch content |
| Egg shells | 0.00 – 0.02 | The contribution of eggshell to biogas production is negligible because eggshell matter is mainly inorganic and does not contribute significantly to biogas production, but it does provide nutrients to the mix. |
| Coffee grounds | 0.25 - 0.35 | Moderate fat content, antioxidants |
| Corn residues (leaves, stalks) | 0.20 - 0.30 | Fibrous, similar to cereal straw |
| Stale bread/bread scraps | 0.35 - 0.50 | High in carbohydrates, good performance |
| Nut and seed shells | 0.15 - 0.25 | High hardness, low biogas potential |
| Leftover cooked rice | 0.30 - 0.45 | High in starch, similar to potatoes |
| Leftover cooked vegetables | 0.25 - 0.40 | Varies depending on the plant, high efficiency |
| Vegetable oils and fats | 0.80 - 1.00 | High biogas production due toTheir high lipid content makes them an excellent source of energy for anaerobic digestion. They can cause fatty acid overload.Ideal for co-digestion. |
| Pasta | 0.45 - 0.60 | They produce a moderate level of biogas due to their carbohydrate and protein content.Generates volatile fatty acids (VFA), which can acidify the biodigester if the pH is not monitored. |
| Leaves and plant remains | 0.20 - 0.30 | Low biogas production. They contain a high proportion of lignin and cellulose, which slows down digestion. Pretreatment is recommended.(pre-shredding or composting) to improve its biodegradability. |
Table 11.
Percentages of animal waste recommended empirically to estimate adequate biogas production.
Table 11.
Percentages of animal waste recommended empirically to estimate adequate biogas production.
| Biomass Component | Recommended percentages on the total substrate mixture (%) | Relevant chemical compounds | Importance in biogas production | Influence on pH, moisture and odors | |
|---|---|---|---|---|---|
| Individual | Mixed | ||||
| Bovine | 40-60 | 20-50 | Proteins, Fiber | Good biogas production, slow decomposition | High moisture, stabilizes pH |
| Pig | 30-50 | 15-40 | Proteins, Nitrogen | Fast decomposition, high productivity | Moderate pH, high water content |
| Hen/Chicken | 10-20 | 5-15 | Nitrogen | Increase performance in small amounts | Low moisture, high alkalinity, strong odor |
| Horse | 20-30 | 10-20 | Fiber | Structural complement, promotes stability | Moderate moisture and stabilizes odors |
| Sheep/Goat | 5-25 | 10-15 | Nutrients, Fiber | Good balance between nutrients and decomposition | Low moisture, moderate pH stabilization |
| Rabbit | 5-10 | 5-10 | Nitrogen, Phosphorus | Small amounts improve biogas without overactivity | Low moisture, good pH control |
| Duck/Goose | 5-15 | 5-10 | Nitrogen | High productivity with proper management | Low moisture, requires odor control |
Table 12.
Percentages of food and agricultural waste recommended empirically to estimate adequate biogas production.
Table 12.
Percentages of food and agricultural waste recommended empirically to estimate adequate biogas production.
| Biomass Component | Recommended percentages on the total substrate mixture (%) | Relevant chemical compounds | Importance in biogas production | Influence on pH, moisture and odors |
|---|---|---|---|---|
| Fruit remains (peels) | 10-20 | Carbohydrates, Sugars | They accelerate anaerobic digestion, useful for mixing | Moderate acidity, high moisture |
| Vegetable waste | 15-30 | Fiber, Minerals | Fast decomposition, good biogas yield | Balances pH, moderates moisture |
| Cereal crop residues (straw) | 10-20 | Cellulose | Provides structure to the digester, improves stability | High capacity to absorb moisture |
| Potato peels | 5-15 | Carbohydrates | Easy decomposition, provides additional nutrients | Low acidity, high moisture |
| Egg shells | 5-10 | Calcium | Controls pH, provides alkalinity | Reduces acidity, lowers moisture |
| Coffee grounds | 5-15 | Nitrogen, Minerals | Rich in nutrients, in excess it inhibits digestion | Acid pH, moderate odor control |
| Corn residues (leaves, stalks) | 10-20 | Fiber | Supports stability and structure in the digester | Low moisture, moderates odors |
| Stale bread/bread scraps | 5-15 | Carbohydrates | Easy degradation, stimulates biogas production | Moderate moisture, provides simple carbohydrates |
| Nut and seed shells | 5-10 | Fats, Fiber | Slightly degradable, useful in low proportions | Low acidity, helps absorb moisture |
| Leftover cooked rice | 5-10 | Carbohydrates | Rapid decomposition, contributes biogas | Balances moisture, moderate in pH |
| Leftover cooked vegetables | 10-20 | Minerals, Fiber | Improves performance, easy decomposition | High moisture, provides pH neutrality |
| Vegetable oils and fats | 2-10 | Lipids | High energy production, in excess it inhibits digestion | Requires acidity control |
| Pasta | 5-15 | Carbohydrates | Easy decomposition, high biogas productivity | Moderate moisture, balances odors |
| Leaves and plant remains | 5-20 | Fiber, Minerals | Provides structure and nutrients, improves stability | Balances moisture, good influence on pH |
Table 13.
Values corresponding to the coefficients for animal waste.
| Species | Moisture |
Organic Matter |
Volatile Solids |
Biogas Production Potential [m3/kg SV] |
=STxMOxSVxPP | ||||||||
|---|---|---|---|---|---|---|---|---|---|---|---|---|---|
| min. | max. | min. | max. | min. | max. | min. | max. | min. | max. | min. | avg. | max. | |
| Bovine | 0.85 | 0.88 | 0.12 | 0.15 | 0.75 | 0.80 | 0.70 | 0.75 | 0.20 | 0.30 | 0.0126 | 0.0198 | 0.0270 |
| Pig | 0.88 | 0.92 | 0.08 | 0.10 | 0.85 | 0.90 | 0.80 | 0.85 | 0.35 | 0.50 | 0.0190 | 0.0286 | 0.0383 |
| Hen/Chicken | 0.70 | 0.75 | 0.25 | 0.30 | 0.60 | 0.65 | 0.55 | 0.60 | 0.40 | 0.55 | 0.0330 | 0.0487 | 0.0644 |
| Horse | 0.75 | 0.80 | 0.20 | 0.25 | 0.60 | 0.65 | 0.55 | 0.60 | 0.18 | 0.28 | 0.0119 | 0.0196 | 0.0273 |
| Sheep | 0.65 | 0.70 | 0.30 | 0.35 | 0.55 | 0.60 | 0.50 | 0.55 | 0.22 | 0.32 | 0.0182 | 0.0276 | 0.0370 |
| Rabbit | 0.65 | 0.70 | 0.30 | 0.35 | 0.50 | 0.55 | 0.45 | 0.50 | 0.25 | 0.35 | 0.0169 | 0.0253 | 0.0337 |
| Goat | 0.70 | 0.75 | 0.25 | 0.30 | 0.50 | 0.55 | 0.50 | 0.55 | 0.22 | 0.33 | 0.0138 | 0.0218 | 0.0299 |
| Duck/Goose | 0.80 | 0.85 | 0.15 | 0.20 | 0.60 | 0.65 | 0.55 | 0.60 | 0.40 | 0.50 | 0.0198 | 0.0294 | 0.0390 |
Table 14.
Values corresponding to the coefficients for the most common food and agricultural waste.
| Food and agricultural waste | Moisture | Organic Matter | Volatile Solids | Biogas Production Potential [m3/kg SV] | =STxMOxSVxPP | |||||||||||||
|---|---|---|---|---|---|---|---|---|---|---|---|---|---|---|---|---|---|---|
| min. | max. | min. | max. | min. | max. | min. | max. | min. | max. | min. | avg. | max. | ||||||
| Fruit remains (peels) | 0.80 | 0.90 | 0.10 | 0.20 | 0.90 | 0.95 | 0.85 | 0.90 | 0.30 | 0.45 | 0.0230 | 0.0500 | 0.0770 | |||||
| Vegetable waste | 0.80 | 0.90 | 0.10 | 0.20 | 0.85 | 0.90 | 0.80 | 0.85 | 0.20 | 0.35 | 0.0136 | 0.0336 | 0.0536 | |||||
| Cereal crop residues (straw) | 0.50 | 0.70 | 0.30 | 0.50 | 0.70 | 0.80 | 0.60 | 0.70 | 0.18 | 0.25 | 0.0227 | 0.0463 | 0.0700 | |||||
| Potato peels | 0.75 | 0.85 | 0.15 | 0.25 | 0.80 | 0.85 | 0.75 | 0.80 | 0.25 | 0.35 | 0.0225 | 0.0410 | 0.0595 | |||||
| Egg shells | 0.05 | 0.10 | 0.90 | 0.95 | 0.30 | 0.40 | 0.10 | 0.20 | 0.00 | 0.02 | 0.0000 | 0.0008 | 0.0015 | |||||
| Coffee grounds | 0.50 | 0.60 | 0.40 | 0.50 | 0.80 | 0.85 | 0.75 | 0.80 | 0.25 | 0.35 | 0.0600 | 0.0895 | 0.1190 | |||||
| Corn residues (leaves, stalks) | 0.50 | 0.70 | 0.30 | 0.50 | 0.65 | 0.75 | 0.60 | 0.70 | 0.20 | 0.30 | 0.0234 | 0.0511 | 0.0788 | |||||
| Stale bread/bread scraps | 0.30 | 0.40 | 0.60 | 0.70 | 0.85 | 0.90 | 0.80 | 0.85 | 0.35 | 0.50 | 0.1428 | 0.2053 | 0.2678 | |||||
| Nut and seed shells | 0.05 | 0.10 | 0.90 | 0.95 | 0.40 | 0.50 | 0.30 | 0.40 | 0.15 | 0.25 | 0.0162 | 0.0319 | 0.0475 | |||||
| Leftover cooked rice | 0.50 | 0.60 | 0.40 | 0.50 | 0.85 | 0.90 | 0.80 | 0.85 | 0.30 | 0.45 | 0.0816 | 0.1269 | 0.1721 | |||||
| Leftover cooked vegetables | 0.75 | 0.85 | 0.15 | 0.25 | 0.85 | 0.90 | 0.80 | 0.85 | 0.25 | 0.40 | 0.0255 | 0.0510 | 0.0765 | |||||
| Vegetable oils and fats | 0.00 | 0.02 | 0.98 | 1.00 | 0.95 | 0.99 | 0.95 | 0.99 | 0.80 | 1.00 | 0.7076 | 0.8438 | 0.9801 | |||||
| Pasta | 0.50 | 0.55 | 0.45 | 0.50 | 0.85 | 0.90 | 0.80 | 0.85 | 0.45 | 0.60 | 0.1377 | 0.1836 | 0.2295 | |||||
| Leaves and plant remains | 0.60 | 0.75 | 0.25 | 0.40 | 0.75 | 0.85 | 0.65 | 0.75 | 0.20 | 0.30 | 0.0244 | 0.0504 | 0.0765 | |||||
Table 15.
Parameters considered in the proposed model.
| Residue | Density avg [kg/L] |
%Avg. Moisture |
pH | C/N avg. | avg. | ||
|---|---|---|---|---|---|---|---|
| Avg | AC | CA Factor | |||||
| Bovine | 0.70 | 86.50 | 7.00 | High | 3 | 21.50 | 0.0198 |
| Pig | 0.65 | 90,00 | 6.50 | Average | 2 | 12,00 | 0.0286 |
| Hen/Chicken | 0.55 | 72.50 | 6.80 | Average | 2 | 8.00 | 0.0487 |
| Horse | 0.75 | 77.50 | 7.00 | High | 3 | 25,00 | 0.0196 |
| Sheep | 0.70 | 67.50 | 7.20 | High | 3 | 17.00 | 0.0276 |
| Rabbit | 0.60 | 67.50 | 6.80 | Average | 2 | 11,00 | 0.0253 |
| Goat | 0.65 | 72.50 | 7.20 | High | 3 | 15,00 | 0.0218 |
| Duck/Goose | 0.60 | 82.50 | 6.50 | Average | 2 | 10,00 | 0.0294 |
| Fruit remains (peels) | 0.50 | 85,00 | 4.75 | Low | 1 | 37.50 | 0.0500 |
| Vegetable waste | 0.65 | 85,00 | 6.25 | Average | 2 | 16.00 | 0.0336 |
| Cereal crop residues (straw) | 0.14 | 60,00 | 6.50 | Average | 2 | 70,00 | 0.0463 |
| Potato peels | 0.60 | 80,00 | 6.50 | Average | 2 | 22.50 | 0.0410 |
| Egg shells | 0.65 | 7.50 | 7.50 | High | 3 | 3.50 | 0.0008 |
| Coffee grounds | 0.60 | 55,00 | 5.25 | Low | 1 | 22.50 | 0.0895 |
| Corn residues (leaves, stalks) | 0.19 | 60,00 | 6.75 | Average | 2 | 50,00 | 0.0511 |
| Stale bread/bread scraps | 0.40 | 35,00 | 5.75 | Low | 1 | 25,00 | 0.2053 |
| Nut and seed shells | 0.30 | 7.50 | 6.00 | Low | 1 | 90,00 | 0.0319 |
| Leftover cooked rice | 0.80 | 55,00 | 6.50 | Average | 2 | 17.50 | 0.1269 |
| Leftover cooked vegetables | 0.68 | 80,00 | 6.75 | Average | 2 | 12.50 | 0.0510 |
| Vegetable oils and fats | 0.85 | 1.00 | 6.25 | Low | 1 | 25,00 | 0.8438 |
| Pasta | 0.70 | 47.50 | 6.00 | Average | 2 | 17.50 | 0.1836 |
| Leaves and plant remains | 0.15 | 67.50 | 6.75 | High | 3 | 45,00 | 0.0504 |
Table 16.
Statistics of the results obtained in scenario 1.
| Parameter | Most probable value | Q1 | Median (Q2) | Q3 | IQR (Q3-Q1) |
Mean | Standard deviation | Confidence interval (95%) |
|---|---|---|---|---|---|---|---|---|
| Biogas Volume [L] | 2354.17 | 1914.60 | 2240.92 | 2571.67 | 657.07 | 2241.83 | 407.20 | (2216.59, 2267.07) |
| pH | 6.57 | 6.49 | 6.62 | 6.76 | 0.27 | 6.63 | 0.19 | (6.62, 6.64) |
| Moisture (%) | 60.35 | 58.98 | 60.06 | 61.02 | 2.04 | 60.02 | 1.29 | (59.94, 60.1) |
| C/N | 19.84 | 19.45 | 19.95 | 20.51 | 1.06 | 19.98 | 0.72 | (19.93, 20.02) |
| Vol. Substrate | 107.32 | 107.12 | 112.07 | 118.27 | 11.15 | 112.78 | 6.73 | (112.36, 113.19) |
Table 17.
Statistics of the results obtained in scenario 2.
| Parameter | Most probable value | Q1 | Median (Q2) | Q3 | IQR (Q3 - Q1) |
Mean | Standard deviation | Confidence interval (95%) |
|---|---|---|---|---|---|---|---|---|
| Biogas Volume [L] | 8636.70 | 8026.04 | 8732.47 | 9502.69 | 1476.65 | 8741.37 | 1019.35 | (8678.11, 8804.62) |
| pH | 6.46 | 6.39 | 6.48 | 6.60 | 0.21 | 6.49 | 0.16 | (6.48, 6.50) |
| Moisture (%) | 60.24 | 58.83 | 60.06 | 61.17 | 2.33 | 60.01 | 1.40 | (59.92, 60.1) |
| C/N | 20.04 | 19.37 | 20.03 | 20.69 | 1.32 | 20.03 | 0.92 | (19.98, 20.09) |
| Vol. Substrate | 112.26 | 110.53 | 112.21 | 113.83 | 3.30 | 112.20 | 2.31 | (112.06, 112.35) |
Disclaimer/Publisher’s Note: The statements, opinions and data contained in all publications are solely those of the individual author(s) and contributor(s) and not of MDPI and/or the editor(s). MDPI and/or the editor(s) disclaim responsibility for any injury to people or property resulting from any ideas, methods, instructions or products referred to in the content. |
© 2024 by the authors. Licensee MDPI, Basel, Switzerland. This article is an open access article distributed under the terms and conditions of the Creative Commons Attribution (CC BY) license (http://creativecommons.org/licenses/by/4.0/).
Copyright: This open access article is published under a Creative Commons CC BY 4.0 license, which permit the free download, distribution, and reuse, provided that the author and preprint are cited in any reuse.


