
Submitted:
09 November 2024
Posted:
12 November 2024
You are already at the latest version
Abstract
In digital radiography imaging, pixel binning is an effective way to reduce the amount of image data for transmission or storage, and is particularly effective for application to dynamic digital radiography detectors for fluoroscopic imaging. Traditional pixel binning methods can be described as the process of downsampling an image that has been processed with a moving average (MA) filter for anti-aliasing purposes. In this paper, the performance of pixel binning is analyzed in terms of the noise power spectrum (NPS), modulation transfer function (MTF), and detective quantum efficiency (DQE) based on theoretical derivations. The performance of the pixel binning method is analyzed by performing theoretical analysis and Monte Carlo simulations through parametric modeling for NPS and MTF. Using x-ray images acquired from direct and indirect conversion detectors, the performances of pixel binning are compared and analyzed. Through theoretical analysis and experiments, we demonstrate that the pixel binning method can approach the DQE performance achieved by downsampling after applying an anti-aliasing filter. However, we found that using a better anti-aliasing filter instead of MA can improve DQE performance, especially for direct conversion detectors.
Keywords:
Anti-aliasing filter
; binning
; detective quantum efficiency
; downsampling
; moving average filter
1. Introduction
Dynamic digital radiography (DDR) is one of the modern imaging techniques employed in the field of medical imaging. With advancements in technology, DDR extends the capabilities of traditional digital radiography, enabling dynamic motion capture and representation at high resolutions, making it suitable for various applications such as joint and bone imaging, respiratory and gastrointestinal motion studies [1,2,3]. While static digital radiography techniques have been primarily utilized for capturing still images, DDR aids in observing and analyzing moving structures and functionalities in greater detail.
Despite numerous advantages offered by DDR, it also possesses several limitations [3,4]. DDR captures a large number of image frames in a short period for fluoroscopic imaging, which can result in increased radiation exposure to patients. Processing and analyzing the voluminous high-quality image data generated in DDR is a complex task. It demands heavy computing resources along with high-performance radiography equipment and infrastructure, leading to high initial investment and maintenance costs. Furthermore, the large-scale data generated by DDR pose challenges related to storage, management, and transmission, requiring additional resources. Hence, the necessity of applying pixel binning with degrading the image resolution arises from the need to transmit and process substantial amounts of data in DDR [1].
In order to obtain a discrete-time image signal through a sampling process, the continuous-time image signal should be preprocessed using an anti-aliasing filter to avoid the overlaps of spectrum aliases that can show moire patterns and noise aliasing artifacts [5,6]. In digital imaging for light photons, various analog anti-aliasing filters, of which properties are based on the optical low-pass filter (LPF), have been developed and practically applied to digital cameras [7,8]. However, implementation of such filters is difficult especially for x-ray photons in digital radiography imaging. Hence, appropriate anti-aliasing filters are not developed especially for large flat-panel detectors and thus the acquired images suffer from the noise aliasing artifact [1].
For direct conversion detectors [9], which are based on the amorphous Se (a-Se) photoconductor as an example, the aliasing artifact is severe due to the excellent frequency performance [10] in terms of the modulation transfer function (MTF), which is a Fourier transform of the point spread function [11]. The noise aliasing will inflate the noise power spectrum (NPS), which is a power spectral density of noise signals [12,13,14,15], and consequently deteriorate the detective quantum efficiency (DQE), which is inversely proportional to NPS [16,17]. For indirect conversion detectors, which are based on the CsI:Tl or Gd2O2S scintillator with photodiodes for example [1], even if the MTF performance for high frequency components is quite low [18], the NPS values can also be inflated from the low noise aliasing. Hence, devising a method to implement anti-aliasing filters in radiography detectors makes it possible to design detectors with high DQE values for both direct and indirect cases.
Instead of developing difficult optical anti-aliasing filters for x-ray photons, the oversampling and sampling rate reduction approach in the discrete-time domain can make it easier to realize anti-aliasing filter operations [6,19]. In acquiring discrete-time signals, oversampling is a process of sampling signals with sampling frequencies higher than the target sampling frequency. Oversampling helps avoid aliasing and phase distortion by relaxing the performance requirements for anti-aliasing filter [20,21]. Once oversampled, the digital signal can be processed using a digital anti-aliasing filter and then downsampled to the target sampling frequency to acquire x-ray images with appropriately reduced aliasing artifacts [21,22,23]. Ismailova et al. [24] exploit the oversampling approach in radiography imaging to improve the DQE performance and showed an experimental validation. Nano et al. [25] provided theoretical analyses for both direct and indirect detectors based on an ideal LPF [6]. In order to remove the components that have higher frequencies than the target Nyquist frequency, high-order filters with very narrow transition-bands can be employed. However, using such filters may produce the ringing artifacts near high-contrast image edges in practical applications [21]. Here, choosing the filter type is important to efficiently prevent spectrum overlapping while suppressing the Gibbs phenomenon, such as the ringing artifact, due to the band limiting [6,22]. Kim et al. [21] conducted extensively experiments on the Yule-Walker, Butterworth, and Elliptic filters for anti-aliasing purposes [6]. The Yule-Walker filter showed the best performance in both MTF and DQE.
The conventional pixel binning technique in dynamic detectors [1,26,27] has a principle of downsampling with a binning role for anti-aliasing purposes [23]. For pixel binning, the charges of adjacent horizontal and vertical detector elements are merged from an appropriate control on gate scanning and readout integrated circuit (ROIC), and the data transmission rate is reduced due to the reduced image resolution. After acquiring digital images, the field-programmable gate array (FPGA) controller can also implement the pixel binning in the digital domain by averaging those pixels as shown in Figure 1. It is known that the electronic readout noise in digital binning is worse than that of conventional binning [24]. Binning can also be partially conducted both in the analog and digital domains. Binning several pixels in reading the produced charges through the thin-film-transistor (TFT) panel can provide a faster readout speed and a better signal-to-noise ratio (SNR) at the expense of reduced spatial resolution in fluoroscopic imaging [28]. However, because binning produces serious overlaps of the spectrum aliases, NPS [14,15] increases and thus DQE [16], which is inversely proportional to NPS, deteriorates.
In this paper, the performance of pixel binning in digital radiography imaging is analyzed. Pixel binning is considered to reduce the image size by downsampling after moving average (MA) filtering. From this perspective, pixel binning is theoretically analyzed. Monte Carlo simulations for synthetic data are first conducted based on the theoretical model. For general radiography and mammography detectors, extensive experiments on pixel binning are then conducted to show the pixel binning performance in terms of NPS, MTF, and DQE.
This paper is organized in the following way. In Section 2, pixel binning performances are theoretically analyzed in terms of NPS, MTF, and DQE. In Section 3, Monte Carlo simulations based on parametric modeling and measurement results for practical general radiography and mammography detectors are introduced. This paper is concluded in the last section.
2. Detective Quantum Efficiency in Pixel Binning
In this section, directional NPS, MTF, and DQE performances for pixel binning are observed based on theoretical derivations.
2.1. Detective Quantum Efficiency
The independently incident x-ray photons are filtered by a transfer function, which is formed from the scintillator with photodiodes indirectly or the photoconductor with charge collectors directly. The collected charges are scanned through a TFT array by controlling the scan and data lines, and then converted to voltage signals to acquire digital images in charge amplifiers [1].
The discrete-time Fourier transform of the autocovariance function of a weakly stationary sequence is the power spectral density from the Wiener-Khintchen theorem [29]. If the computational burden for the Fourier transform is not dominant, then the Bartlett-Welch method [15,30,31] can be employed to estimate the power spectral density from a mean of the periodograms [32]. In order to evaluate a noise performance of the radiography detector, images are acquired under a uniform exposure and the corresponding power spectral density, which is called NPS, is measured. In the standard of IEC62220-1-1 [17], the directional, horizontal and vertical, NPS values are usually measured to observe the photon and electric noise properties of the digital radiography detector from the Bartlett-Welch method [14,15,33].
Let and denote a detector gain and signal mean, respectively. The directional NPS of f can then be represented as [13]
along the horizontal or vertical direction of the frequency f for , where C is the discrete-time Fourier transform of the detector transfer function with . In (1), is the NPS value at the zero frequency [34,35]. For direct conversion detectors, the NPS value shows an almost constant spectrum over the frequencies. On the other hand, for indirect conversion detectors, the NPS value usually shows a decreasing curve as f increases due to the correlations [15,36]. For indirect conversion detectors, Kim [37] derived a simple image formation model for NPS and introduced a parametric model of C, which is applied to analyzing dual-layer flat-panel detectors [37].
The magnitude frequency response of the system transfer function is called MTF [13]. Let denote a normalized directional MTF of the radiography detector, where . Produced charges are collected at each detector element of the effective pixel pitch , which is less than the pixel pitch for the indirect conversion detector case, where for current detectors. The collection at detector elements can be regarded as moving averaging and thus the MTF, which is the amplitude response for the unit impulse signal, is smaller than or equal to a sinc function as , for . If an ideal anti-aliasing filter can stop the components at which the frequency is higher than the Nyquist frequency , then holds for [16]. However, due to the noise aliasing from the sampling process, we usually have a relationship of . For MTF parametric modeling, Dainty and Shaw [16] introduced various parametric models using Bessel functions. Eyer [38] considered an MTF model with two damping constants for different photographic emulsions. Srinivas et al. [27] considered a Gaussian fitting to describe T. Kim [37] conducted a third-order polynomial fitting in a logarithmic domain.
We now consider the directional DQE value from NPS and MTF. Let denote the number of x-ray photons per square millimeter. Hence, implies an SNR from x-ray photons. For a given radiography detector, the directional DQE value, which is denoted as , can be formulated as [16]
for . In (2), the shape of the DQE spectrum can be described by the ratio , which is less than or equal to 1 due to the noise aliasing. Furthermore, we usually have the relationship from , where the zero-frequency DQE is given by [39,40].
2.2. Moving Average Model for Pixel Binning
We consider an MA model for pixel binning. For the binning, the output sequence is obtained by averaging L inputs as an MA filter. If the correlations of the adjacent pixels are not negative, then the maximum SNR gain is less than or equal to . Here the equality holds when the adjacent pixels are uncorrelated. The direct conversion detectors generally has a better MTF performance than the indirect case and hence shows better SNR gains. Note that the spatial resolution is reduced due to the pixel binning.
For example, the MA filter with has a frequency response of as shown in Figure 2, where other examples of and 6 are also shown. Because the MA filter exhibits typical LPF characteristics, the higher the order of the filter or binning, the more severe the attenuation of high frequency components.
In the L binning scheme, for , we now observe the NPS, MTF, and DQE performances as follows. After applying the MA filter, the directional NPS and MTF are then given as
respectively, for . For the frequency response, the binning MTF is equal to of (4) for even after downsampling. On the other hand, the noise component of the frequency, which is higher than the Nyquist frequency for the L binning case, is overlapped, and thus the binning NPS value, which is denoted as , is given as
for . Note that is greater than or equal to the filtered NPS of (4) due to the noise aliasing.
3. Simulations and Experimental Results
In this section, we introduce simulations and experimental results on the analysis of pixel binning for general and mammography detectors of Table 1, in which the detectors are prototypes being developed by DRTECH Co. LTD. (www.drtech.com) with a gray level resolution of 14 bits/pixel. For a general radiography detector of Detector A, the x-ray tube voltage was 68 kVp with 5 mAs (2.87 Gy) and the RQA 5 condition of IEC62220-1-1 [17]. For the mammography detectors, the x-ray tube voltage was 28 kVp with the RQA conditions of Mo/Rh and W/Rh for Detectors B and C, respectively, in IEC62220-1-2 [41].
We evaluate the pixel binning performances of NPS, MTF, and DQE through simulations using the relationships of (4)-(6) and comparisons with practical experiments. The horizontal normalized NPS (NNPS), MTF, and DQE values from the acquired x-ray images were calculated based on the IEC standards [15,17,41]. For dynamic detectors in fluoroscopic imaging, the lag signals of consequent frames should be considered in measuring true NPS values from using the lag correction factor [42,43,44,45]. In measuring NPS, the influence from the fixed pattern noise should be minimized [46]. To minimize its influence, we can use the subtraction or division method with a compensation constant [14,47]. To obtain a high-precision estimate, we can use maximal number of pairs for the subtraction or division method [33]. In order to measure MTF, edge-spread functions were acquired from edge images [48,49,50]. To avoid edge aliasing, we used a slant-edge phantom of tungsten with an angle of , which is corresponding to oversampling.
In order to obtain the detector transfer function C in (1), we first conducted a parametric modeling for the detector NPS [37]. For the acquired x-ray images from Detector A of Table 1, we measured the directional NPS values and then conducted a Gaussian fitting in a logarithmic domain. Here, we assumed that the shape of C is isotropic in the 2D frequency domain. We could then synthesize white images of f based on the NPS model of (1). Consequent Monte Carlo simulations on filtered images are illustrated in Figure 3(a) compared with theoretical NPS values based on the parametric model. Here, the spectrum of the full image with the Nyquist frequency ( lp/mm) is observed. Simulation results on the L-binning NPS values are also illustrated in Figure 3(a). Here, the maximal frequency from L-binning is decreased to the new Nyquist frequency . If we do not apply any filters before downsampling, then the overlap of the noise aliases severely increase the directional NPS value as "Downsampling" in Figure 3(a), where the lower bound is given as , for . When the MA filter is applied, NPS is given by in (4), where , and decreases ("MA"). The pixel binning with MA applied and then downsampled is given as in (5) and slightly increases the NPS value compared to the MA case ("Binning (MA+downsampling)"), however it is smaller than the NPS of the original image ("Full image"). Note that the MA filter in pixel binning acts as an anti-aliasing filter for downsampling.
We next conducted a parametric modeling for the detector MTF [37]. To measure the MTF of Detector A, slant-edge images were acquired under an appropriate incident exposure based on the IEC standard [17]. For the measured MTF, we performed a 3rd-order polynomial fitting to obtain T. Using the edge angle and T, we can synthesize slant-edge images, which can be used to simulate MA filtering and downsampling for pixel binning. The simulation results on MTF are illustrated in Figure 3(b). We can observe that the simulation results faithfully follow the theoretical value of in (4). The MTF values also decrease after applying the MA filter.
From of (6) using the NPS and MTF values, the DQE values were calculated and illustrated in Figure 4. The directional DQE values without the MA filter were quite low compared to the full image case as "Downsampling" in Figure 4. The pixel binning with MA filtering and then downsampling shows DQE values, which are close to the full image case for relatively low frequencies. Various anti-aliasing filters, such as Yule-Walker and Butterworth filters, can be used to improve DQE performance instead of MA filters with pixel binning [21].
Experimental results for mammography detectors, Detectors B and C, are shown in Figure 5 and Figure 6, respectively. The resultant NNPS and DQE values of Detector B are illustrated in Figure 5. In Figure 5(a), measured NNPS values are illustrated. Because Detector B is an indirect conversion type as Detector A, the NNPS shapes are similar to those of Detector A of Figure 3(a). Hence, as observed in Figure 5(b), the DQE performance of Detector B is also similar to that of Detector A of Figure 4. The resultant NNPS and DQE values of Detector C are illustrated in Figure 6. In Figure 6(a), measured NNPS values are illustrated. Because detector C is a direct conversion type, the NNPS shape is nearly constant and shows high noise aliasing for the downsampling case ("Downsampling"). Furthermore, the pixel binning shows NNPS values, which are close to those of the full image. Note that indirect conversion detectors usually show lower NNPS values than those of the full image as shown in Figure 3(a). As shown in Figure 6(b), this worse noise property of Detector C yields a relatively low DQE performance compared to the indirect conversion case.
4. Conclusions
Pixel binning of digital radiography images is performed by merging charges generated from x-ray photons or averaging digital pixel values, and this process is analyzed in this paper based on MA filtering and downsampling of digital images. The NPS, MTF, and DQE performances of pixel binning were theoretically derived and analyzed, and the performances were numerically compared through parametric modeling and Monte Carlo simulation. The performances of pixel binning were also experimentally compared using x-ray images actually acquired from general radiography and mammography detectors. MA filtering acts as anti-aliasing filtering to mitigate noise aliasing artifacts, however has poor anti-aliasing performance. Therefore, the binning DQE is worse than the full image DQE. Especially in the case of the direct conversion detector, pixel binning does not play an effective anti-aliasing role due to severe aliasing of noise. Rather than simply averaging pixel values in pixel binning, it is necessary to use a more efficient anti-aliasing filter to make the DQE value closer to that of the full image [21].
Author Contributions
D.S.K formulated the issues in binning pixel in digital radiography flat-panel detectors, performed theoretical derivations, and organized the manuscript.
Funding
This work was supported by the National Research Foundation of Korea (NRF) grants funded by the Korean government (MISP) (No. RS-2024-00459219) and by the Hankuk University of Foreign Studies Research Fund of 2024.
Conflicts of Interest
The authors declare no conflict of interest.
Abbreviations
| DQE | Detective quantum efficiency |
| LPF | low-pass filter |
| MTF | Modulation transfer function |
| NNPS | Normalized noise power spectrum |
| NPS | Noise power spectrum |
| ROIC | readout integrated circuit |
| SNR | signal-to-noise ratio |
| TFT | Thin-film-transistor |
| C | Detector transfer function |
| Sampling frequency (lp/mm) | |
| P | NPS |
| L-binning NPS | |
| Q | DQE |
| L-binning DQE | |
| T | MTF |
| x, y | Weakly stationary sequences |
| x-ray photons per square meters | |
| Detector gain | |
| Mean of y |
References
- Bushberg, J.T.; Seibert, J.A.; E. M. Leidholdt, J.; Boone, J.M. The Enssential Physics of Medical Imaging, 2nd. ed.; Lippincott Williams & Wilkins: Philadelphia, 2002.
- Tanaka, R. Dynamic chest radiography: flat-panel detector (FPD) based functional X-ray imaging. Radiol. Phys. Technol. 2016, 9, 139–153. [Google Scholar] [CrossRef] [PubMed]
- Hata, A.; Yamada, Y.; Tanaka, R.; Nishino, M.; Hida, T.; Hino, T.; Ueyama, M.; Yanagawa, M.; Kamitani, T.; Kurosaki, A.; Sanada, S.; Jinzaki, M.; Ishigami, K.; Tomiyama, N.; Honda, H.; Kudoh, S.; Hatabu, H. Dynamic chest x-ray using a flat-panel detector system: technique and applications. Korean Jour. Radiology 2020, 22. [Google Scholar] [CrossRef]
- Fyles, F.; Fitzmaurice, T.; Robinson, R.; Bedi, R.; Burhan, H.; Walshaw, M. Dynamic chest radiography: a state-of-the-art review. Insights into imaging 2023, 14, 107. [Google Scholar] [CrossRef] [PubMed]
- Gonzalez, R.C.; Woods, R.E. Digital Image Processing, 3rd ed.; Prentice Hall: NY, 2008. [Google Scholar]
- Oppenheim, A.V.; Schafer, R.W. Discrete-Time Signal Processing, 3rd. ed.; Pearson Education: NJ, 2010. [Google Scholar]
- Dowski, E.R.; Cathey, W.T. Modern wavefront-based optical anti-aliasing filter. International Optical Design Conference. Optica Publishing Group, 1998, p. LFB.4. [CrossRef]
- Zhao, T.; Wang, R.; Liu, Y.; Yu, F. Characteristic-analysis of optical low pass filter used in digital camera. ICO20: Optical Design and Fabrication. SPIE, 2006, Vol. 6034, p. 60340N. [CrossRef]
- Lee, D.L.; Cheung, L.K.; Jeromin, L.S. A new digital detector for projection radiography. SPIE, 1995, Vol. 2432, pp. 237–249. [CrossRef]
- Samei, E.; Flynn, M.J. An experimental comparison of detector performance for direct and indirect digital radiography systems. Med. Phys. 2003, 30, 608–622. [Google Scholar] [CrossRef] [PubMed]
- Andrews, H.C.; Hunt, B.R. Digital Image Restoration; Prentice-Hall: NY, 1977. [Google Scholar]
- Jenkins, G.M.; Watts, D.G. Spectral Analysis and Its Applications; Holden-Day: San Francisco, 1969. [Google Scholar]
- Papoulis, A. Probability, Random Variables, and Stochastic Processes, 3rd ed.; McGraw Hill: NY, 1991. [Google Scholar]
- Kim, D.S. Noise power spectrum measurements in digital imaging with gain nonuniformity correction. IEEE Trans. Image Process. 2016, 25, 3712–3722. [Google Scholar] [CrossRef]
- Kim, D.S. Measurements of the noise power spectrum for digital x-ray imaging devices. Phys. Med. Biol. 2024, 69, 03TR01. [Google Scholar] [CrossRef]
- Dainty, J.C.; Shaw, R. Image Science: Principles, Analysis and Evaluation of Photographic-Type Imaging Processes; Academic Press: NY, 1974. [Google Scholar]
- IEC 62220-1-1; Medical Electrical Equipment Characteristics of digital X-ray imaging devices-Part1-1: Determination of the Detective Quantum Efficiency Detectors used in Radiographic Imaging. International Electrotechnical Commission Report: Geneva, Switzerland, 2015.
- Zhao, W.; Ristic, G.; Rowlands, J.A. X-ray imaging performance of structured cesium iodide scintillators. Med. Phys. 2004, 31, 2594–2605. [Google Scholar] [CrossRef]
- Romdhane, M.S.B.; Madisetti, V.K. All-digital oversampled front-end sensors. IEEE Signal Process. Lett. 1996, 3, 38–39. [Google Scholar] [CrossRef]
- Stewart, R.W. Digital signal processing: technology and marketing for audio systems. IEE Colloquium on Digital Audio Signal Processing, 1992, pp. 15/1 – 5/6.
- Kim, D.S.; Kim, E.; Lee, E.; Shin, C.W. 2×2 oversampling in digital radiography imaging for CsI-based scintillator detectors. SPIE, 2017, Vol. 10132, pp. 101323X–1–8. [CrossRef]
- Saramaki, T.; Estola, K.P. Design of linear-phase partly digital anti-aliasing filters. IEEE Int. Conf. Acoustics, Speech, and Signal Processing,, 1985, pp. 65–68. [CrossRef]
- Kim, D.S.; Kim, E.; Shin, C.W. Oversampling digital radiography imaging based on the 2×2 moving average filter for mammography detectors. SPIE, 2018, Vol. 10573, pp. 1057362–1–10. [CrossRef]
- Ismailova, E.; Karim, K.; Cunningham, I.A. Apodized-Aperture Pixel Design to Increase High-Frequency DQE and Reduce Noise Aliasing in X-Ray Detectors. SPIE, 2015, Vol. 9412, pp. 94120D1–8. [CrossRef]
- Nano, T.; Esartin, T.; Karim, K.S.; Cunningham, I.A. A novel x-ray detector design with higher DQE and reduced aliasing: Theoretical analysis of x-ray reabsoprtion in detector converter material. SPIE, 2016, Vol. 9783, pp. 978318–1–10. [CrossRef]
- Colbeth, R.E.; Allen, M.J.; Day, D.J.; Gilblom, D.L.; Harris, R.A.; Job, I.D.; Klausmeier-Brown, M.E.; Pavkovich, J.M.; Seppi, E.J.; Shapiro, E.G.; Wright, M.D.; Yu, J.M. Flat-panel imaging system for fluoroscopy applications. Medical Imaging 1998: Physics of Medical Imaging. SPIE, 1998, Vol. 3336, pp. 376 – 387. [CrossRef]
- Srinivas, Y.; Wilson, D.L. Quantitative image quality evaluation of pixel-binning in a flat-panel detector for x-ray fluoroscopy. Medical Physics 2004, 31, 131–141. [Google Scholar] [CrossRef]
- Srinivas, Y.; Wilson, D. Image quality evaluation of flat panel detector binning in x-ray fluoroscopy. IEEE Int. Symp. Biomedical Imag., 2002, pp. 177–180. [CrossRef]
- Proakis, J.G.; Manolakis, D. Digital Signal Processing, 4th ed.; Prentice Hall: NY, 2007. [Google Scholar]
- Bartlett, M.S. Periodogram analysis and continuous spectra. Biometrika 1950, 37, 1–16. [Google Scholar] [CrossRef]
- Welch, P.D. The use of fast Fourier transform for the estimation of power spectra: a method based on time averaging over short, modified periodograms. IEEE Trans. Audio Electroacoustics 1967, 15, 70–73. [Google Scholar] [CrossRef]
- Thomson, D.J. Spectrum estimation and harmonic analysis. IEEE Proc. 1982, 70, 1055–1096. [Google Scholar] [CrossRef]
- Kim, D.S. High precision noise power spectrum measurements in digital radiography imaging. Med. Phys. 2018, 45, 5461–5471. [Google Scholar] [CrossRef]
- Kim, D.S.; Lee, E. Estimation of zero-frequency noise power density in digital imaging. IEEE Signal Process. Lett. 2018, 25, 1755–1759. [Google Scholar] [CrossRef]
- Kim, D.S. Measurement of power density at zero frequency with a trend compensation. IEEE Trans. Signal Process. 2020, 68, 1964–1973. [Google Scholar] [CrossRef]
- Dobbins III, J.T.; Samei, E.; Ranger, N.T.; Chen, Y. Intercomparison of methods for image quality characterization. II. Noise power spectrum. Med. Phys. 2006, 33, 1466–1475. [Google Scholar] [CrossRef]
- Kim, D.S. Convex combination of images from dual-layer detectors for high detective quantum efficiencies. IEEE Trans. Biomed. Eng. 2023, 70, 1804–1814. [Google Scholar] [CrossRef]
- Eyer, J.A. Spatial frequency response of certain photographic emulsions. J. Opt. Soc. Am. 1958, 48, 938–944. [Google Scholar] [CrossRef]
- Giakos, G.C.; Suryanarayanan, S.; Guntupalli, R.; Odogba, J.; Shah, N.; Vedantham, S.; Chowdhury, S.; Mehta, K.; Sumrain, S.; Patnekar, N.; Moholkar, A.; Kumar, V.; Endorf, R.E. Detective quantum efficiency DQE(0) of CZT semiconductor detectors for digital radiography. IEEE Trans. Instr. Measurement 2004, 53, 1479–1484. [Google Scholar] [CrossRef]
- McDonald, M.C.; Kim, H.K.; Henry, J.H.; Cunningham, I.A. A novel method to measure the zero-frequency DQE of a non-linear imaging system. SPIE, 2011, Vol. 7961, pp. 79610C–1–7. [CrossRef]
- IEC 62220-1-2; Medical Electrical Equipment Characteristics of Digital X-ray Imaging Devices-Part1-2: Determination of the Detective Quantum Efficiency Detectors Used in Mammography. International Electrotechnical Commission Report: Geneva, Switzerland, 2007.
- IEC 62220-1-3; Medical Electrical Equipment Characteristics of Digital X-ray Imaging Devices-Part1-3: Determination of the Detective Quantum Efficiency Detectors used in Dynamic Imaging. International Electrotechnical Commission Report: Geneva, Switzerland, 2007.
- Kim, D.S.; Lee, E. Signal lag measurements based on temporal correlations. IEEE Signal Process. Lett. 2021, 28, 21–25. [Google Scholar] [CrossRef]
- Kim, D.S.; Lee, E. Measurement of the lag correction factor in low-dose fluoroscopic imaging. IEEE Trans. Med. Imag. 2021, 40, 1661–1672. [Google Scholar] [CrossRef] [PubMed]
- Lee, E.; Kim, D.S. Linear lag models and measurements of the lag correction factors. IEEE Access 2022, 10, 49101–49113. [Google Scholar] [CrossRef]
- Kim, D.S.; Kim, E. Noise power spectrum of the fixed pattern noise in the digital radiography detectors. Med. Phys. 2016, 43, 2765–2773. [Google Scholar] [CrossRef]
- Williams, M.B.; Mangiafico, P.A.; Simoni, P.U. Noise power spectra of images from digital mammography detectors. Med. Phys. 1999, 26, 1279–1293. [Google Scholar] [CrossRef]
- Fujita, H.; Tsai, D.Y.; Itoh, T.; Doi, K.; Morishita, J.; Ueda, K.; Ohtsuka, A. A simple method for determining the modulation transfer function in digital radiography. IEEE Trans. Med. Imag. 1992, 11, 34–39. [Google Scholar] [CrossRef]
- Kawashita, I.; Maeda, K.; Arimura, H.; Morikawa, K.; Ishida, T. Development of an automated method for evaluation of sharpness of digital radiographs using edge method. SPIE, 2001, Vol. 4320, pp. 331 – 338. [CrossRef]
- Buhr, E.; Gunther-Kohfahl, S.; Neitzel, U. Simple method for modulation transfer function determination of digital imaging detectors from edge images. SPIE, 2003, Vol. 5030, pp. 877–884. [CrossRef]
Figure 1.
Dynamic digital radiography imaging with pixel binning. (a) Block diagram of pixel binning. The readout integrated circuit (ROIC) produces digital images. Pixel binning can be performed in the analog or digital domain controlled by a field-programmable gate array (FPGA). (b) Example of pixel binning in a flat-panel detector.
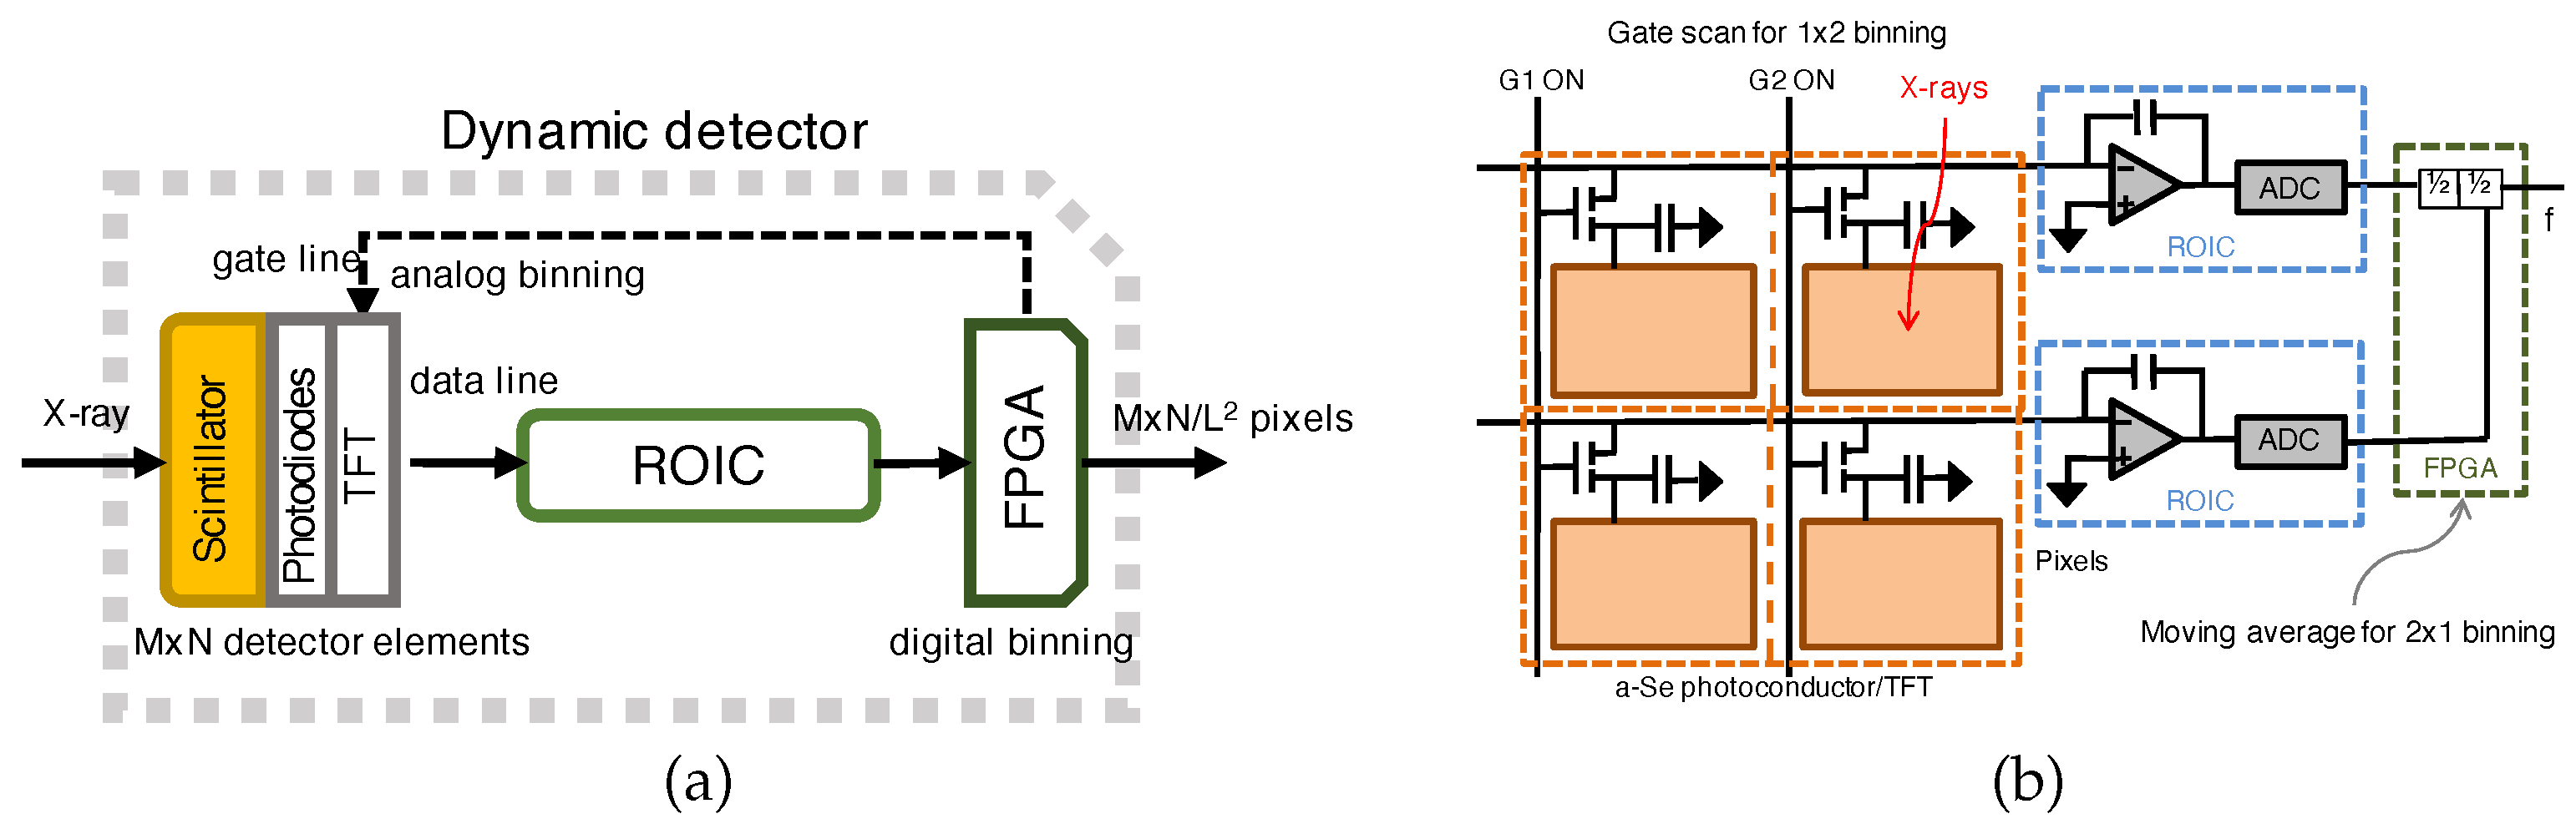
Figure 2.
Dirichlet kernel : amplitude response of the MA filter with length L.
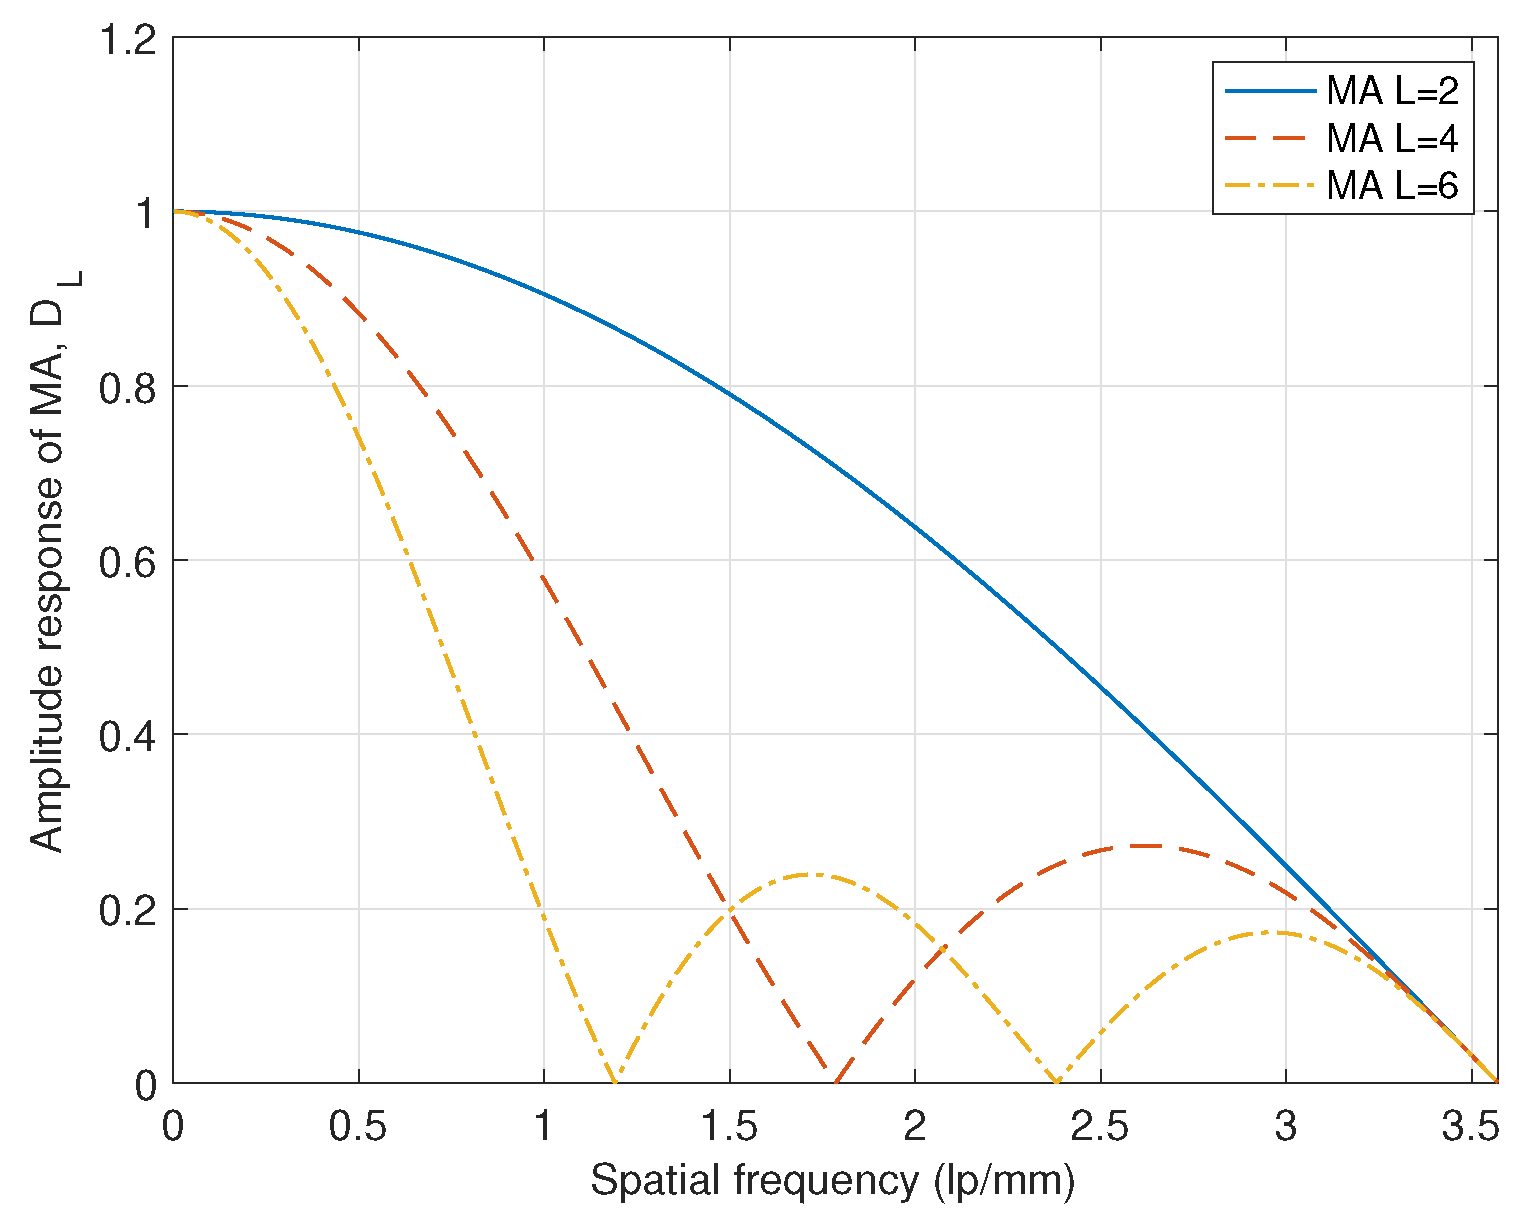
Figure 3.
Theoretical NPS and MTF with Monte Carlo simulations for pixel binning, where a theoretical model was derived for Detector A. (a) NNPS. The pixel binning with MA applied and then downsampled is given as in (5) and slightly increases the NPS value compared to the MA case. (b) MTF. Theoretical MTF of downsampling is equal to that of the full image. The MTF of pixel binning is equal to for in (4) and is reduced due to of MA.
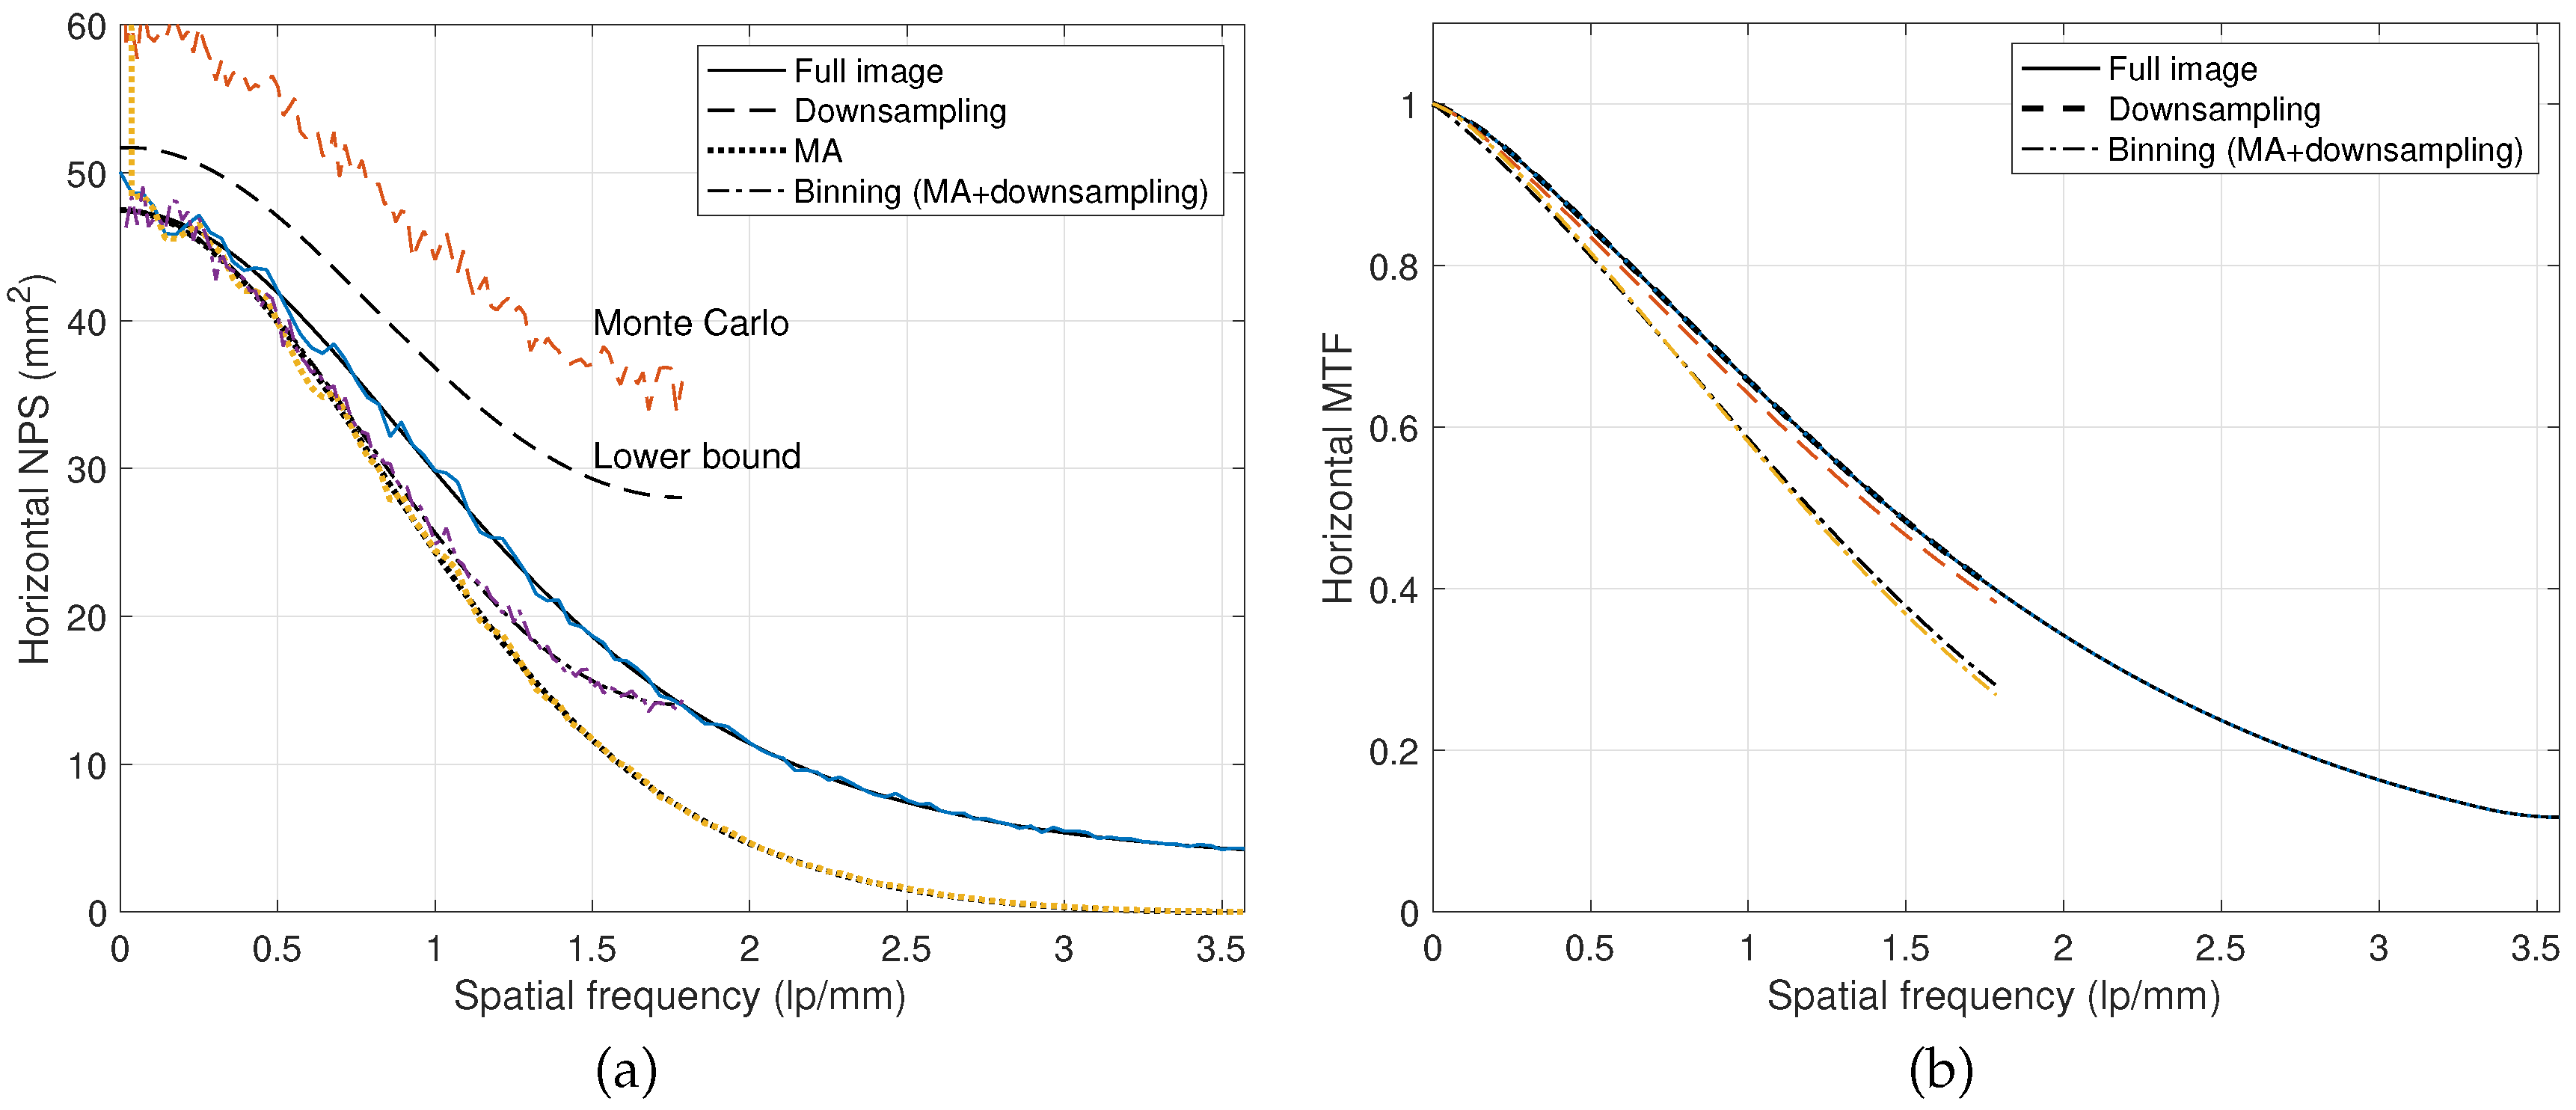
Figure 4.
Theoretical DQE and Monte Carlo simulations for pixel binning from Figure 3 for Detector A. The pixel binning DQE is given as of (6).
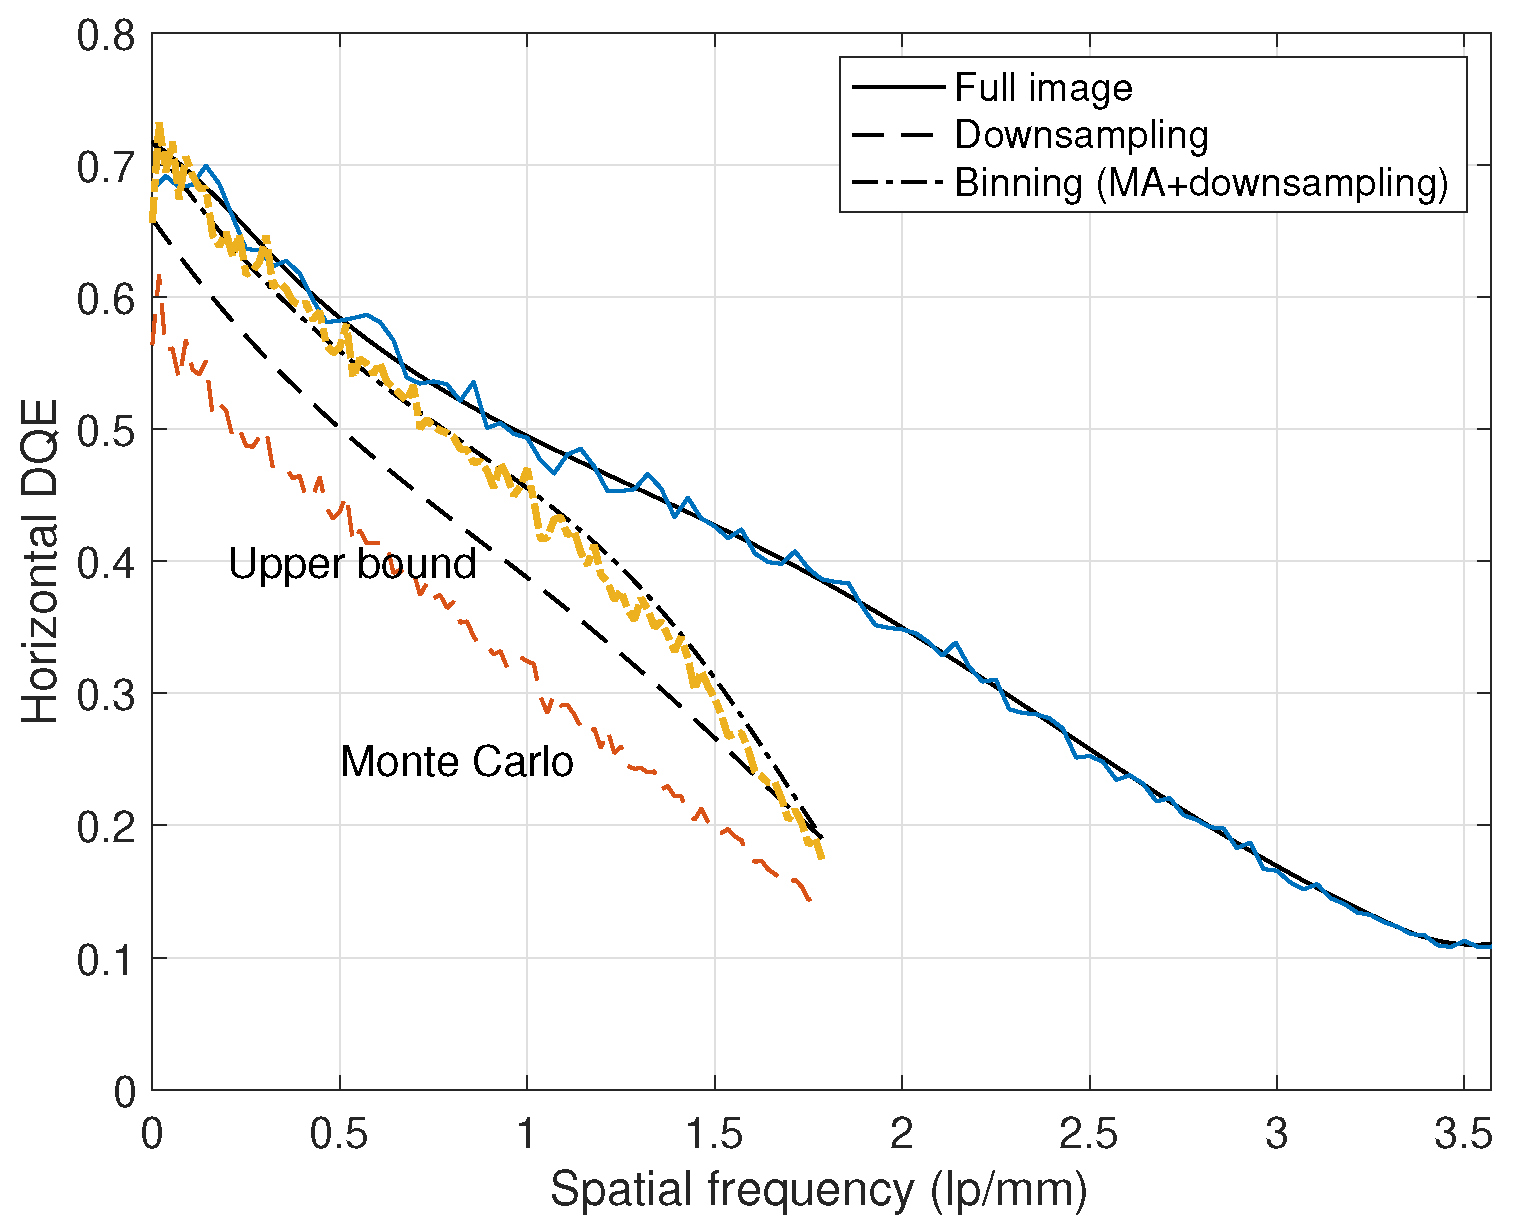
Figure 5.
Performance of pixel binning for Detector B in Table 1 under the RQA Mo/Rh condition at 160 Gy. (a) NNPS. (b) DQE.
Figure 5.
Performance of pixel binning for Detector B in Table 1 under the RQA Mo/Rh condition at 160 Gy. (a) NNPS. (b) DQE.
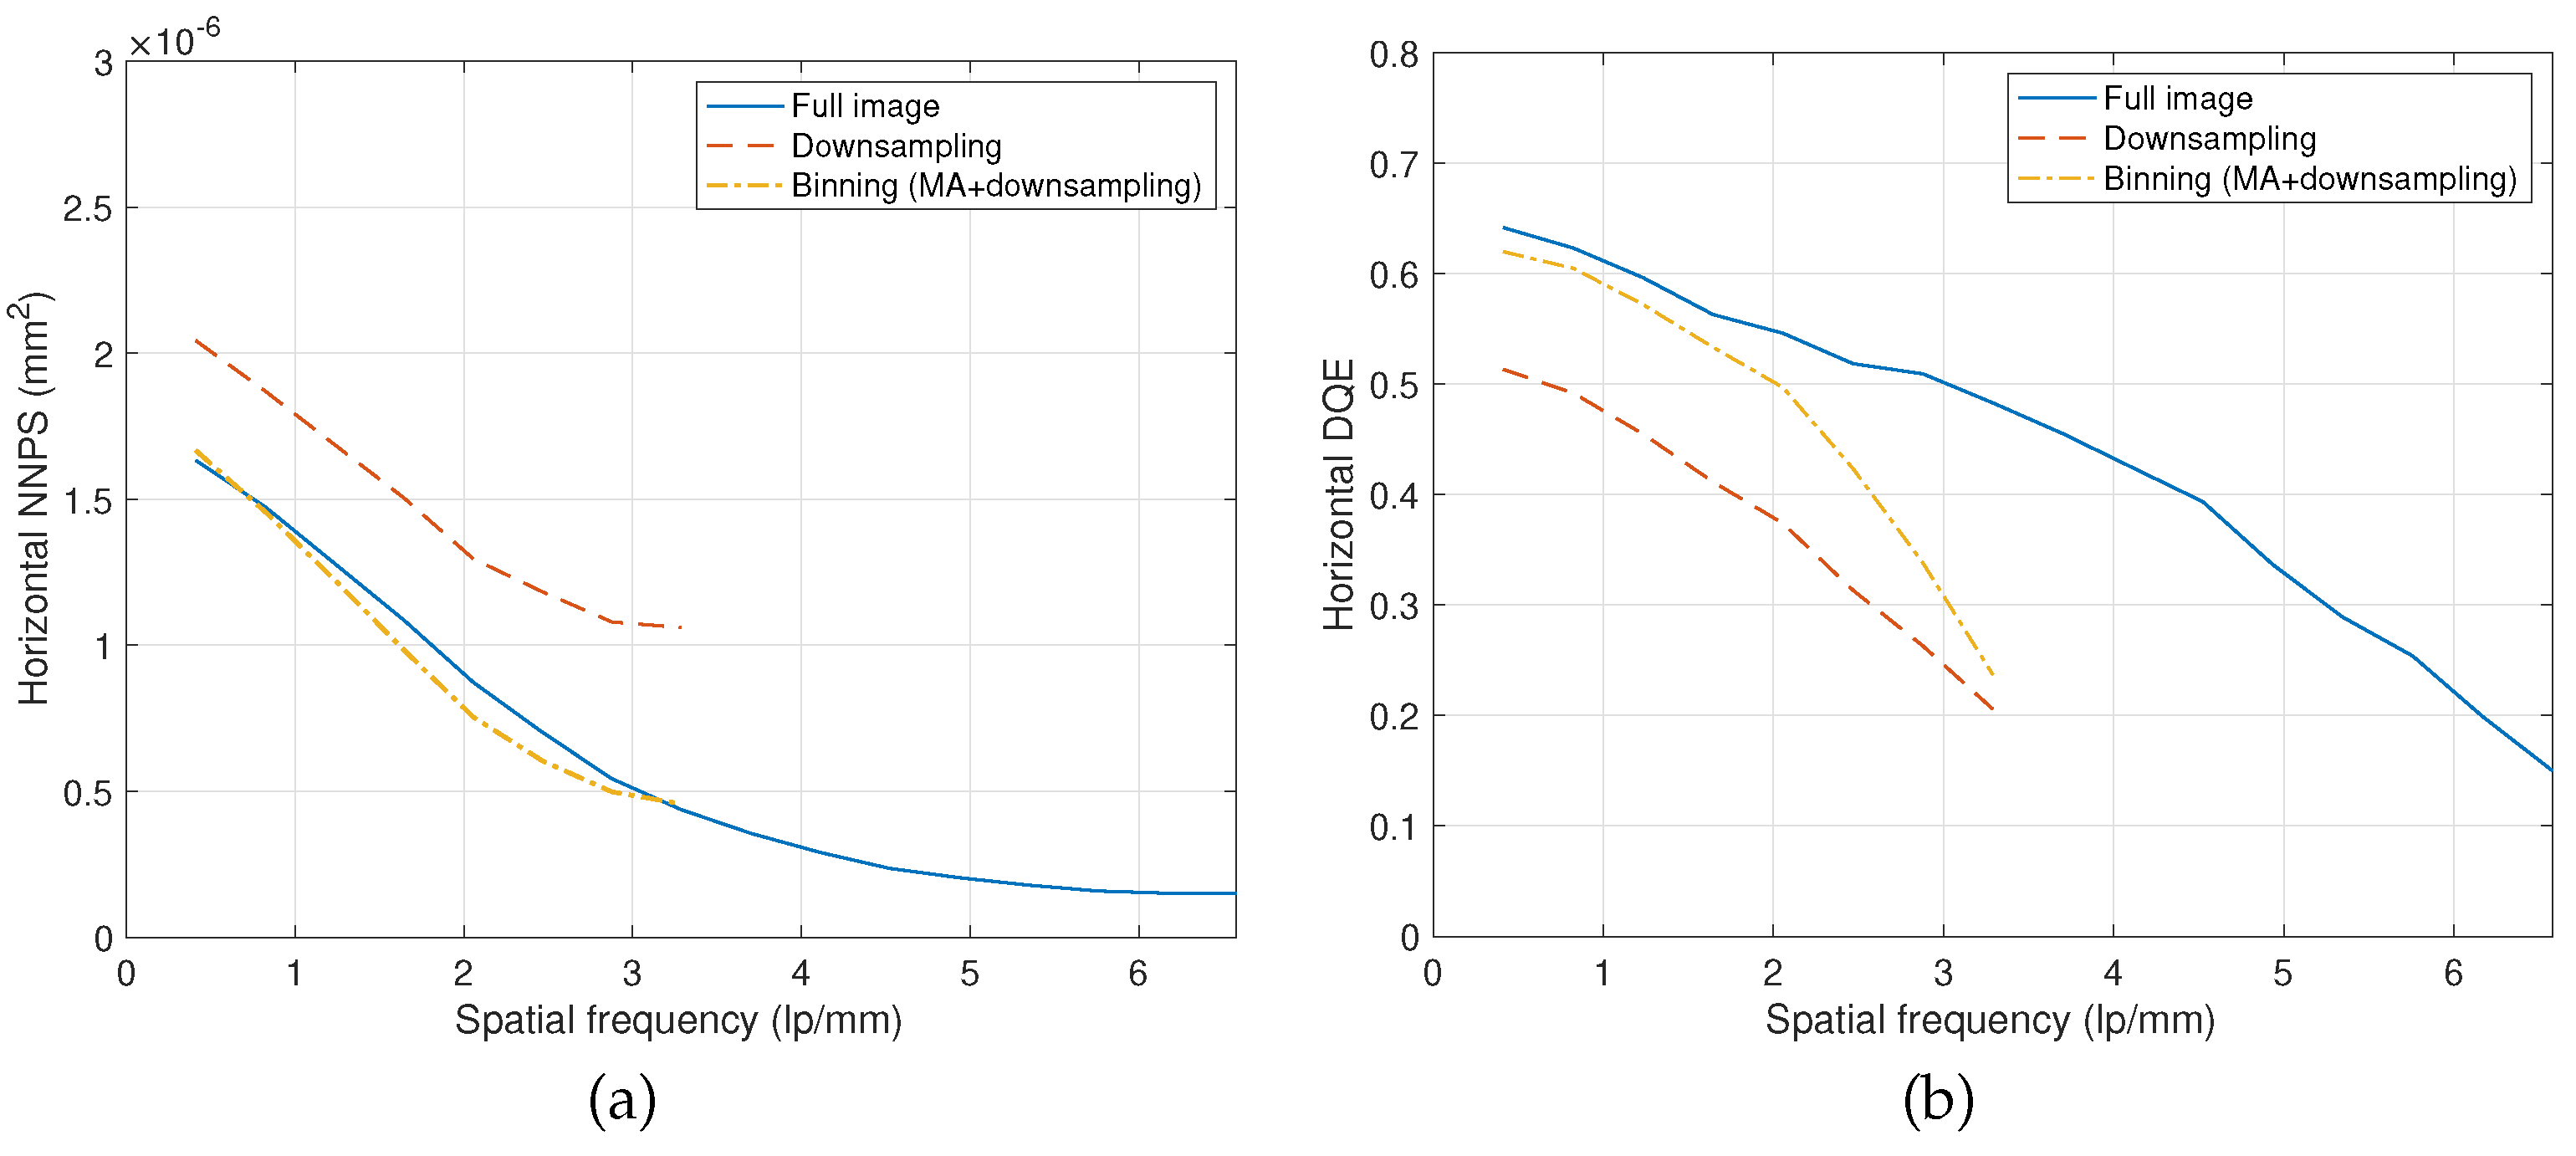
Figure 6.
Performance of pixel binning for Detector C in Table 1 under the RQA W/Rh condition at an incident exposure of 140 Gy. (a) NNPS. (b) DQE.
Figure 6.
Performance of pixel binning for Detector C in Table 1 under the RQA W/Rh condition at an incident exposure of 140 Gy. (a) NNPS. (b) DQE.
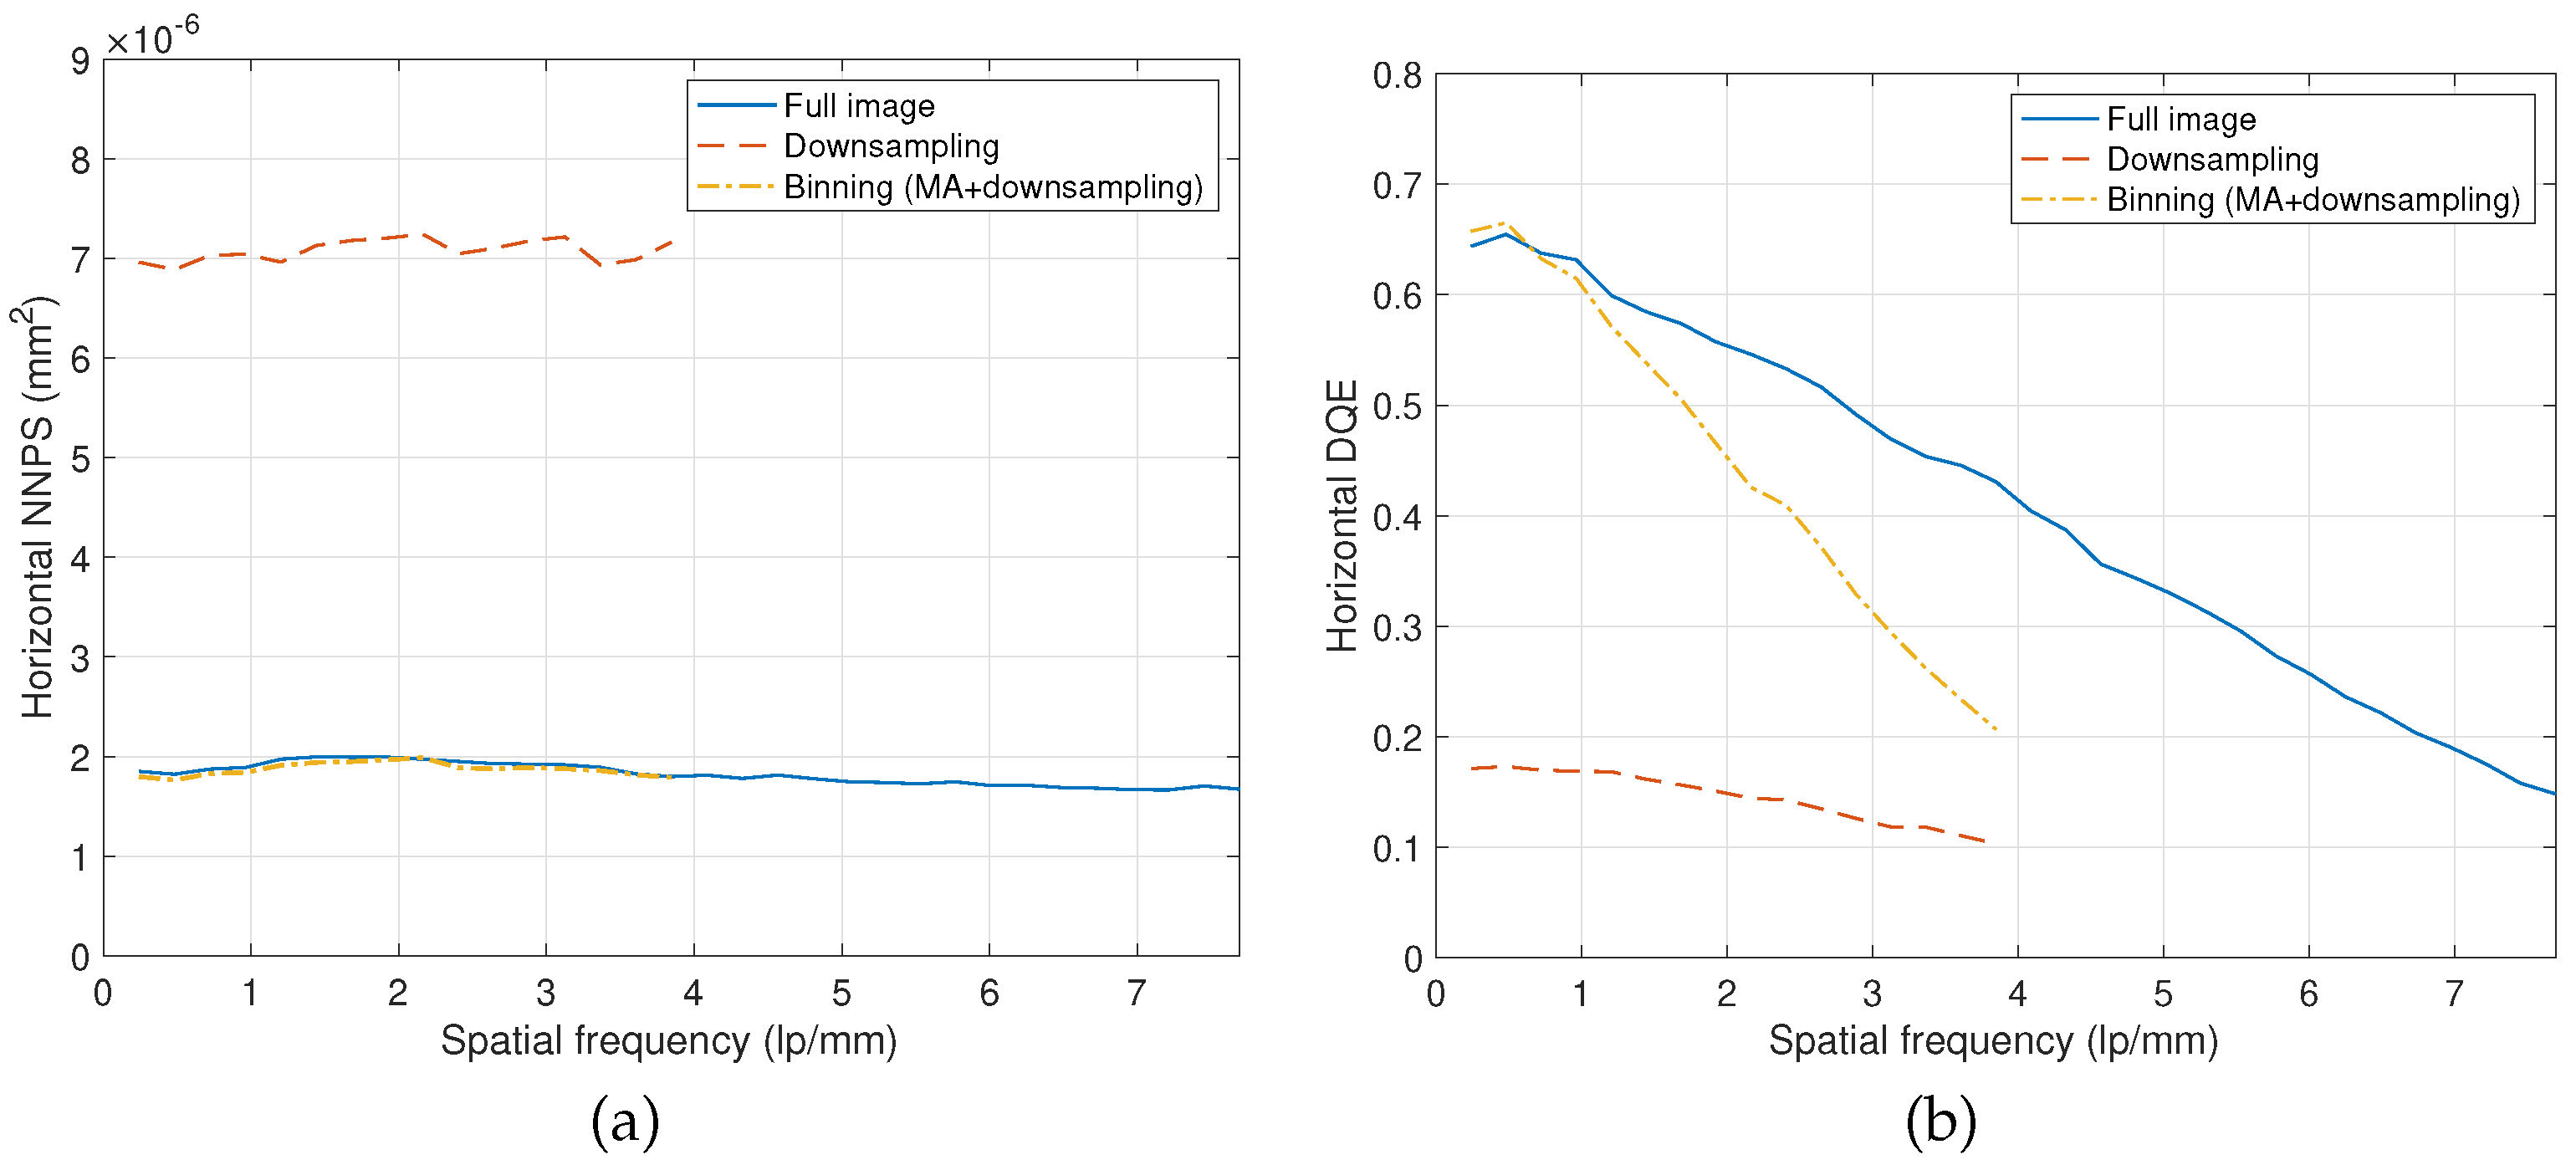

Table 1.
Development prototypes of detectors (DRTECH Co. Ltd.)
| Conversion | Scintillator | Pixel pitch | Image size | X-ray | |
|---|---|---|---|---|---|
| Detector | type | or photoconductor | (m) | (pixels) | condition |
| A | Indirect | CsI:Tl (500 m) | 140 | RQA 5 | |
| B | Indirect | CsI:Tl (160 m) | 76 | RQA Mo/Rh | |
| C | Direct | a-Se (380 m) | 65 | RQA W/Rh |
Disclaimer/Publisher’s Note: The statements, opinions and data contained in all publications are solely those of the individual author(s) and contributor(s) and not of MDPI and/or the editor(s). MDPI and/or the editor(s) disclaim responsibility for any injury to people or property resulting from any ideas, methods, instructions or products referred to in the content. |
© 2024 by the author. Licensee MDPI, Basel, Switzerland. This article is an open access article distributed under the terms and conditions of the Creative Commons Attribution (CC BY) license (https://creativecommons.org/licenses/by/4.0/).
Copyright: This open access article is published under a Creative Commons CC BY 4.0 license, which permit the free download, distribution, and reuse, provided that the author and preprint are cited in any reuse.


