Preprint
Article

This version is not peer-reviewed.

Will Dissolved Hydrogen Reveal the Instability of the Anaerobic Digestion Process?

A peer-reviewed article of this preprint also exists.

Submitted:

11 November 2024

Posted:

12 November 2024

You are already at the latest version

Abstract

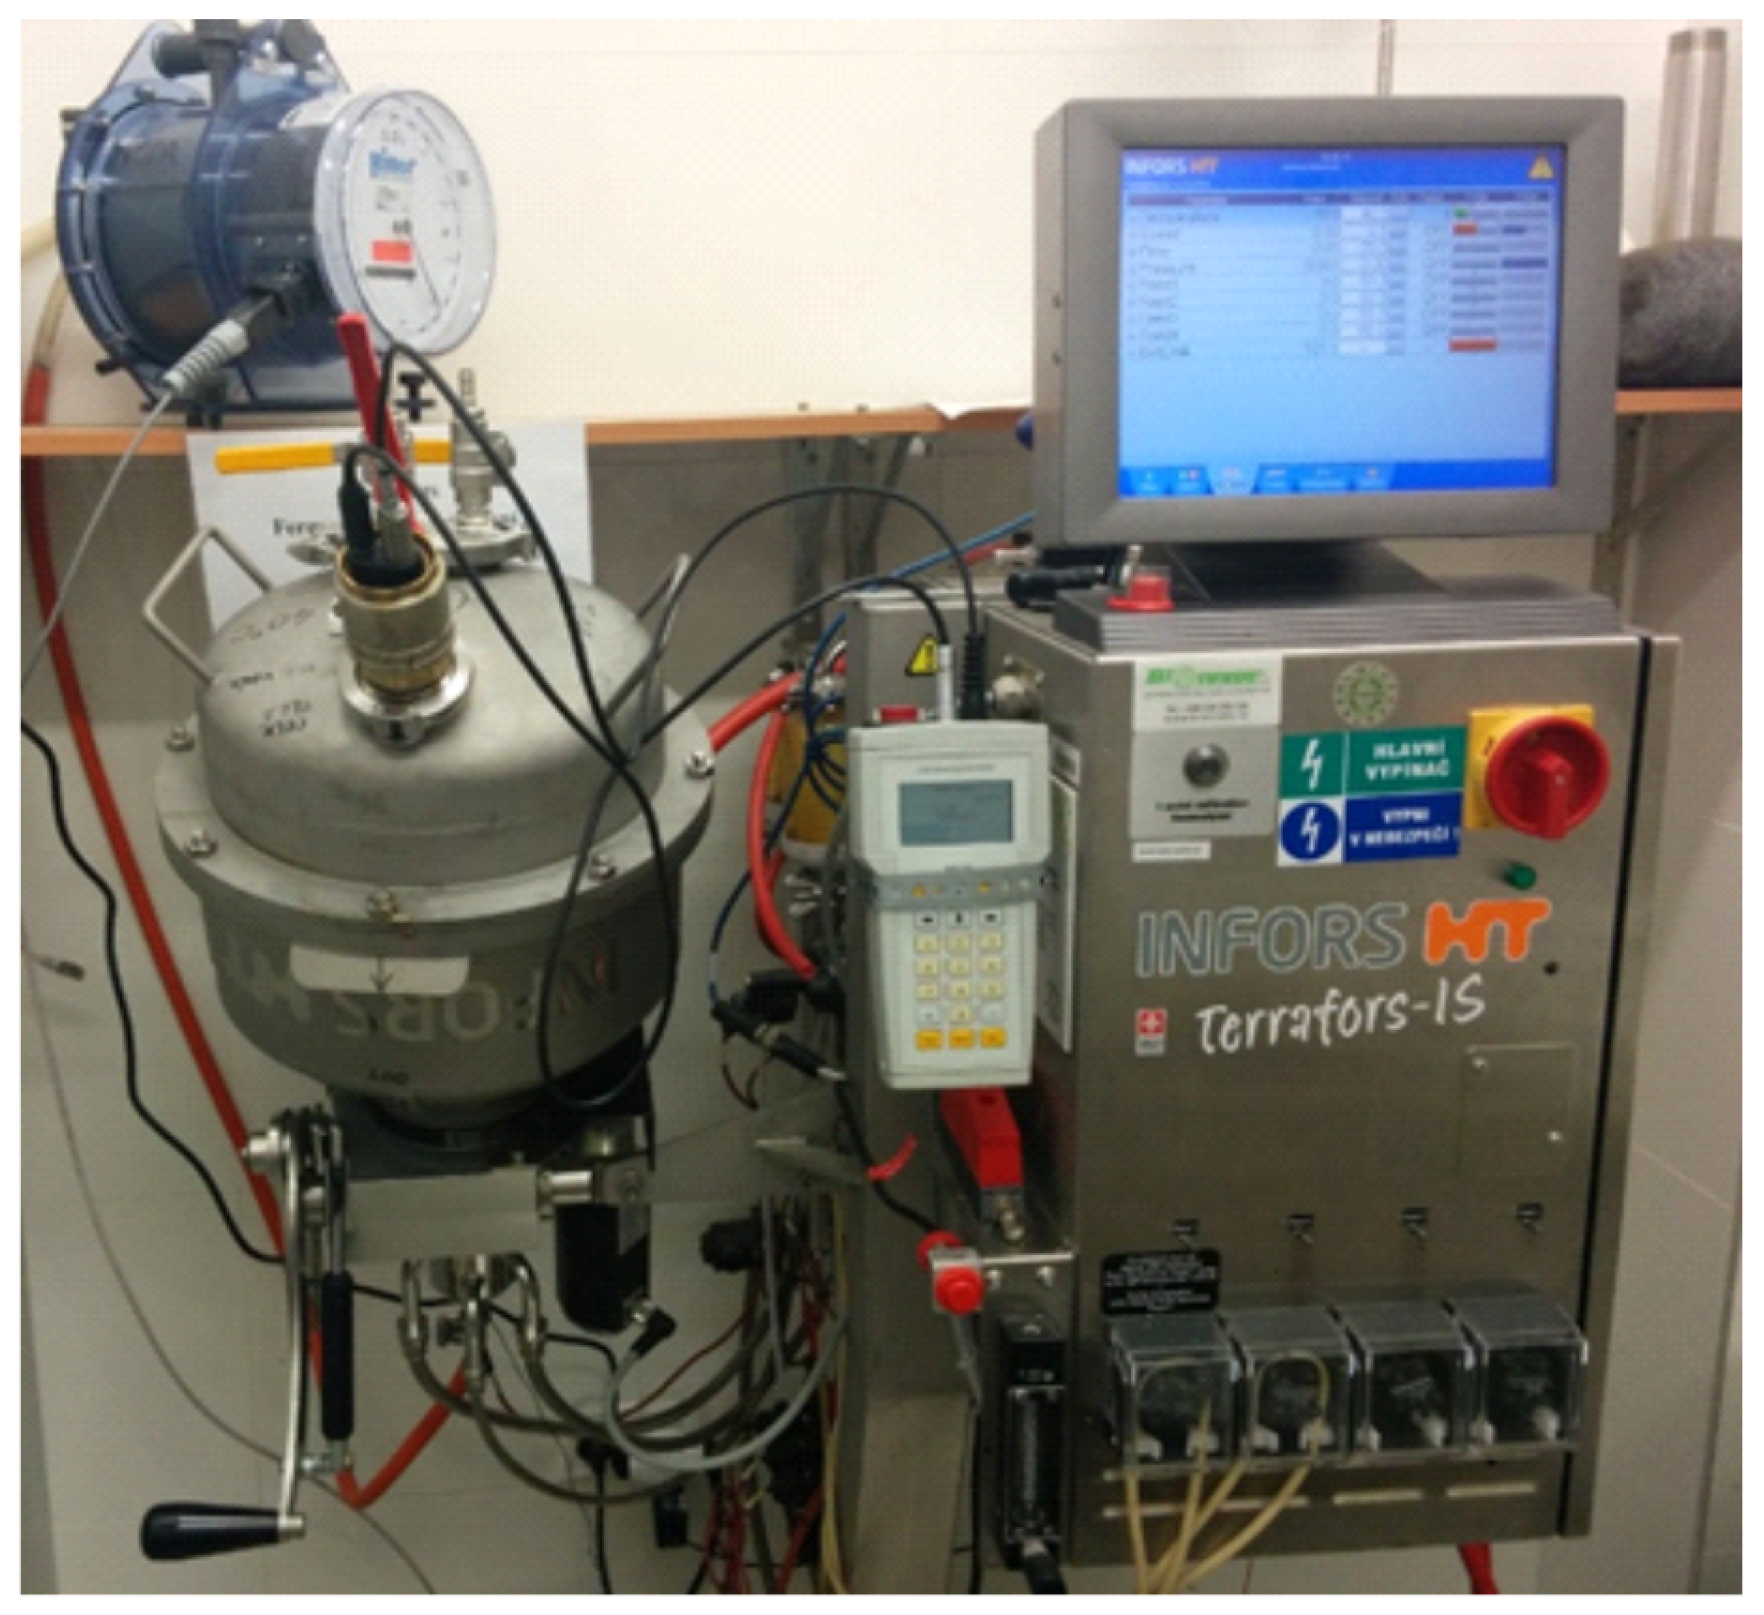
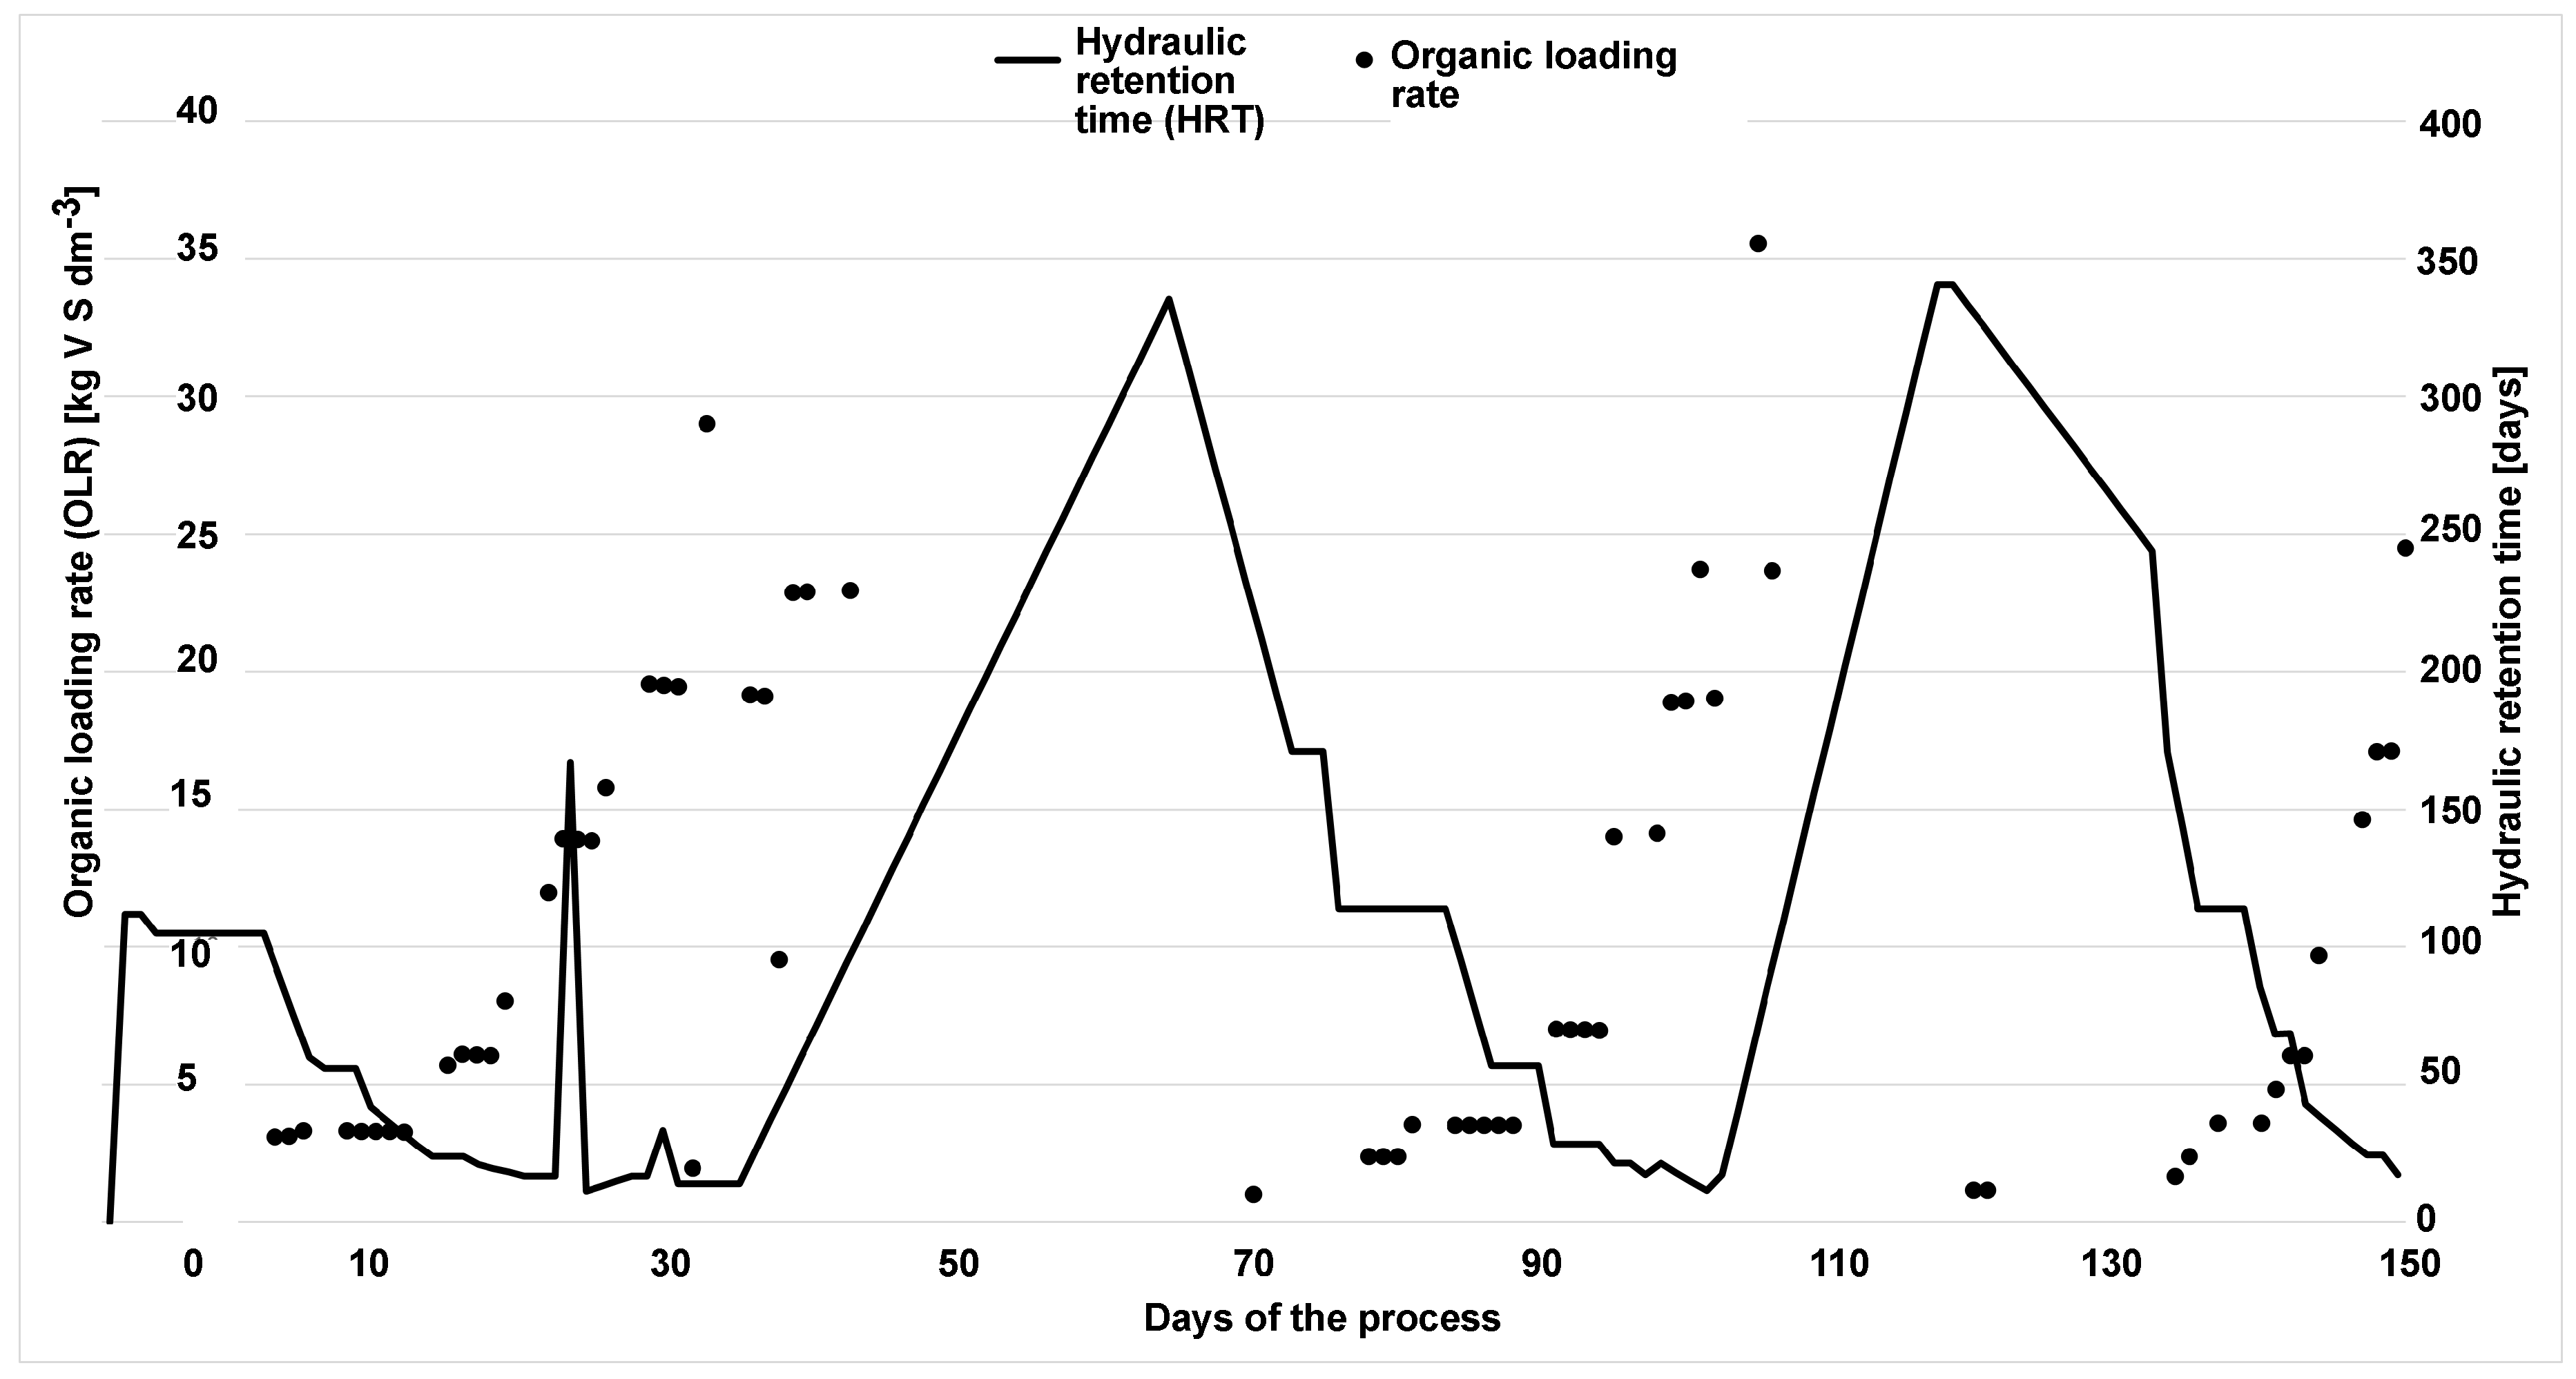
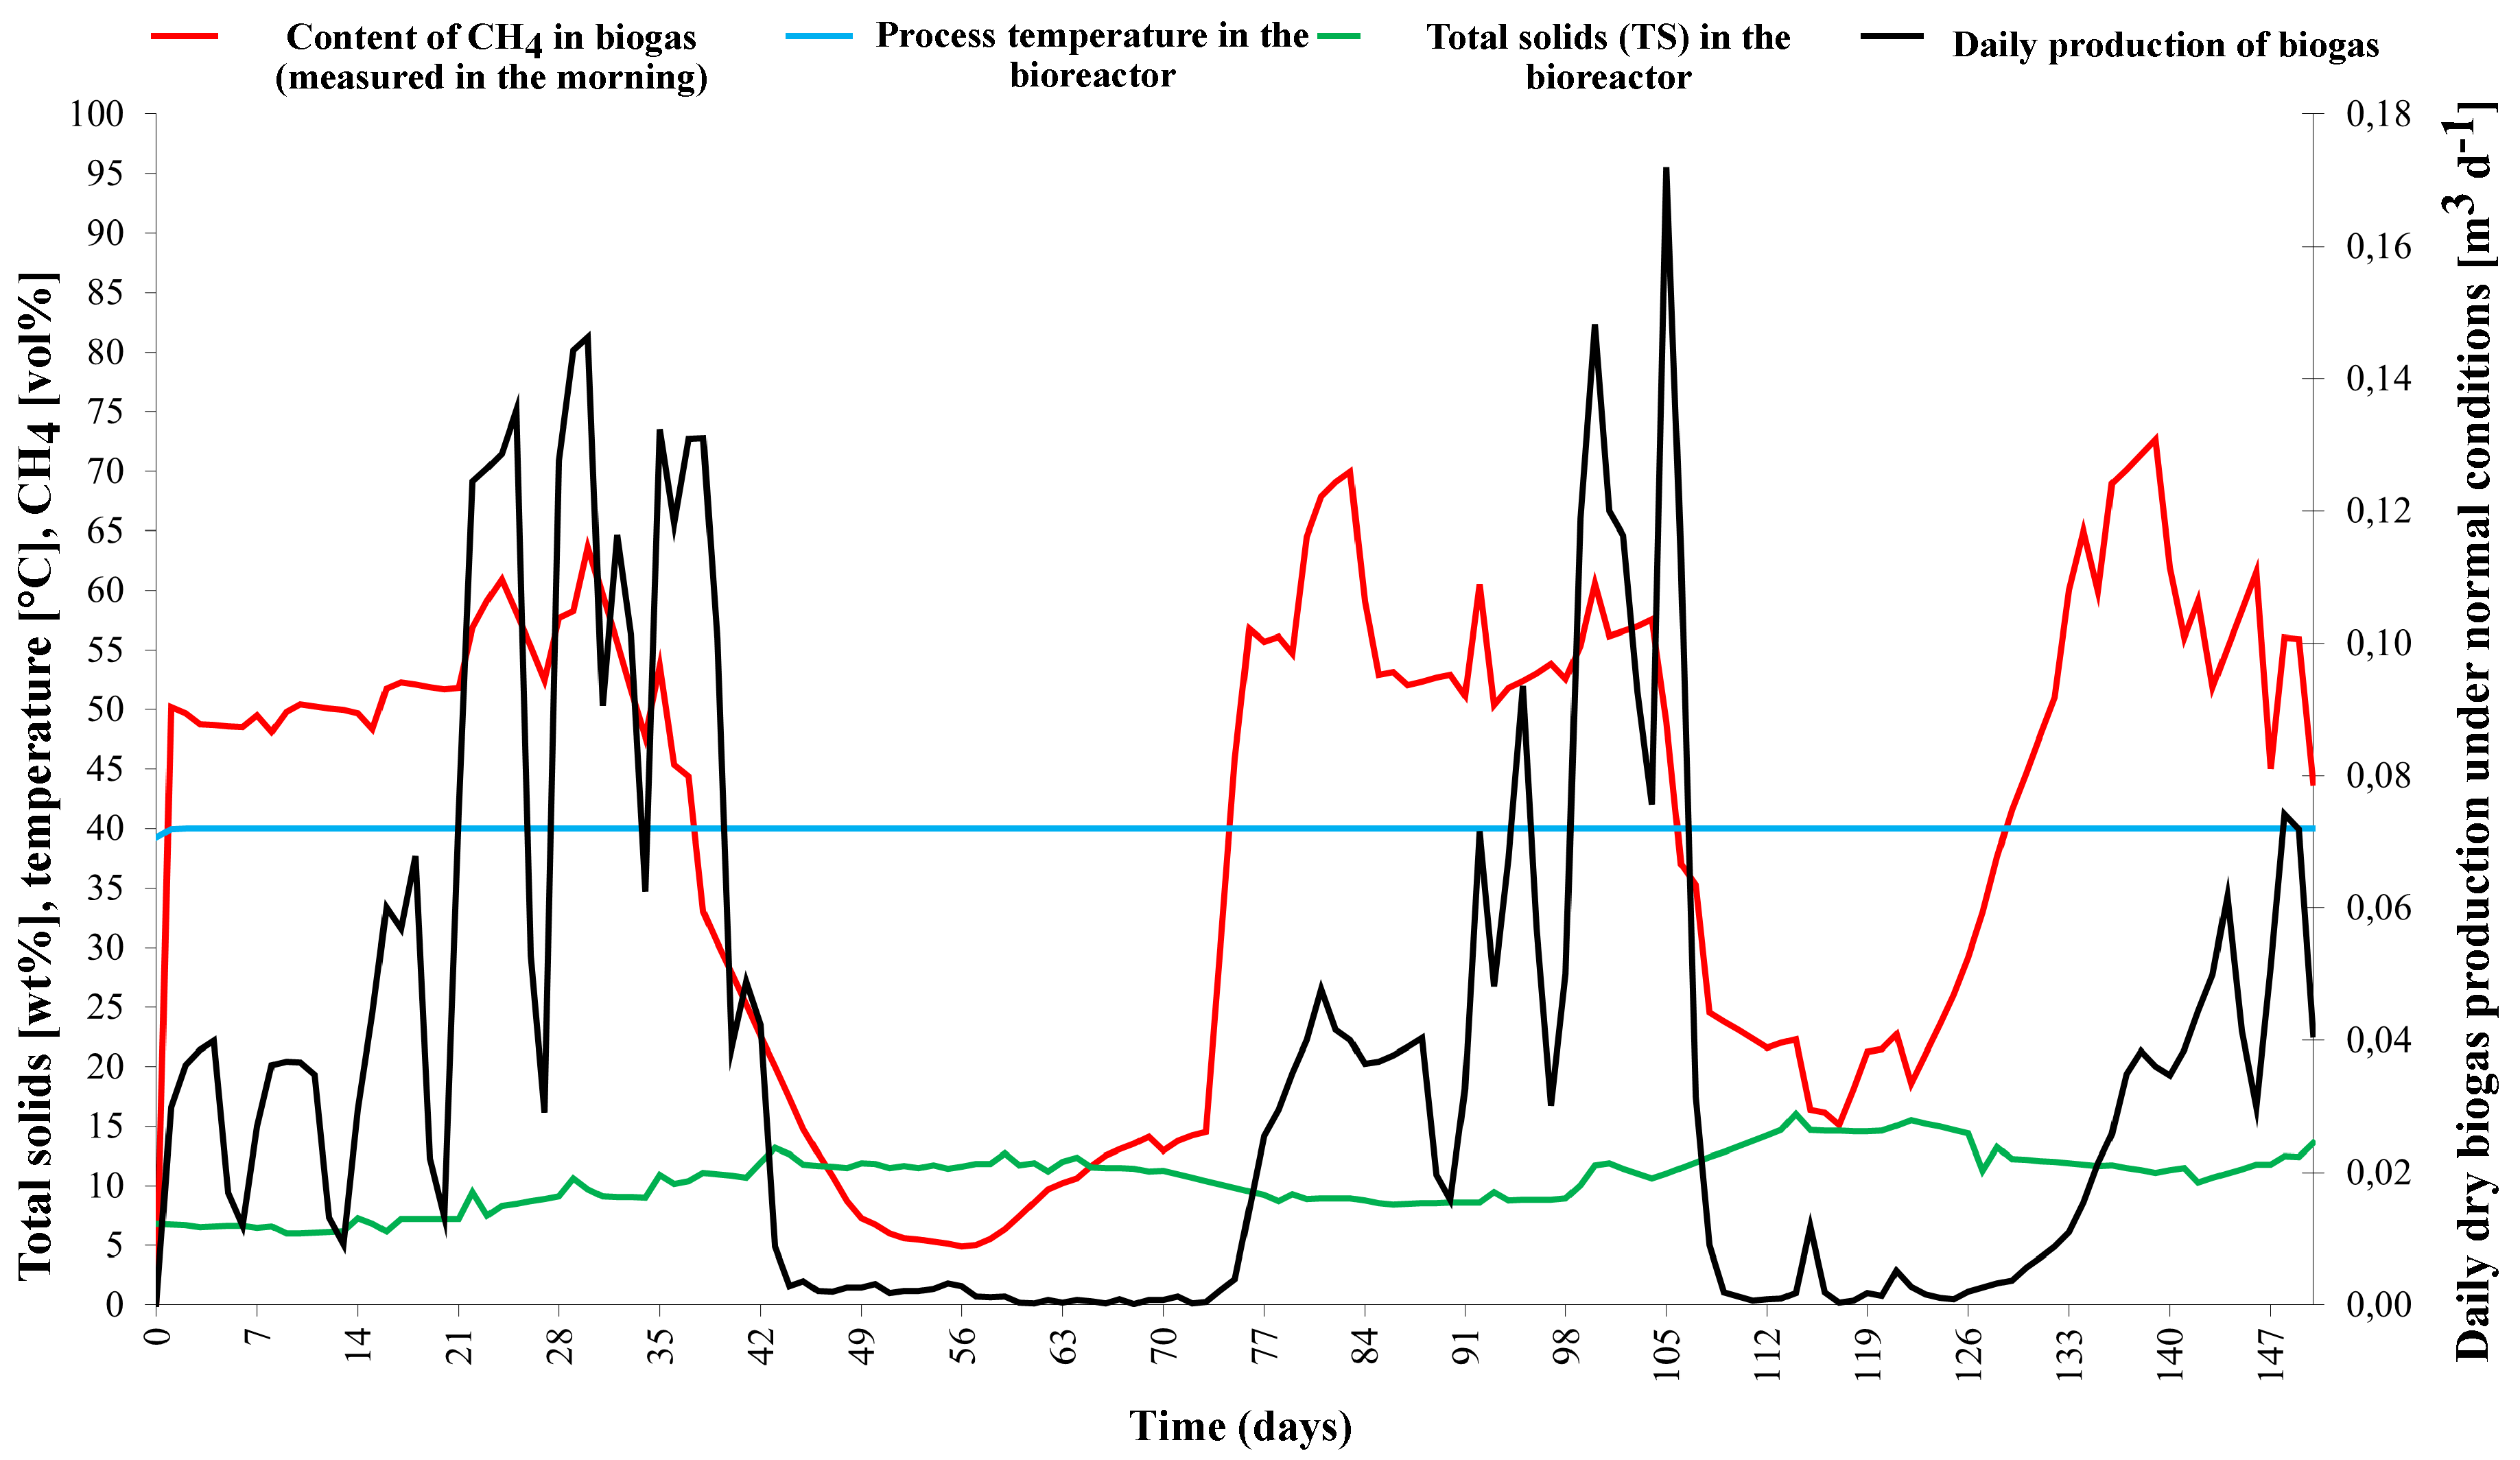
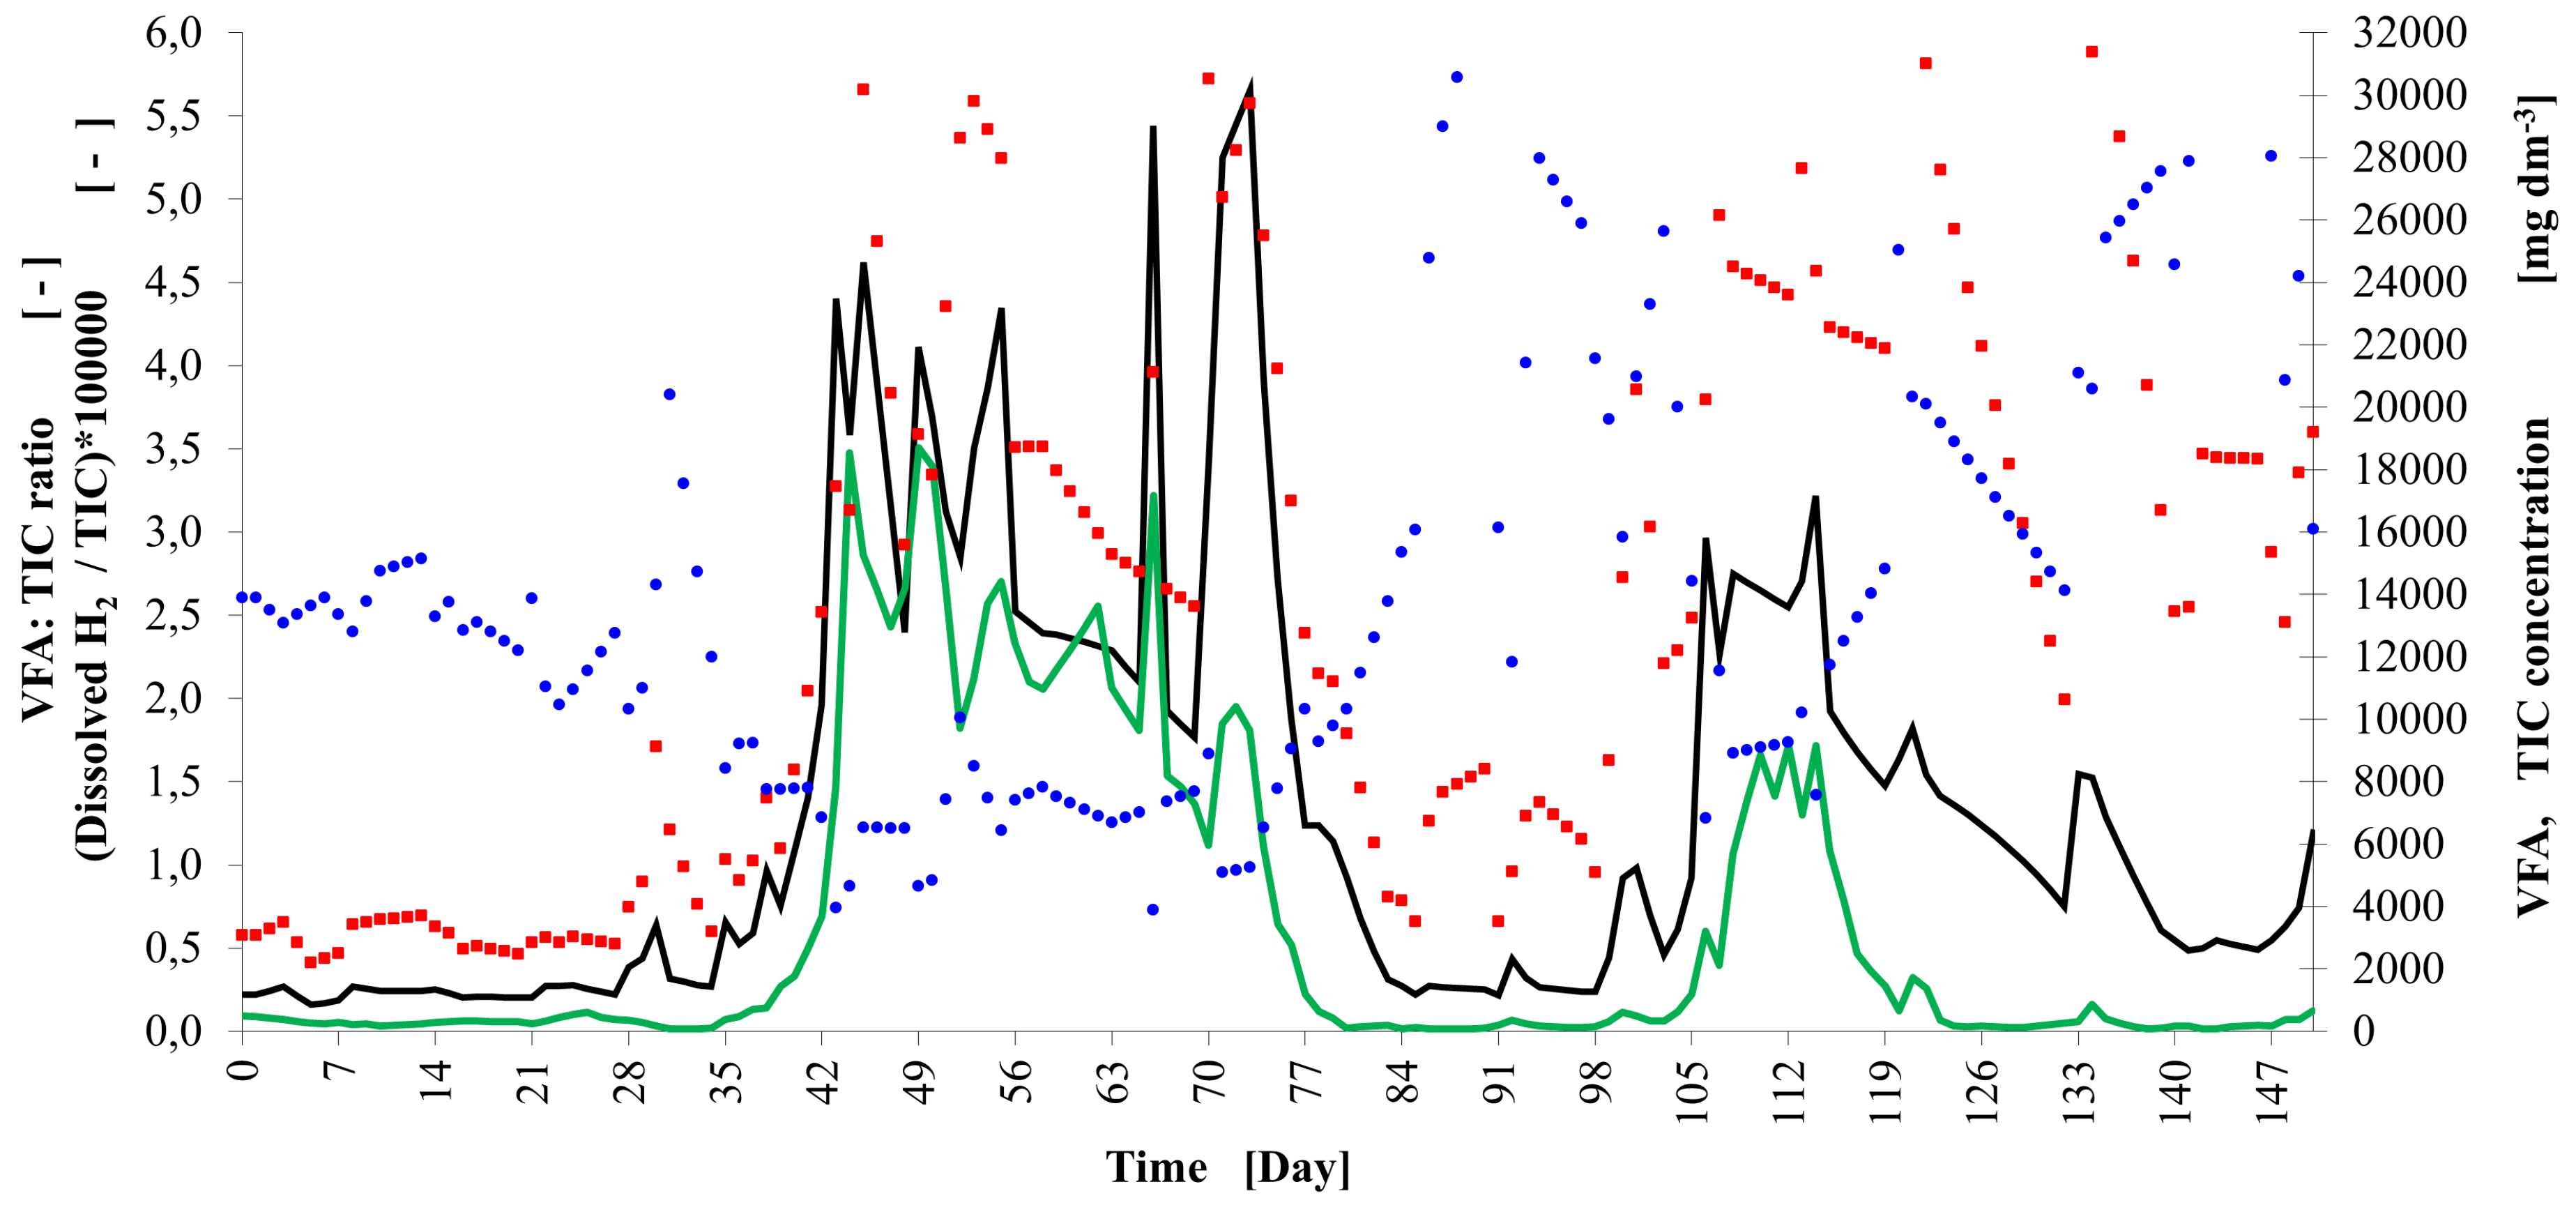
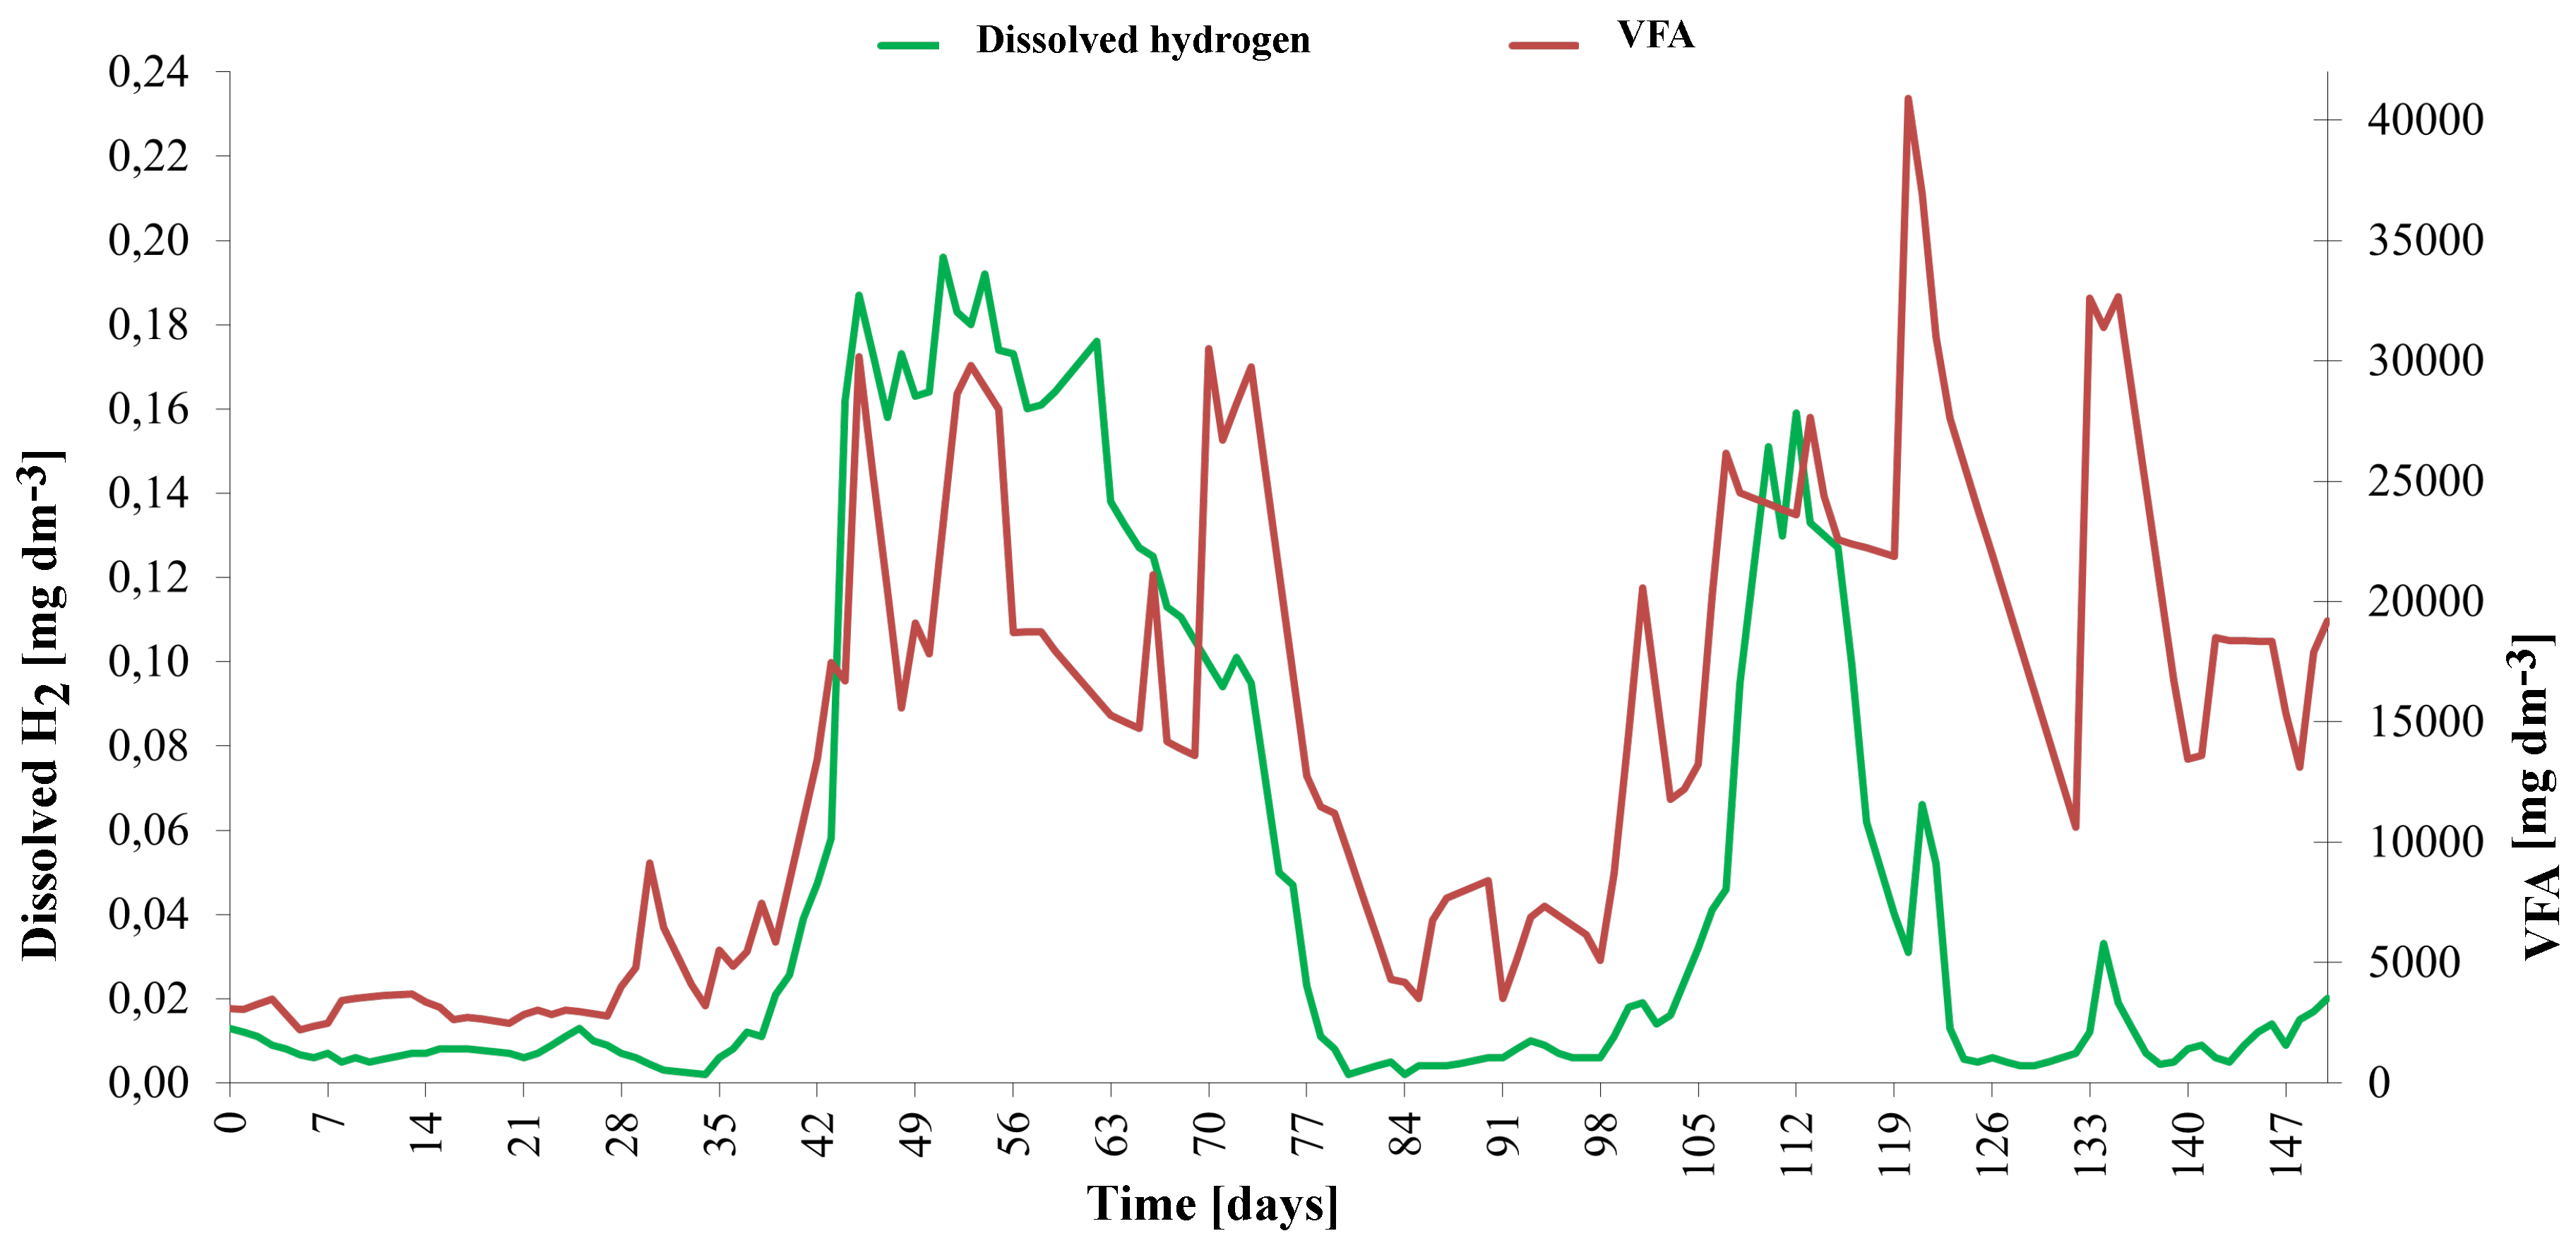
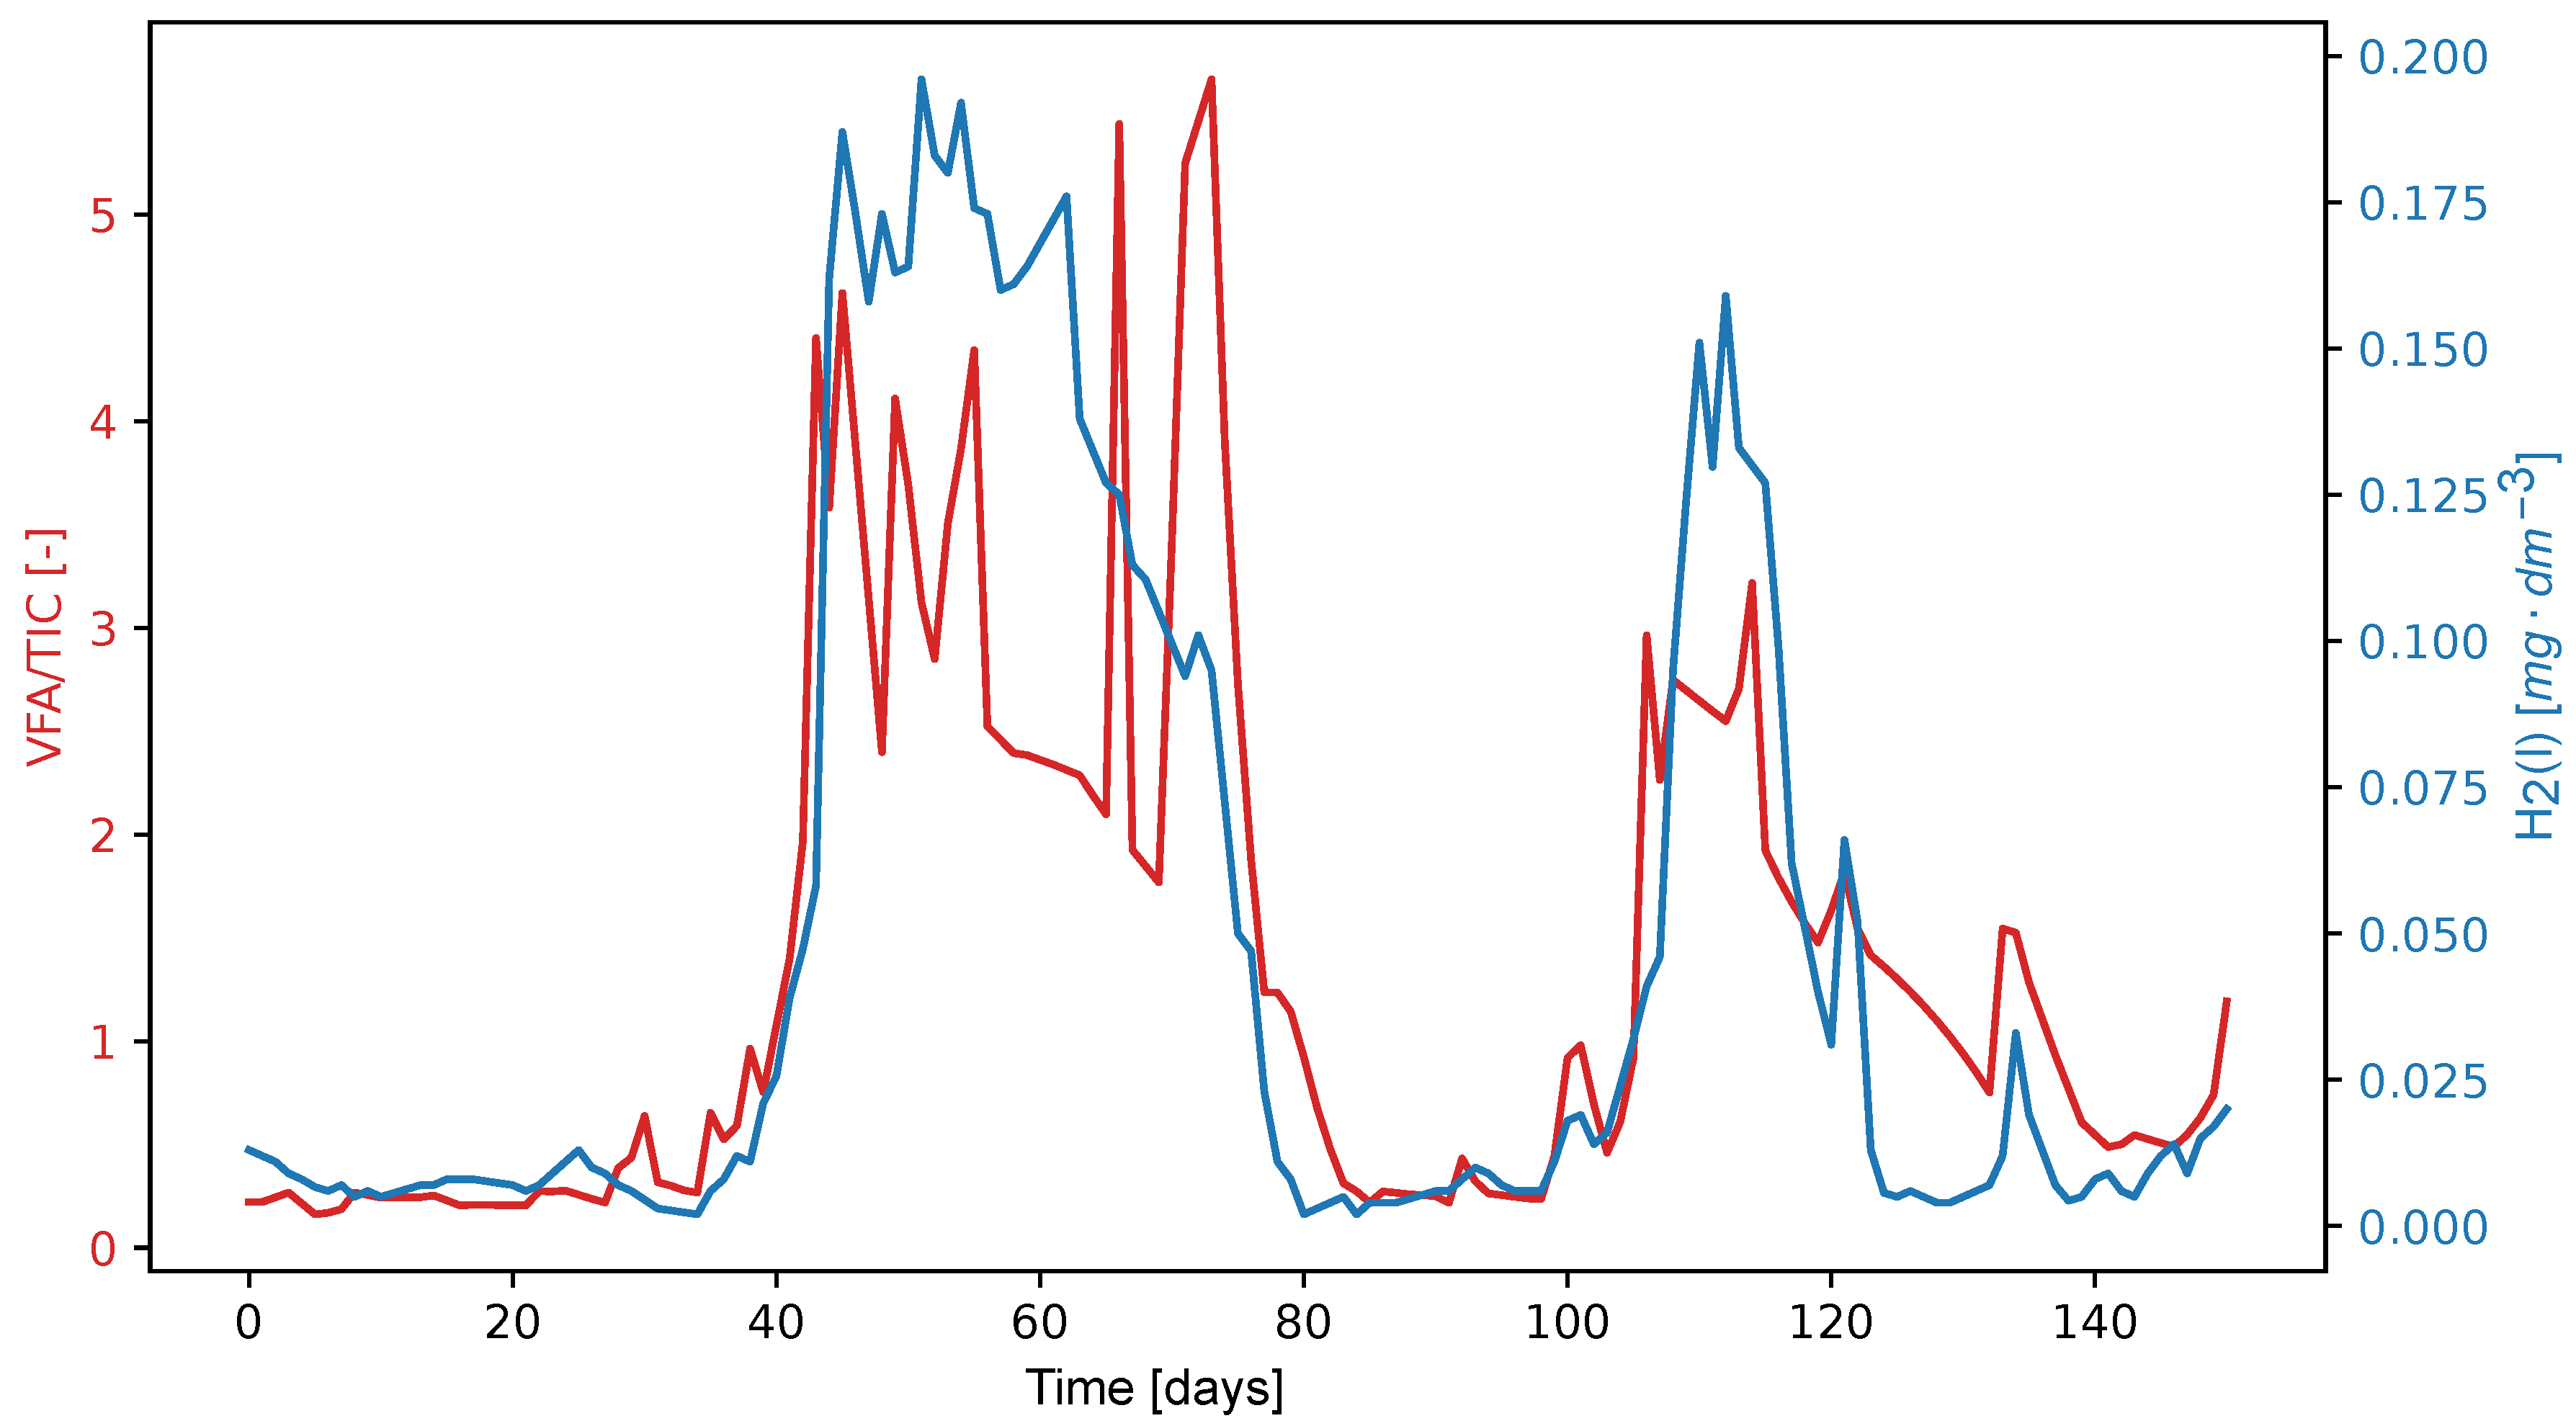
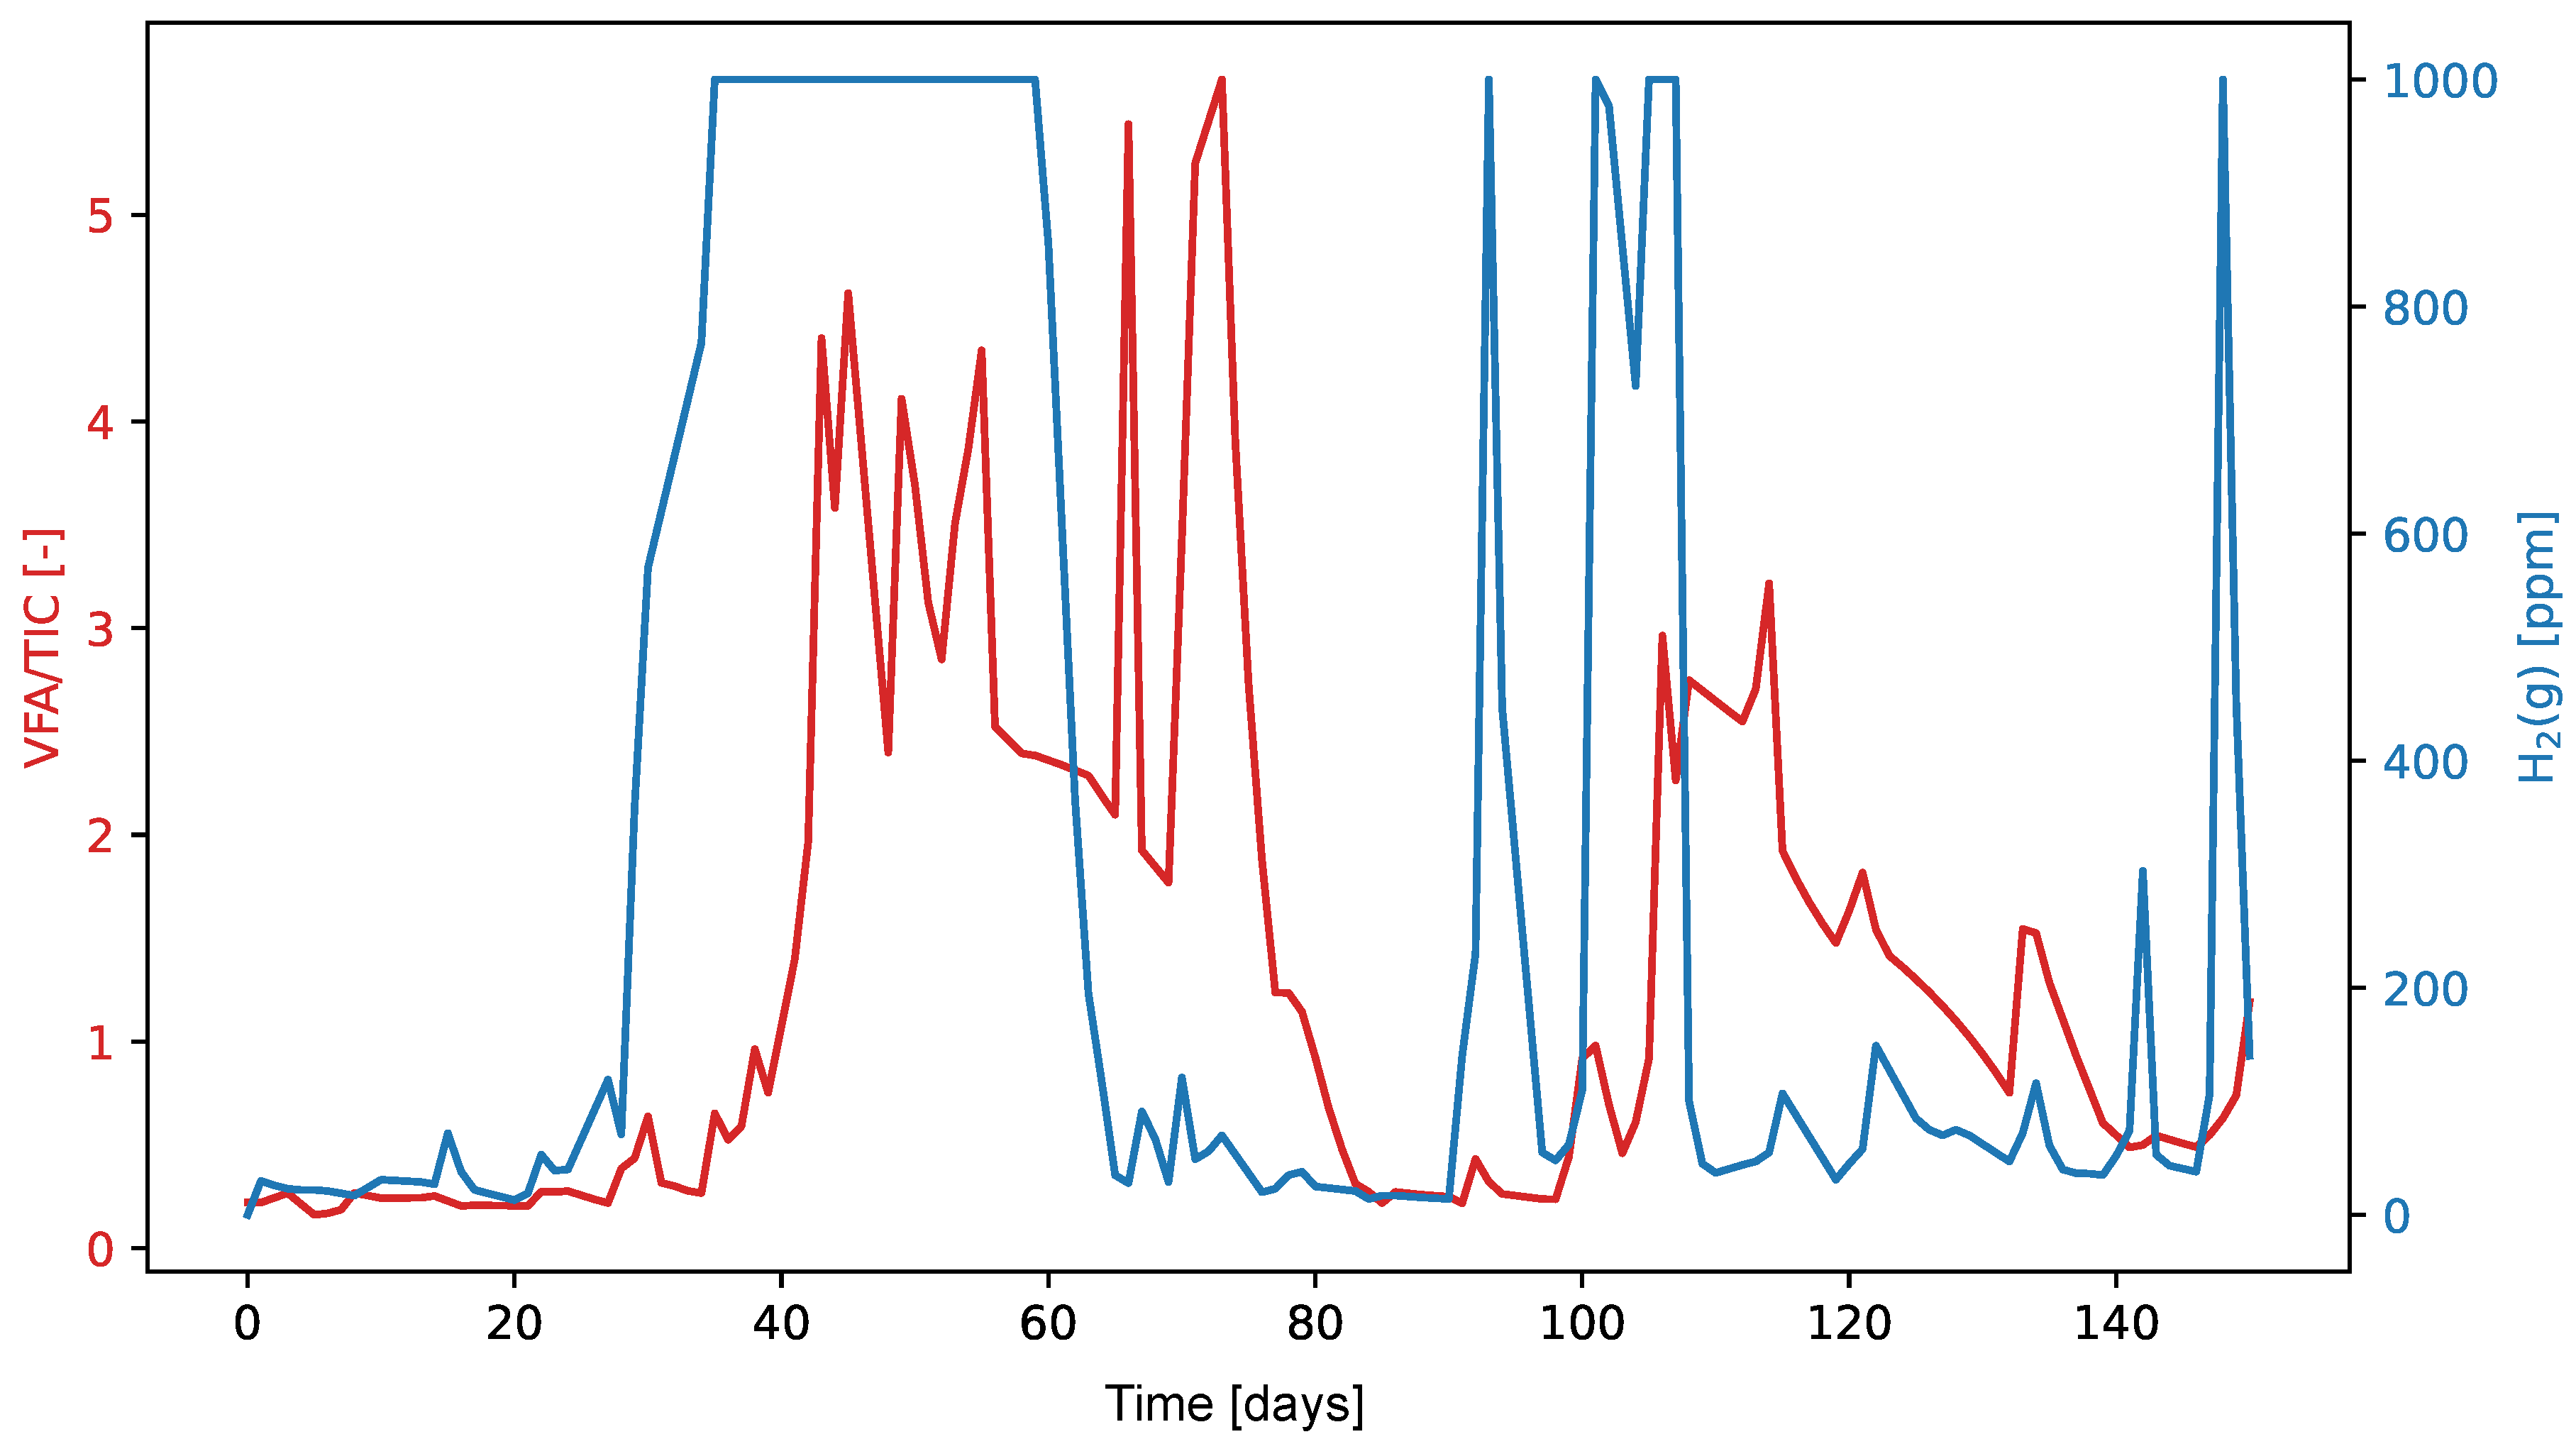
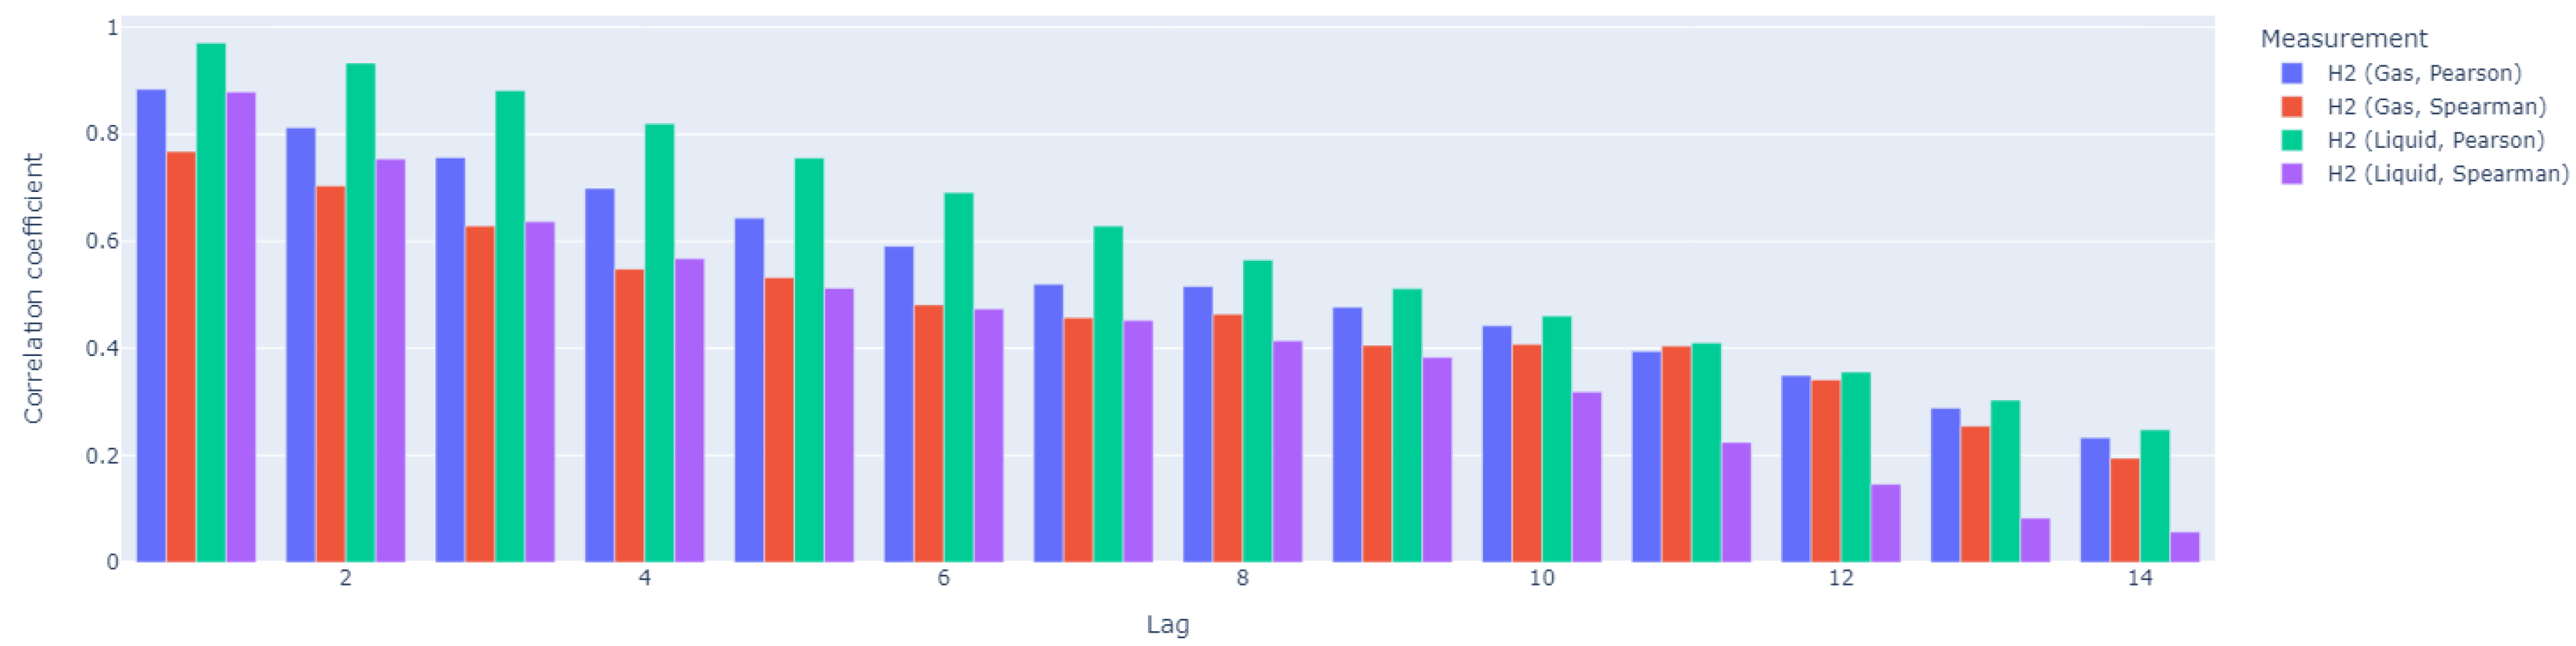
Since dissolved hydrogen is a key factor in maintaining the complex balance between microbial species that enable anaerobic digestion, we tested the ratio of dissolved hydrogen concentration to neutralization capacity as a potential alternative to the traditional VFA/TIC (alternatively FOS/TAC) stability indicator. The anaerobic digestion process was carried out in a Terrafors IS rotary drum bioreactor for 150 days at an average temperature of 40°C and an organic volatile load of 0.092 kgm−3 d−1. Corn silage was dosed on weekdays as the substrate. With a theoretical retention time of 45 days, a biogas production of 0.219 Nm3kgVs−1 with a CH4 content of 31.6 % was achieved. The values of the determined VFA/TIC stability indicator ranged from 0.22 to 5.66, with the highest values obtained when the reactor was overloaded. The dissolved hydrogen concentration ranged 0.005–0.196 mgdm−3. The Pearson correlation coefficient was 0.337 and corresponded to a p-value of 0. The Spearman correlation coefficient was 0.468. The amperometric microsensor has proven to be unsuitable for field applications due to its lack of sensitivity and short lifetime. The proposed ratio of dissolved hydrogen concentration to neutralization capacity did not prove to be significantly more effective than the established VFA/TIC indicator.

Keywords: 
;  ;  ;  ;  

1. Introduction

In the field of environmental engineering and sustainable development, the anaerobic process plays a significant role as one of the most promising alternatives to non-renewable energy sources as a promising technology for organic waste treatment and renewable energy production. A published paper "Case study of anaerobic digestion process stability detected by dissolved hydrogen concentration", published in Processes in 2021 [1], provided insights into the stability of this process by monitoring dissolved hydrogen concentration. This study provided insights into the factors affecting anaerobic process stability and identified possible optimization methods to improve plant performance. In this paper, we will continue to study the anaerobic digestion process and its stability, with an emphasis on further analysis of key variables and factors affecting the process. We will build on previous work and focus on the stability of the overall anaerobic digestion process and the possibilities of predicting its instability. This paper aims to provide further in-depth insight into anaerobic digestion and its applications in practice, with an emphasis on the sustainability and efficiency of the process.

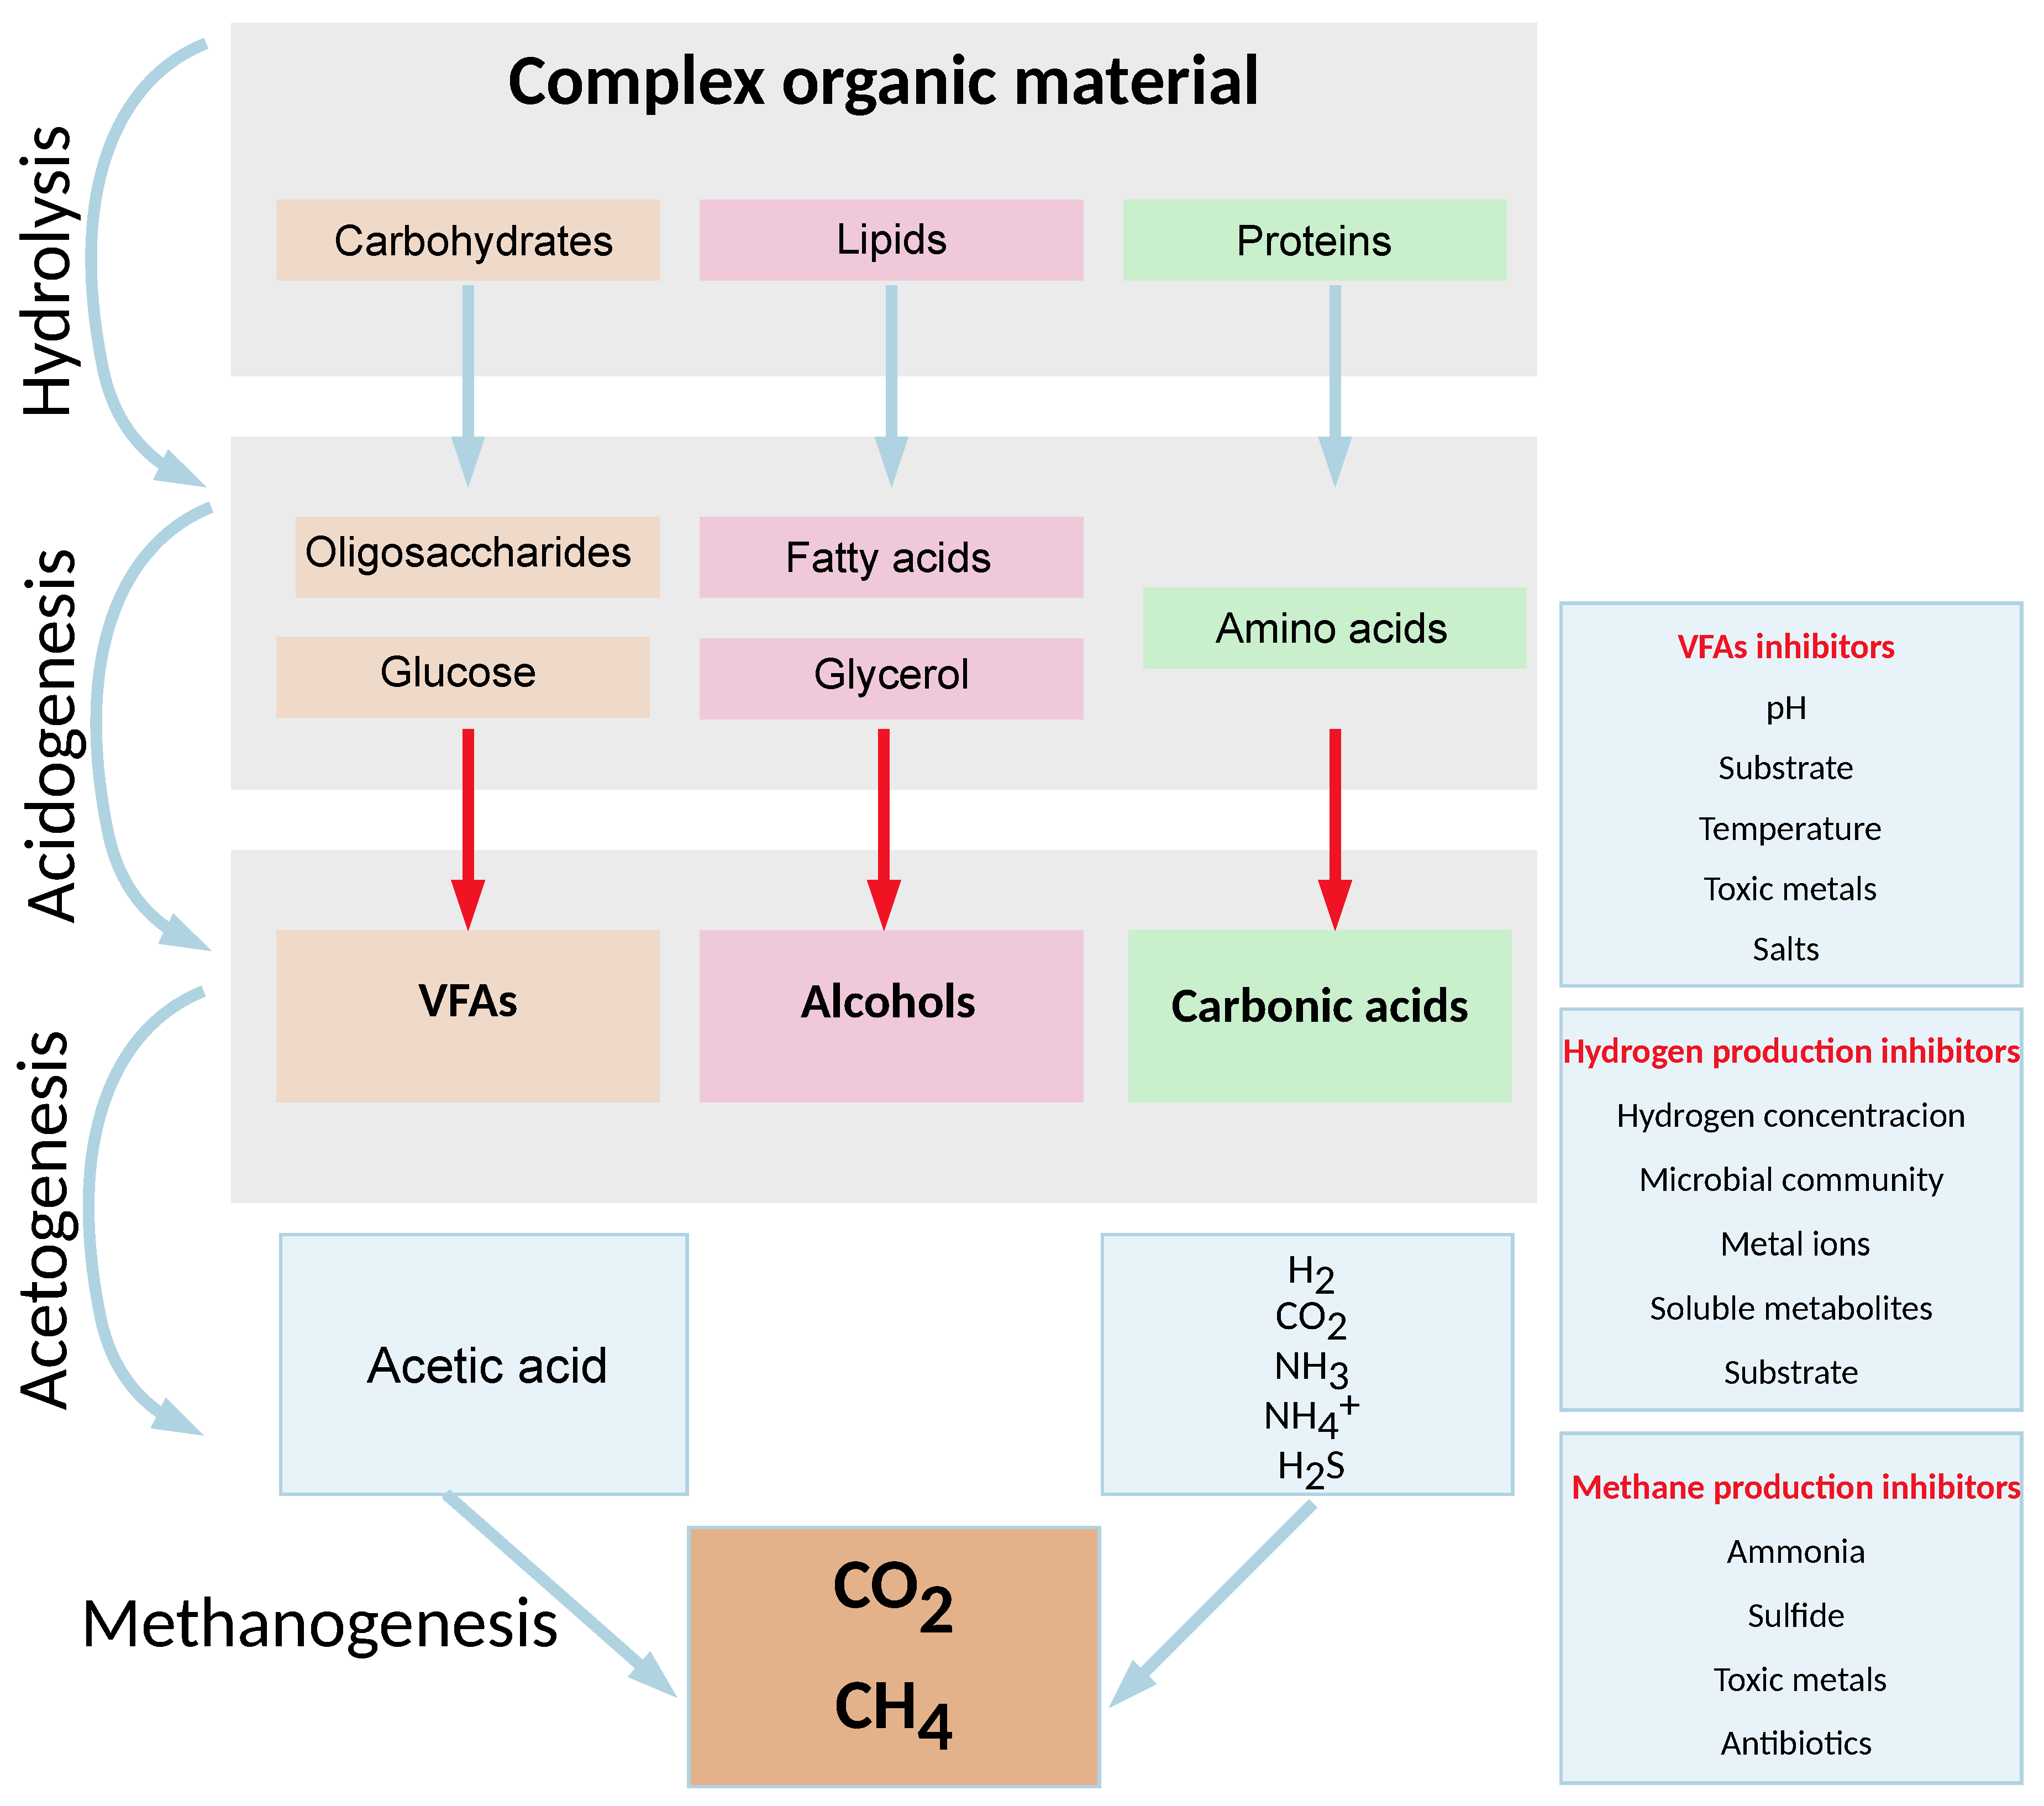
1.1. Anaerobic Digestion

Reliable real-time monitoring of the anaerobic digestion process is crucial for stable and efficient operation of biogas production and the prevention of potential digestion process failures. Dissolved hydrogen (H2(l)) concentration is one of the key parameters for biogas process control [2]. This is primarily because H2 contributes to the electron transfer between fermentative and methanogenic bacteria. As a result, monitoring hydrogen concentration could allow for the quantification of the digester’s biological activity [3,4]. In general, the natural process of anaerobic digestion is a relatively stable system that occurs in nature without the need for precise control. However, at high loadings, i.e. process disturbances, the result is usually a reduction or complete cessation of biogas production due to acidification. It has been verified that hydrogen accumulation above a critical concentration of more than 0.04 M has been reported as the initial phase of fermenter overload. Dissolved hydrogen is therefore a key factor in maintaining the complex balance between the microbial species involved in the multi-stage anaerobic digestion process and an early warning of process imbalance.

1.1.1. Phases of Anaerobic Digestion
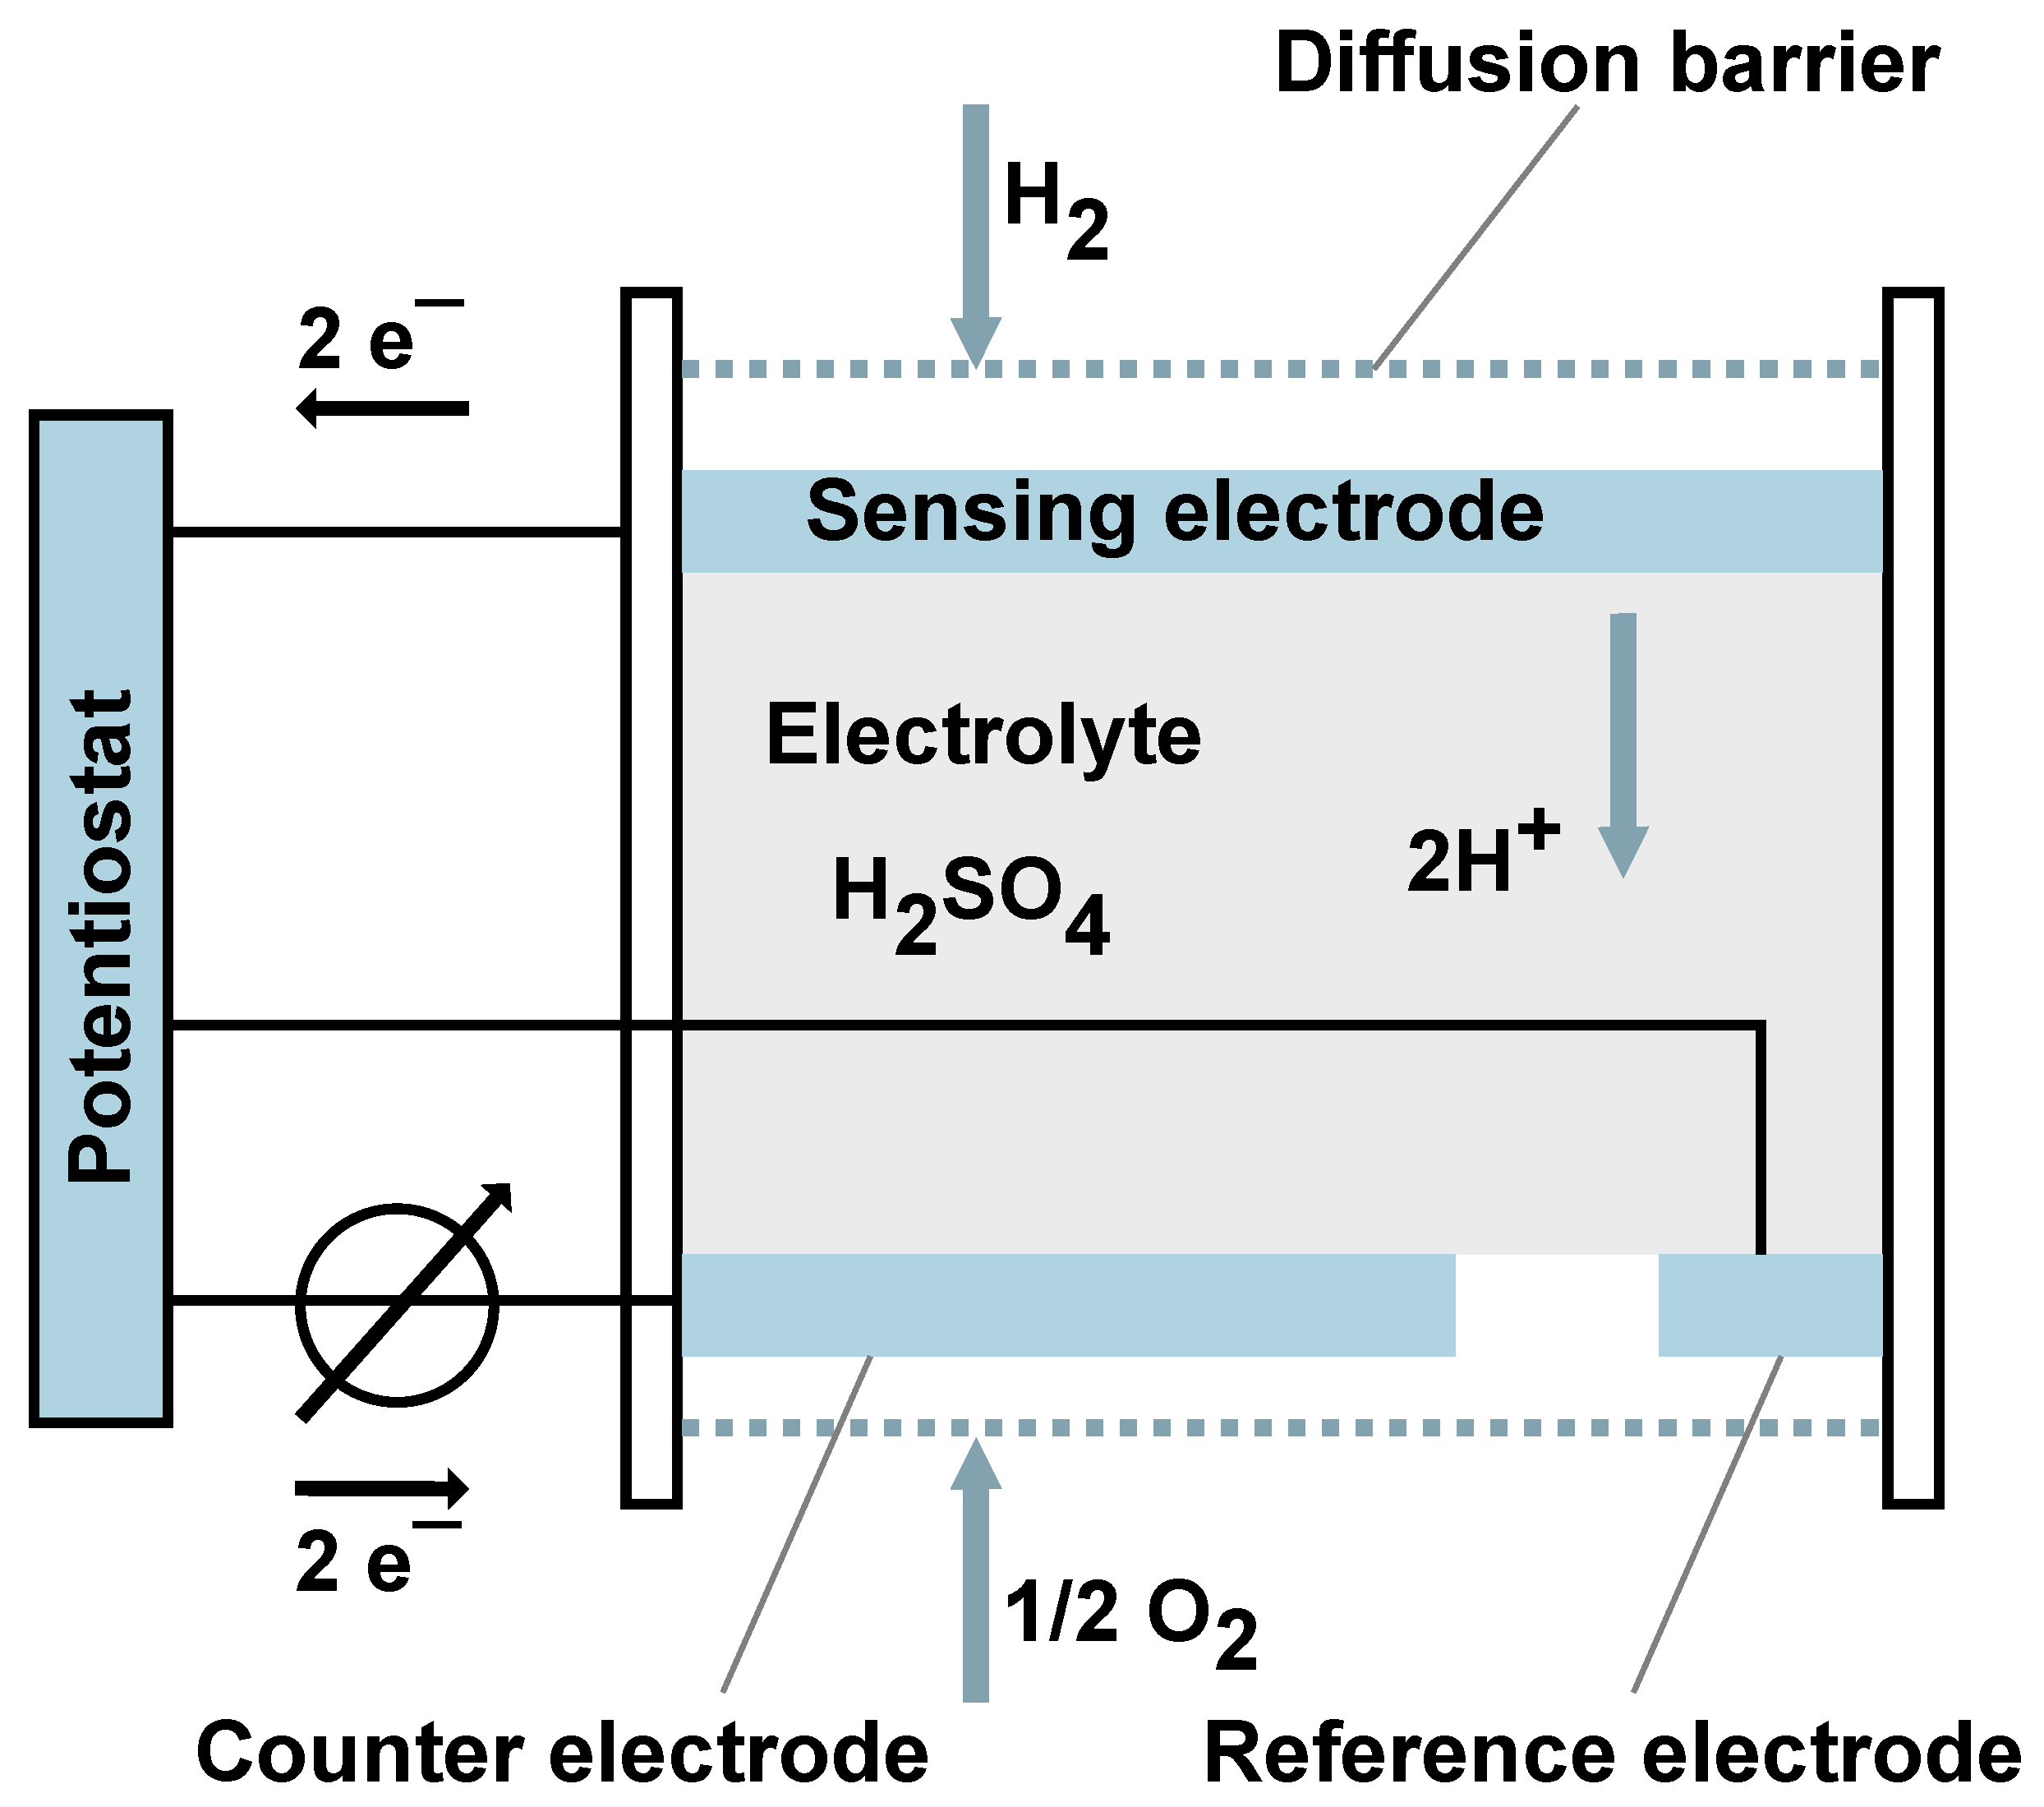
Anaerobic digestion is a multi-step process in which complex organic compounds are converted to the most oxidized and reduced forms of monoatomic carbon, carbon-dioxide and methane respectively [5]. This process is usually described as a four-step one involving hydrolysis, acidogenesis, acetogenesis and methanogenesis. [6]. Each stage of anaerobic digestion is carried out by different groups of microorganisms, each with its own respective environmental optimum [7].
The anaerobic digestion process begins with bacterial hydrolysis to break down insoluble organic polymers, such as carbohydrates, and make them available to other bacteria. Hydrolysis itself has an optimum temperature between 30–50 °C and an optimum pH of 5–7, although there is no evidence of improved hydrolytic activity below pH 7. The hydrolytic bacteria are classified into five different slow-growing strains: Firmicutes, Bacteroidetes, Fibrobacter, Spirochaetes and Thermotogae. However, Firmicutes and Bacteroidetes are considered to be the most abundant taxa of hydrolytic bacteria in anaerobic digestion. The relative abundance of hydrolytic bacteria usually depends on the inoculum type and operating temperature [8].
Acidogenic bacteria are responsible for the degradation reactions of hydrolysed compounds, converting the resulting sugars and amino acids into carbon dioxide, hydrogen, ammonia and organic acids. Unlike other phases, acidogenesis is generally assumed to proceed faster than all other phases of anaerobic digestion, with acidogenic bacteria having a recovery time of less than 36 hours. Acidogenic bacteria are mostly members of Firmicutes, Bacteroidetes, Proteobacteria and Actinobacteria phyla. Various operating parameters and factors including fermenter design, temperature, cell retention time and substrate type can alter the amount and population of acidogenic bacteria in the process. Among all other factors, substrate composition and concentration are considered to be the most influential [9].
Acetogenesis is the process in which acetogenic bacteria convert higher fatty acids and other intermediates into acetate via the Wood–Ljungdahl pathway, along with by-products such as ammonia, hydrogen, and carbon dioxide [10]. Although acetogenesis produces hydrogen, excessive partial pressure of hydrogen has been shown to inhibit acetogenic microorganisms, thereby impeding the breakdown of higher fatty acids. This inhibition occurs due to a metabolic shift towards the production of lactate, ethanol, acetone, and butanol [11,12]. Many acetogenic bacteria belong to the genus Syntrophomonas (e.g. Syntrophobacter wolinii and Syntrophomonas wolfei) [13]; other species of acetogenic bacteria include Methanobacterium suboxydans and Methanobacterium propionicum [14]. In subsequent phase, methanogenesis, methanogenic bacteria consume hydrogen, and in this context, high partial hydrogen pressure becomes advantageous [15]. This syntrophic relationship, where one group of organisms utilizes the products of another, facilitates the thermodynamic feasibility of the acetogenesis phase. As a result, interspecies hydrogen H2 transfer plays a crucial role in determining the overall rate of anaerobic digestion [16].
Methanogenesis refers to the final, highly sensitive phase of anaerobic digestion, during which available intermediates are consumed by methanogenic microorganisms to produce methane. Due to the sensitivity of anaerobic digestion, imbalances caused by the excessive accumulation of certain intermediates in the digester can easily lead to inhibition or failure of the process. Methanogens are slow-growing, strictly anaerobic microorganisms that can degrade only a limited range of organic compounds as a source of carbon and energy. These microorganisms belong to several well-known orders of archaea: Methanobacteriales, Methanococcales, Methanomicrobiales, Methanosarcinales, and Methanopyrales. Furthermore, methanogens are classified into three groups based on substrate utilization: methylotrophic methanogens, which utilize methyl and other one-carbon compounds; hydrogenotrophic methanogens, which consume CO2 and H2 as carbon and energy sources, converting them into methane; and acetoclastic methanogens, which convert acetate to methane [17,18,19,20,21].
Given these facts and the differing metabolic requirements of the various organisms involved in each stage, measuring hydrogen concentration during anaerobic digestion appears to be a good indicator of the quality of the process. Adjusting the optimal hydrogen concentration at certain stages can then optimize the process and increase its overall efficiency.
Figure 1. Hydrogen generation during anaerobic digestion process. Red arrows indicate blocked pathways that lead to increased hydrogen production. Inhibitors of each stage were shown in the boxes on the right. [20].
Preprints 139245 g001

1.2. Sensors

Hydrogen sensors are becoming increasingly important due to the growing use of hydrogen gas as an energy carrier and chemical reactant. Most hydrogen sensors used in biogas production monitor the concentration of H2 in the gas phase of the fermenter. Dissolved H2 in the digestate is then calculated from the gas fraction, assuming that hydrogen transfer between the gas and liquid phases is not limited. However, the H2 mass transfer coefficients in anaerobic digesters are much smaller than those typically found in aerobic digesters. This limits the rate at which H2 concentration increases in the biomass and can be detected in the gas phase of the fermenter, potentially leading to serious fermenter overload. Therefore, it is highly advantageous to have a practical, reliable, and inexpensive device capable of providing continuous in-situ measurement of dissolved hydrogen in an anaerobic digester [22].
The amperometric gas sensor is frequently described in the literature [23] using various terms such as polarographic, electrolytic, voltammetric, amperometric, or micro fuel cell. However, most amperometric gas sensors are not polarographic, as they do not contain a mercury electrode, and many are not electrolytic but rather galvanic cells. Additionally, none generate enough power to be classified as fuel cells. An amperometric gas sensor is designed to measure the concentration of a gaseous compound. It functions as an electrochemical cell, where gas detection occurs through electro-oxidation or electro-reduction of the compound at the surface of an electrode that is in contact with a liquid. The sensing electrode is a noble metal-catalyzed gas-diffusing electrode that retains the electrolyte within the cell but is porous enough to allow gas to diffuse into the electrode/electrolyte interface. The most commonly used sensor is the Clark amperometric gas sensor with a planar membrane electrode. It typically operates as a two-electrode system, although three-electrode configurations are also possible. The amperometric with three types of electrodes is shown in Figure 2
The electrochemical cell contains a solid or liquid electrolyte that allows the transport of ions between the electrodes. In hydrogen sensing, the electrolyte is usually a proton conducting material. The most commonly used liquid electrolyte is sulfuric acid. However, the use of a solid electrolyte eliminates the problems of leakage, corrosion and leakage that can occur with liquid electrolytes. Proton conducting solid polymer electrolytes are often used, while ceramic materials are used for high temperature applications. Finally, a gas permeable layer covers the entrance to the sensing electrode and helps to limit diffusion by becoming a rate determining step. This layer also serves to prevent leakage or drying of the electrolyte and, if a suitable material is used, to allow only selective passage of the analyte, thus avoiding interference with other gases. In many cases, this layer consists of a perfluorinated polymer. Hydrogen gas diffuses through this layer and is oxidised at the sensing electrode according to the equation
H 2 2 H + + 2 e .
This results in a change in the potential of the sensing electrode. On the counter electrode, oxygen reduction proceeds as follows:
1 2 O 2 + 2 H + + 2 e H 2 O .
Amperometric sensors can be used in the temperature range -20 to 80 °C, provided that the electrolyte does not freeze in this range. For in-situ hydrogen monitoring in high temperature high pressure aqueous solutions for temperatures < 300 °C. Operation at higher temperatures is possible with ceramic electrolytes. The effect of pressure is mainly due to an increase in absolute hydrogen concentration, which must be taken into account. Ambient humidity can affect the sensor signal due to its influence on the water content of the electrolyte and thus on its proton conductivity. The advantages of these sensors are sensitivity up to 100 ppm, low power consumption, no heating of the sensor element and operation at high ambient temperature. Reported disadvantages may be the narrow temperature range when using certain electrolytes, limited lifetime, and the need for periodic calibration. At constant cell voltage, the current varies linearly with the square root of the hydrogen concentration in water [24,25,26,27].

2. Materials and Methods

Testing was carried out at the Institute of Environmental Technologies, VŠB-TU Ostrava, Czech Republic, where a 150-day single-phase mesophilic mono-digestion experiment was conducted. A simple schematic of the experiment is shown in Figure 3, the individual parts of the experiment will be described in the following sections.

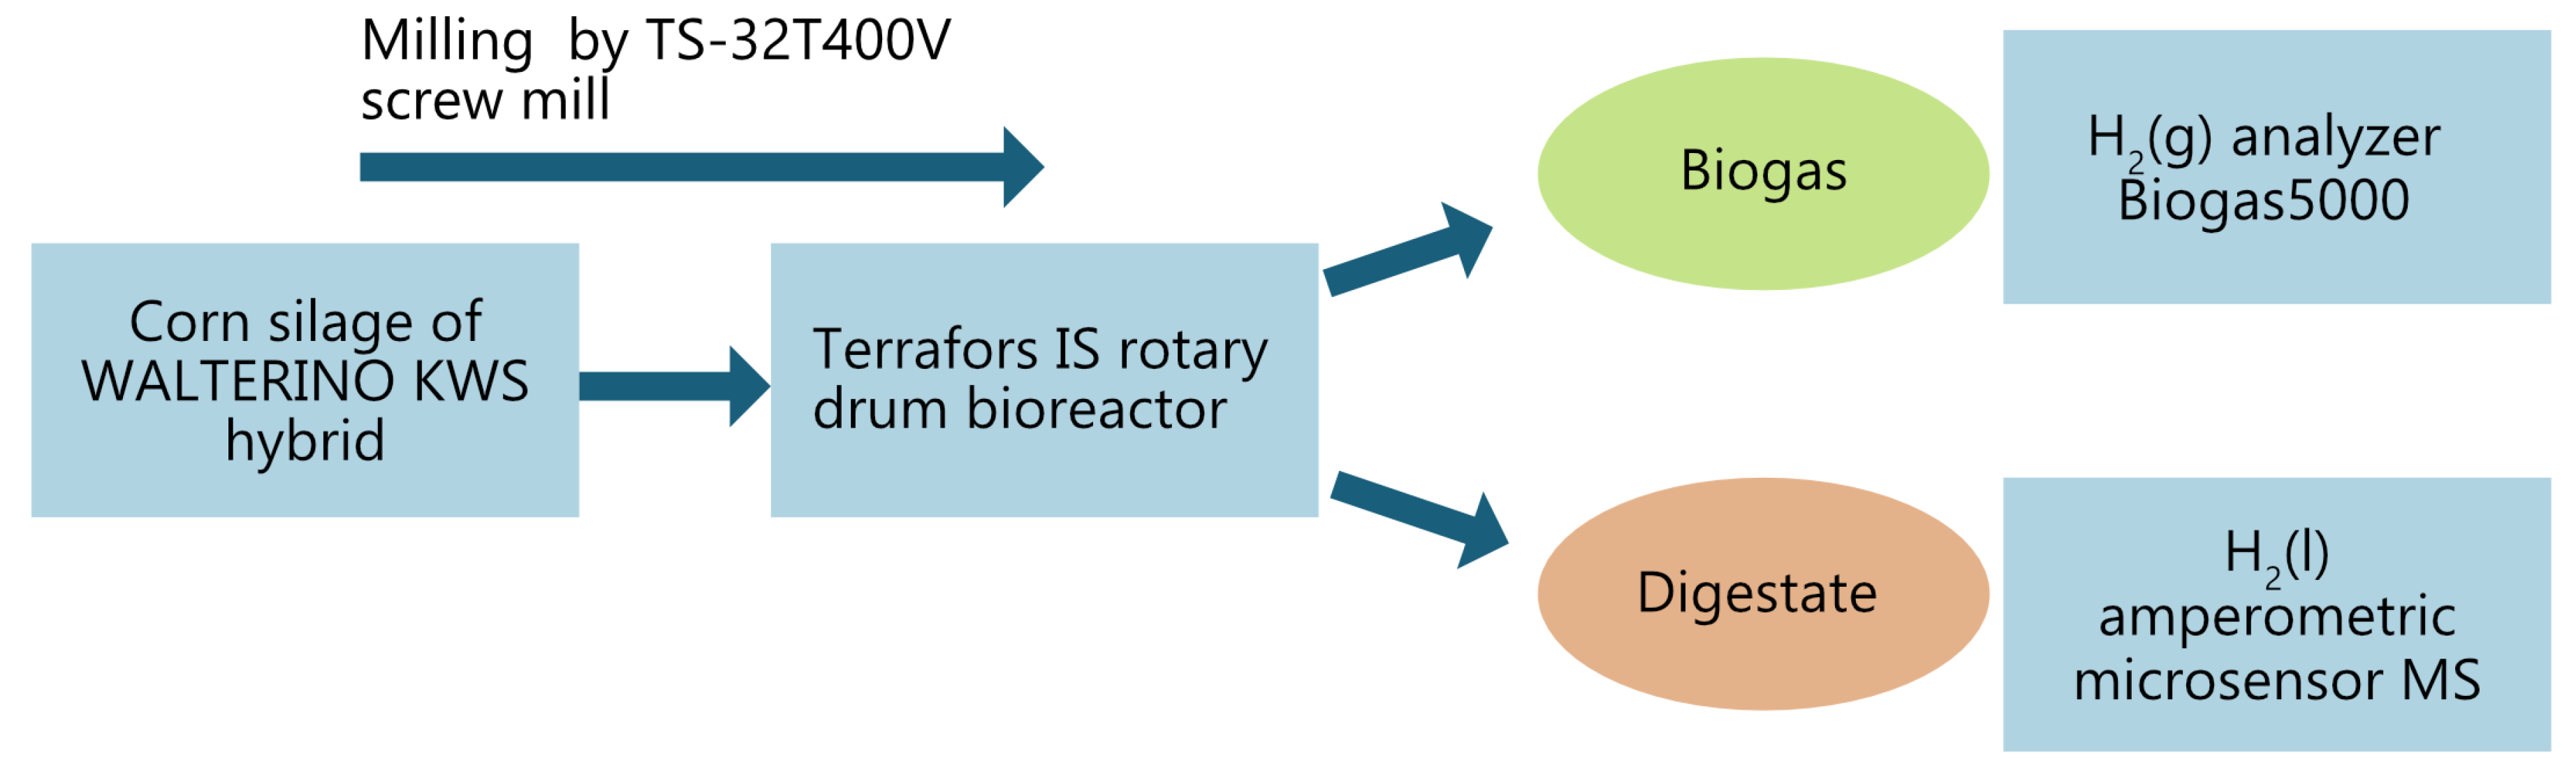
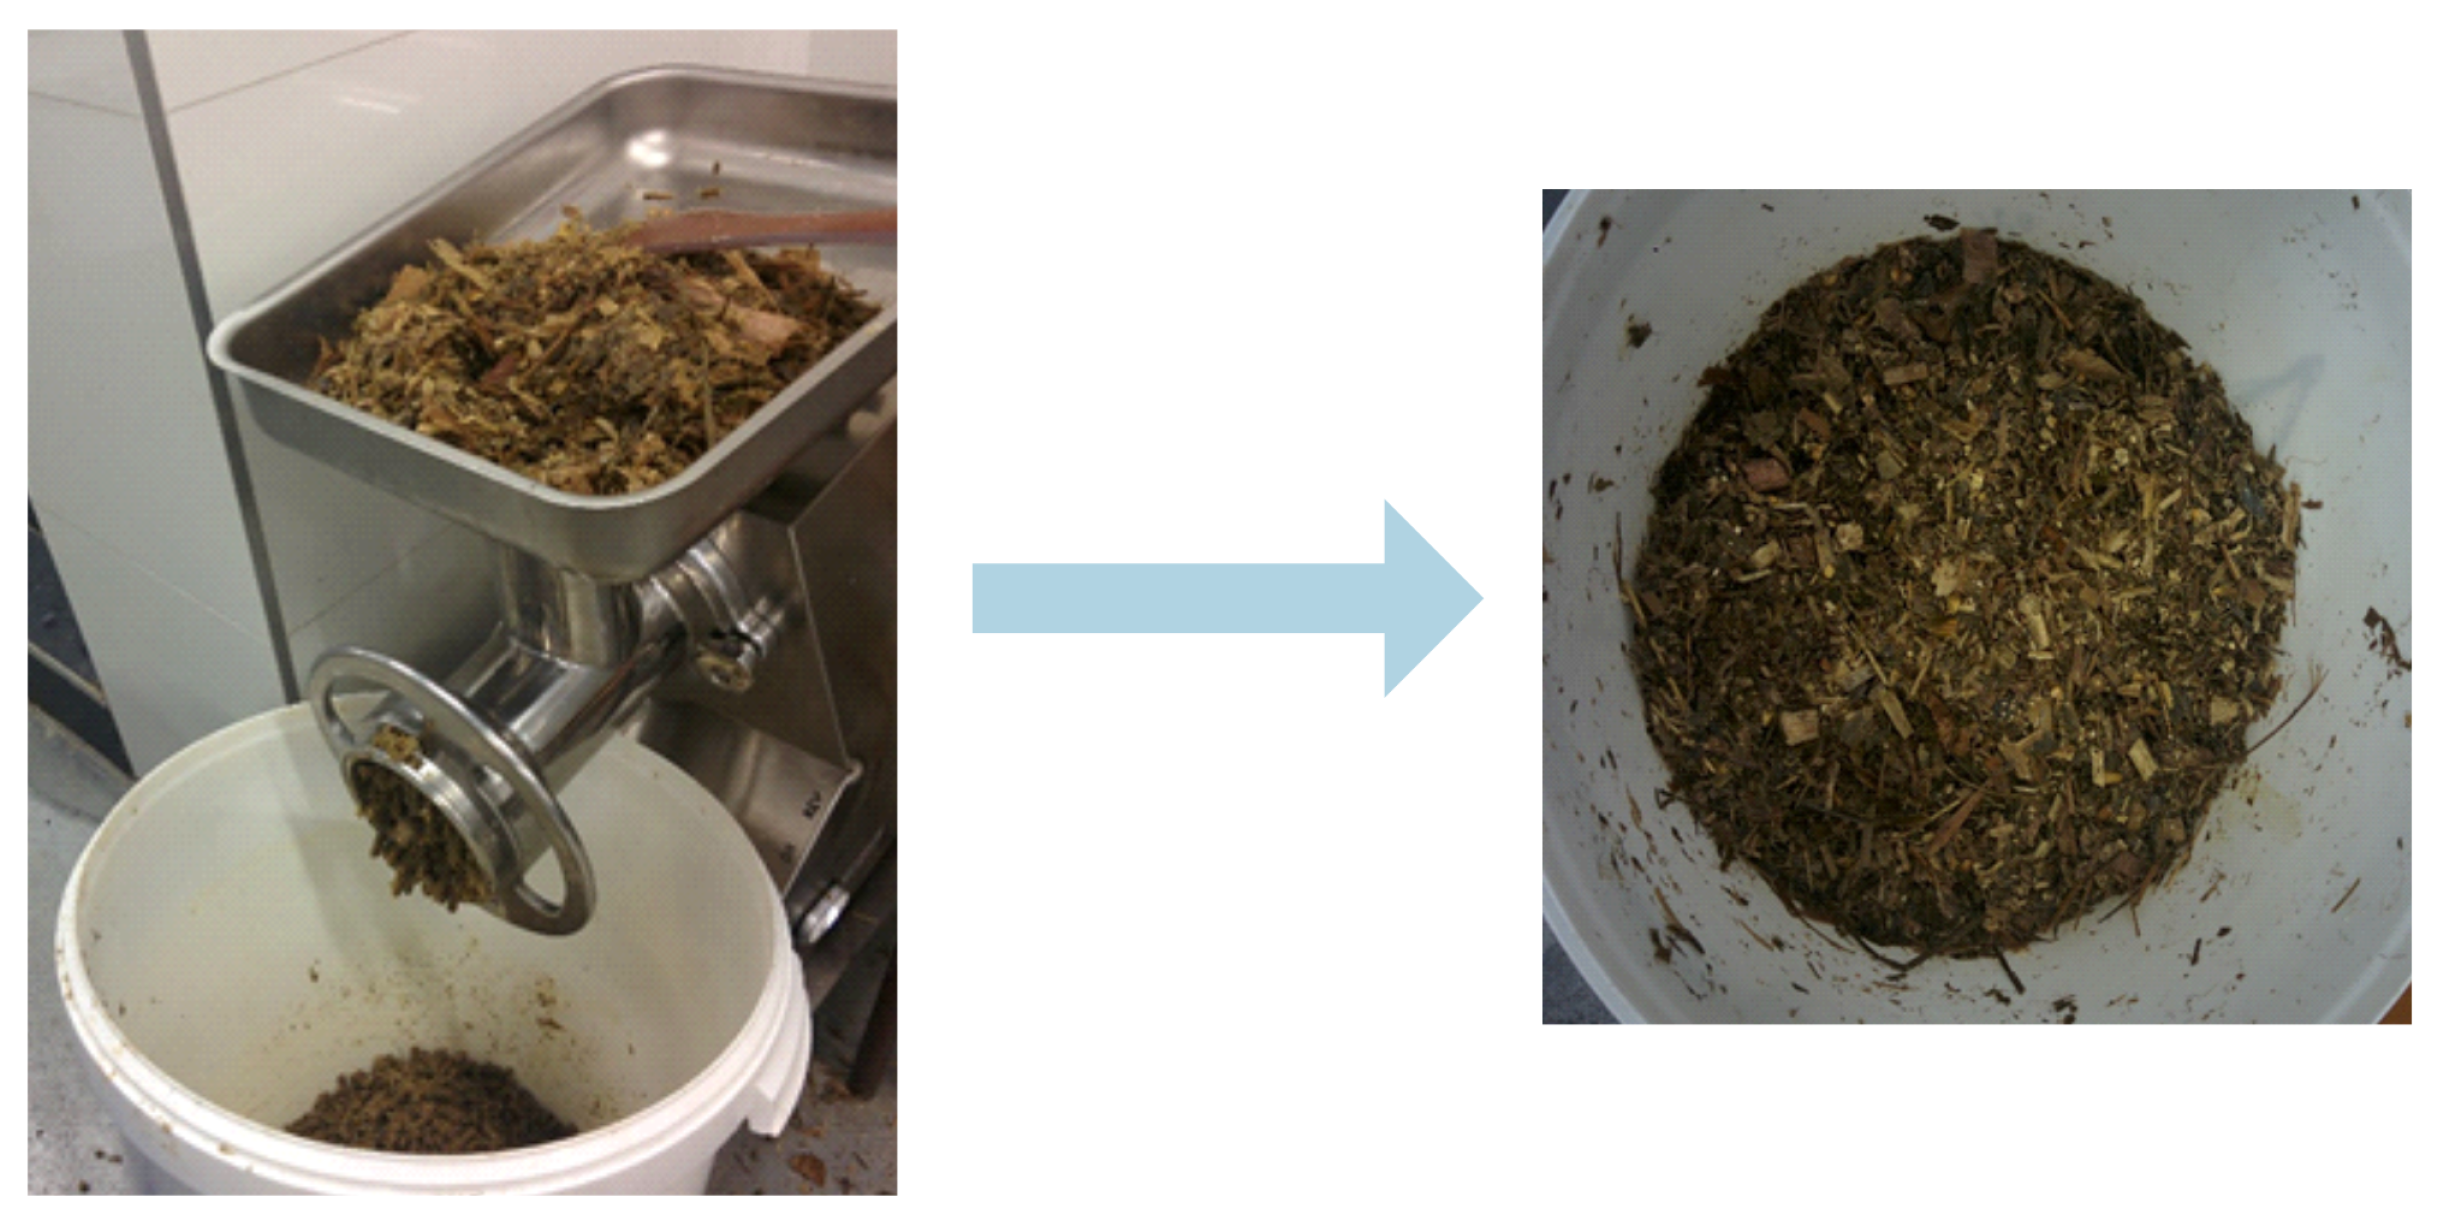
2.1. Substrate Pre-Treatment and Dosing into the Bioreactor

The substrate chosen for the experiment was maize silage hybrid WALTERINO KWS. To ensure homogeneity, the silage was milled by TS-32T400V screw mill (RM Gastro sro., Prague, Czech Republic) passing through a matrix with round holes with a diameter of 6 mm (Figure 4). After milling, the corn silage was kept in a refrigerator at 4–6 °C, which helped to suppress possible acidification and keep the substrate in an optimal condition for use throughout the experiment. The reasons why maize is the most used crop for anaerobic digestion are the high yield potential of this crop, its favourable quality characteristics and the possibility of preserving the matter by ensiling. The easy ensiling of maize biomass and the possibility of using the ensilable matter to supply the biogas plant throughout the year. The ensiling process increases the methane yield by up to 25 % compared to fresh material, due to the fact that lactic, acetic and formic acids and alcohols, which are precursors to methane formation, are formed during ensiling. Another reason may be the partial disturbance of the fibre, which improves the availability of nutrients for methanogenic bacteria. Another advantage of maize silage production technology is that it can be cut into very small pieces at harvest, since the shorter the cut, the greater the surface area of the individual particles and the better the degradability of the organic matter in the fermenter. According to [28], shortening the cuttings increases the biogas yield by up to 10 %.
The process was implemented in a Terrafors IS rotary drum bioreactor (INFORS HT, Bottmingen, Switzerland), which is illustrated in Figure 5.
A drum reactor with a total volume of 0.0187 m 3 was filled with 15.0 kg (approximately 0.015 m 3 ) of liquid inoculum, which was anaerobic digestate obtained from the Pustějov II plant from fermenter 1. The inoculum was treated on a screw grinder passing through a matrix with 6 mm diameter holes to minimize the formation of floating crusts. During the experiment, the suspension was continuously stirred, which was ensured by rotating the reactor drum around the horizontal axis. The rotation speed was set at 0.7 / min −1. The temperature of the experiment was fixed at 40 °C, which represents the optimum conditions for a mesophilic anaerobic process. The substrate was fed into the drum reactor into the reactor a total of 66 times. The average substrate dose was 286 g. However, during overload, up to 1 500 g of substrate was dosed on some days. The main substrate parameters such as composition, nutritional value and other relevant information are detailed in Table 1, providing important data for monitoring and interpreting the experimental results.

2.2. Monitoring the Experiment Progress

The temperature of the suspension was continuously measured by a thermocouple that passed through the horizontal shaft of the reactor in the centre of its compartment. Data were recorded manually once a day, ensuring regular monitoring of temperature conditions throughout the experiment. The biogas stream exiting the reactor passed through a pipe leading from the gas compartment through the horizontal shaft of the reactor axially. The amount of biogas produced was continuously measured using a rotary drum gas meter TG05 (RITTER GmbH, Schwabmünchen, Germany), with gas volume increments manually recorded once a day. Biogas composition was analyzed using a Biogas5000 portable analyzer (GEOTECH Ltd., Coventry, UK) on working days prior to digestate sampling and substrate dosing. This analyser used infrared sensors for methane (CH4) and carbon dioxide (CO2), and electrochemical sensors for oxygen (O2) and sulphane (H2S). During gas composition analysis, the reactor rotation was stopped, and the biogas sample was collected through one valve and then returned to the reactor gas space via an adjacent valve. To check the dissolved hydrogen content, a sensor was placed in the liquid phase and introduced into the compartment by means of a 32 mm diameter valve, commonly used for digestate sampling and substrate dosing. The sensor was sealed with silicone rubber and stabilization of the sensor in the anaerobic slurry typically took 15 min. The rotation of the reactor was restored only after the sensor was removed and a batch of substrate was inserted, which ensured the safe conduct of the experiment and the reliability of the measured data.

2.3. Measurement of Dissolved Hydrogen

The dissolved hydrogen sensor, model AM 08 (AMT Analysenmesstechnik GmbH, Rostock, Germany), used amperometric detection with a declared detection limit of 0.2 μ g / d m 3 H2(l) and a measurement range of up to 1.5 m g / d m 3 H2(l). The tips of both sensors were located approximately 30 mm below the substrate surface. After measuring the dissolved hydrogen content, a digestate sample (approximately 0.9 times the volume of the substrate batch) was taken for further analysis, and then the substrate batch was introduced into the reactor. Digestate sampling was carried out at a frequency corresponding to the substrate sampling.

2.4. Determination of Substrate and Digestate Characteristics

The following analyses were systematically performed on the substrate and digestate samples to characterize their chemical composition and properties in detail.

2.4.1. Determination of pH

The method involved the use of a 340i meter and a SenTix 41 probe (WTW, Weilheim, Germany). This analysis is crucial for monitoring the acidity or alkalinity of the samples, which has an impact on microbial activity and the overall process of anaerobic biogas production [29].

2.4.2. Determination of Total Solids

This parameter was obtained by drying the samples at 105 °C in an oxygen atmosphere until a constant mass was reached. A DLB 160 3A moisture analyzer with halogen lamp (KERN, Balingen, Germany) was used for this purpose. The accuracy of this analysis was determined to be 2.0% RSD [30].

2.4.3. Determination of Volatile Solids

The weight loss method was used to determine the organic content by annealing the samples at 550 °C in an oxygen atmosphere using a TGA 701 thermogravimetric analyzer (LECO, Benton Harbor, MI, USA). The accuracy of this analysis was determined to be 5.0% RSD [31].

2.4.4. Determination of Volatile Fatty Acids/Total Inorganic Carbon

The VFA/TIC ratio is important for the evaluation of the fermentation activity and stability of the anaerobic biogas production process. It was determined using a TIM BIOGAS V02.2 automatic titrator (HACH Lange, Düsseldorf, Germany) [32]. This set of analyses provided comprehensive information on the chemical composition of the substrates and their changes during the anaerobic biogas generation process. This information is crucial for optimizing the process and maximizing the performance of the anaerobic biogas plant.
The main parameters of inoculum, substrate and digestate measured are given in Table 1.
Table 1. Parameters of inoculum, substrate and digestate measured during the experiment.
Parameter Unit Inoculum Substrate Digestate
pH- H 2 O  1 7.47 5.30 7.12
TS 2 wt% 15.39 29.00 10.55
VS 3 wt% TS 79.43 78.53 77.35
VFA 4 m g / d m−3 3068 1553–40897 7
TIC 5 m g / d m−3 13886 3881–37475 8
VFA/TIC 6 0.221 0.112–5.655 9
1 hydrogen potential, 2 total solids (105 °C), 3 volatile solids (550 °C), 4 volatile fatty acids, 5 total inorganic carbonate, 6 stability ratio of anaerobic digestion, 7 approx. 14107, 8 approx. 14731, 9 approx. 1.313

2.5. Data Analysis

We conducted a correlation analysis on the selected feature set, which includes H2 in both its liquid and gaseous forms, as well as VFA/TIC (FOS/TAC). We utilized two widely recognized correlation coefficients: Pearson’s and Spearman’s. Pearson’s correlation coefficient was chosen for its ability to assess the linear relationship between two continuous variables, particularly when changes in one variable correspond proportionally to changes in the other. In contrast, Spearman’s correlation coefficient was employed to evaluate the monotonic relationship between two continuous variables, as it relies on the ranked values of the variables rather than their raw data, making it effective regardless of the proportionality of changes.

3. Results and Discussion

During the 150 days of monodigestion, the total solids content of the substrate was mostly around 32.99 %, with an average loss by annealing of about 94.81 % of total solids (see Figure 6). The organic loading rate (OLR) was deliberately altered so that significant overloading by hydrogen evolution and subsequent regeneration occurred. Calculated for all 150 days of the experiment, the OLR ranged from 0–35.56 kgVS m−3d−1 with an average of 4.45 kgVS m−3d−1. Calculated for feeding days only, the average OLR was 1.396 kgVS m−3d−1, which is still a relatively low load for a mesophilic reactor. The average hydraulic retention time (HRT) was 55 days. The correlation between OLR and HRT can be seen in Figure 6. During overloading, the methane content in biogas was 70.4 %.
After the stabilization of the process, there was a gradual increase in biogas production from the 21st day, when biogas production increased dramatically. The most efficient process occurred at a load of approximately 13.93 kgVS m−3d−1 and a hydraulic retention time (HRT) of 24 days. The methane content remained high until the 40th day, but gas production decreased due to overload. Around the 70th day, the process stabilized again due to the omission of substrate doses and the subsequent low load (see Figure 7). The second loading of the process took place from the 90th day, when biogas production increased dramatically again. The most efficient process occurred at a load of approximately 18.87 kgVS m−3d−1 and a hydraulic retention time (HRT) of 21 days. Shortly after the equalization, methane production was unusually high, an expected phenomenon due to methanization of accumulated volatile acids.
The main digestate parameters are described in detail in Table 1. From the analysis in Figure 8, it is clear that the pH drop in the reactor occurred later, before the overloading started, leading to the accumulation of volatile fatty acids (VFA). This situation is a well-known phenomenon in the field of anaerobic treatment of organic materials. The limiting value for the ratio of volatile fatty acids to total inorganic carbon (VFA/TIC), which determines the stability of the process, appears to be approximately 0,4. This value is consistent with the commonly reported range [33,34] and indicates that the process was within the expected parameters.
Due to a significant dose reduction, the extreme overload (peak VFA/TIC of 4.62) was overcome in approximately 48 days. The evolution of the dissolved hydrogen concentration is shown in detail in Figure 9. The dissolved hydrogen concentration, measured using an amperometric microsensor, oscillated between 0 . 390   m g / d m−3 and 0 . 425   m g / d m−3. During the no-overload period, the typical H2(l) concentration was 0 . 12 ( 4 )   m g / d m−3, corresponding to a partial pressure of approximately 6000 Pa. During overload, the H2(l) concentration reached 0 . 40   m g / d m−3, corresponding to a partial pressure of about 20 000 Pa. Similarly high values were measured after initial heating of the inoculum at the beginning of the experiment. If the elevated hydrogen concentration persisted for several days, a rapid increase in volatile fatty acid content occurred.
An alternative parameter for assessing process stability, defined as the ratio of dissolved hydrogen concentration to neutralization capacity, is presented in detail in Figure 10. To date, this parameter has not demonstrated significantly greater sensitivity than the commonly used VFA/TIC ratio. After aligning the maxima of both peaks, it appears that the leading edges of both peaks coincide on the same process day. This behavior will require further validation across different co-fermentation processes In the case of the observed process, the new value of the parameter (H2(l)/TIC) * 48 000 reached a value of 1.0, which was a signal of instability. However, this signal appeared almost simultaneously when the VFA/TIC ratio increased above 0.4, indicating that acid formation is occurring rapidly. Some processes probably require overload suppression in the early stages. Since the detection limit of the H2(l) amperometric sensor is 0 . 5  μ g / d m−3, which corresponds to an H2(g) partial pressure of 10 Pa, and some studies mention incipient instabilities as low as 2 Pa [35], it is advisable to look for a more sensitive sensor. Another challenge is the robustness and durability of the amperometric sensor in a sludge environment, which is not yet satisfactory. Although a thermal conductivity detector can meet the requirements, there may be a problem with its sensitivity. Furthermore, it is important to correlate the H2(l) concentration profile with the acid concentration determined by GC-MS or isotachophoresis.
The graphs in Figure 10 and Figure 11 shows the values of the VFA/TIC and H2(l) and H2(g) throughout the experiment.The high Pearson correlation coefficient of 0.76 between H2 in liquid form and VFA/TIC suggests a likely linear relationship between these two variables, while the lower Spearman correlation coefficient of 0.55 indicates that the relationship may not be strictly monotonic. On the other hand, for H2 in its gaseous form, the Pearson correlation coefficient is relatively low at 0.34, but the higher Spearman correlation coefficient of 0.55 suggests that the relationship is more likely non-linear yet monotonic.
Subsequently our analysis was focused on the time-dependency in the data, thus we have calculated auto-correlation (Figure 12) and cross-correlation (Figure 13) coefficients for 14 days long time windows. H2 exhibits significant autocorrelation in both its gaseous and liquid states, though the duration of this autocorrelation differs. Gaseous H2 shows strong autocorrelation up to lag 5, while liquid H2 maintains autocorrelation for a longer period, up to lag 8. This suggests that the dissolved form of H2 retains its correlated structure over a longer time or sequence of observations compared to the gaseous form. In both forms of H2, the Pearson correlation coefficient is higher than the Spearman coefficient, indicating that the relationship between variables is more linear than monotonic.
As shown in Figure 13, for H2 in its gaseous form, the Spearman correlation coefficient is higher, indicating a more monotonic relationship. The cross-correlation coefficient increases over time, reaching its peak after lag 7, suggesting that the variables become cross-correlated after approximately one week. In contrast, for H2 in its liquid form, the Pearson correlation coefficient is higher, indicating a stronger linear relationship. However, the cross-correlation gradually decreases and becomes relatively weak after about one week (lag 8), suggesting that any linear dependency between the variables is likely short-term. In conclusion, H2 in its gaseous form shows a sustained monotonic relationship with VFA/TIC, becoming cross-correlated after about one week. Conversely, H2 in its liquid form exhibits a stronger but short-lived linear relationship, with cross-correlation weakening after a week. This indicates that while both forms of H2 interact with VFA/TIC, the gaseous form maintains a more prolonged interaction, whereas the dissolved form has a brief linear dependency.

4. Conclusions

A laboratory experiment confirmed that an amperometric dissolved hydrogen microsensor can be used to identify instabilities in the anaerobic digestion process. Unfortunately, the detection limit of the particular sensor used was not low enough to fully detect the beginnings of overloading. So far, no convincing evidence has been obtained for the effectiveness of the newly proposed process stability parameter in the form of the ratio of dissolved hydrogen concentration to neutralization capacity in detecting overloading. Initial statistical analyses suggest that there should be a linear correlation between VFA/TIC and H2(l), but this correlation is affected by the reactor overload condition. In order to fully understand these relationships, thorough experimental studies are necessary.

Author Contributions

Conceptualization, D.P. and J.R.; methodology, J.R.; software, R.S.; validation, D.P., J.R. and M.V.; formal analysis, R.S.; investigation, D.P. and J.R.; data curation, D.P.; writing—original draft preparation, M.V.; visualization, R.S. and M.V.; supervision, J.R. All authors have read and agreed to the published version of the manuscript.

Funding

This work was financially supported by the European Union – Operational Programme Just Transition under the project REFRESH – Research Excellence For REgion Sustainability and High-tech Industries, project [No. CZ.10.03.01/00/22_003/0000048]. Experimental results were accomplished by using the Large Research Infrastructure ENREGAT supported by the Ministry of Education, Youth and Sports of the Czech Republic under project [No. LM2023056].

Data Availability Statement

Dataset available on request from the authors.

Conflicts of Interest

The authors declare no conflicts of interest.

Abbreviations

The following abbreviations are used in this manuscript:
FOS Flüchtige Organische Säuren
HRT Hydraulic retention time
OLR Organic loading rate
TAC Totales Anorganisches Carbonat
TS Total solids
TIC Total inorganic carbon
TLA Three letter acronym
VFA Volatile fatty acids

References

  1. Platošová, D.; Rusín, J.; Platoš, J.; Smutná, K.; Buryjan, R. Case study of anaerobic digestion process stability detected by dissolved hydrogen concentration. Processes 2021, 9, 106. [CrossRef]
  2. Giovannini, G.; Donoso-Bravo, A.; Jeison, D.; Chamy, R.; Ruíz-Filippi, G.; Wouwer, A.V. A review of the role of hydrogen in past and current modelling approaches to anaerobic digestion processes. International Journal of Hydrogen Energy 2016, 41, 17713–17722. [CrossRef]
  3. Strong, G.; Cord-Ruwisch, R. An in situ dissolved-hydrogen probe for monitoring anaerobic digesters under overload conditions. Biotechnology and bioengineering 1995, 45, 63–68. [CrossRef]
  4. Ruggeri, B.; Tommasi, T.; Sanfilippo, S. BioH2 & BioCH4 through anaerobic digestion: from research to full-scale applications; Springer, 2015.
  5. Batstone, D.J.; Virdis, B. The role of anaerobic digestion in the emerging energy economy. Current opinion in biotechnology 2014, 27, 142–149. [CrossRef]
  6. Richard, E.N.; Hilonga, A.; Machunda, R.L.; Njau, K.N. A review on strategies to optimize metabolic stages of anaerobic digestion of municipal solid wastes towards enhanced resources recovery. Sustainable Environment Research 2019, 29, 1–13. [CrossRef]
  7. Wang, P.; Wang, H.; Qiu, Y.; Ren, L.; Jiang, B. Microbial characteristics in anaerobic digestion process of food waste for methane production–A review. Bioresource technology 2018, 248, 29–36. [CrossRef]
  8. Menzel, T.; Neubauer, P.; Junne, S. Role of microbial hydrolysis in anaerobic digestion. Energies 2020, 13, 5555. [CrossRef]
  9. Dahiya, S.; Lingam, Y.; Mohan, S.V. Understanding acidogenesis towards green hydrogen and volatile fatty acid production–critical analysis and circular economy perspective. Chemical Engineering Journal 2023, 464, 141550. [CrossRef]
  10. Müller, V.; Frerichs, J. Acetogenic bacteria. eLS 2013.
  11. Bundhoo, M.Z.; Mohee, R. Inhibition of dark fermentative bio-hydrogen production: a review. International Journal of Hydrogen Energy 2016, 41, 6713–6733. [CrossRef]
  12. Zappi, A.; Hernandez, R.; Holmes, W. A review of hydrogen production from anaerobic digestion. International Journal of Environmental Science and Technology 2021, 18, 4075–4090.
  13. Cazier, E.A.; Trably, E.; Steyer, J.P.; Escudié, R. Biomass hydrolysis inhibition at high hydrogen partial pressure in solid-state anaerobic digestion. Bioresource technology 2015, 190, 106–113. [CrossRef]
  14. Anukam, A.; Mohammadi, A.; Naqvi, M.; Granström, K. A review of the chemistry of anaerobic digestion: Methods of accelerating and optimizing process efficiency. Processes 2019, 7, 504. [CrossRef]
  15. Saady, N.M.C. Homoacetogenesis during hydrogen production by mixed cultures dark fermentation: unresolved challenge. International Journal of Hydrogen Energy 2013, 38, 13172–13191. [CrossRef]
  16. Uddin, M.M.; Wright, M.M. Anaerobic digestion fundamentals, challenges, and technological advances. Physical Sciences Reviews 2023, 8, 2819–2837. [CrossRef]
  17. Ahring, B.K. Perspectives for anaerobic digestion. Biomethanation i 2003, pp. 1–30.
  18. Meegoda, J.N.; Li, B.; Patel, K.; Wang, L.B. A review of the processes, parameters, and optimization of anaerobic digestion. International journal of environmental research and public health 2018, 15, 2224.
  19. Laiq Ur Rehman, M.; Iqbal, A.; Chang, C.C.; Li, W.; Ju, M. Anaerobic digestion. Water Environment Research 2019, 91, 1253–1271.
  20. Harirchi, S.; Wainaina, S.; Sar, T.; Nojoumi, S.A.; Parchami, M.; Parchami, M.; Varjani, S.; Khanal, S.K.; Wong, J.; Awasthi, M.K.; et al. Microbiological insights into anaerobic digestion for biogas, hydrogen or volatile fatty acids (VFAs): a review. Bioengineered 2022, 13, 6521–6557. [CrossRef]
  21. Wainaina, S.; Lukitawesa.; Kumar Awasthi, M.; Taherzadeh, M.J. Bioengineering of anaerobic digestion for volatile fatty acids, hydrogen or methane production: a critical review. Bioengineered 2019, 10, 437–458. [CrossRef]
  22. Huck, C.; Poghossian, A.; Wagner, P.; Schöning, M.J. Combined amperometric/field-effect sensor for the detection of dissolved hydrogen. Sensors and Actuators B: Chemical 2013, 187, 168–173. [CrossRef]
  23. Xiong, L.; Compton, R.G. Amperometric gas detection: A review. International Journal of Electrochemical Science 2014, 9, 7152–7181.
  24. Hübert, T.; Boon-Brett, L.; Black, G.; Banach, U. Hydrogen sensors–a review. Sensors and Actuators B: Chemical 2011, 157, 329–352.
  25. Chang, S.; Stetter, J.; Cha, C. Amperometric gas sensors. Talanta 1993, 40, 461–477.
  26. Dobrovol’skii, Y.A.; Leonova, L.; Ukshe, A.; Levchenko, A.; Baranov, A.; Vasil’ev, A. Portable sensors for hydrogen analysis. Russian Journal of General Chemistry 2007, 77, 797–806.
  27. Kriksunov, L.B.; Macdonald, D.D. Amperometric hydrogen sensor for high-temperature water. Sensors and Actuators B: Chemical 1996, 32, 57–60. [CrossRef]
  28. Fuksa, P.; Hakl, J.; Míchal, P.; Hrevušová, Z.; Šantrůček, J.; Tlustoš, P. Effect of silage maize plant density and plant parts on biogas production and composition. Biomass and Bioenergy 2020, 142, 105770. [CrossRef]
  29. 2012, E.. Sludge, treated biowaste and soil. Determination of pH, 2012.
  30. 2012, E.. Sludges, Treated Biowaste, Soils and Wastes—Calculation of the Total Solids Content after Determination of the Drying Residue or Water Content, 2012.
  31. 2012, E.. Sludge, treated biowaste, soil and waste-Determination of loss on ignition, 2012.
  32. Liu, X.; André, L.; Mercier-Huat, M.; Grosmaître, J.M.; Pauss, A.; Ribeiro, T. Accurate estimation of bicarbonate and acetic acid concentrations with wider ranges in anaerobic media using classical FOS/TAC titration method. Applied Sciences 2021, 11, 11843. [CrossRef]
  33. Raposo, F.; De la Rubia, M.; Fernández-Cegrí, V.; Borja, R. Anaerobic digestion of solid organic substrates in batch mode: an overview relating to methane yields and experimental procedures. Renewable and sustainable energy reviews 2012, 16, 861–877.
  34. Borja, R.; Rincón, B.; Raposo, F.; Domınguez, J.; Millán, F.; Martın, A. Mesophilic anaerobic digestion in a fluidised-bed reactor of wastewater from the production of protein isolates from chickpea flour. Process Biochemistry 2004, 39, 1913–1921. [CrossRef]
  35. Cord-Ruwisch, R.; Mercz, T.I.; Hoh, C.Y.; Strong, G.E. Dissolved hydrogen concentration as an on-line control parameter for the automated operation and optimization of anaerobic digesters. Biotechnology and bioengineering 1997, 56, 626–634.
Figure 2. Scheme of the amperomatric sensor. The basic setup requires two electrodes - a sensing electrode and a reference electrode. However, most transducers include a reference electrode and a potentiostat is commonly used to maintain a constant voltage. The electrodes are usually composed of a noble metal, such as platinum, which also acts as a catalyst for the hydrogen oxidation reaction [24].
Preprints 139245 g002
Figure 3. Scheme of the experiment.
Preprints 139245 g003
Figure 4. To ensure consistency and uniformity in the anaerobic digestion process, the corn silage was milled before the experiment using a TS-32T400V screw mill (RM Gastro s.r.o., Prague, Czech Republic) with round holes of 6 mm in diameter.
Preprints 139245 g004
Figure 5. Terrafors IS rotary drum bioreactor during the testing.
Preprints 139245 g005
Figure 6. The correlation between OLR and HRT. Considering the risk of overload, shortening the HRT would only be feasible if the substrate is co-fermented in a nutritionally balanced mixture.
Preprints 139245 g006
Figure 7. Time progression of the basic parameters monitored in the experiment. The black line represents the evolution of biogas production, while the red line indicates the methane content within the biogas.
Preprints 139245 g007
Figure 8. Process stability monitoring. Comparison of the VFA/TIC ratio and the proposed dissolved hydrogen/TIC parameter.
Preprints 139245 g008
Figure 9. The evolution of dissolved hydrogen concentration during the experiment. The small peak in H2(l) concentration that occurred around day 105 was due to a four-day period of reactor starvation due to the Easter holiday, followed by a period of high substrate doses.
Preprints 139245 g009
Figure 10. Time progression of VFA/TIC values (red) and dissolved hydrogen concentration (blue) throughout the experiment.
Preprints 139245 g010
Figure 11. Time progression of VFA/TIC values (red) and gaseous hydrogen concentration (blue) throughout the experiment.
Preprints 139245 g011
Figure 12. Auto-correlation coefficients for H2 in liquid and gas form.
Preprints 139245 g012
Figure 13. Cross-correlation coefficients for H2 in liquid and gas form.
Preprints 139245 g013
Disclaimer/Publisher’s Note: The statements, opinions and data contained in all publications are solely those of the individual author(s) and contributor(s) and not of MDPI and/or the editor(s). MDPI and/or the editor(s) disclaim responsibility for any injury to people or property resulting from any ideas, methods, instructions or products referred to in the content.
Copyright: This open access article is published under a Creative Commons CC BY 4.0 license, which permit the free download, distribution, and reuse, provided that the author and preprint are cited in any reuse.
Prerpints.org logo

Preprints.org is a free preprint server supported by MDPI in Basel, Switzerland.

Subscribe

Disclaimer

Terms of Use

Privacy Policy

Privacy Settings

© 2025 MDPI (Basel, Switzerland) unless otherwise stated