Submitted:
07 November 2024
Posted:
07 November 2024
You are already at the latest version
Abstract
The migration of cells during the healing process is supported by an electrical potential difference that develops between the edges of skin wounds and the center of the wound. The electrical potential in cells' membranes is responsible for their migration in an electric field. The transmembrane electrochemical gradient differences cause this potential., Concomitant blockade of potassium and calcium channels by amiodarone at a medium dosage favored wound healing [1,2], but the effect was less intense than in the case of selective blocking of potassium channels. This suggested that blocking calcium channels partially antagonizes the effect of blocking potassium channels [8,9]. Since nimodipine blocks both L-type and T-type calcium channels, we decided to study which of these calcium channels are involved in wound healing. Hence, we performed an experimental study in which nimodipine was used in 3 concentrations: 200nM, which block only L-type calcium channels, 1000nM that block both L-type and T-type calcium channels and 10,000 nM, respectively, that block calcium channels and activate CB1 cannabinoid receptors. Blocking of calcium channels favored wound healing under our experimental conditions, but this happened only by simultaneously blocking of the L-type and T-type calcium channels, because only the medium nimodipine concentration had a statistically significant effect.
Keywords:
wound healing
; calcium channels
; nimodipine
1. Introduction
The initial phase of an injury always involves the release of lymph fluid and blood. A hemostasis that is suitable is achieved during this process. The activation of both extrinsic and intrinsic coagulation pathways is crucial in stopping blood loss. In the damaged endothelial mucosa appears arterial vasoconstriction, which causes platelets to aggregate [3,4]. The process of thrombosis is initiated when platelets clump up due to the release of adenosine 5'-diphosphate (ADP). The influx of white blood cells and platelets is enabled by this short term vasoconstriction, which is followed by vasodilation [5].
The inflammatory phase is initiated by hemostasis and chemotaxis. White blood cells and platelets speed up the inflammatory process because they release more mediators and cytokines [6,7]. Collagen degradation, fibroblast transformation, new vessel growth, and reepithelization are all facilitated by other factors, not just platelet-derived growth factor [8,9,10]. All processes take place at the same time, but with synchronization. The release of mediators like serotonin and histamine from platelets leads to an increase in cellular permeability. Fibroblasts are attracted to platelet-derived growth factor and, when combined with transformative growth factor, the division and multiplication of fibroblasts is improved. In the process, collagen is synthesized by fibroblasts [7].
Activation of platelets results in the formation of a fibrin scaffold, which develops where inflammatory cells like neutrophils, monocytes, and endothelial cells adhere. The decontamination of the wound is possible due to neutrophils' ability to phagocytose cell debris and bacteria.
The proliferation or granulation phase is ongoing in the background and not at a specific time.
New collagen and glycosaminoglycans start being deposited by fibroblasts on days 5-7. The core of the wound is formed by these proteoglycans and they help to stabilize it. Afterward, the process of reepithelization is initiated by the migration of cells from the wound's periphery and adjacent edges. The wound is initially covered by a thin superficial layer of epithelial cells, but a thicker and more durable layer of cells will eventually cover it. Angiogenesis, which creates new blood vessels from existing ones, and vasculogenesis, which creates new vessels from endothelial progenitor cells (EPCs), both play a role in neovascularization [7,11].
As soon as the collagen fibers are placed on the fibrin frame, the wound starts to grow. The wound begins to contract with the aid of the steady accumulation of fibroblasts and myofibroblasts.
Starting around week 3, the maturation or remodeling period can last for up to 12 months. In week 3 the contraction of the wound is the highest, as the excess collagen degrades. Secondary healing has a higher rate of wound contraction than primary healing. It takes approximately 11 to 14 weeks for the incision wound to achieve its maximum tensile strength. The final scar won't have 100% of the original wound strength, and only roughly 80% of the tensile strength will remain [4,7,12].
Data from the literature suggest that at the level of the skin wounds a difference in electrical potential develops between the edges of the wound and the center of the wound, that favors the migration of the cells in their healing process [13,14]. Tissue homeostasis and elemental electricity are altered by injury, which disrupts solid cell junctions that make up skin, which is considered a kind of natural battery. By using the injury potential generated in the form of electrical current and field, it is possible to guide cell migration and close the wound gap; when the electrical signal is not present, wound healing is negatively impacted. Modified electrical signals can be a threat to a range of cell types, including fibroblasts, endothelial cells, inflammatory cells, and keratinocytes, inducing skin damage [1,15,16,17,18]. In contrast, the wound healing process can be accelerated if biological electricity is balanced. Injury to the human epidermis causes a decrease in transepithelial potential (TEP) that causes an endogenous direct current and generation of an epithelial electric field (EEF). This could be involved in wound reepithelization. TEP in epithelial tissues is caused by sodium transport through the epidermis [1,19,20,21]. The Na+/K+ ATPase pumps located at the bottom of the cell and the sodium channels located on the apical of the cells are responsible for this transport. The cells use sodium channels to enter and extrude Na+ ions, which is done by Na+/ K+ /pumps ATPase, in order to keep a low level of Na+ inside [1,20,22,23]. The basal layer of the epidermis has a higher ion concentration than the upper layers, which is the favorable effect of differential transport on an ionic gradient. When skin regeneration is finished, TEP is restored in the epidermis surrounding the wound [1,7,20,23,24,25]. The mechanism that brings it back is still unknown.
Endogenous cannabinoids are involved in the synaptic transmission of the postsynaptic membrane to the presynaptic button, which is a synaptic inhibitor. Some drugs such as paracetamol are converted to endogenous cannabinoid derivatives and may increase endogenous cannabinoid effects [26].
Amiodarone is a substance that blocks several types of ion channels but at different concentrations: at low concentrations it blocks only potassium channels, at medium concentrations the potassium and calcium channels, and at high concentrations blocks the potassium, calcium and sodium channels [1,20,27]. Data from previous studies have shown that wound healing is positively impacted by only low-concentration amiodarone, which only blocks potassium channels [1,2]. However, compared with the control group, amiodarone at medium concentration had a lower effect than amiodarone at low concentration and higher than amiodarone at high concentration, suggesting that they caused a faster healing of lesions compared to the control group, but the results were not statistically significant different from the control group except for the low concentration amiodarone [1,2].
Concomitant blockade of potassium and calcium channels through an average concentration of amiodarone also favored wound healing, but the effect was less intense than in the case of selective blocking of potassium channels. This left the impression that blocking calcium channels partially antagonizes the effect of blocking potassium channels [8,9]. Since nimodipine blocks both L-type calcium channels and T-type calcium channels, we decided to study which of these calcium channels are involved in wound healing [28].
For this study, we performed the following experimental study in which nimodipine was used in 3 concentrations: 200nM, which block only L-type calcium channels, 1000nM that block both L-type calcium channels and T-type calcium channels and 10,000 nM, respectively, that block calcium channels and activate CB1 cannabinoid receptors [28,29,30].
2. Materials and Methods
All experiments were conducted in accordance with the protocols approved by Carol Davila University of Medicine Bucharest Institutional Animal care and use Committee.
The experiment involved 30 albino male Wistar rats. Two round lesions with diameters measuring 8 mm, starting from the occiput (dorsal, and caudal) were done in each animal while being anesthetized with ketamine and xylazine; after removing hair, we used a punch biopsy dermatome designed for veterinary use by Kai Industries Co. Itd. to perform skin excision [1,2,31,32].
The animals were divided into 5 groups of 6 animals each (2 lesions for each animal): group number 1 was untreated (NAT), group number 2 was treated with excipients used for preparing nimodipine solutions (sodium citrate and ethyl alcohol) (EXC), group number 3 was treated with nimodipine in a concentration of 200 nM (N1), group number 4 was treated with nimodipine at a concentration of 1000 nM (N2), group number 5 was treated with nimodipine at a concentration of 10000 nM (N3). Each animal was treated twice daily by topical administration of the substance corresponding to each group until the healing of the lesions.
Each lesion was photographed from the same distance and with the same degree of image magnification, every other day for the first nine days and then every three days, until day 15, respectively at time t1 - day 1 from the the injury, t2 - day 3 (figure 1a and figure 2a), t3 - day 5, t4 - day 7, t5 - day 9, t6 - day 12, t7 - day 15 [33]. Using an Image J program, the area of each lesion measured in pixels was calculated at each time of the recording [1,2].
The main parameter analyzed was the mean duration of wound healing in each group.
In addition to this, secondary parameters were also analyzed, namely the percentage decrease of the lesional surfaces and the average speed percentage per day of the lesional surfaces.
The following parameters were calculated for each rat and time of measurement:
- a)
- The main parameter - the duration of wound healing measured in days
- b)
- Secondary parameters
- The percentage decrease of the area relative to the value of the initial area, according to the formula
- 2.
- The percentage speed decrease of the lesion surface according to the formula
- 3.
- The area under the evolution curve of the lesional surface over time according to the formula:
For each group, the averages and standard deviations of the 3 parameters were calculated at each moment of the measurement and the statistical significance was investigated by the T-Student test. The control group was considered, in the hypothesis of the research, the natural evolution group. It was considered that the differences between the groups for each moment of the measurement are statistically significant if p <0.05 for the main parameter and p<0.02 for secondary parameters, because the Bonferroni method was applied in order not to produce an alpha risk inflation [1,2].
3. Results
3.1. Main Parameter
3.1.1. Average Duration of Wound Healing
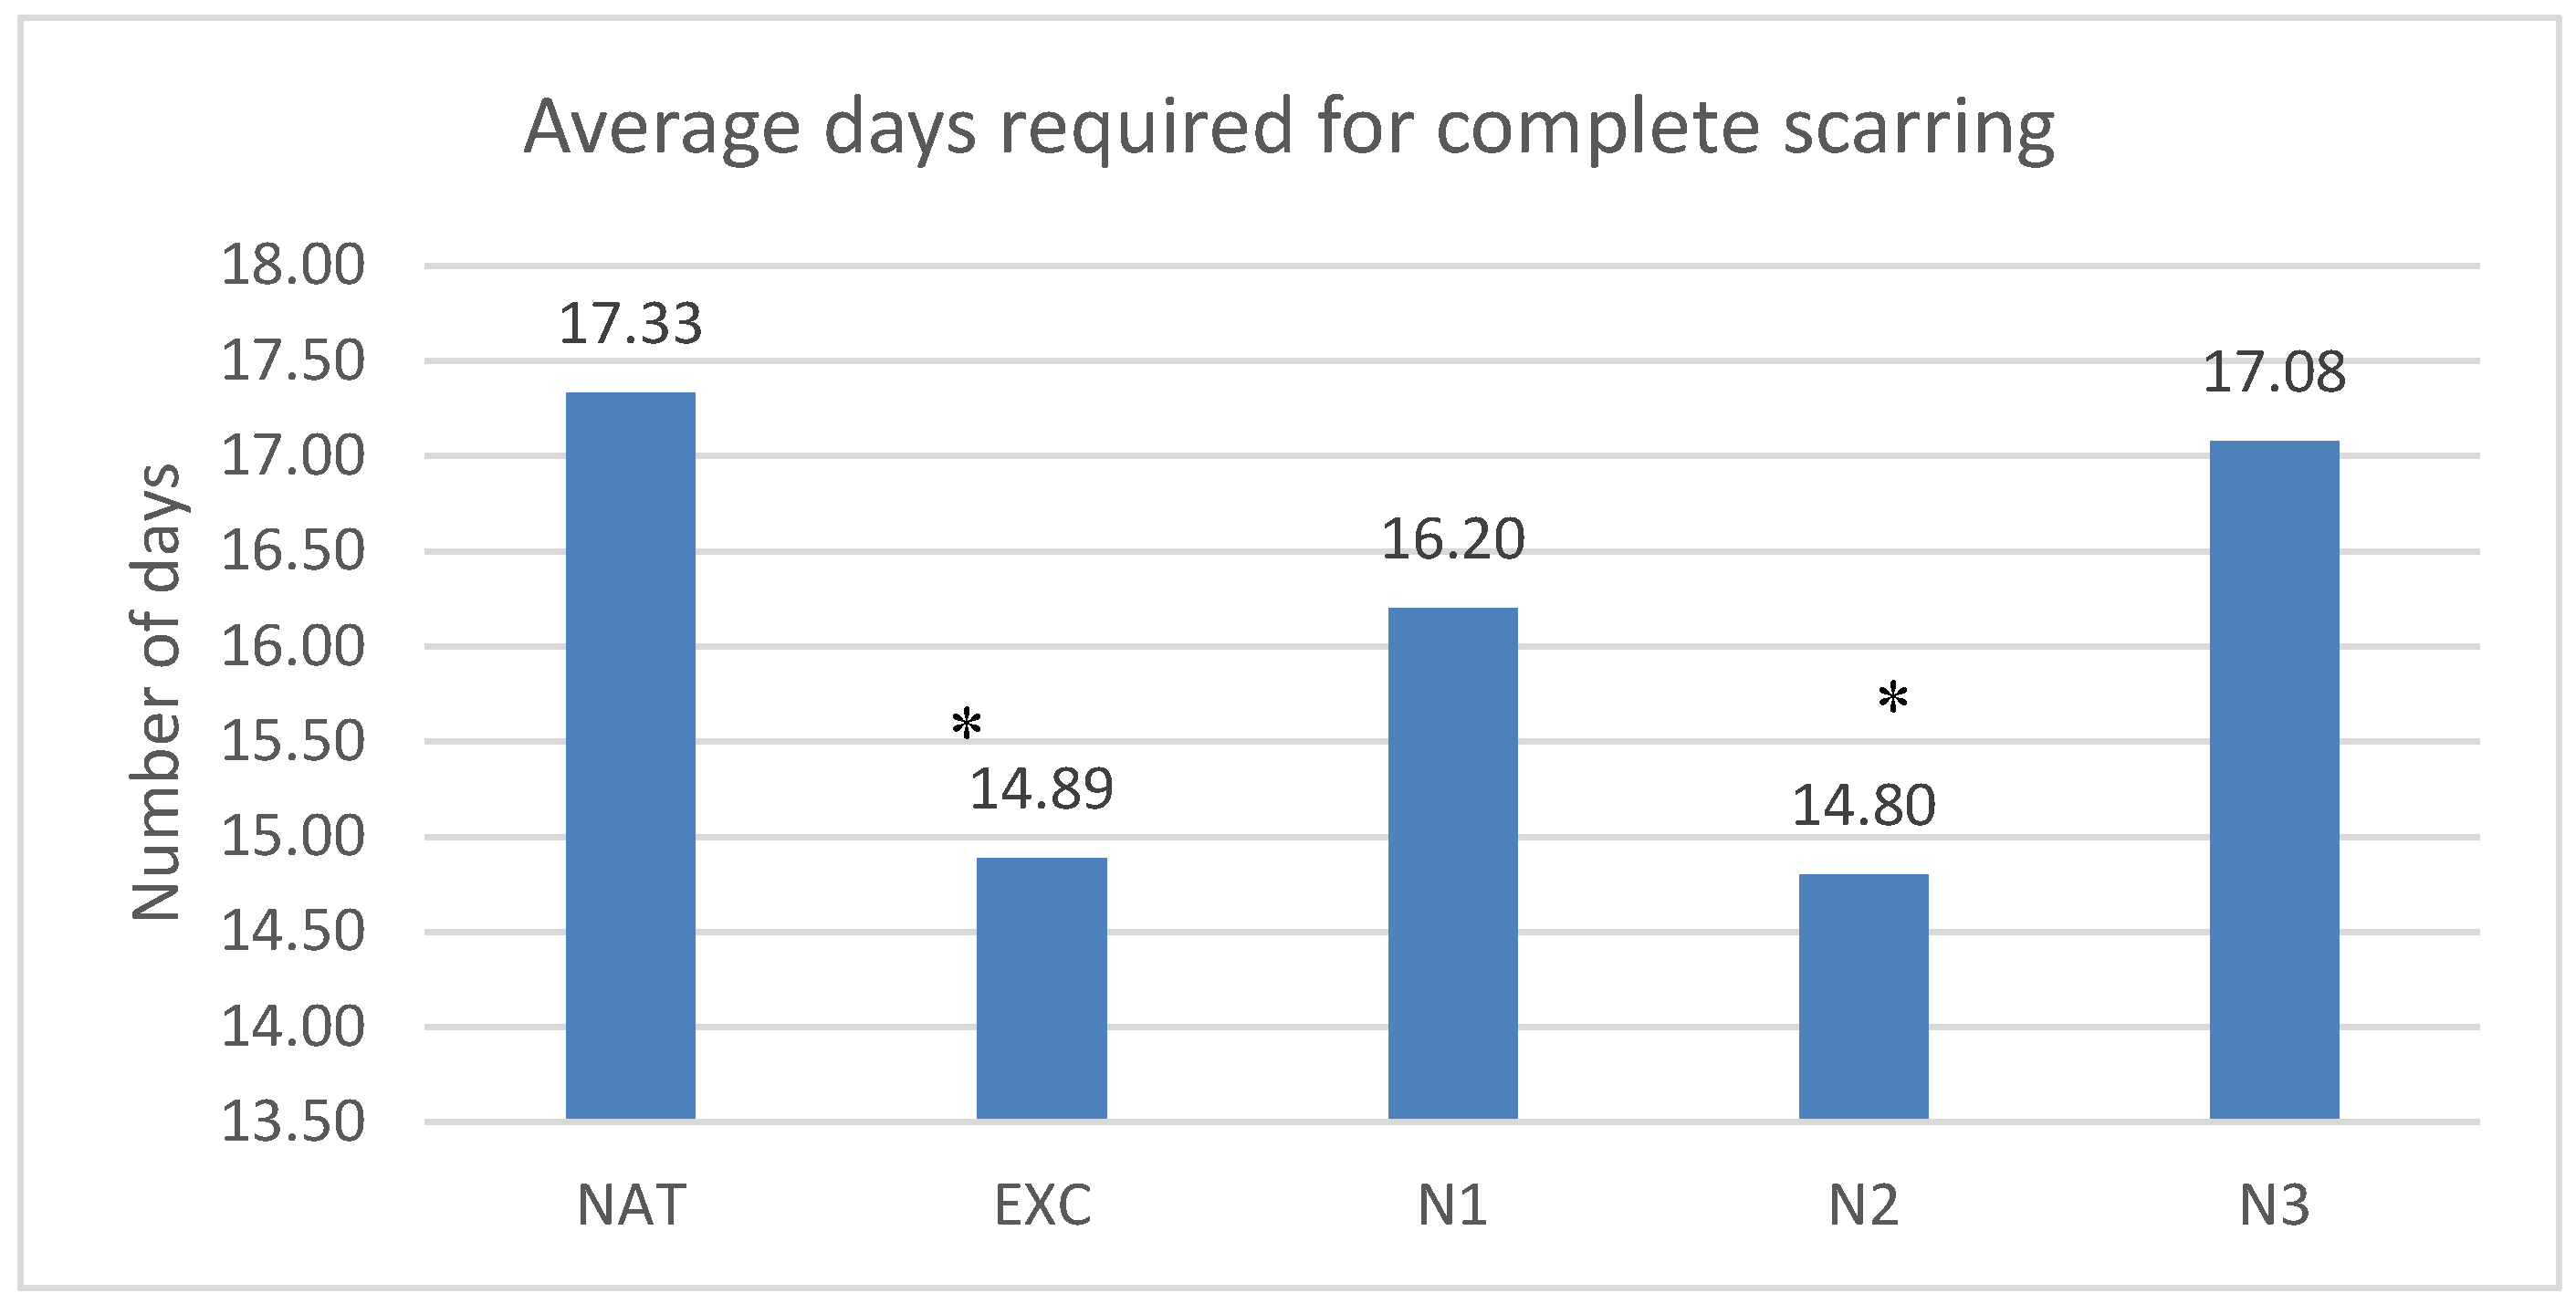
The lesions healed in the untreated group in average 17.33±6.37 days, in the group treated with excipients in 14.89±5.84 days, in the group treated with nimodipine in low concentration in 16.2±6.38 days, in the group treated with nimodipine in medium concentration in 14.8±5.6 days and in the group treated with nimodipine in high concentration in 17.07±6.46 days. Statistically significant differences with the control group were observed for the groups treated with nimodipine in medium concentration and the groups treated with excipients (p<0.04 and p<0.04)
The results are presented in Graph 1.
Graph 1.
Time needed to complete the scar. Each column represents the average number of days needed to complete wound healing for the 5 groups of rats: NAT (untreated), EXC (treated with excipients), N1 (low nimodipine concentration), N2 (medium N concentration), N3 (high N concentration). *=p 0.05, ** = p 0.01, ***=p 0.001
1.2. Secondary Parameters
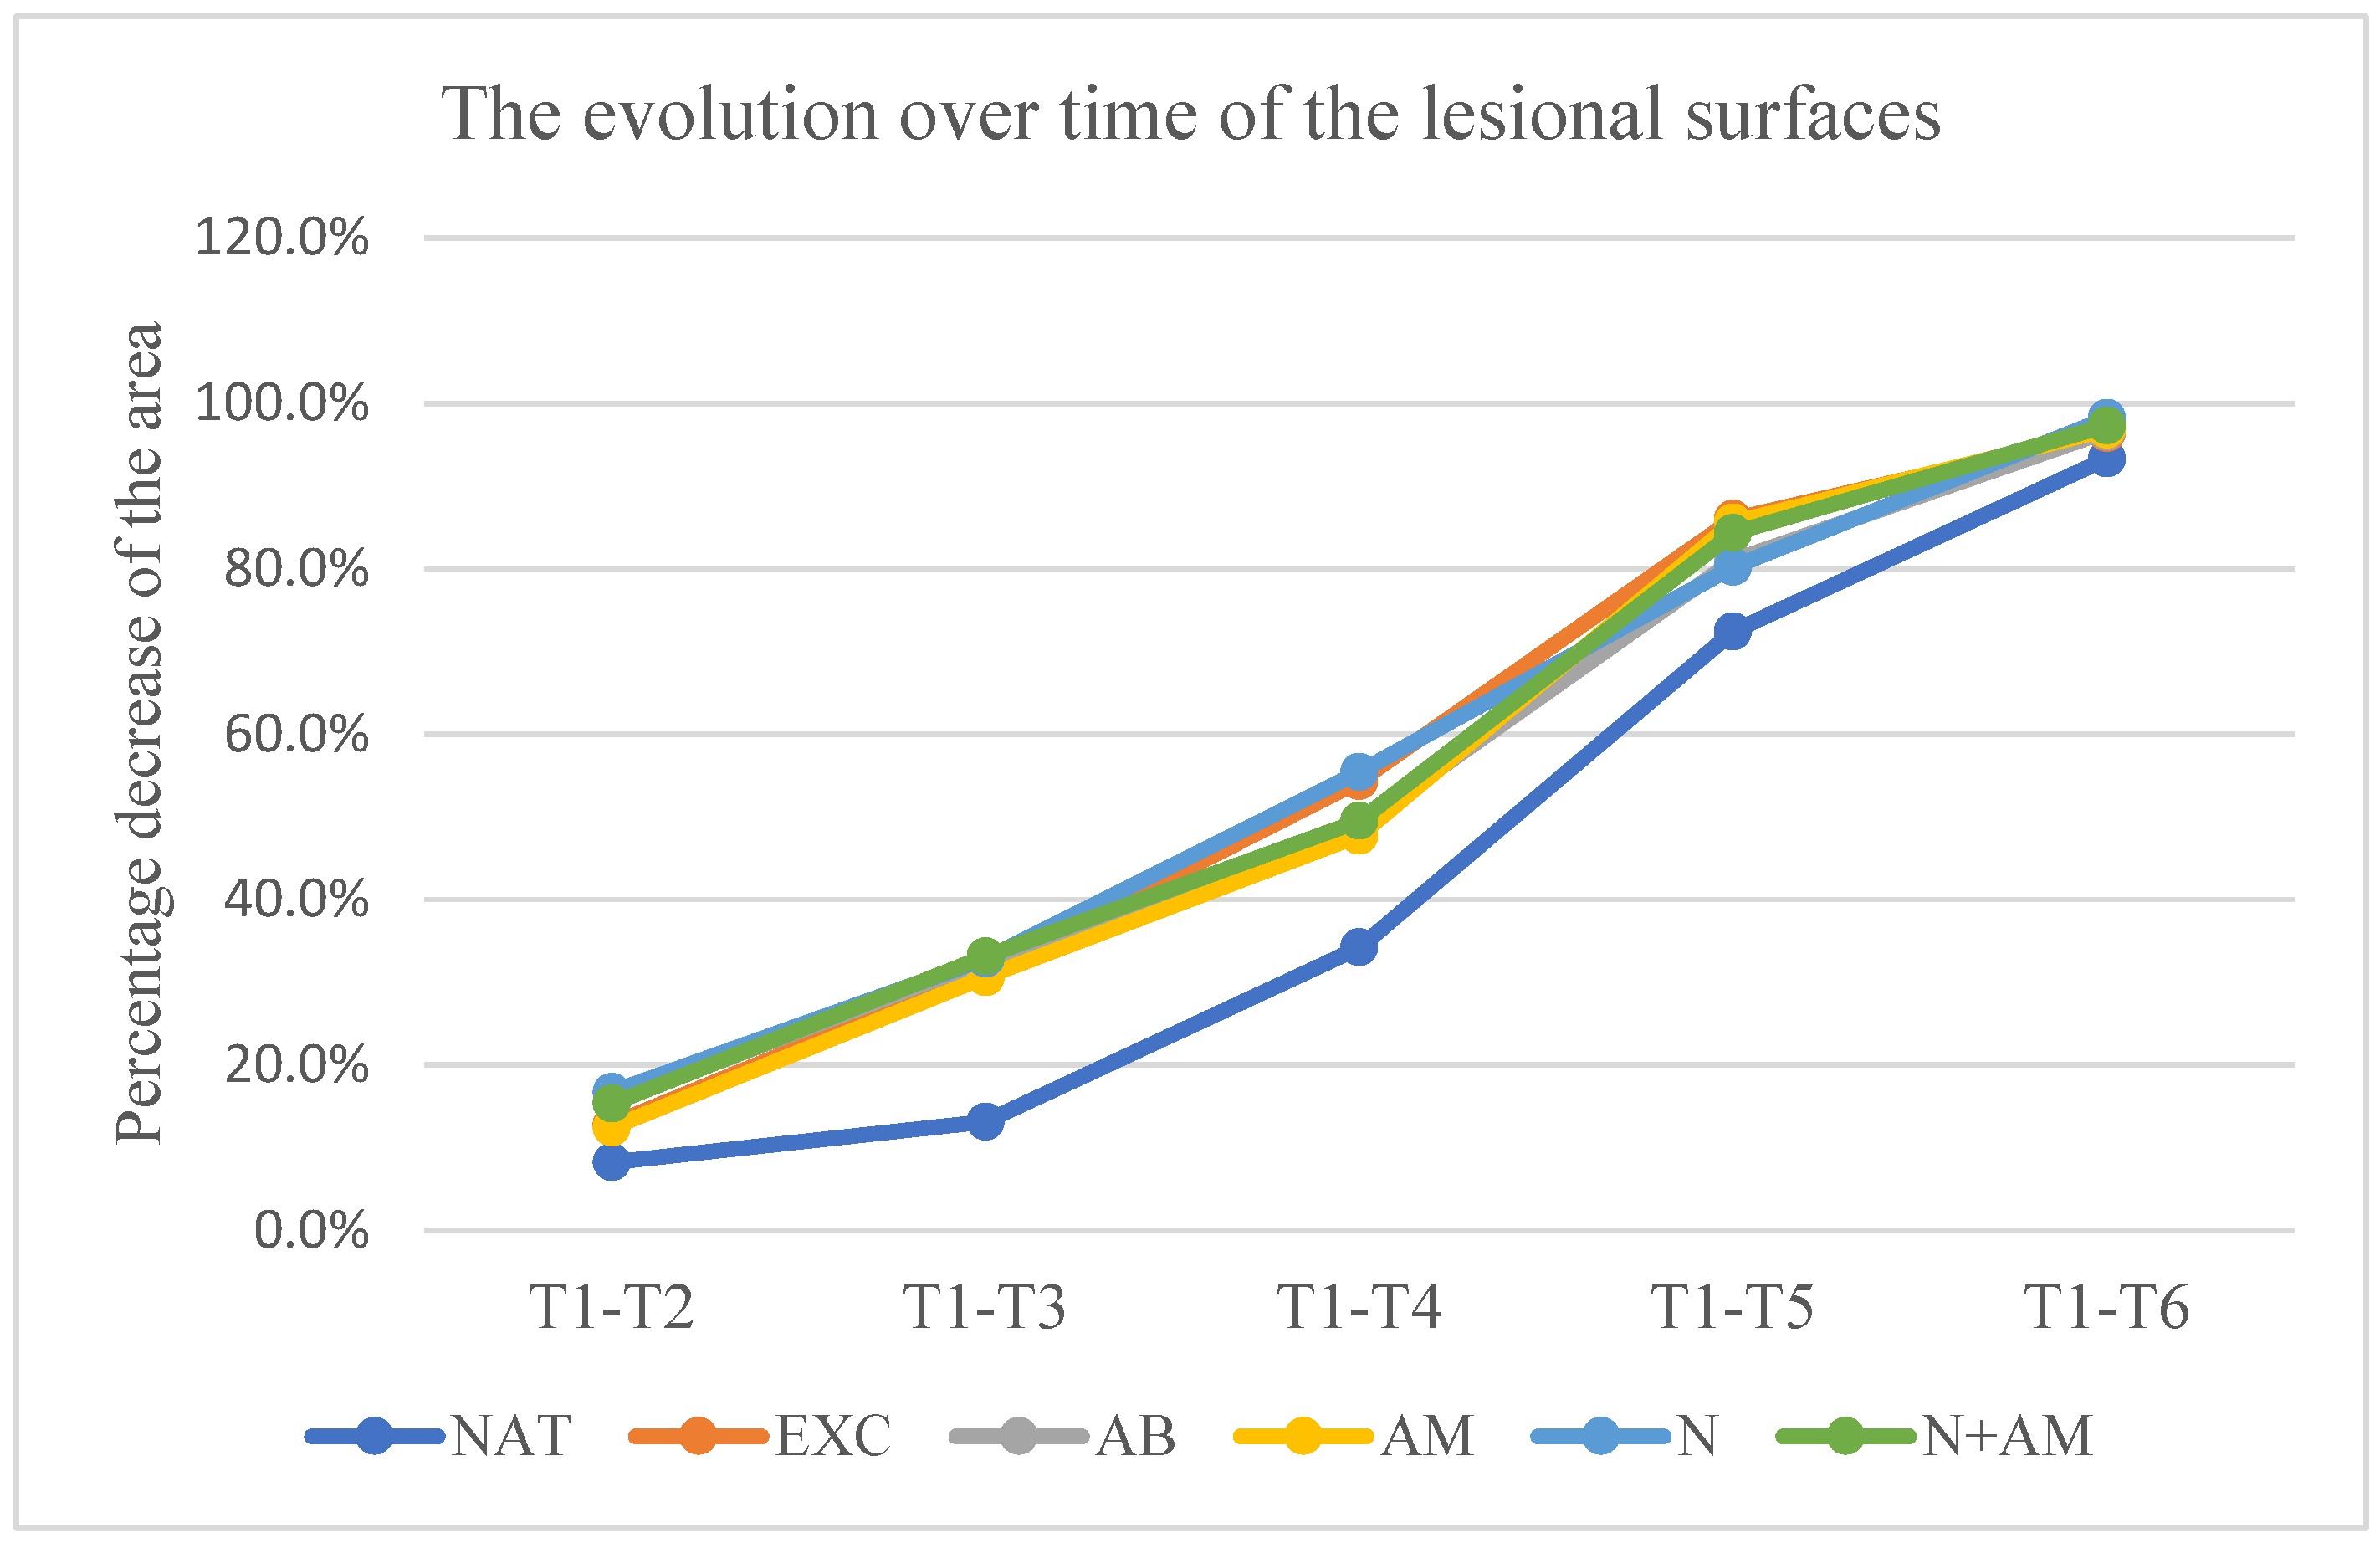
3.2.1. Percentage Decrease of the Lesion Surfaces Relative to the Initial Surface
The lesion surfaces experienced a decrease in percentage compared to the initial surface, as measured by the following values:
- in the untreated group at time: t2-18.8% ±9.92, t3– 27.3%±11.02, t4-48%±11.56, t5- 70.7%±8.24, t6– 89.1%±6.03;
- in the group treated with excipients at time: t2-18.5% ±11.93, t3- 35.4%±12.12, t4– 57.4%±14.66, t5-76.4%±12.91, t6- 94%±5.89;
- In the group treated with nimodipine in a concentration of 200 Nm at time t2-13.80% ±9.22, t3- 35.1%±20.7, t4- 54.7%±18.99, t5-70.1%±19.99, t6- 87.3%±14.08;
- In the group treated with nimodipine in a concentration of 1000 Nm at time t2-14.88% ±13.98, t3– 35.7%±21.2, t4– 56%±12.85, t5-73.7%±17.1, t6- 88.5%±16.40;
- In the group treated with nimodipine in a concentration of 10000 Nm at time: t2-12.77% ±12.84, t3-13.43%±8.97, t4– 52.9%±37.4, t5-73.5%±14.24, t6- 89.6%±24.4.
No statistically significant difference in relation to the untreated group was recorded at any time of measurement in the groups treated with nimodipine.
Graph 2.
Evolution over time of the lesion surfaces. Vertical is the percentage difference between the initial surface and the surface at the time of measurement in relation to the initial surface. Horizontal are the days in which the measurements counted since the start of the experiment were made.
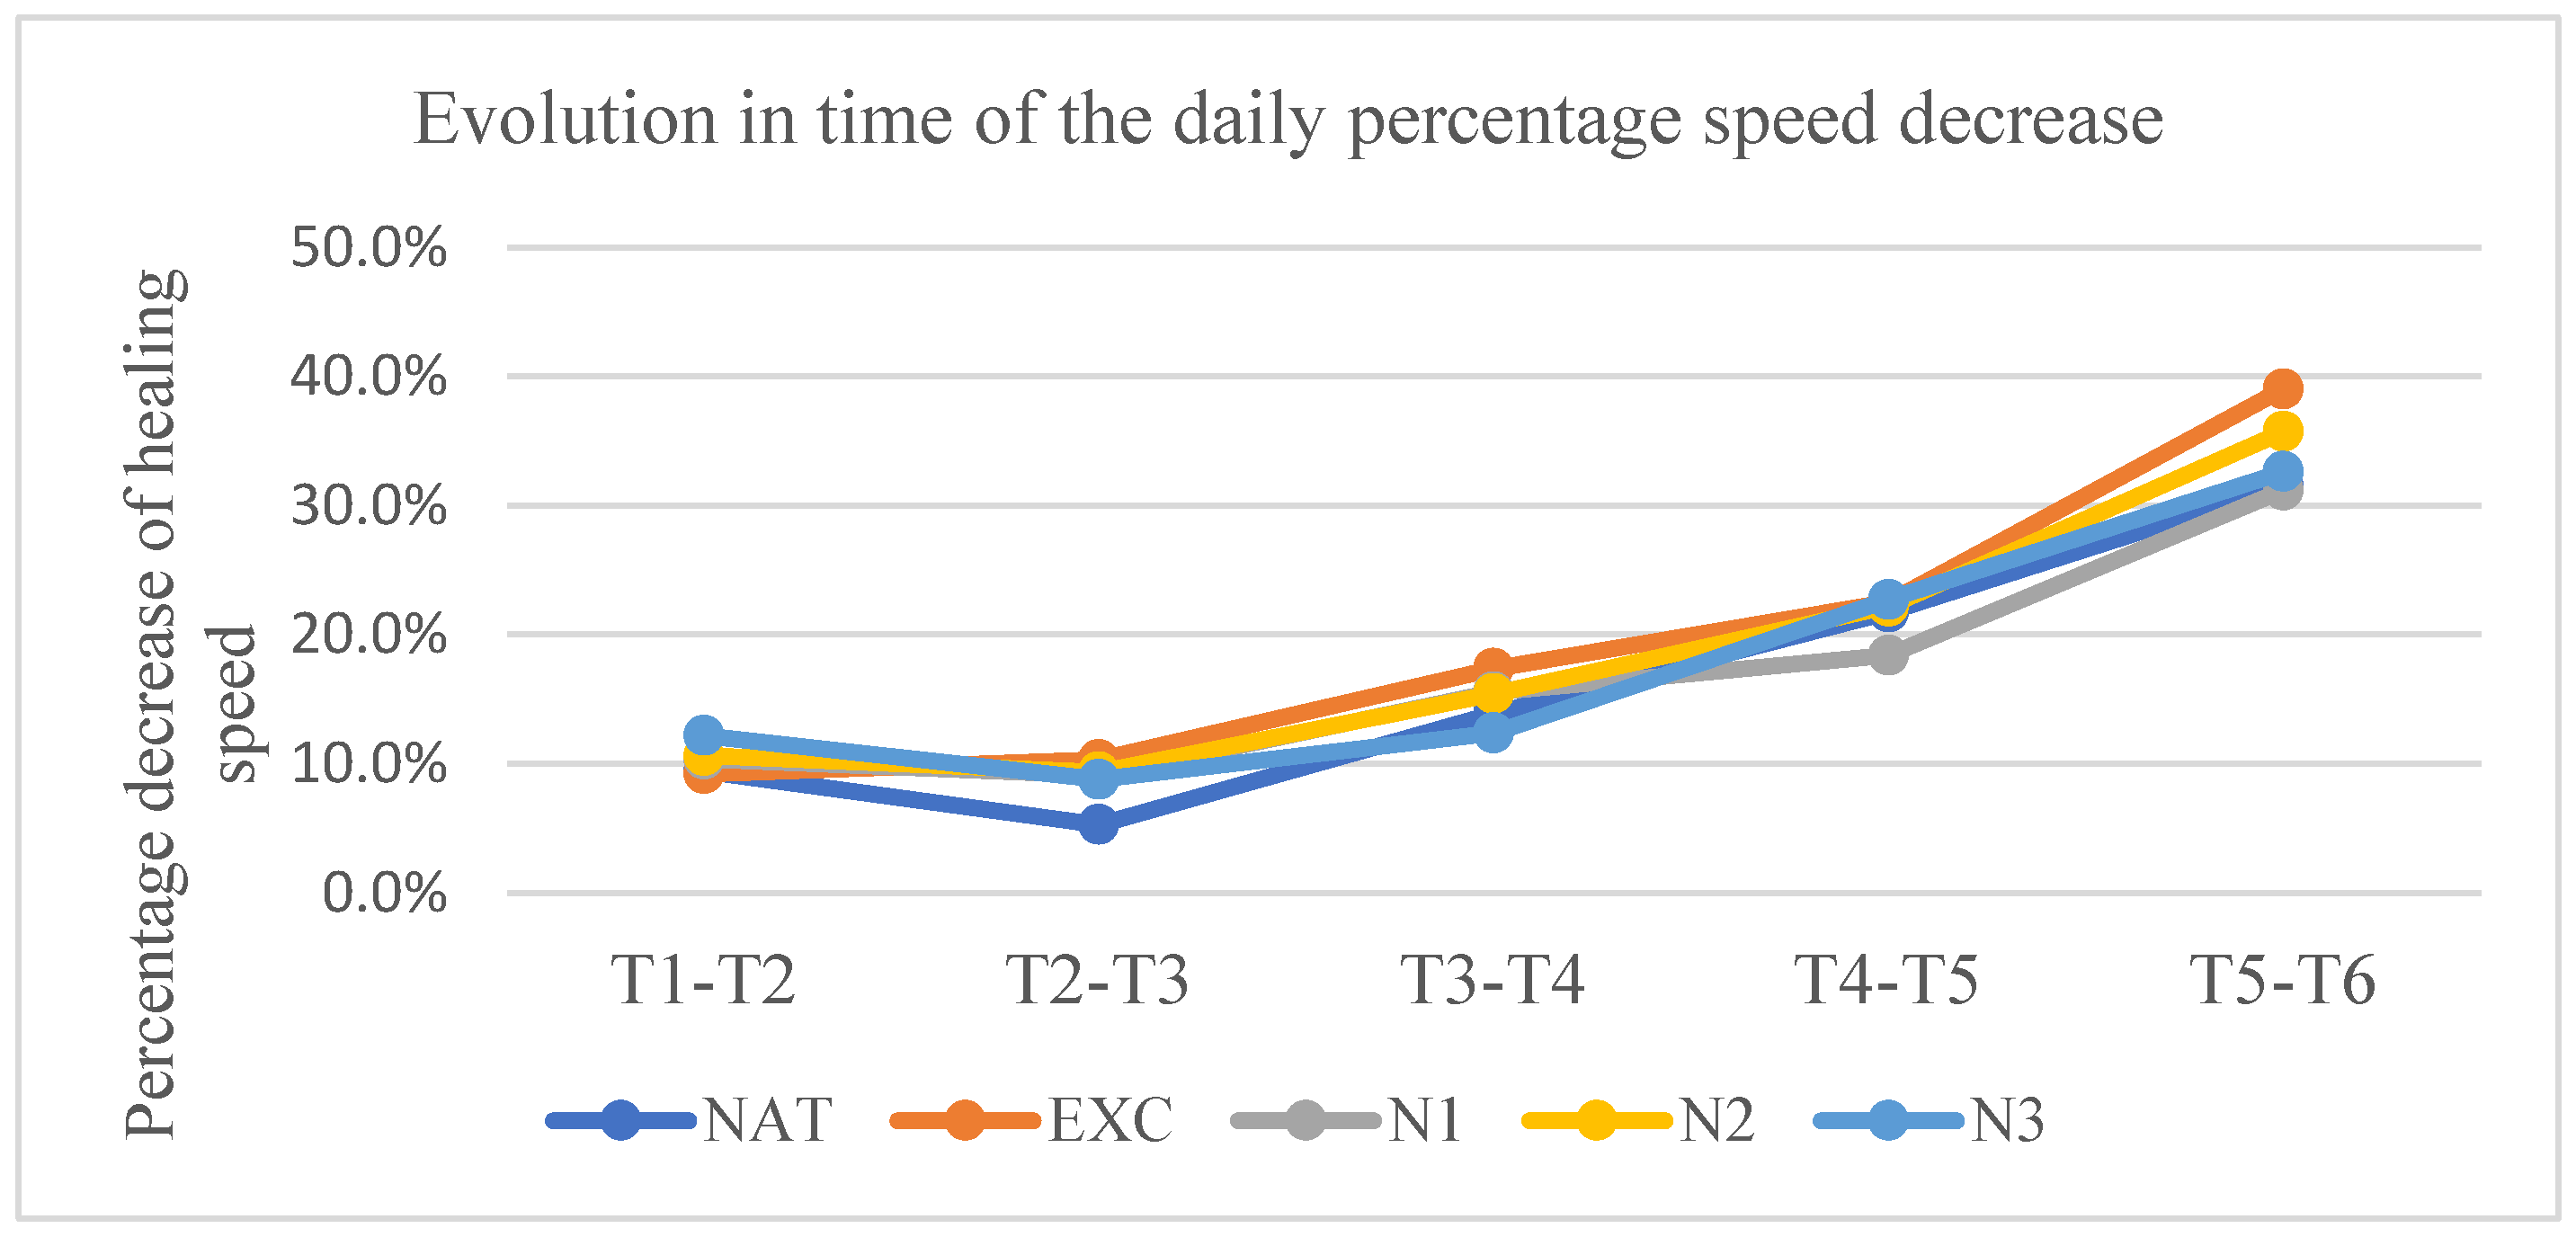
3.3.2. Daily Percentage Rate of Decrease of the Lesion Surface
At t2, the rate was in the untreated group 9.41%±4.96/day, in the excipient group 9.23%±5.97/day, in the nimodipine group in low concentration 10.37%±4.61/day, in the nimodipine group in medium concentration 10.62%±6.99/day, and in the nimodipine group in high concentration 12.18%±6.42/day.
At t3, the rate was in the untreated group 5.30%±2.9/day, in the excipient group 10.34%±4.79/day, in the nimodipine group in low concentration 9.10%±6.64/day, in the nimodipine group in medium concentration 9.37%±3.72/day, and in the nimodipine group in high concentration 8.80%±2.44/day.
At t4, the rate was in the untreated group 13.88%±8.11/ day, in the excipient group 17.40%±6.83/day, in the group treated with nimodipine in low concentration 15.55%±9.77/day, in the group treated with nimodipine in medium concentration 15.43%±7.04/day, and in the group treated with nimodipine in high concentration 12.39%±6.93/day.
At t5, the rate was in the untreated group 21.74%±5.88/ day, in the excipient group 22.54%±12.53/day, in the nimodipine group in low concentration 18.4%±10.32/day, in the nimodipine group in medium concentration 22.19%±10.97/day, and in the nimodipine group in high concentration 22.72%±8.76/day.
At t6, the rate was in the untreated group 31.51%±8.04/ day, in the excipient group 39.04%±7.19/day, in the nimodipine group in low concentration 31.20%±6.10/day, in the nimodipine group in medium concentration 35.74%±13.56/day, and in the nimodipine group in high concentration 32.65%±7.14/day.
Statistically significant differences in relation to the untreated group were present only at t3 in the groups treated with nimodipine in medium and high concentrations (p< 0.007 and p<0,003 respectively).
Graph 3.
Evolution over time of the daily percentage decrease rate.Vertically are represented the percentage decrease speeds between 2 consecutive measurements. The time interval between 2 consecutive measurements is represented horizontally.
Graph 3.
Evolution over time of the daily percentage decrease rate.Vertically are represented the percentage decrease speeds between 2 consecutive measurements. The time interval between 2 consecutive measurements is represented horizontally.
3.3.3. The Area Under the Curve of the Evolution of the Lesion Surfaces over Time
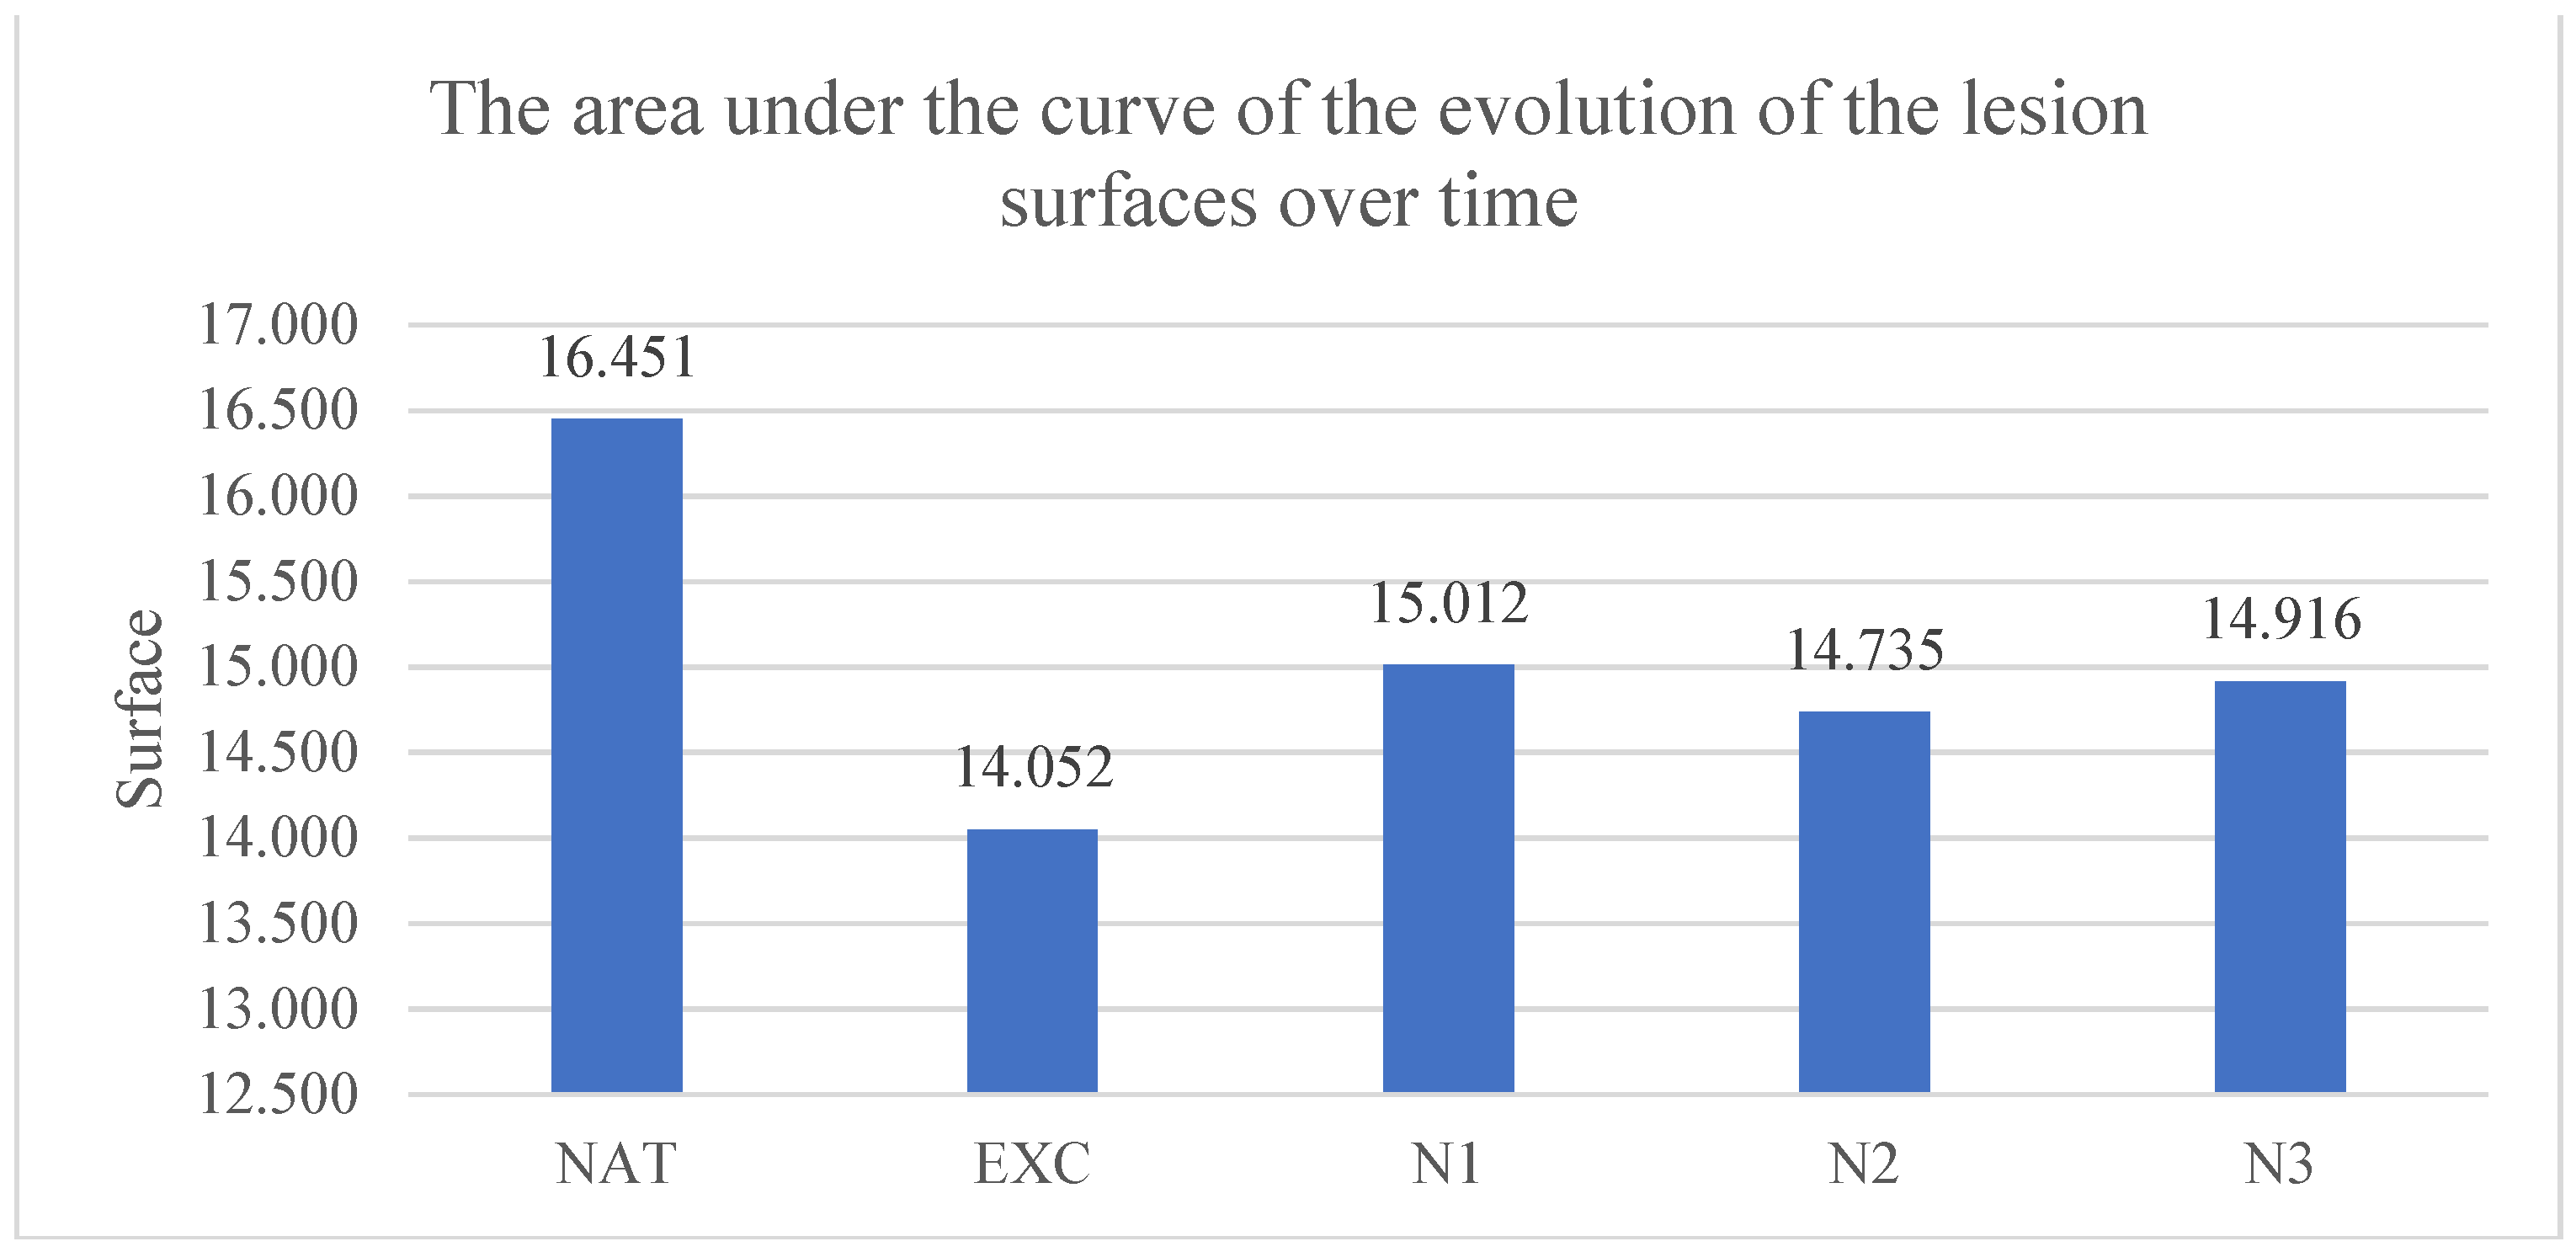
The area under the evolution curve of the lesion surfaces was for the untreated group of 16.45±3.02 pixels*days, for the group treated with excipients 14.05±3.32 pixels*days, for the group treated with nimodipine in low concentration 15.01±2.72 pixels*days, in the group treated with nimodipine in medium concentration 14.76±3.10 pixels*days and in the group treated with nimodipine in high concentration 14.92±4.01 pixels*days. The smallest areas under the curve of the evolution of the lesion surfaces over time compared to the untreated group were recorded in the groups treated with nimodipine in low, medium and high concentration but without statistical significance.
The results are presented in Graph 4.
Graph 4.
The area under the curve of the evolution of the surface of the lesions over time. Each column represents the average area between 2 consecutive intervals until full healing, in pixels.
Graph 4.
The area under the curve of the evolution of the surface of the lesions over time. Each column represents the average area between 2 consecutive intervals until full healing, in pixels.
4. Discussion
As for the duration of the wound healing, the main parameter, nimodipine in medium concentration decreased this duration from 17.33±6.37 days in the control group, to 14.8±5.6 days, that is, with 2.53 days.
If we make a comparison regarding the shortening of the duration of wound healing in the 3 experiments performed and presented so far [1,2], the situation presents as follows:
- -
- In the case of large lesions in the first experiment performed by us, regarding the effect of the low concentration of amiodarone (200 nM) on wound healing in rats, the duration necessary for wound healing was reduced from 27.17±5.19 days to 19.57±3.05 days, that is, with 7.6 days, which represents a reduction of 27.97% which meant a significant difference of p<0.03 [1].
- -
- In the case of small lesions, the low concentration of amiodarone (200 nM) reduced the duration of wound healing from 17.37±2.19 days to 14.50±2.19 days, that is, with 2.87 days, which is a 16.52% reduction, which meant a significant difference of p<0.01 [2].
- -
- In the case of small lesions treated with nimodipine, in the present experiment, the medium concentration of nimodipine reduced the duration of wound healing from 17.33±6.37 days to 14.8±5.6 days, i.e. with 2.53 days, which is a 14.59% reduction, which meant a significant difference of p<0.04.
These data suggest that blocking potassium channels promotes wound healing, the more the larger the surface is. When the lesions had an area of 100mm2, reduction in wound healing time was 27.97%, and when the lesions were 50.24mm2, the reduction in wound healing time was 16.52% [1,2].
Blocking of calcium channels also favored wound healing under our experimental conditions, but this only happened by simultaneously blocking the L-type and T-type calcium channel, because only the medium nimodipine concentration had a statistically significant effect. Low-concentration nimodipine, which only blocks L-type calcium channels, had no statistically significant effect. Of course, it is difficult to say whether the favorable effect found at the medium concentration of nimodipine is due to the exclusive blocking of T-type calcium channels or to the concomitant blocking of both types of calcium channels. However, the fact that selective blocking of L-type calcium channels did not have a statistically significant effect makes us suppose that the effect found is due exclusively to blockage of T-type calcium channels.
While in the case of blockage of potassium channels, on small lesions, the decrease in the duration required for wound healing was 16.52%, in the case of blockage of T-type calcium channels the decrease in this duration was 14.59%. This might suggest that the effect of blocking potassium channels is more intense than that of blocking T-type calcium channels.
Secondary parameters used, namely the percentage decrease of the lesion surfaces relative to the initial surface, the daily percentage decrease rate of the lesion surfaces and the area below the evolution curve of the lesion surface over time try to assess by which mechanisms the blockage of the ion channels influenced wound healing.
Analysis of secondary parameters showed that even in the case of calcium channel blockage, the shortening of wound healing time is due to the increase in the daily percentage rate of decrease of lesional surfaces, but, unlike potassium channel blockage, this speed is statistically significant influenced only in the first stage of the wound healing process, not in the second stage.
By corroborating the data from all the experiments presented so far, it is possible, as shown in experiment number 1 [1] that blocking the L-type calcium channels partially antagonizes the blocking of the potassium channels. As we previously discused, only blockage of T-type calcium channels had a positive effect on reducing the time of wound healing [1,2]. Part of the effect of blocking potassium channels was antagonized by blocking L-type calcium channels, to which the favorable effect of blocking T-type calcium channels was added.
Taking into account all this data, we suggest to continue the research from the hypothesis that concomitant blocking of both types of ion channels (calcium and potassium) might bring an additional benefice.
Since the aim of this study, which continues previous studies published by us, was to determine the effect of various ions currents on wound healing in rats, there was no need, at this moment, to conduct any histological analysis. Depending on our results from future research, we might consider to complete the study also with a morphometric analysis.
5. Conclusions
- Nimodipine, in medium concentrations, that block both L-type and T-type calcium channels, caused a statistically significant decrease in the average wound healing duration.
- Nimodipine, in low concentrations, which block only the L-type calcium channels, did not produce any statistically significant changes.
- Blocking of the T-type calcium channels favors wound healing in our experimental conditions.
- Blocking of T-type calcium channels appears to favor wound healing less intensely than blocking of potassium channels.
Author Contributions
A.D.G made the experimental design, conducted the experimental protocol, and analyzed the obtained specimens and data. A.V.B made the experimental design and conducted the statistical and data analysis. S.S, MC, AZ helped with the experimental protocol and animal housing. O.A.C. analyzed and made corrections of the final version of the manuscript. I.F. analyzed the manuscript and supervised the experiment and analyzed the results. All authors drafted the work or revised it critically for important intellectual content. All authors have read and agreed to the published version of the manuscript.
Funding
This research received no external funding.
Institutional Review Board Statement
The animal study protocol was approved by the Ethics Committee of “Carol Davila” University of Medicine and Pharmacy, Bucharest, Romania (13310/27 May 2021) for studies involving animals, in conformity with 43/2014 Law regarding animal protection used in scientific purposes, with further completions and 86/609/CEE Directive from 24 November 1986 regarding acts with power of law and administrative acts of member states for animal protection used in experimental purposes and other scientific purposes.
Informed Consent Statement
Not applicable.
Data Availability Statement
Data will be available upon request.
Conflicts of Interest
The authors declare no conflict of interest.
References
- Grigore, A.; Vatasescu-Balcan, A.; Stoleru, S.; Zugravu, A.; Poenaru, E.; Engi, M.; Coman, O.A.; Fulga, I. Experimental Research on the Influence of Ion Channels on the Healing of Skin Wounds in Rats. Processes 2024, 12, 109. [Google Scholar] [CrossRef]
- Grigore, A.; Stoleru, S.; Zugravu, A.; Vatasescu-Balcan, A.; Poenaru, E.; Engi, M.; Fulga, I. Experimental Evaluation of the Influence of Amiodarone on Wound Healing. Farmacia 2024, 72, 234–242. [Google Scholar] [CrossRef]
- Heng, M.C.Y. Wound Healing in Adult Skin: Aiming for Perfect Regeneration. Int J Dermatol 2011, 50, 1058–1066. [Google Scholar] [CrossRef] [PubMed]
- Reinke, J.M.; Sorg, H. Wound Repair and Regeneration. Eur Surg Res 2012, 49, 35–43. [Google Scholar] [CrossRef]
- Gonzalez, A.C.D.O.; Costa, T.F.; Andrade, Z.D.A.; Medrado, A.R.A.P. Wound Healing - A Literature Review. An. Bras. Dermatol. 2016, 91, 614–620. [Google Scholar] [CrossRef]
- Guo, S.; Dipietro, L.A. Factors Affecting Wound Healing. J Dent Res 2010, 89, 219–229. [Google Scholar] [CrossRef]
- Grigore, A.; Coman, O.A.; Păunescu, H.; Costescu, M.; Fulga, I. Latest Insights into the In Vivo Studies in Murine Regarding the Role of TRP Channels in Wound Healing—A Review. IJMS 2024, 25, 6753. [Google Scholar] [CrossRef]
- Abdo, J.M.; Sopko, N.A.; Milner, S.M. The Applied Anatomy of Human Skin: A Model for Regeneration. Wound Medicine 2020, 28, 100179. [Google Scholar] [CrossRef]
- Tottoli, E.M.; Dorati, R.; Genta, I.; Chiesa, E.; Pisani, S.; Conti, B. Skin Wound Healing Process and New Emerging Technologies for Skin Wound Care and Regeneration. Pharmaceutics 2020, 12, 735. [Google Scholar] [CrossRef]
- Wang, P.-H.; Huang, B.-S.; Horng, H.-C.; Yeh, C.-C.; Chen, Y.-J. Wound Healing. J Chin Med Assoc 2018, 81, 94–101. [Google Scholar] [CrossRef]
- Coman, L.; Coman, O.A.; Păunescu, H.; Drăghia, F.; Fulga, I. VEGF-Induced Corneal Neovascularisation in a Rabbit Experimental Model. Rom J Morphol Embryol 2010, 51, 327–336. [Google Scholar] [PubMed]
- Broughton, G.; Janis, J.E.; Attinger, C.E. The Basic Science of Wound Healing. Plastic and Reconstructive Surgery 2006, 117, 12S–34S. [Google Scholar] [CrossRef]
- Senel, O.; Cetinkale, O.; Ozbay, G.; Ahçioğlu, F.; Bulan, R. Oxygen Free Radicals Impair Wound Healing in Ischemic Rat Skin. Ann Plast Surg 1997, 39, 516–523. [Google Scholar] [CrossRef] [PubMed]
- Morris, T.; Tracey, J. Lignocaine: Its Effects on Wound Healing. Br J Surg 1977, 64, 902–903. [Google Scholar] [CrossRef] [PubMed]
- Qi, X.; Cai, E.; Xiang, Y.; Zhang, C.; Ge, X.; Wang, J.; Lan, Y.; Xu, H.; Hu, R.; Shen, J. An Immunomodulatory Hydrogel by Hyperthermia-Assisted Self-Cascade Glucose Depletion and ROS Scavenging for Diabetic Foot Ulcer Wound Therapeutics. Adv Mater 2023, 35, e2306632. [Google Scholar] [CrossRef] [PubMed]
- Masson-Meyers, D.S.; Andrade, T.A.M.; Caetano, G.F.; Guimaraes, F.R.; Leite, M.N.; Leite, S.N.; Frade, M.A.C. Experimental Models and Methods for Cutaneous Wound Healing Assessment. Int J Exp Pathol 2020, 101, 21–37. [Google Scholar] [CrossRef]
- Klinsang, T.; Charoensit, P.; Phimnuan, P.; Luangpraditkun, K.; Ross, G.M.; Viennet, C.; Ross, S.; Viyoch, J. In Vitro Wound Healing Potential of a Fibroin Film Incorporating a Cannabidiol/2-Hydroxypropyl-β-Cyclodextrin Complex. Pharmaceutics 2023, 15, 2682. [Google Scholar] [CrossRef]
- Mai, K.; Maverakis, E.; Li, J.; Zhao, M. Maintaining and Restoring Gradients of Ions in the Epidermis: The Role of Ion and Water Channels in Acute Cutaneous Wound Healing. Adv Wound Care (New Rochelle) 2023, 12, 696–709. [Google Scholar] [CrossRef]
- González, C.; Baez-Nieto, D.; Valencia, I.; Oyarzún, I.; Rojas, P.; Naranjo, D.; Latorre, R. K(+) Channels: Function-Structural Overview. Compr Physiol 2012, 2, 2087–2149. [Google Scholar] [CrossRef]
- Zhang, W.; Das, P.; Kelangi, S.; Bei, M. Potassium Channels as Potential Drug Targets for Limb Wound Repair and Regeneration. Precis Clin Med 2020, 3, 22–33. [Google Scholar] [CrossRef]
- Pardo, L.A. Voltage-Gated Potassium Channels in Cell Proliferation. Physiology (Bethesda) 2004, 19, 285–292. [Google Scholar] [CrossRef]
- Hertel, R.F. Potassium Channel Activation Improves Blood Flow Pattern of Conscious Rats in Cutaneous Microcirculation. Clin Exp Pharmacol Physiol 1992, 19, 243–248. [Google Scholar] [CrossRef] [PubMed]
- Moulin, V.J.; Dubé, J.; Rochette-Drouin, O.; Lévesque, P.; Gauvin, R.; Roberge, C.J.; Auger, F.A.; Goulet, D.; Bourdages, M.; Plante, M.; et al. Electric Potential Across Epidermis and Its Role During Wound Healing Can Be Studied by Using an In Vitro Reconstructed Human Skin. Adv Wound Care (New Rochelle) 2012, 1, 81–87. [Google Scholar] [CrossRef] [PubMed]
- Zhang, W.; Bei, M. Kcnh2 and Kcnj8 Interactively Regulate Skin Wound Healing and Regeneration. Wound Repair Regen 2015, 23, 797–806. [Google Scholar] [CrossRef] [PubMed]
- McKeown, L.; Swanton, L.; Robinson, P.; Jones, O.T. Surface Expression and Distribution of Voltage-Gated Potassium Channels in Neurons (Review). Mol Membr Biol 2008, 25, 332–343. [Google Scholar] [CrossRef] [PubMed]
- Epureanu, F.B. New experimental data on the central effects of an old analgesic – ParacetamoL. Farmacia 2019, 67, 648–655. [Google Scholar] [CrossRef]
- Liu, H.; Jin, C.; Yang, X.; Xia, N.; Guo, C.; Dong, Q. Identification of Key Genes and Validation of Key Gene Aquaporin 1 on Wilms’ Tumor Metastasis. PeerJ 2023, 11, e16025. [Google Scholar] [CrossRef]
- Bellemann, P.; Schade, A.; Towart, R. Dihydropyridine Receptor in Rat Brain Labeled with [3H]Nimodipine. Proc Natl Acad Sci U S A 1983, 80, 2356–2360. [Google Scholar] [CrossRef]
- Karlsson, B.M.; Koch, M.; Koskinen, L.-O.D. Nimodipine Affects the Microcirculation and Modulates the Vascular Effects of Acetylcholinesterase Inhibition. Ups J Med Sci 2003, 108, 141–149. [Google Scholar] [CrossRef]
- Rowland, M.J.; Ezra, M.; Winkler, A.; Garry, P.; Lamb, C.; Kelly, M.; Okell, T.W.; Westbrook, J.; Wise, R.G.; Douaud, G.; et al. Calcium Channel Blockade with Nimodipine Reverses MRI Evidence of Cerebral Oedema Following Acute Hypoxia. J Cereb Blood Flow Metab 2019, 39, 285–301. [Google Scholar] [CrossRef]
- Wulff, H.; Castle, N.A.; Pardo, L.A. Voltage-Gated Potassium Channels as Therapeutic Targets. Nat Rev Drug Discov 2009, 8, 982–1001. [Google Scholar] [CrossRef]
- Habibipour, S.; Oswald, T.M.; Zhang, F.; Joshi, P.; Zhou, X.C.; Dorsett-Martin, W.; Lineaweaver, W.C. Effect of Sodium Diphenylhydantoin on Skin Wound Healing in Rats. Plastic and Reconstructive Surgery 2003, 112, 1620–1627. [Google Scholar] [CrossRef] [PubMed]
- Waite, A.; Gilliver, S.C.; Masterson, G.R.; Hardman, M.J.; Ashcroft, G.S. Clinically Relevant Doses of Lidocaine and Bupivacaine Do Not Impair Cutaneous Wound Healing in Mice. Br J Anaesth 2010, 104, 768–773. [Google Scholar] [CrossRef] [PubMed]

Table 1.
Percentage decrease of lesion surfaces relative to the initial surface. Each value represents the average of the differences between the initial surface and the surface at the time of measurement relative to the initial surface for each group, the surface being measured in pixels.
Table 1.
Percentage decrease of lesion surfaces relative to the initial surface. Each value represents the average of the differences between the initial surface and the surface at the time of measurement relative to the initial surface for each group, the surface being measured in pixels.
| Batch | T1-T2 | T1-T3 | T1-T4 | T1-T5 | T1-T6 |
|---|---|---|---|---|---|
| NAT | 18,8% ±9,92 |
27,3% ±11,02 |
48% ±11,56 |
70,7% ±8,24 |
89,1% ±6,03 |
| EXC | 18,5% ±11,93 |
35,4% ±12,12 |
57,4% ±14,66 |
76,4% ±12,91 |
94% ±5,89 |
| N1 | 20,7% ±9,22 |
35,1% ±13,80 |
54,7% ±18,99 |
70,1% ±19,99 |
87,3% ±14,08 |
| N2 | 21,2% ±13,98 |
35,7% ±14,88 |
56% ±12,85 |
73,7% ±17,1 |
88,5% ±16,40 |
| N3 | 24,4% ±12,84 |
37,4% ±12.77 (p<0.03) |
52,9% ±13,43 |
73,5% ±14,24 |
89,6% ±8,97 |
Table 2.
Each value represents the average of the percentage decrease speeds between 2 consecutive measurements, relative to the time interval.
Table 2.
Each value represents the average of the percentage decrease speeds between 2 consecutive measurements, relative to the time interval.
| Batch | T1-T2 | T2-T3 | T3-T4 | T4-T5 | T5-T6 |
|---|---|---|---|---|---|
| NAT | 9,41% ±4,96 |
5,30% ±2,9 |
13,88% ±8,11 |
21,74% ±5,88 |
31,51% ±8,04 |
| EXC | 9,23% ±5,97 |
10,34% ±4,79 |
17,40% ±6,83 |
22,54% ±12,53 |
39,04% ±7,19 |
| N1 | 10.37% ±4,61 |
9,10% ±6,64 |
15,55% ±9,77 |
18,4% ±10,32 |
31,20% ±6,10 |
| N2 | 10,62% ±6,99 |
9,37% ±3,72 (p<0,007) |
15,43% ±7,04 |
22,19% ±10,97 |
35,74% ±13,56 |
| N3 | 12,18% ±6,42 |
8,80% ±2,44 (p<0,003) |
12,39% ±6,93 |
22,72% ±8,76 |
32,65% ±7,14 |
Disclaimer/Publisher’s Note: The statements, opinions and data contained in all publications are solely those of the individual author(s) and contributor(s) and not of MDPI and/or the editor(s). MDPI and/or the editor(s) disclaim responsibility for any injury to people or property resulting from any ideas, methods, instructions or products referred to in the content. |
© 2024 by the authors. Licensee MDPI, Basel, Switzerland. This article is an open access article distributed under the terms and conditions of the Creative Commons Attribution (CC BY) license (http://creativecommons.org/licenses/by/4.0/).
Copyright: This open access article is published under a Creative Commons CC BY 4.0 license, which permit the free download, distribution, and reuse, provided that the author and preprint are cited in any reuse.


