

Submitted:
31 October 2024
Posted:
07 November 2024
You are already at the latest version
Abstract
Precipitation during a specific return period plays an important role in the design of hydraulic infrastructure. The traditional approach involves collecting annual maximum precipitation data from a station, then subjecting it to statistical probability distributions (PDFs), and finally selecting the one with the lowest value in a goodness-of-fit test (e.g., Kolmogorov-Smirnov). Nevertheless, this methodology assumes current data, leaving uncertainty regarding its suitability for outdated data. The aim of this study is to compare the probability density functions (e.g., Normal, Log Normal, Pearson III) with the machine learning algorithm known as Random Forest (RF) for calculating precipitation at different return periods, using the province of Arequipa in Peru as the study area, through 5 stations located in different parts of the province. This comparison was conducted using the RMSE metric in both methods to evaluate their performance, resulting in RF having a lower RMSE than PDFs in most cases in calculating precipitation for return periods of 2, 5, 10, 20, 50 and 100 years for the studied stations.
Keywords:
probability distributions
; return period
; random forest
; supervised learning
; annual maximum rainfall
; goodness of fit test
1. Introduction
The city’s inhabitants are endangered by the disasters left in the wake of urban flooding, which also cause economic damage. Increased urbanization and population concentration also increase exposure to natural hazards [1]. For this reason, an effective approach to improving flood planning is based on the ability to anticipate extremes of rainfall [2] and using novel methods [3].
The theory of statistical extremes shows that the frequency of extreme events is more closely tied to changes in climate variability than to fluctuations in the mean climate state [4]. Additionally, the process of distribution fitting involves matching a statistical distribution to a dataset derived from random processes and is a critical step in capturing the underlying patterns. Since probability distributions are essential for quantifying uncertainty, selecting the wrong distribution can lead to flawed conclusions [5]. There are numerous studies that highlight the significance of identifying the distribution that best fits the data from a meteorological station, as demonstrated by Mandal and Choudhury [6] that investigated the annual, seasonal and monthly maximum daily rainfall patterns in Sagar Island, situated on the continental shelf of the Bay of Bengal. The study revealed that the normal distribution provided the best fit for annual, post-monsoon and summer seasons.
The integration of Big Data and Artificial Intelligence has enabled Machine Learning (ML) to emerge as a promising tool in weather forecasting diverging from traditional statistical methods, leveraging its strengths in addressing nonlinear complexities and uncovering previously unknown relationships within the Earth’s climate system [7]. In this sense, this method could be useful to determine the return period, which is an essential metric that quantifies the probability of extreme events such as floods and droughts, which can inflict significant harm on society and the environment. Consequently, it is a fundamental aspect of hydraulic design and risk assessment challenges. This probabilistic concept is widely utilized in hydrological studies and has garnered increased attention due to the necessity of effectively managing complex processes in an evolving environmental landscape [8].
At a global level, the analysis of data from climate stations is of great relevance. As noted by Padji, et al. [9], making accurate estimates of intense precipitation is key to improving early warnings and protecting the population. Furthermore, this analysis is essential in areas such as planning infrastructure resilient to extreme conditions and efficiently managing water resources. It is also fundamental in studies on climate change, as it provides valuable records on trends and extreme events. This data is used to calibrate and validate predictive models that support urban, agricultural, and environmental planning. For instance, in the United Arab Emirates, Branch, et al. [10] highlighted the need to improve predictions of extreme events, particularly in arid regions. They employed high-resolution solutions validated with data from meteorological stations, despite the limitations posed by the scarce information provided. Nevertheless, they succeeded in enhancing predictions for extreme events such as heat waves, storms, and rainfall through sensitivity tests and studies that allowed for refining the model configurations used. In Asia, Zhai, et al. [11] applied methodologies for analyzing rainfall predictions, focusing on probability distribution models such as Pearson Type III, Pareto-Burr-Feller, generalized extreme value (GEV), and Weibull. These models were calibrated with historical data to predict extreme rainfall. Additionally, they implemented the Mann-Kendall test to detect long-term trends in precipitation. These techniques help improve the prediction of the recurrence of extreme events and assess long-term trends in the frequency and magnitude of rainfall, providing a solid foundation for designing drainage infrastructure and flood management systems. Moreover, Si, et al. [12] addressed the issue by constructing regional meteorological stations, enabling a more in-depth study of extreme rainfall, even with short data series. They employed sampling methods based on peaks over threshold and the generalized Pareto distribution to optimize spatial interpolation parameters, improving the accuracy of daily extreme rainfall predictions at regional stations.
However, access to updated data is not always feasible. Therefore, this paper presents an innovative approach for regions facing similar data availability issues, which is based on utilizing the Random Forest (RF) algorithm to estimate precipitation for a specified return period instead of relying on probability density functions (PDFs). For instance, Sun, et al. [13] emphasize that, compared to traditional methods, RF is effective in capturing nonlinear relationships between precipitation and predictive variables, such as the Normalized Difference Vegetation Index (NDVI), Land Surface Temperature (LST), and topographical features. Furthermore, Papacharalampous, et al. [14] focus on the application of RF through quantile regression, conducting a large-scale comparison among various algorithms to identify the most effective one. This suggests that RF can significantly enhance the accuracy of precipitation predictions. Finally, Hassan, et al. [15] highlight the necessity of integrating models like RF to improve precipitation forecasting by leveraging significant patterns and relevant attributes to optimize model performance. They underscore the importance of developing hybrid classifiers and addressing limitations such as reliance on historical data and regional variability, thereby promoting a more automated and advanced approach to meteorological analysis.
This study is structured as follows: The Data and Study Area section provides an overview of the region and data used. The Methodology section describes the PDFs employed and the RF algorithm, including the comparison metric. The Results section presents precipitation estimates for various return periods using both methods, along with a comparative analysis. The Discussion section elaborates on the differences between the two methods, explaining their performance. Lastly, the Conclusion section summarizes the key findings and suggests avenues for future research.
2. Data and Study Area
Arequipa province, located in southern Peru, is a vibrant and diverse region nestled in the Andean highlands. Bordering the Pacific Ocean to the West and the Andes mountains to the East. The climate is characterized by mild temperatures and low humidity throughout the year. It is important to recognize that Arequipa is a thriving economic hub, driven by mining, agriculture, tourism and manufacturing. The region is rich in mineral resources, including copper, zinc and gold. Agriculture is another significant activity, with potato, maize and wheat crops. Tourism attracts visitors worldwide with its breathtaking natural landscapes, including the Colca Canyon, Misti Volcano and Andagua Valley. Arequipa province also boasts a rich cultural heritage. The city’s historic center features stunning colonial-era buildings, including the Santa Catalina Monastery.
The data were obtained from Peruvian National Meteorology and Hydrology Service (SENAMHI) for 5 stations distributed across the Arequipa province, as shown in Figure 1. However, these data sets vary in length for each station and are not updated to the last year, with most stations reaching only up to 2014. The specific data lengths for each station are: La Pampilla (83 years), La Joya (49 years), El Frayle (50 years), Las Salinas (51 years) and Chiguata (49 years). The analysis was conducted considering the following years for each station: 1965 to 2013, and the maximum annual precipitation was determined for each year to initiate the subsequent comparison of methods.
3. Methodology
When selecting the most appropriate distribution for a specific location, it is crucial to consider the variety of distribution models available. This section outlines the distribution models, the RF algorithm, goodness-of-fit test and the metric used in the study, root mean square error (RMSE).
3.1. Commonly Used Probability Distributions
Statistical distributions are essential tools for modeling and analyzing complex phenomena and enable researchers to describe and predict extreme events. In the next lines, the mathematic expressions are found with some applications of these distributions.
3.1.1. Normal
The distribution is a symmetric probability model characterized by its mean and standard deviation parameters. The probability density function (PDF) is:
for the range of . Annual precipitation and runoff analyses often rely on the Normal distribution [16].
3.1.2. Log-Normal
A continuous probability model suitable for skewed data. Its logarithmic transformation ensures positive values, making it ideal for modeling variables with lower bounds.
where the range of random variable is . The two parameters are expressed as follows:
3.1.3. Pearson Type 3
A versatile, three-parameter model suitable for skewed data, its Gamma distribution-like properties enable the analysis of variables with varying coefficients of variation, making it applicable to precipitation, streamflow and water quality data.
Its parameters are:
This distribution is prominently employed in hydrology [2].
3.1.4. Log Pearson Type 3
A flexible probability model that combines logarithmic transformation with the Pearson Type 3 distribution, this combination enables analysis of skewed data with extreme values.
Phien and Ajirajah [17] assessed the suitability of this distribution for modeling flood and maximum rainfall data, as well as its applicability to annual rainfall and streamflow sequences.
3.1.5. Generalized Extreme Value (GEV)
It is a flexible model for extreme events, its cumulative distribution function allows for the analysis of both upper and lower tails, making it suitable for modeling extreme precipitation, flood and drought events.
The GEV distribution is extensively endorsed in European countries for its exceptional ability to accurately model flood data [18].
3.1.5.1. GEV MIN (L-Moments)
A variant of the GEV model, specifically designed for analyzing extreme minima, its inverse cumulative distribution function enables the modeling of low-frequency events, such as droughts and minimum streamflow.
3.1.5.2. GEV MAX (Kappa Specified, L-Moments)
A specialized GEV model for extreme maxima, its cumulative distribution function is tailored for analyzing high-frequency events, such as floods, heavy precipitation and maximum streamflow.
3.2. Goodness-of-Fit Test
To assess the validity of a specified probability distribution model, a goodness-of-fit test statistics are applied. A plethora of normality tests are available, including Empirical Distribution Function (EDF) tests, which quantify the divergence between empirical and theoretical distributions [19]. Prominent EDF tests include the Kolmogorov-Smirnov (K-S), the Anderson-Darling (A-D) test, and Cramer-Von Mises test [20]. The K-S was applied in this study, due to its simplicity and computational ease of implementation, coupled with the fact that it does not require the estimation of additional parameters.
Furthermore, RMSE was employed to evaluate model performance and identify the best-fitting model.
3.2.1. Kolmogorov-Smirnov (K-S) Test
This test is a non-parametric statistical test used to assess the goodness-of-fit between observed and theoretical distributions. It quantifies the maximum distance between cumulative distribution functions, enabling detection of significant deviations. It is designed to compare the empirical cumulative frequency with the cdf of an assumed theoretical distribution . For a sample size n, the values are sorted in a non-decreasing sequence, and the K-S statistic is applied to each data value in the ascending order.
The K-S test statistic is the maximum difference between and
Following the next syntax, the critical value is , the significance level is and is the rank order of the data set.
3.2.2. Root Mean Square Error (RMSE)
The lowest RMSE values signifies the best-fitting model, yielding the standard deviation of the prediction uncertainty. It assesses the difference between actual and estimated values. The RMSE has the following expression:
where is the estimated value and X is the actual value.
3.3. Return Period
Probability of occurrence in a given time:
Probability of occurrence based on observed data
where is the position of the observation and is the number of observations.
3.4. Random Forest
By integrating multiple Decision Trees, RF achieves robust predictions through averaging, exhibiting superiority in handling high-dimensional feature spaces and complex data structures, thereby ensuring reliable performance. Represent a machine learning approach that merges the principles of classification and regression trees with bagging techniques, incorporating an added level of randomness [21].
3.4.1. Supervised Learning
Supervised learning algorithms are designed to derive a function that integrates a group of variables to forecast another variable. The input variables in this function are known as predictor variables, which can also be referred to as independent variables, exogenous variables, covariates, or features. The variable that is being predicted is termed the dependent variable, which may also be called the predictand, response variable, outcome, endogenous variable, target variable, or output.
These algorithms are divided into two main categories based on the nature of the dependent variable: regression and classification. In regression algorithms, the dependent variable is numerical, while in classification algorithms, the dependent variable is categorical [21]. For this study, due to the nature of the case, it is considered a regression problem, attributable to the characteristic of the predictand variable being precipitation for a return period, which is an inherently continuous numerical variable.
4. Results
The principal goal of this study is to determine the differences calculating the precipitation for each return period using the best-fit distribution and the RF algorithm for each station. Knowledge of return periods for extreme events facilitates the evaluation of risk exposure and potential damage from severe weather events, such as floods and intense rainfall, thereby informing policy and decision-making processes [2].
4.1. Best-Fit Distributions for Each Station and Comparison with Random Forest
The traditional approach involves using the annual maximum precipitation corresponding to each station, followed by ordering all of these data from highest to lowest to determine the probability of occurrence for each value. This can be graphed to better understand the occurrence probabilities in relation to precipitation levels. At this point, probability density functions (PDFs) come into play, as they are able to fit the data and then evaluate the chosen function for a specific value, which in this case is the return period. However, the choice of the function is not arbitrary; it must undergo a goodness-of-fit test. In this study, the Kolmogorov-Smirnov (K-S) test was selected.
Following this line of thought, the innovative approach incorporates the Random Forest (RF) algorithm, which, like the traditional approach, starts by using the annual maximum precipitation and the probability of occurrence for each value. The difference lies in the fact that RF learns the patterns in the data and can adapt more effectively than traditional statistical functions. It is important to note that the data for this research were handled as follows: one training set (comprising 60% of the data for each station), one test set (comprising 20% of the data for each station), and one validation set (comprising 20% of the data for each station). The 60% allocated for training ensures that RF model has sufficient data to capture complex relationships between variables and adjust its parameters, the allocation of 20% for testing allows for precise evaluation of the trained model’s performance, and finally, the 20% allocated for validation enables an exhaustive evaluation of the model’s hyperparameters and selection of the optimal set. The parameters used for developing the algorithm were: 300 decision trees and a random state of 42. The decision to opt for 300 decision trees was made because a larger number of trees is capable of reducing variance, thus increasing the model's stability. It also provides a reasonable balance between accuracy and computational complexity. Additionally, a random state of 42 was chosen to ensure the reproducibility of the results and to avoid bias in feature selection.
In this way, the model can learn from the respective training set and improve its predictions. The test set was then subjected to the RMSE metric to evaluate accuracy, and the PDFs were similarly evaluated using the same test set that was used for the RF algorithm. The results for each station are shown in Table 1.
It should be noted that the El Frayle station has a missing value in its annual maximum precipitation dataset, for which the moving averages method was used to fill in the missing data.
4.2. Estimating the Return Period Using the Best-Fit Distribution and Random Forest
Once the best-fitting PDFs for each station are identified, the precipitation for each selected return period can be determined. Table 2 presents the return periods (2, 5, 10, 20, 50, and 100 years) along with the corresponding results.
Figure 7 shows the distribution of the predictions obtained from the PDFs listed in Table 2, which in this case represent precipitation values, as a function of the return period.
On the other hand, the precipitation results for the previously mentioned return periods are displayed in Table 3.
Finally, the distribution of the values is shown in Figure 8.
5. Discussion
Achieving national disaster resilience to hydrological phenomenon is essential to countries such as Peru [3,22], where adequately estimating precipitations is a great challenge.
The analysis conducted showed a similarity in precipitations for different return periods when using both methods (PDFs and RF), as evidenced in Table 2 and Table 3 of the Results section. However, it can be observed that for the 50- and 100-year periods, the values double. This may be due to the lack of variability in the data, since when a predictive model has data with low variability, it cannot fully understand the complexity of the data, resulting in vague predictions for high return periods. On the other hand, PDFs are designed to model extreme values and are better able to capture the variability of the data.
As has been observed in different parts of the world, there are studies analyzing rainfall patterns with probability functions for cities, regions, and even entire countries. However, to date, no such studies exist in Peru.
6. Conclusions
This study aims to provide an innovative approach to the calculation of precipitation for different return periods with a new method to improve accuracy, as well as offer an alternative for regions facing similar cases of data scarcity. Currently, there are cities and regions lacking updated information from their meteorological stations due to various reasons, such as high maintenance costs, low public interest, among others.
The analysis results showed that, following the traditional approach, 40% of the stations were better fitted with the GEV-MIN (L-Moments) function after performing the Kolmogorov-Smirnov (K-S) test. Meanwhile, using the innovative approach, 80% of the stations were better fitted with RF compared to PDFs, as they exhibited lower RMSE values, making it a viable alternative to the traditional approach adopted by much of the world.
Finally, a future research line involves analyzing daily, monthly, and annual rainfall patterns in Peruvian regions. Along these lines, there are other machine learning algorithms capable of performing regression, as done in this study (e.g., neural networks). Thus, another research avenue is to explore the calculation using different algorithms and to analyze the differences each one offers.
Author Contributions
Conceptualization, J.A.-V., S.V.-F. and G.A.; methodology, J.A.-V., S.V.-F. and G.A.; software, J.A.-V.; validation, J.A.-V., G.A. and Z.Z.; formal analysis, J.A.-V. and G.A.; investigation, J.A.-V. and G.A; resources, J.A.-V., A.J.E.V., J.J.-Q. and E.R.-C.; data curation, J.A.-V.; writing—original draft preparation, J.A.-V., S.V.-F. and J.B.; writing—review and editing, J.A.-V., S.V.-F., A.J.E.V. and J.B.; visualization, J.A.-V., J.J.-Q. and E.R.-C.; supervision, J.A.-V., A.J.E.V. and J.B.; project administration, J.A.-V., A.J.E.V. and J.B.; funding acquisition, A.J.E.V. and J.B. All authors have read and agreed to the published version of the manuscript.
Funding
The APC was funded by the journal Big Data and Cognitive Computing, thanks to Sherwin Chen’s management.
Data Availability Statement
The data presented in this study are available on request from the corresponding author, J.B. The data are not publicly available due to ethical restrictions.
Acknowledgments
The authors thank Sherwin Chen for providing assistance with the APC funding.
Conflicts of Interest
The authors declare no conflicts of interest.
References
- Gao, M.; Wang, Z.; Yang, H. Review of Urban Flood Resilience: Insights from Scientometric and Systematic Analysis. Int. J. Environ. Res. Public Health 2022, 19, 8837. [Google Scholar] [CrossRef]
- Alam, M.A.; Emura, K.; Farnham, C.; Yuan, J. Best-Fit Probability Distributions and Return Periods for Maximum Monthly Rainfall in Bangladesh. Climate 2018, 6, 9. [Google Scholar] [CrossRef]
- Valencia-Félix, S.; Anco-Valdivia, J.; Espinoza Vigil, A.J.; Hidalgo Valdivia, A.V.; Sanchez-Carigga, C. Review of Green Water Systems for Urban Flood Resilience: Literature and Codes. Water 2024, 16, 2908. [Google Scholar] [CrossRef]
- Katz, R.W.; Brown, B.G. Extreme events in a changing climate: Variability is more important than averages. Climatic Change 1992, 21, 289–302. [Google Scholar] [CrossRef]
- Khudri, M.M.; Sadia, F. Determination of the Best Fit Probability Distribution for Annual Extreme Precipitation in Bangladesh. European Journal of Scientific Research 2013, 103, 391–404. [Google Scholar]
- Mandal, S.; Choudhury, B.U. Estimation and prediction of maximum daily rainfall at Sagar Island using best fit probability models. Theoretical and Applied Climatology 2015, 121, 87–97. [Google Scholar] [CrossRef]
- Li, H.; Li, M. Modeling of Precipitation Prediction Based on Causal Analysis and Machine Learning. Atmosphere 2023, 14, 1396. [Google Scholar] [CrossRef]
- Volpi, E. On return period and probability of failure in hydrology. Wiley Interdiscip. Rev. Water 2019, 6. [Google Scholar] [CrossRef]
- Padji, C.; Meukaleuni, C.; Mezoue Adiang, C.; Bongue, D.; Monkam, D. Estimation of return dates and return levels of extreme rainfall in the city of Douala, Cameroon. Heliyon 2024, 10. [Google Scholar] [CrossRef]
- Branch, O.; Schwitalla, T.; Temimi, M.; Fonseca, R.; Nelli, N.; Weston, M.; Milovac, J.; Wulfmeyer, V. Seasonal and diurnal performance of daily forecasts with WRF V3.8.1 over the United Arab Emirates. Geoscientific Model Dev. 2021, 14, 1615–1637. [Google Scholar] [CrossRef]
- Zhai, W.; Wang, Z.; Feng, Y.; Xue, L.; Ma, Z.; Tian, L.; Sun, H. Developing the Actual Precipitation Probability Distribution Based on the Complete Daily Series. Sustainability 2023, 15, 13136. [Google Scholar] [CrossRef]
- Si, L.; Shao, Q.; Zhao, L.; Wei, T.; Hou, J.; Huang, J. Adjusting and refinement of daily extreme precipitation based on high-density weather stations. J. Nat. Disasters 2023, 32, 145–159. [Google Scholar] [CrossRef]
- Sun, T.; Yan, N.; Zhu, W.; Zhuang, Q. Assessing a machine learning-based downscaling framework for obtaining 1km daily precipitation from GPM data. Heliyon 2024, 10. [Google Scholar] [CrossRef]
- Papacharalampous, G.; Tyralis, H.; Doulamis, N.; Doulamis, A. Uncertainty estimation of machine learning spatial precipitation predictions from satellite data. Mach. Learn.: Sci. Technol. 2024, 5. [Google Scholar] [CrossRef]
- Hassan, M.M.; Rony, A.; Khan, M.; Hassan, M.; Yasmin, F.; Nag, A.; Zarin, T.; Bairagi, A.; Alshathri, S.; El-Shafai, W. Machine Learning-Based Rainfall Prediction: Unveiling Insights and Forecasting for Improved Preparedness. IEEE Access 2024, 11, 132196–132222. [Google Scholar] [CrossRef]
- Markovic, R. Probability Functions of Best Fit to Distribution of Annual Precipitation and Runoff. 1965. [Google Scholar]
- Phien, H.N.; Ajirajah, T.J. Applications of the log Pearson type-3 distribution in hydrology. J. Hydrol. 1984, 73, 359–372. [Google Scholar] [CrossRef]
- Salinas, J.L.; Castellarin, A.; Kohnová, S.; Kjeldsen, T.R. Regional parent flood frequency distributions in Europe—Part 2: Climate and scale controls. Hydrol. Earth Syst. Sci. 2014, 18, 4391–4401. [Google Scholar] [CrossRef]
- Dufour, J.-M.; Farhat, A.; Gardiol, L.; Khalaf, L. Simulation-based finite sample normality tests in linear regressions. The Econometrics Journal 1998, 1, C154–C173. [Google Scholar] [CrossRef]
- Arshad, M.; Rasool, M.T.; Ahmad, M.I. Anderson Darling and Modified Anderson Darling Tests for Generalized Pareto Distribution. Journal of Applied Sciences 2003, 3. [Google Scholar] [CrossRef]
- Tyralis, H.; Papacharalampous, G.; Langousis, A. A brief review of random forests for water scientists and practitioners and their recent history in water resources. Water 2019, 11, 910. [Google Scholar] [CrossRef]
- Espinoza Vigil, A.J.; Booker, J.D. Building national disaster resilience: assessment of ENSO-driven disasters in Peru. International Journal of Disaster Resilience in the Built Environment 2023, 14, 423–433. [Google Scholar] [CrossRef]
Figure 1.
Distribution map of stations in Arequipa province.
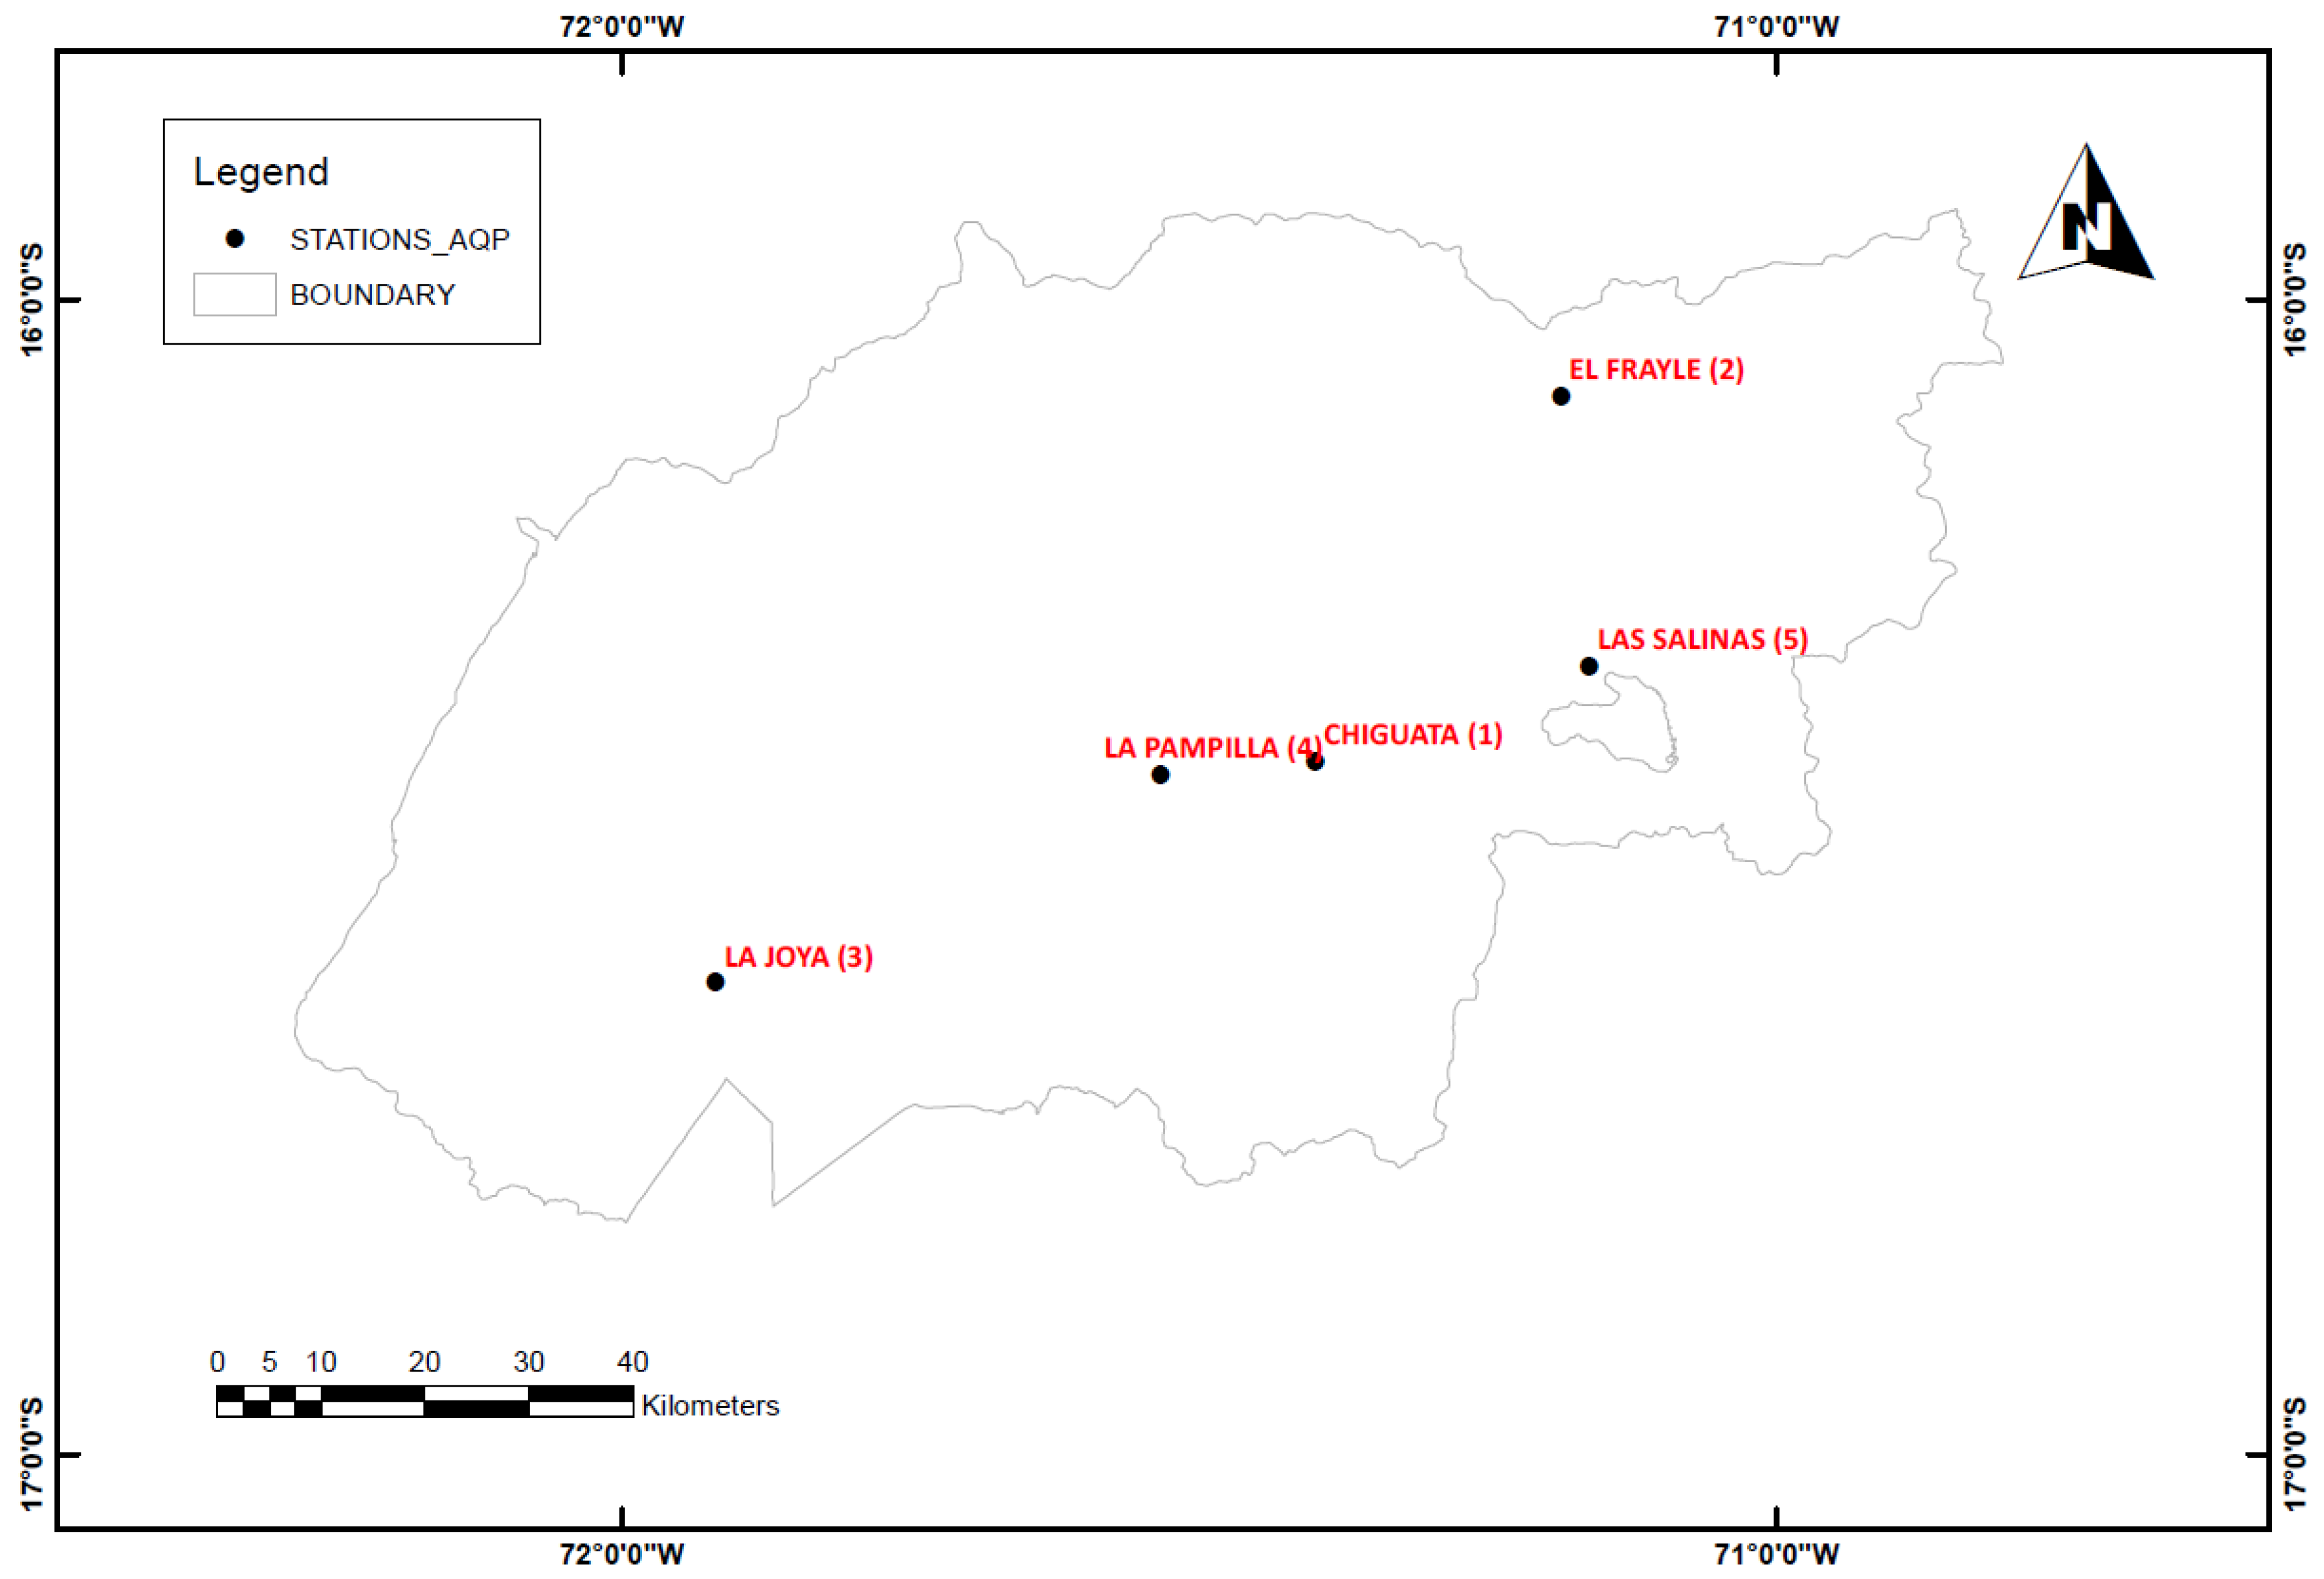
Figure 2.
Q-Q plot of Normal distribution at Station: Las Salinas.
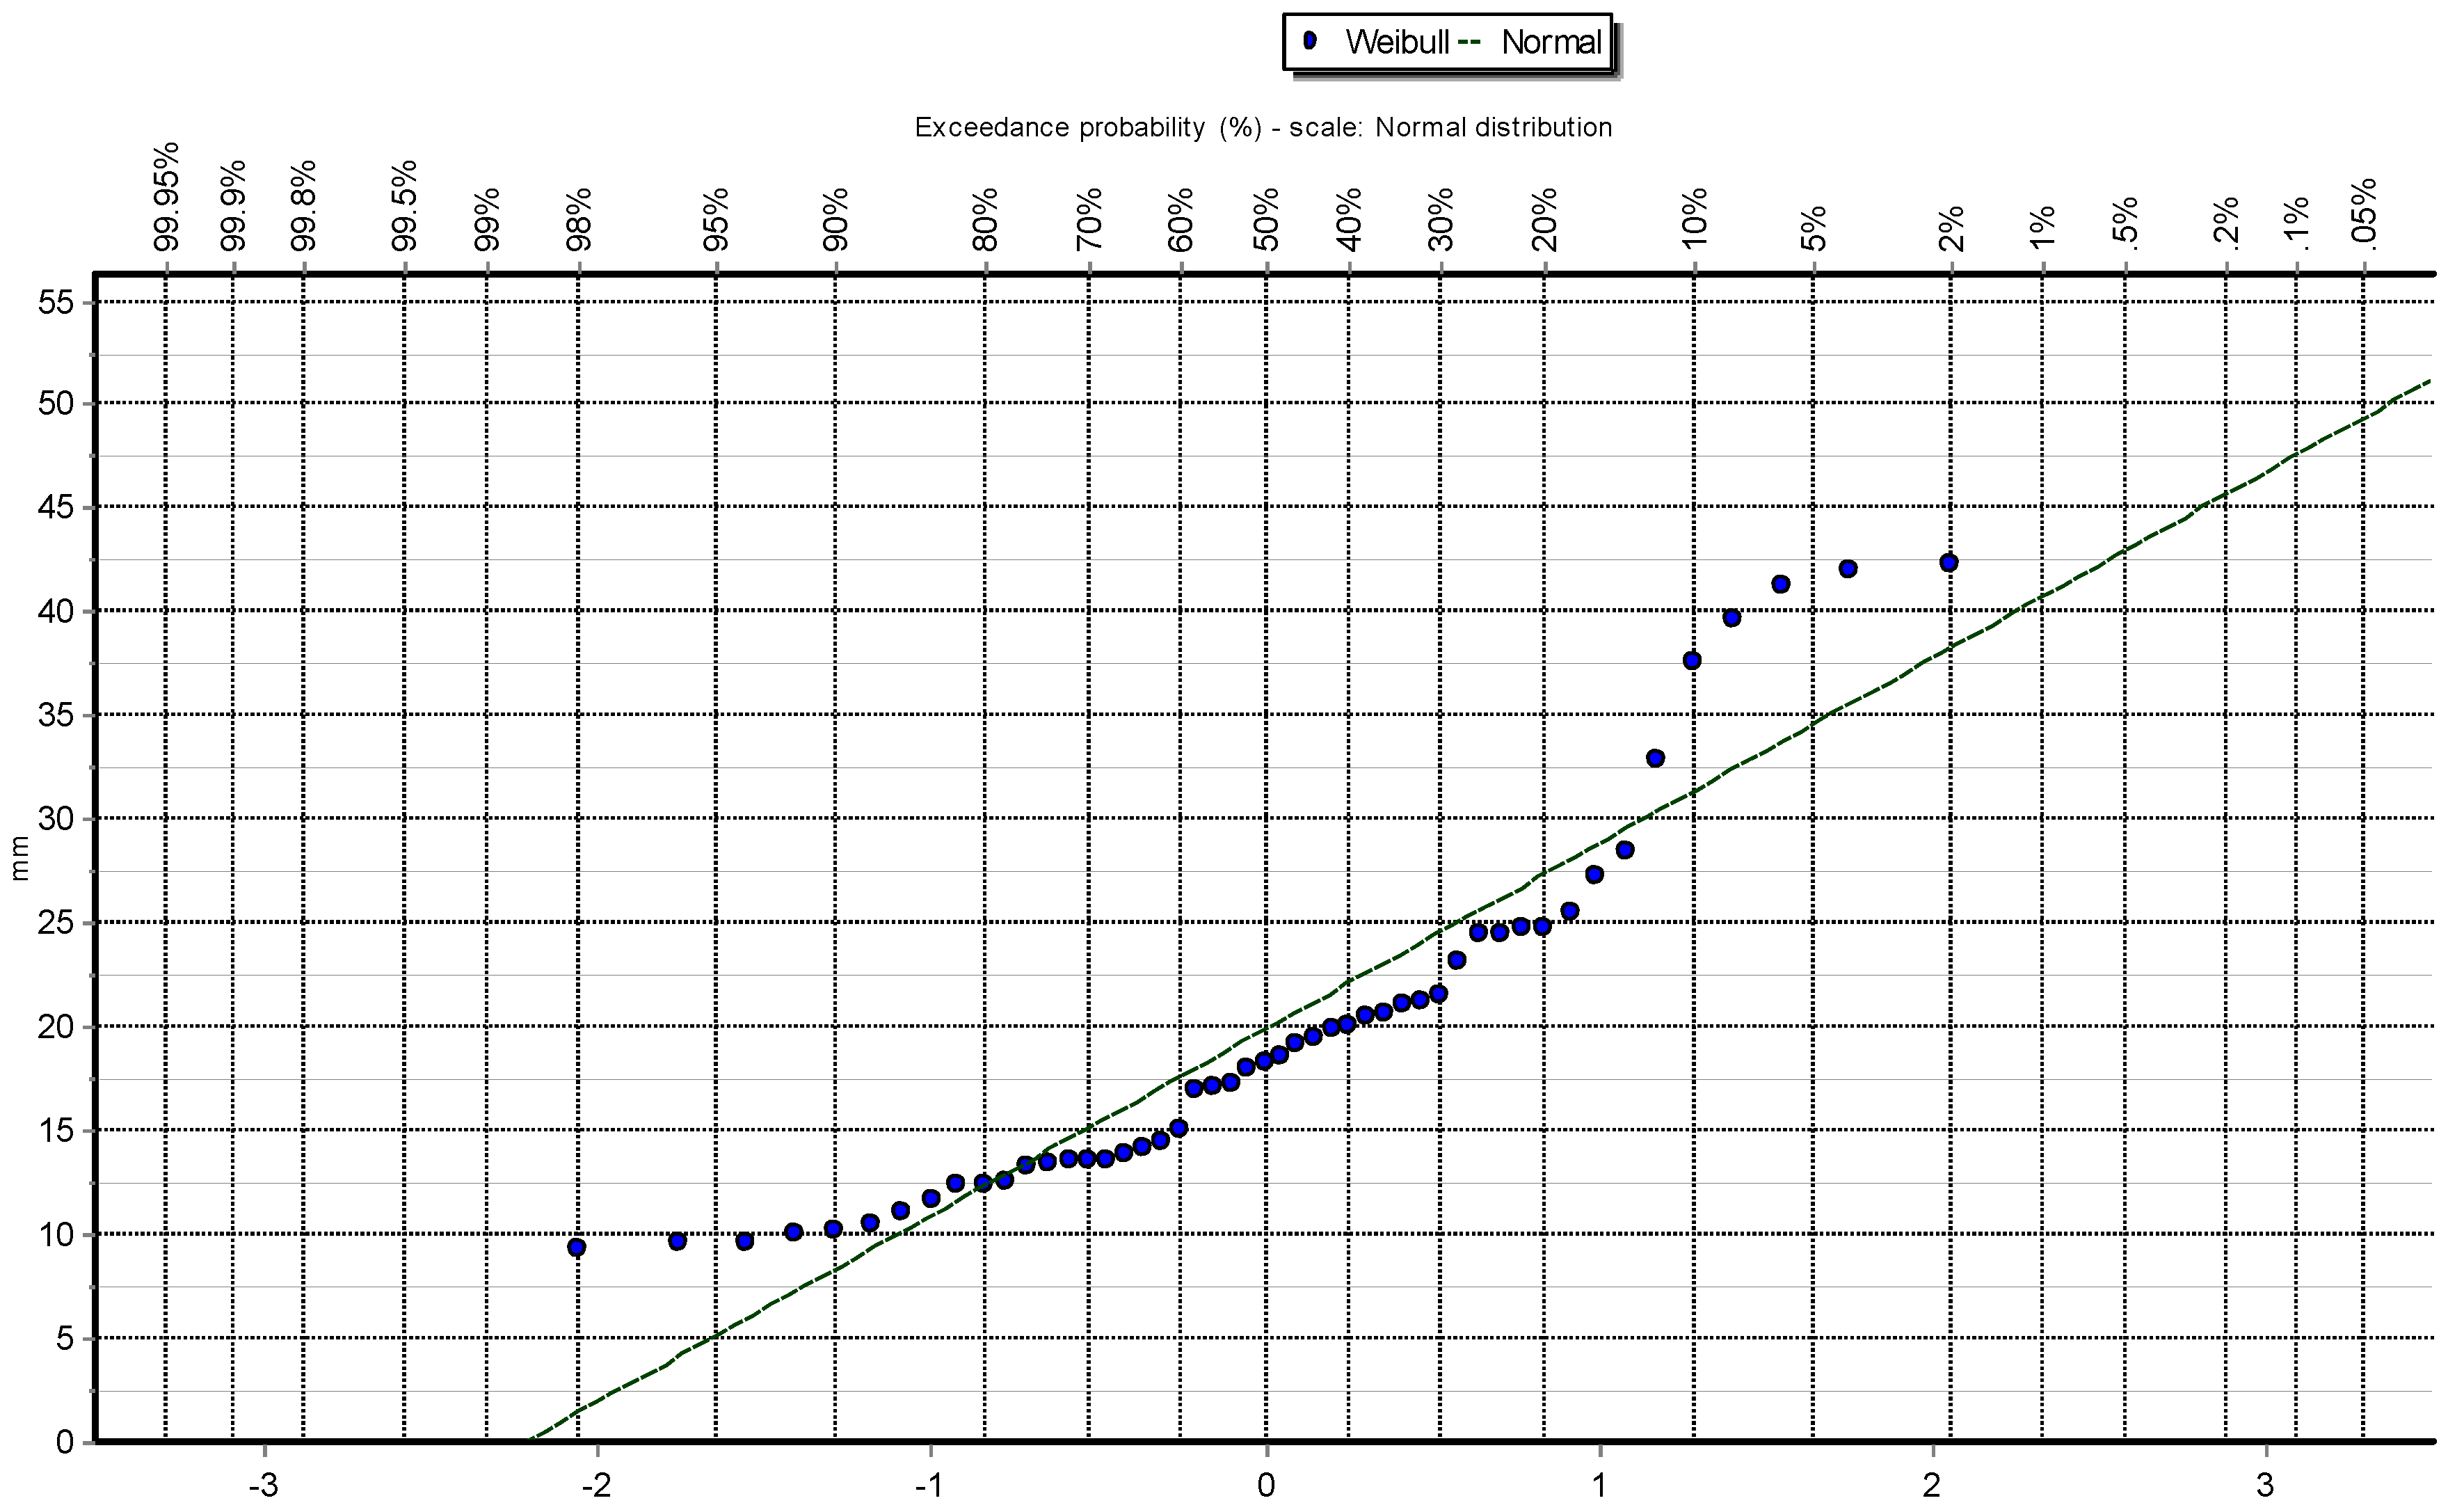
Figure 3.
Q-Q plot of Log Normal distribution at Station: Las Salinas.
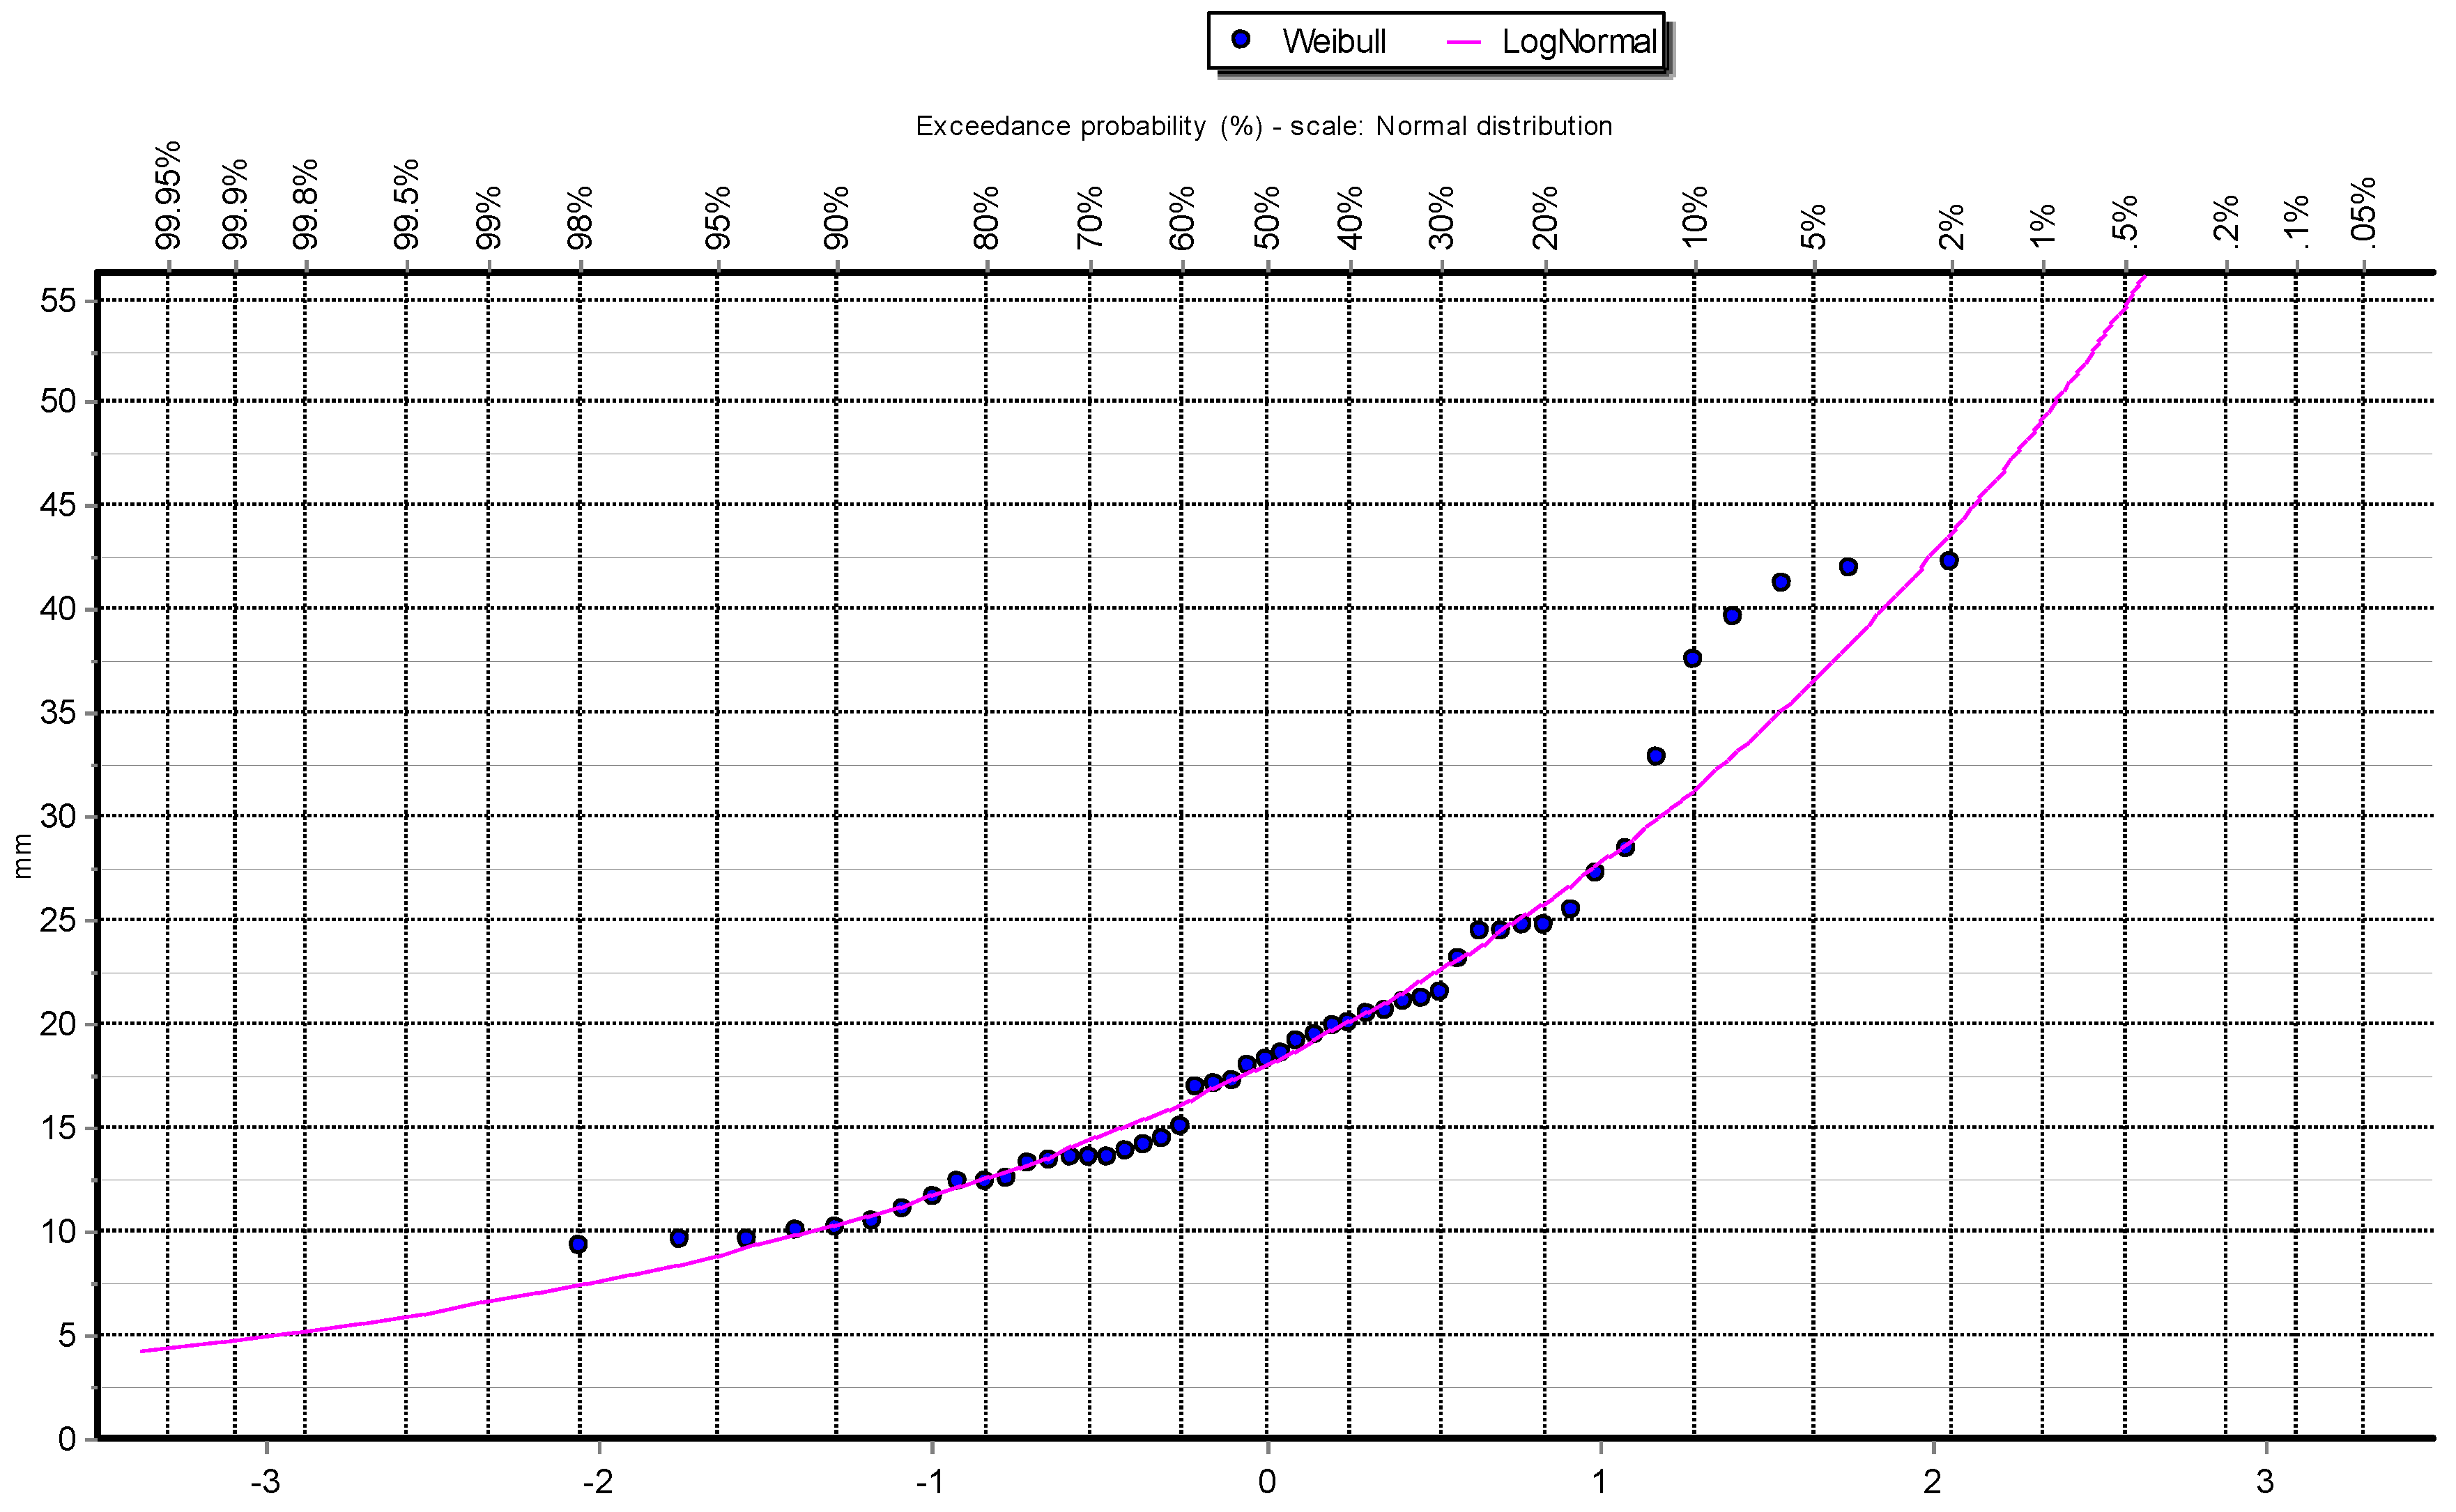
Figure 4.
Q-Q plot of Pearson III distribution at Station: Las Salinas.
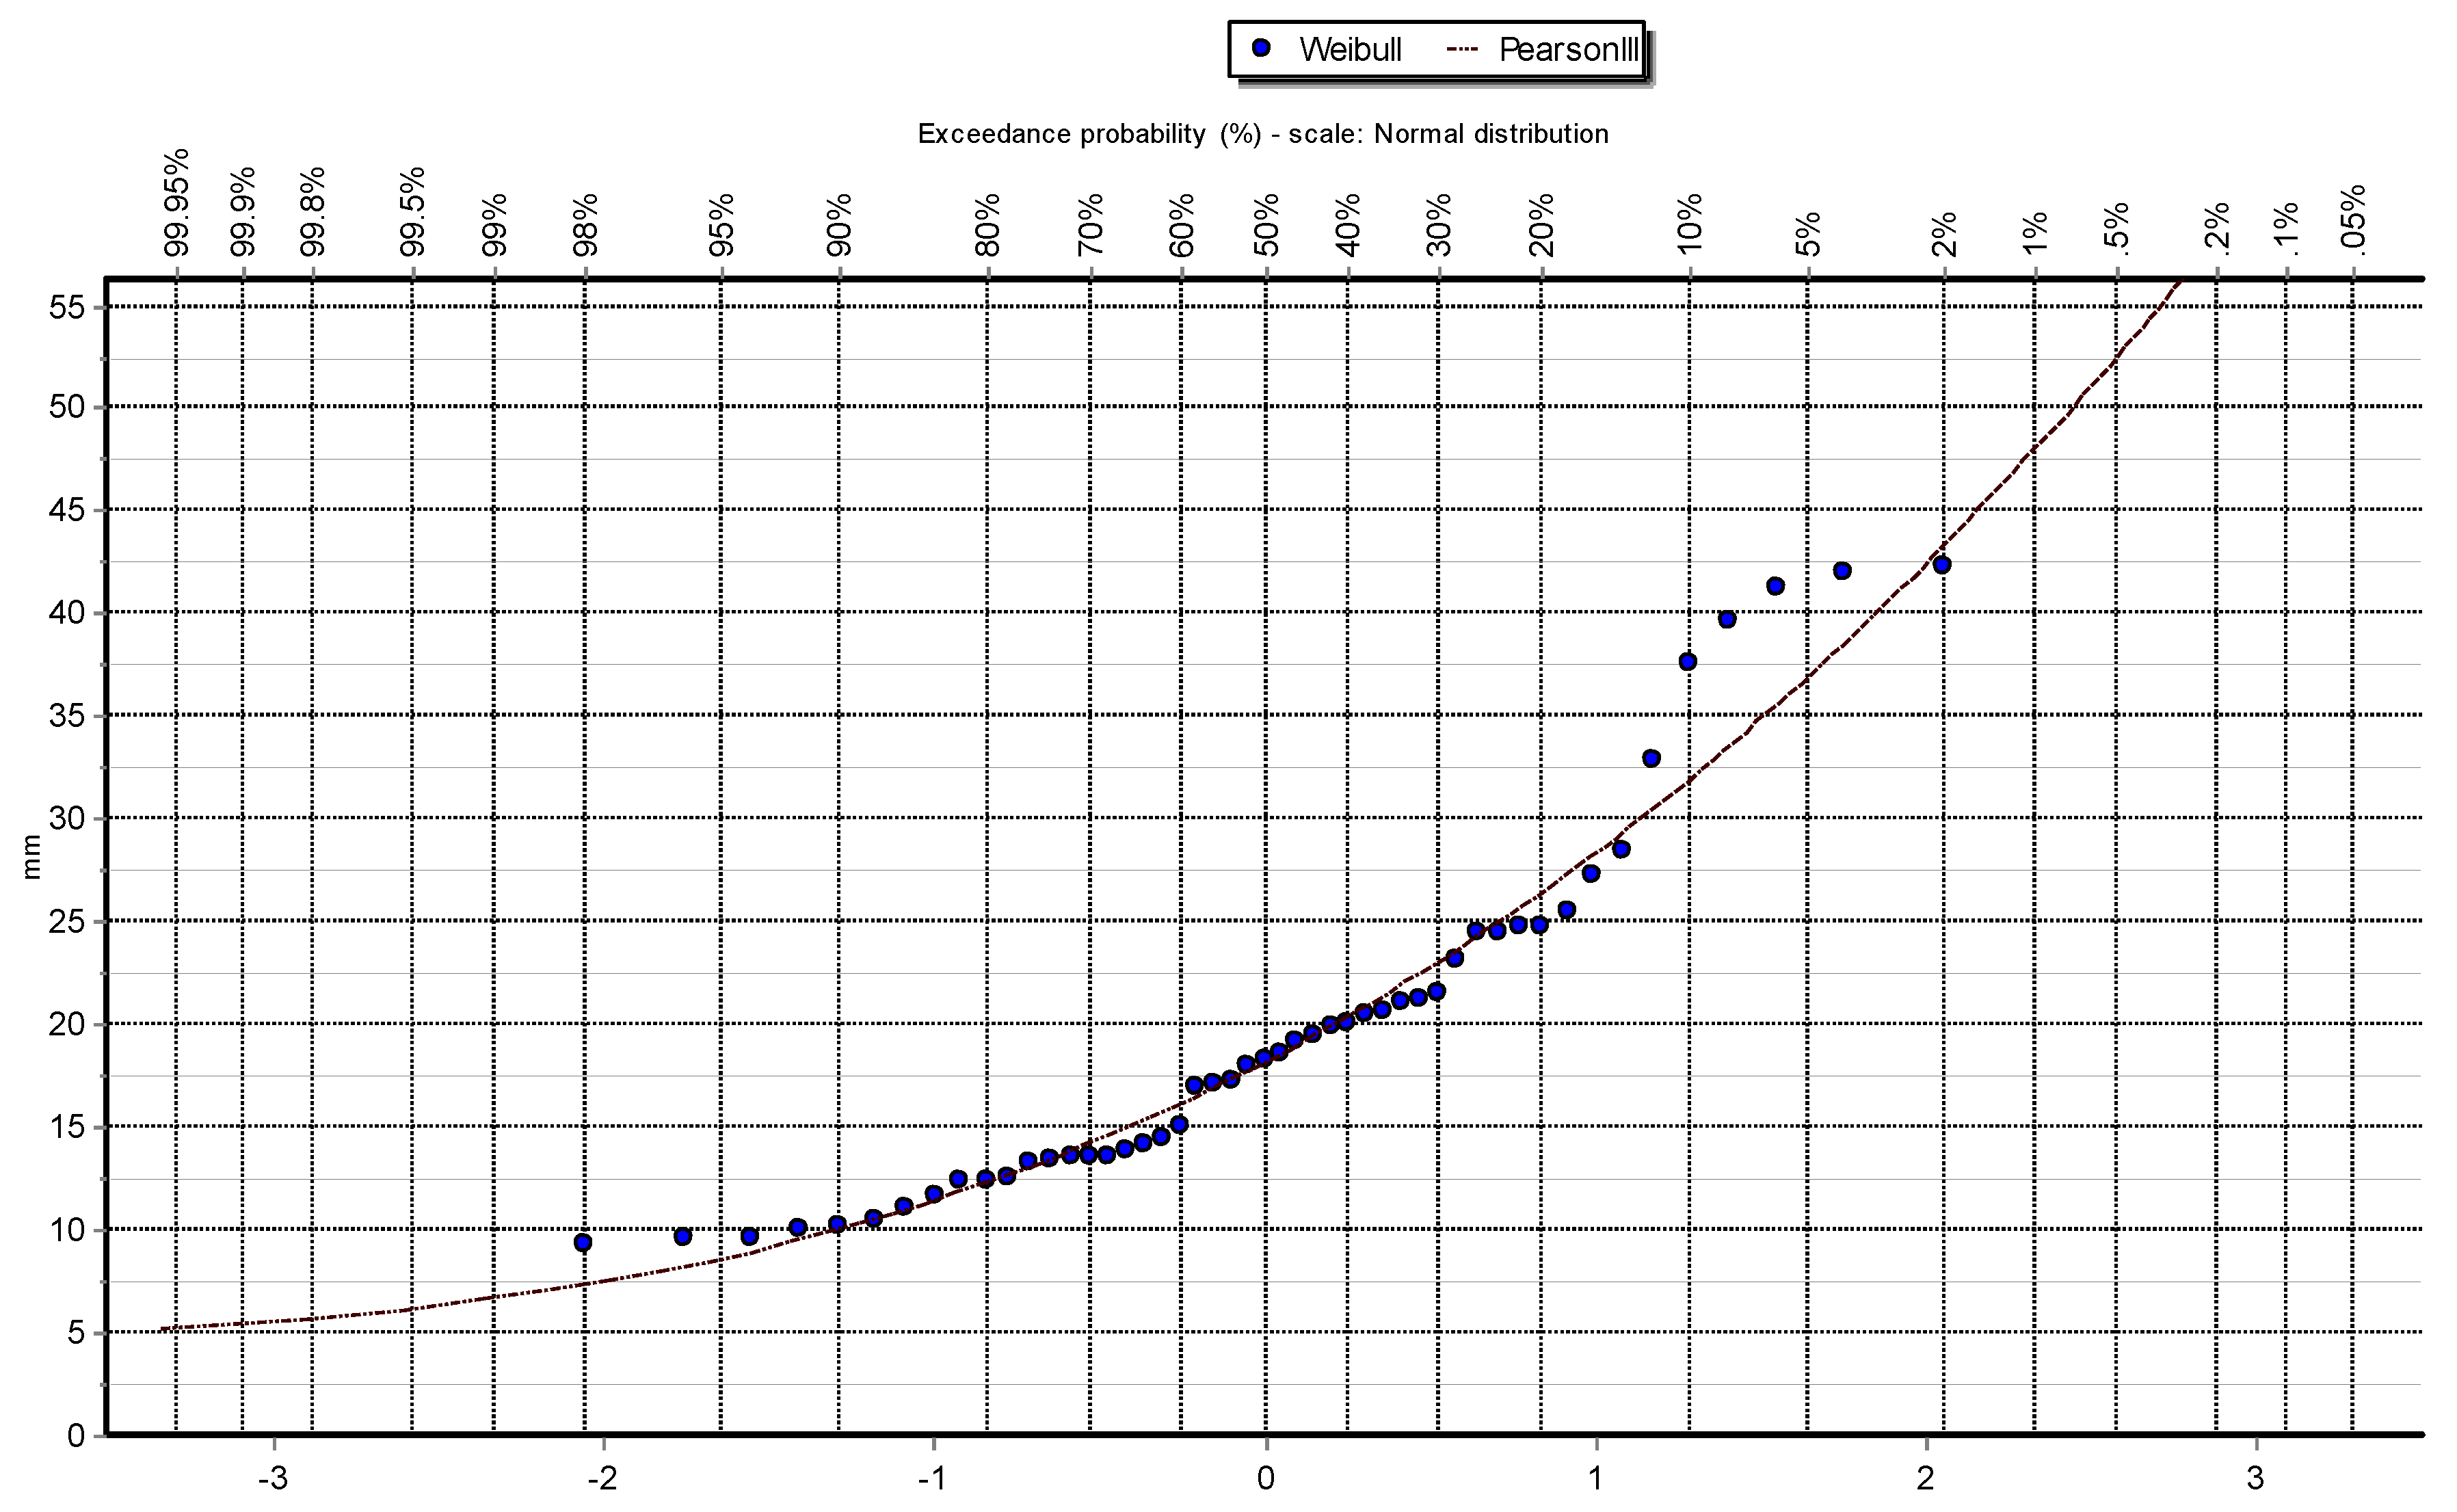
Figure 5.
Q-Q plot of GEV Min distribution at Station: Las Salinas.
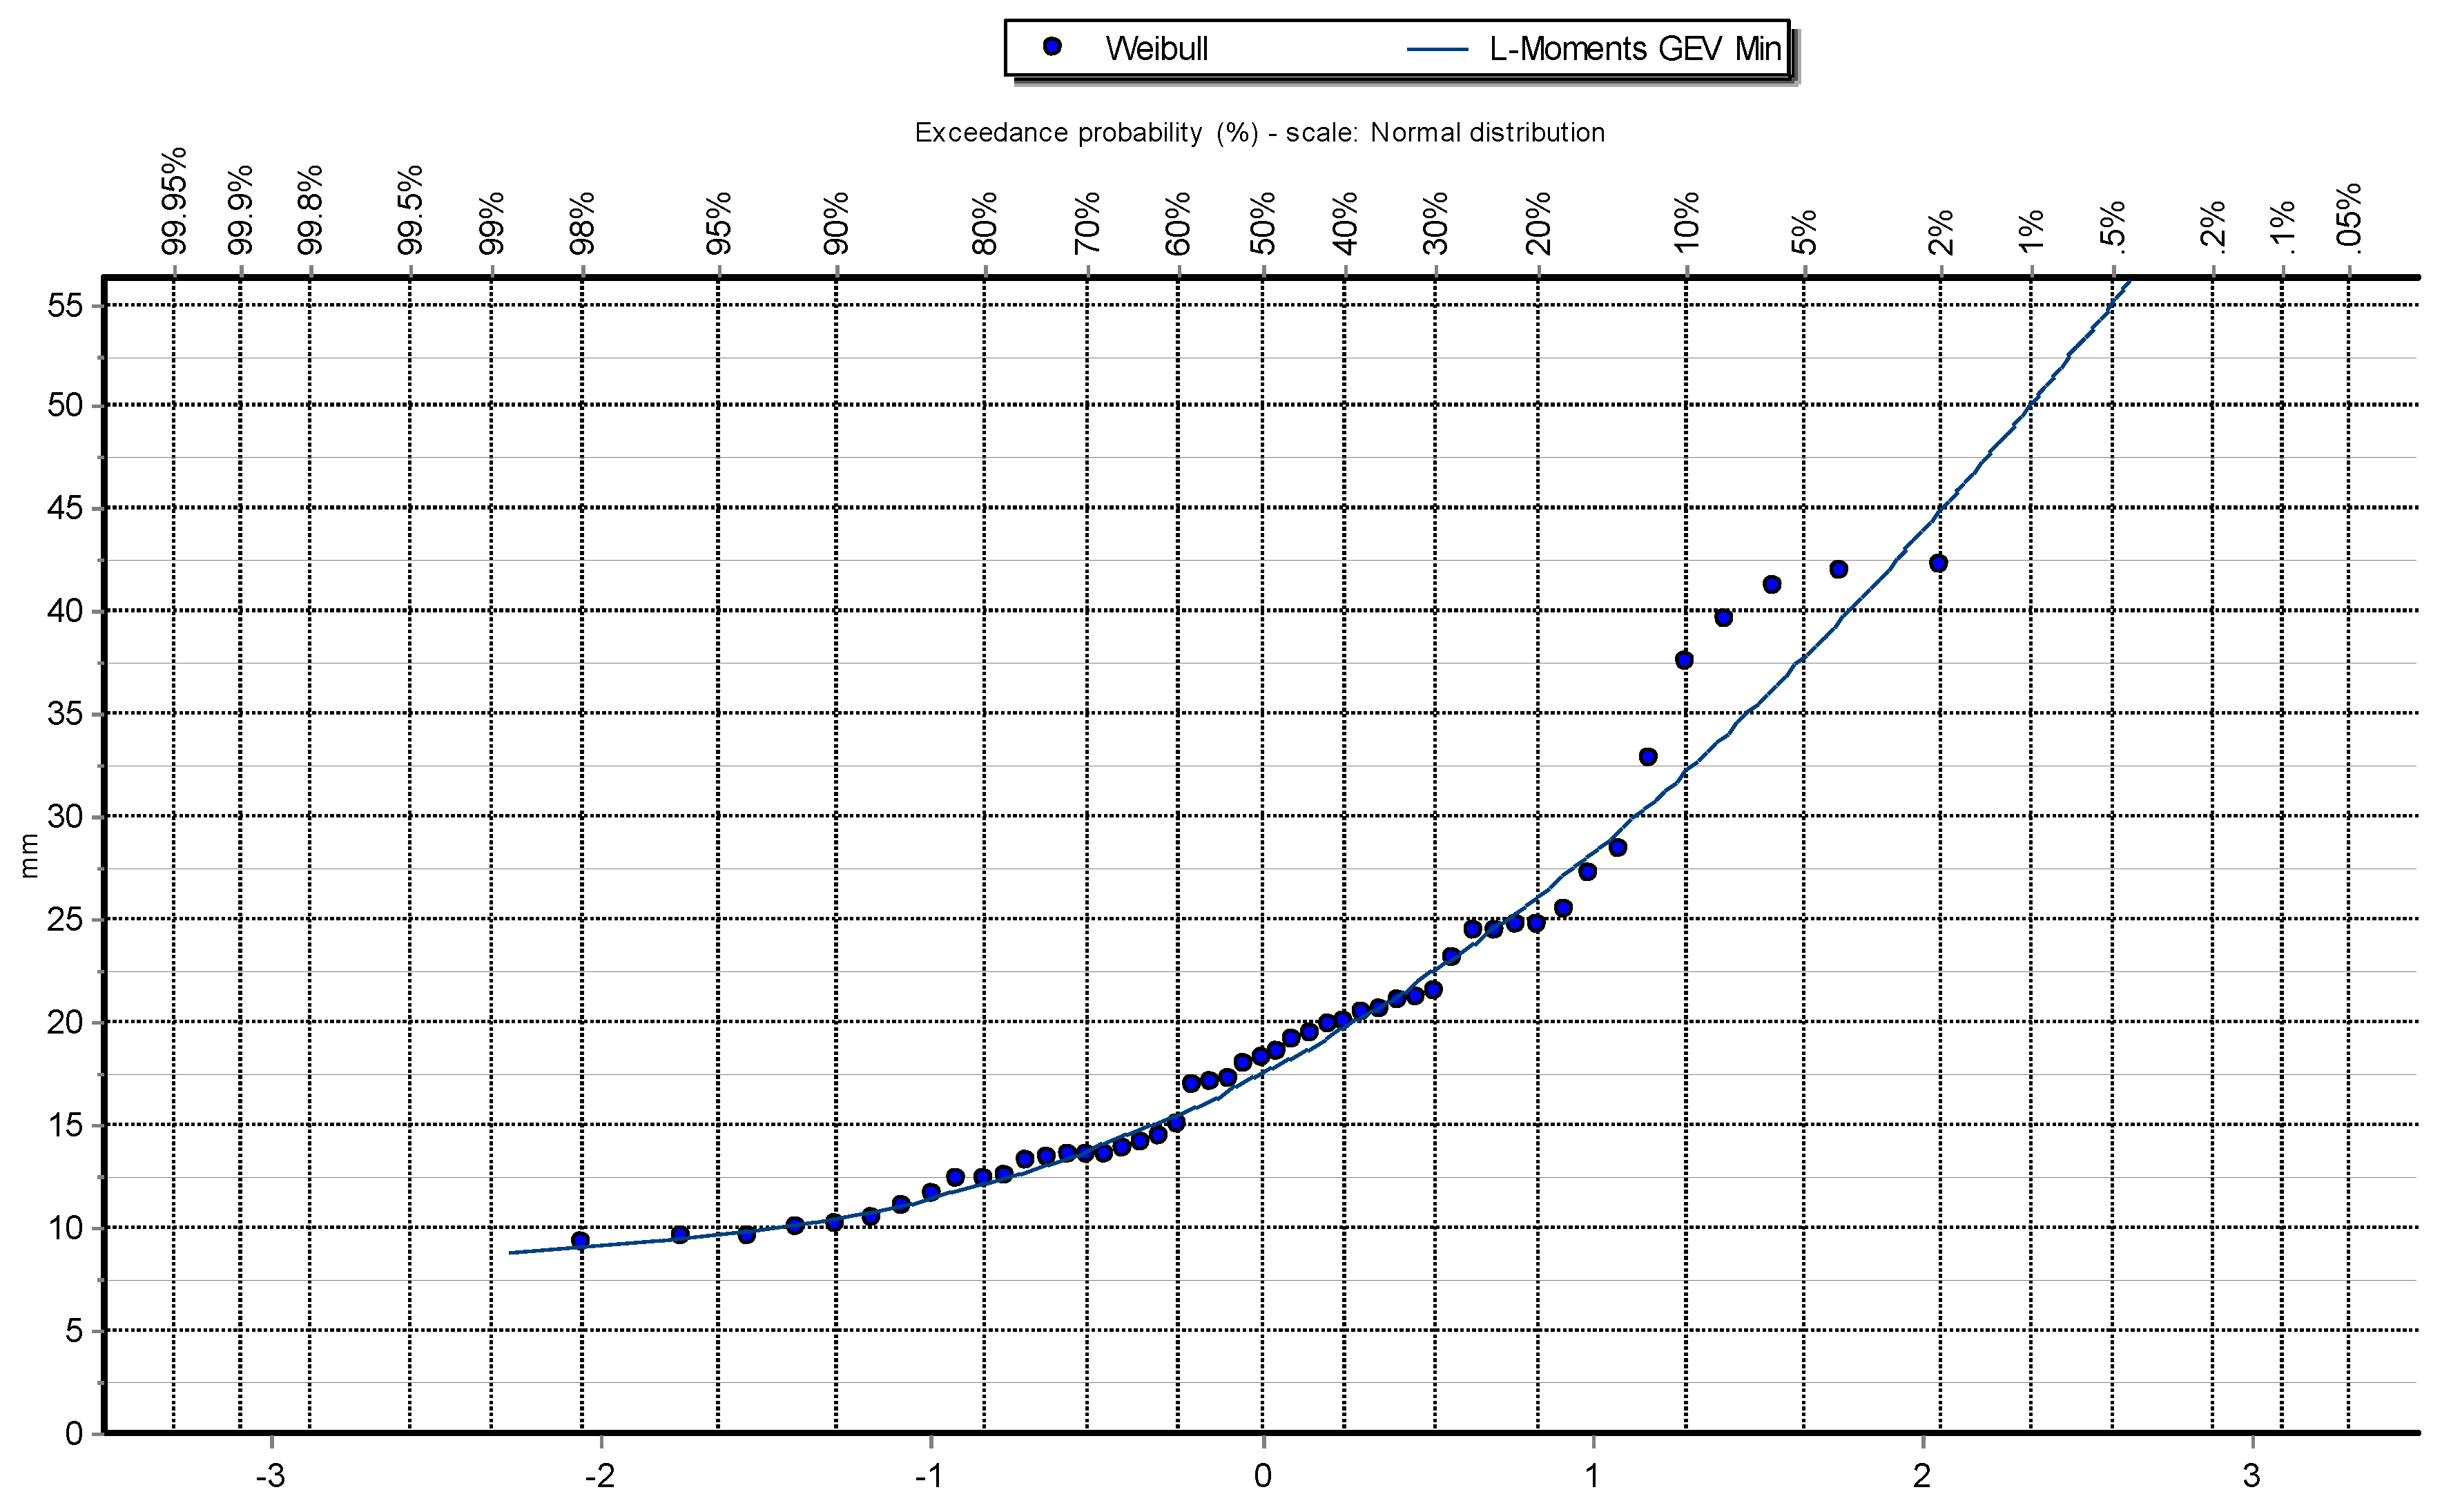
Figure 6.
Q-Q plot of Log Pearson III distribution at Station: Las Salinas.
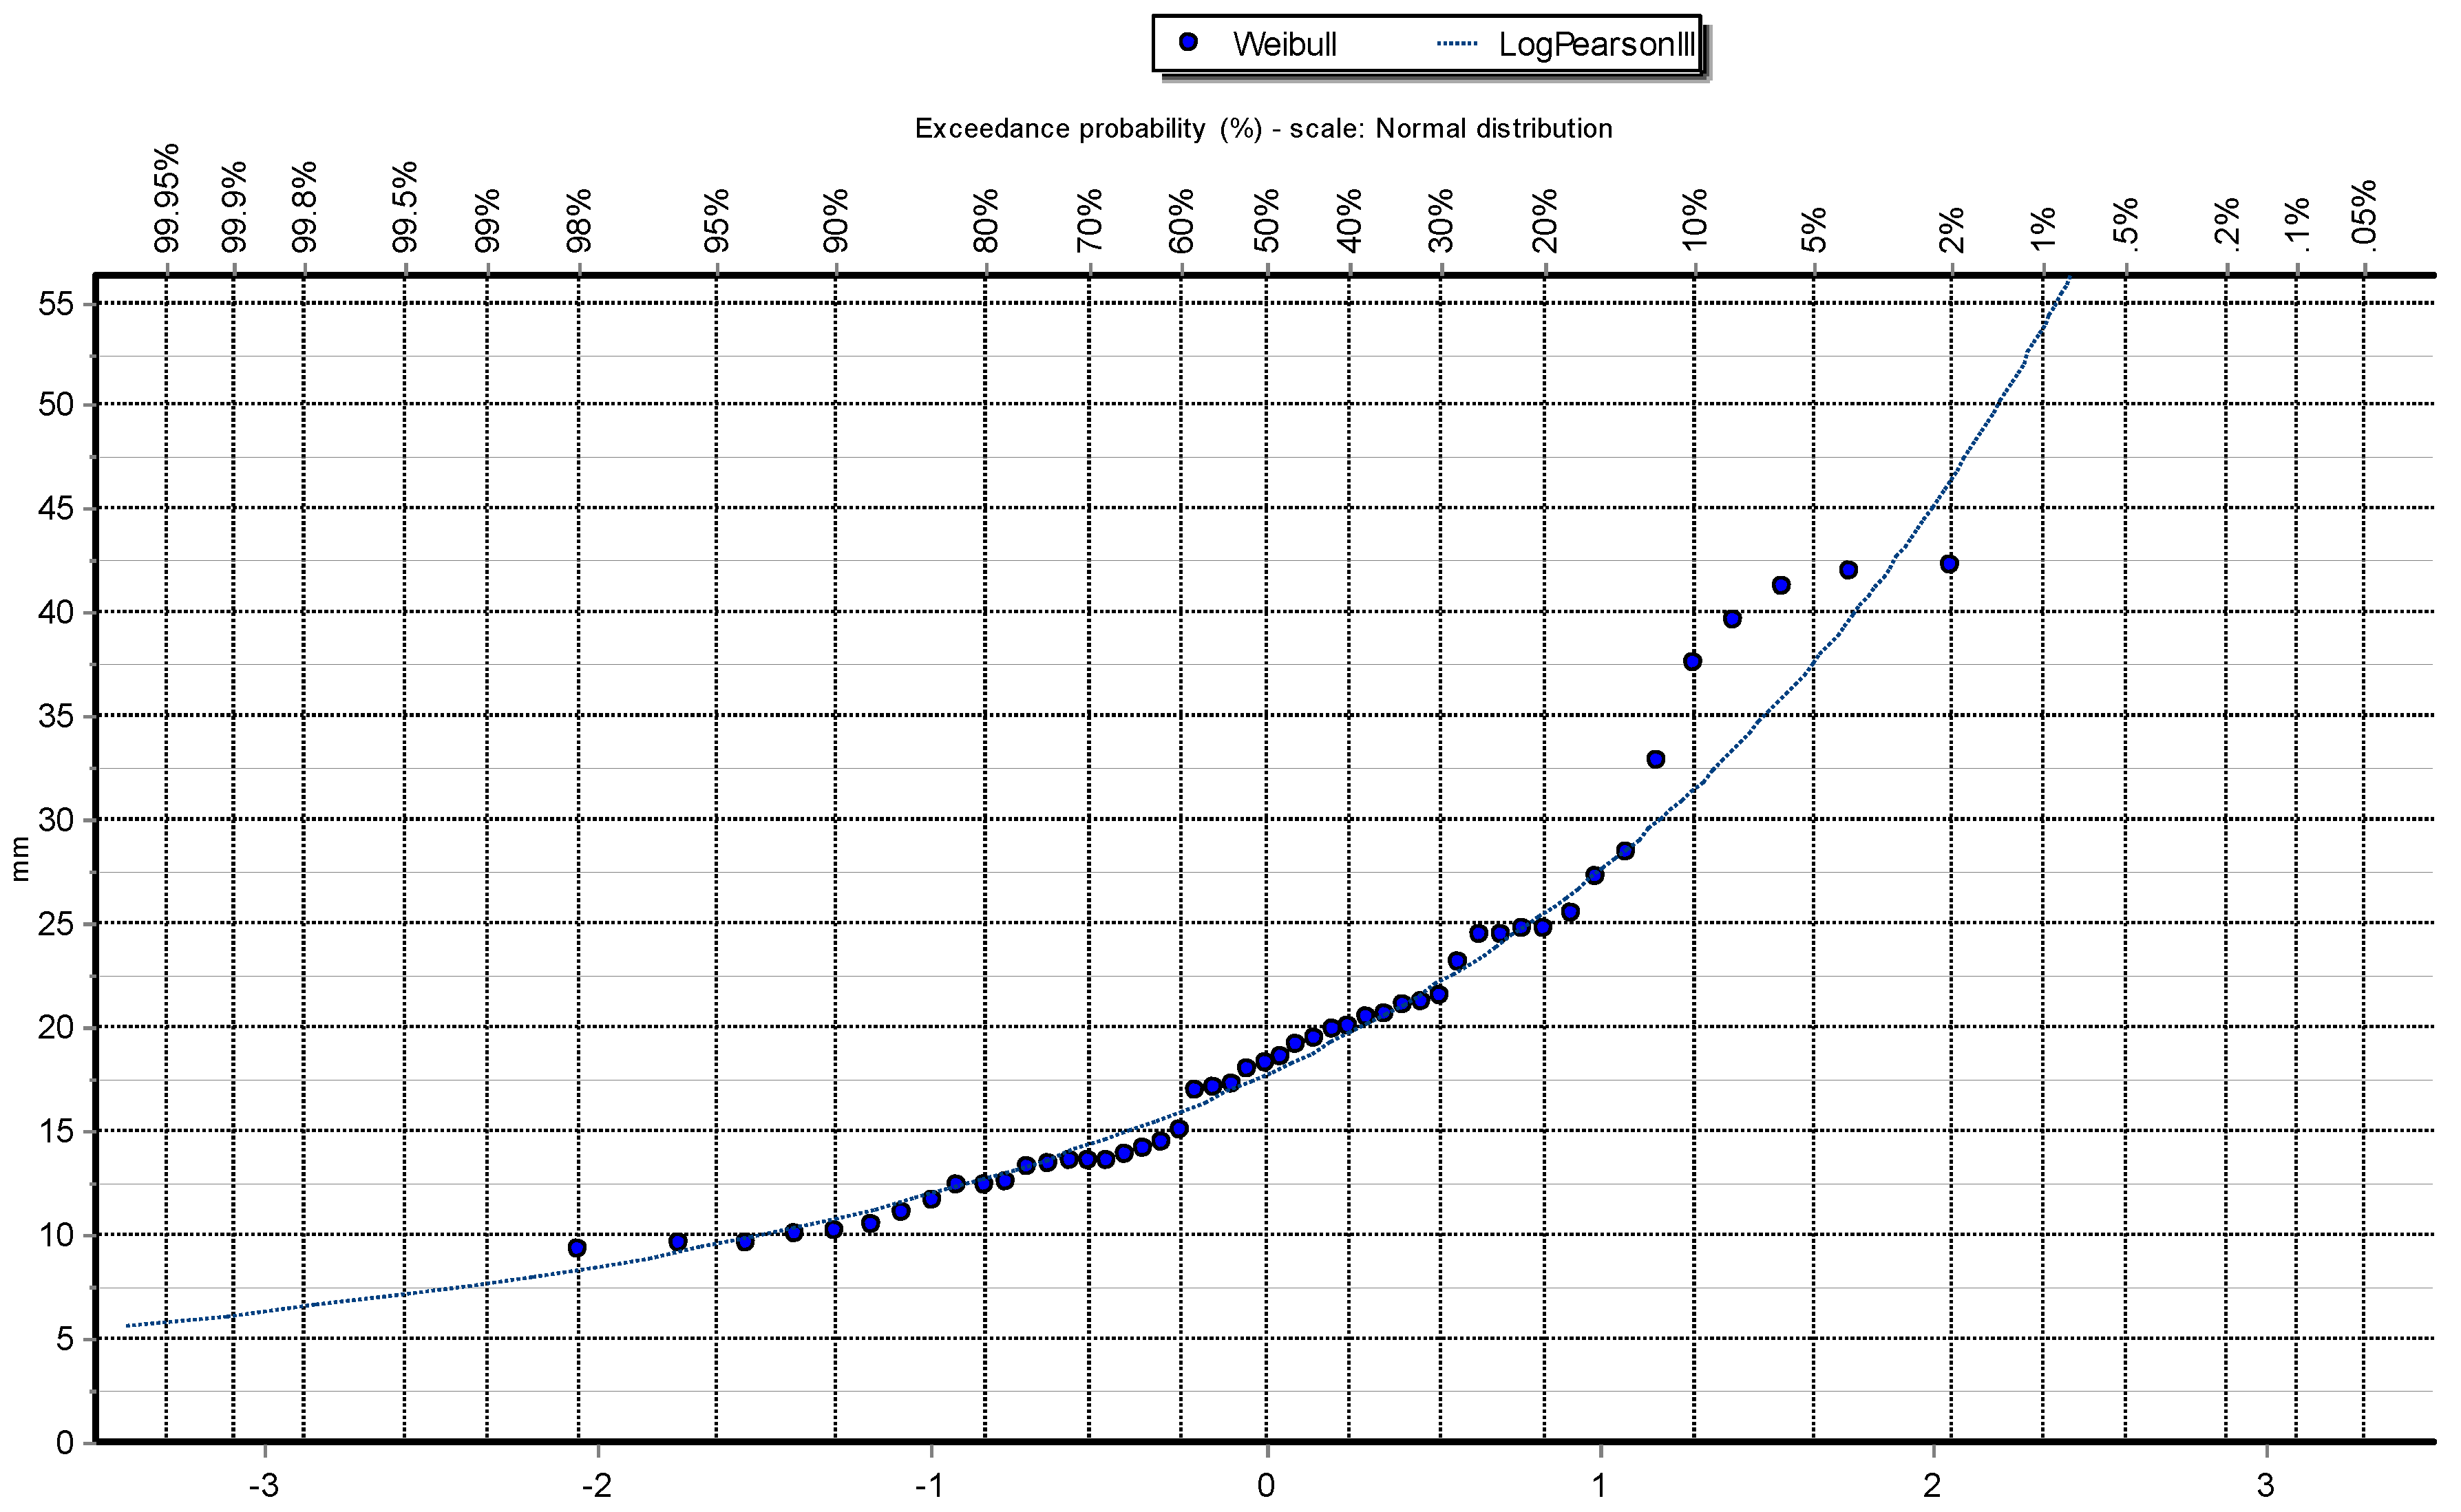
Figure 7.
Return Periods for each station using PDF.
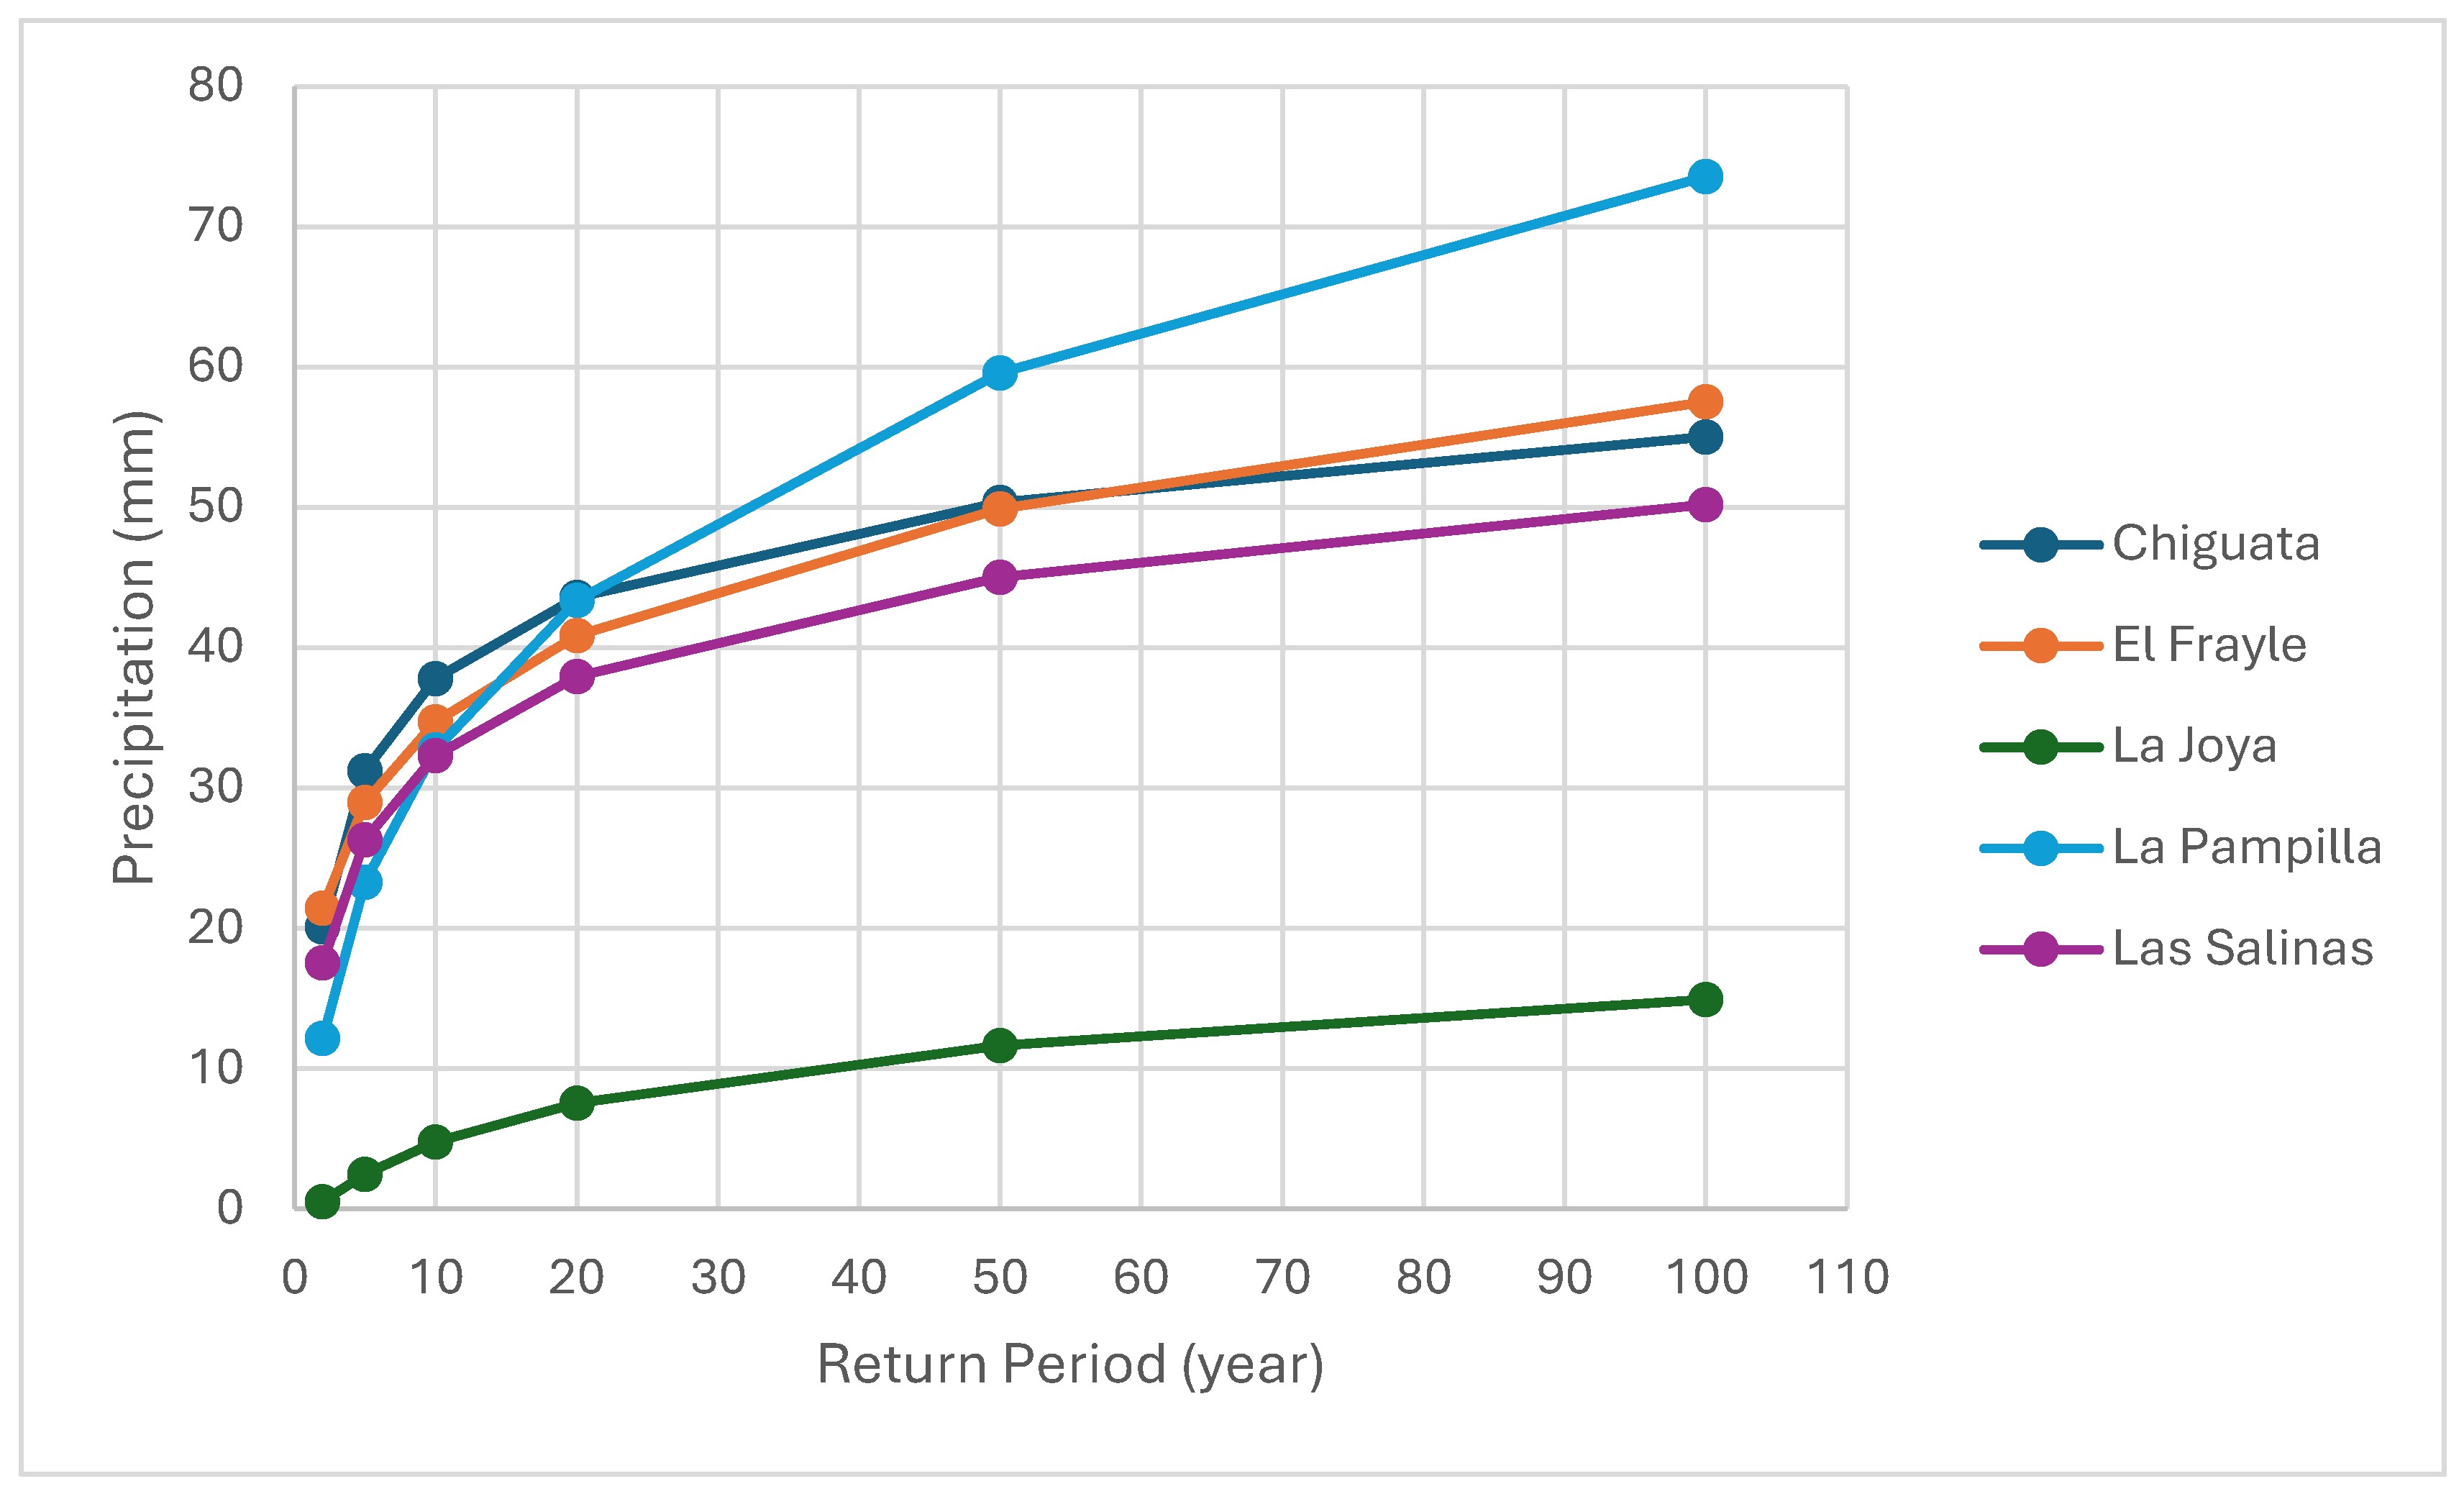
Figure 8.
Return Periods for each station using RF.
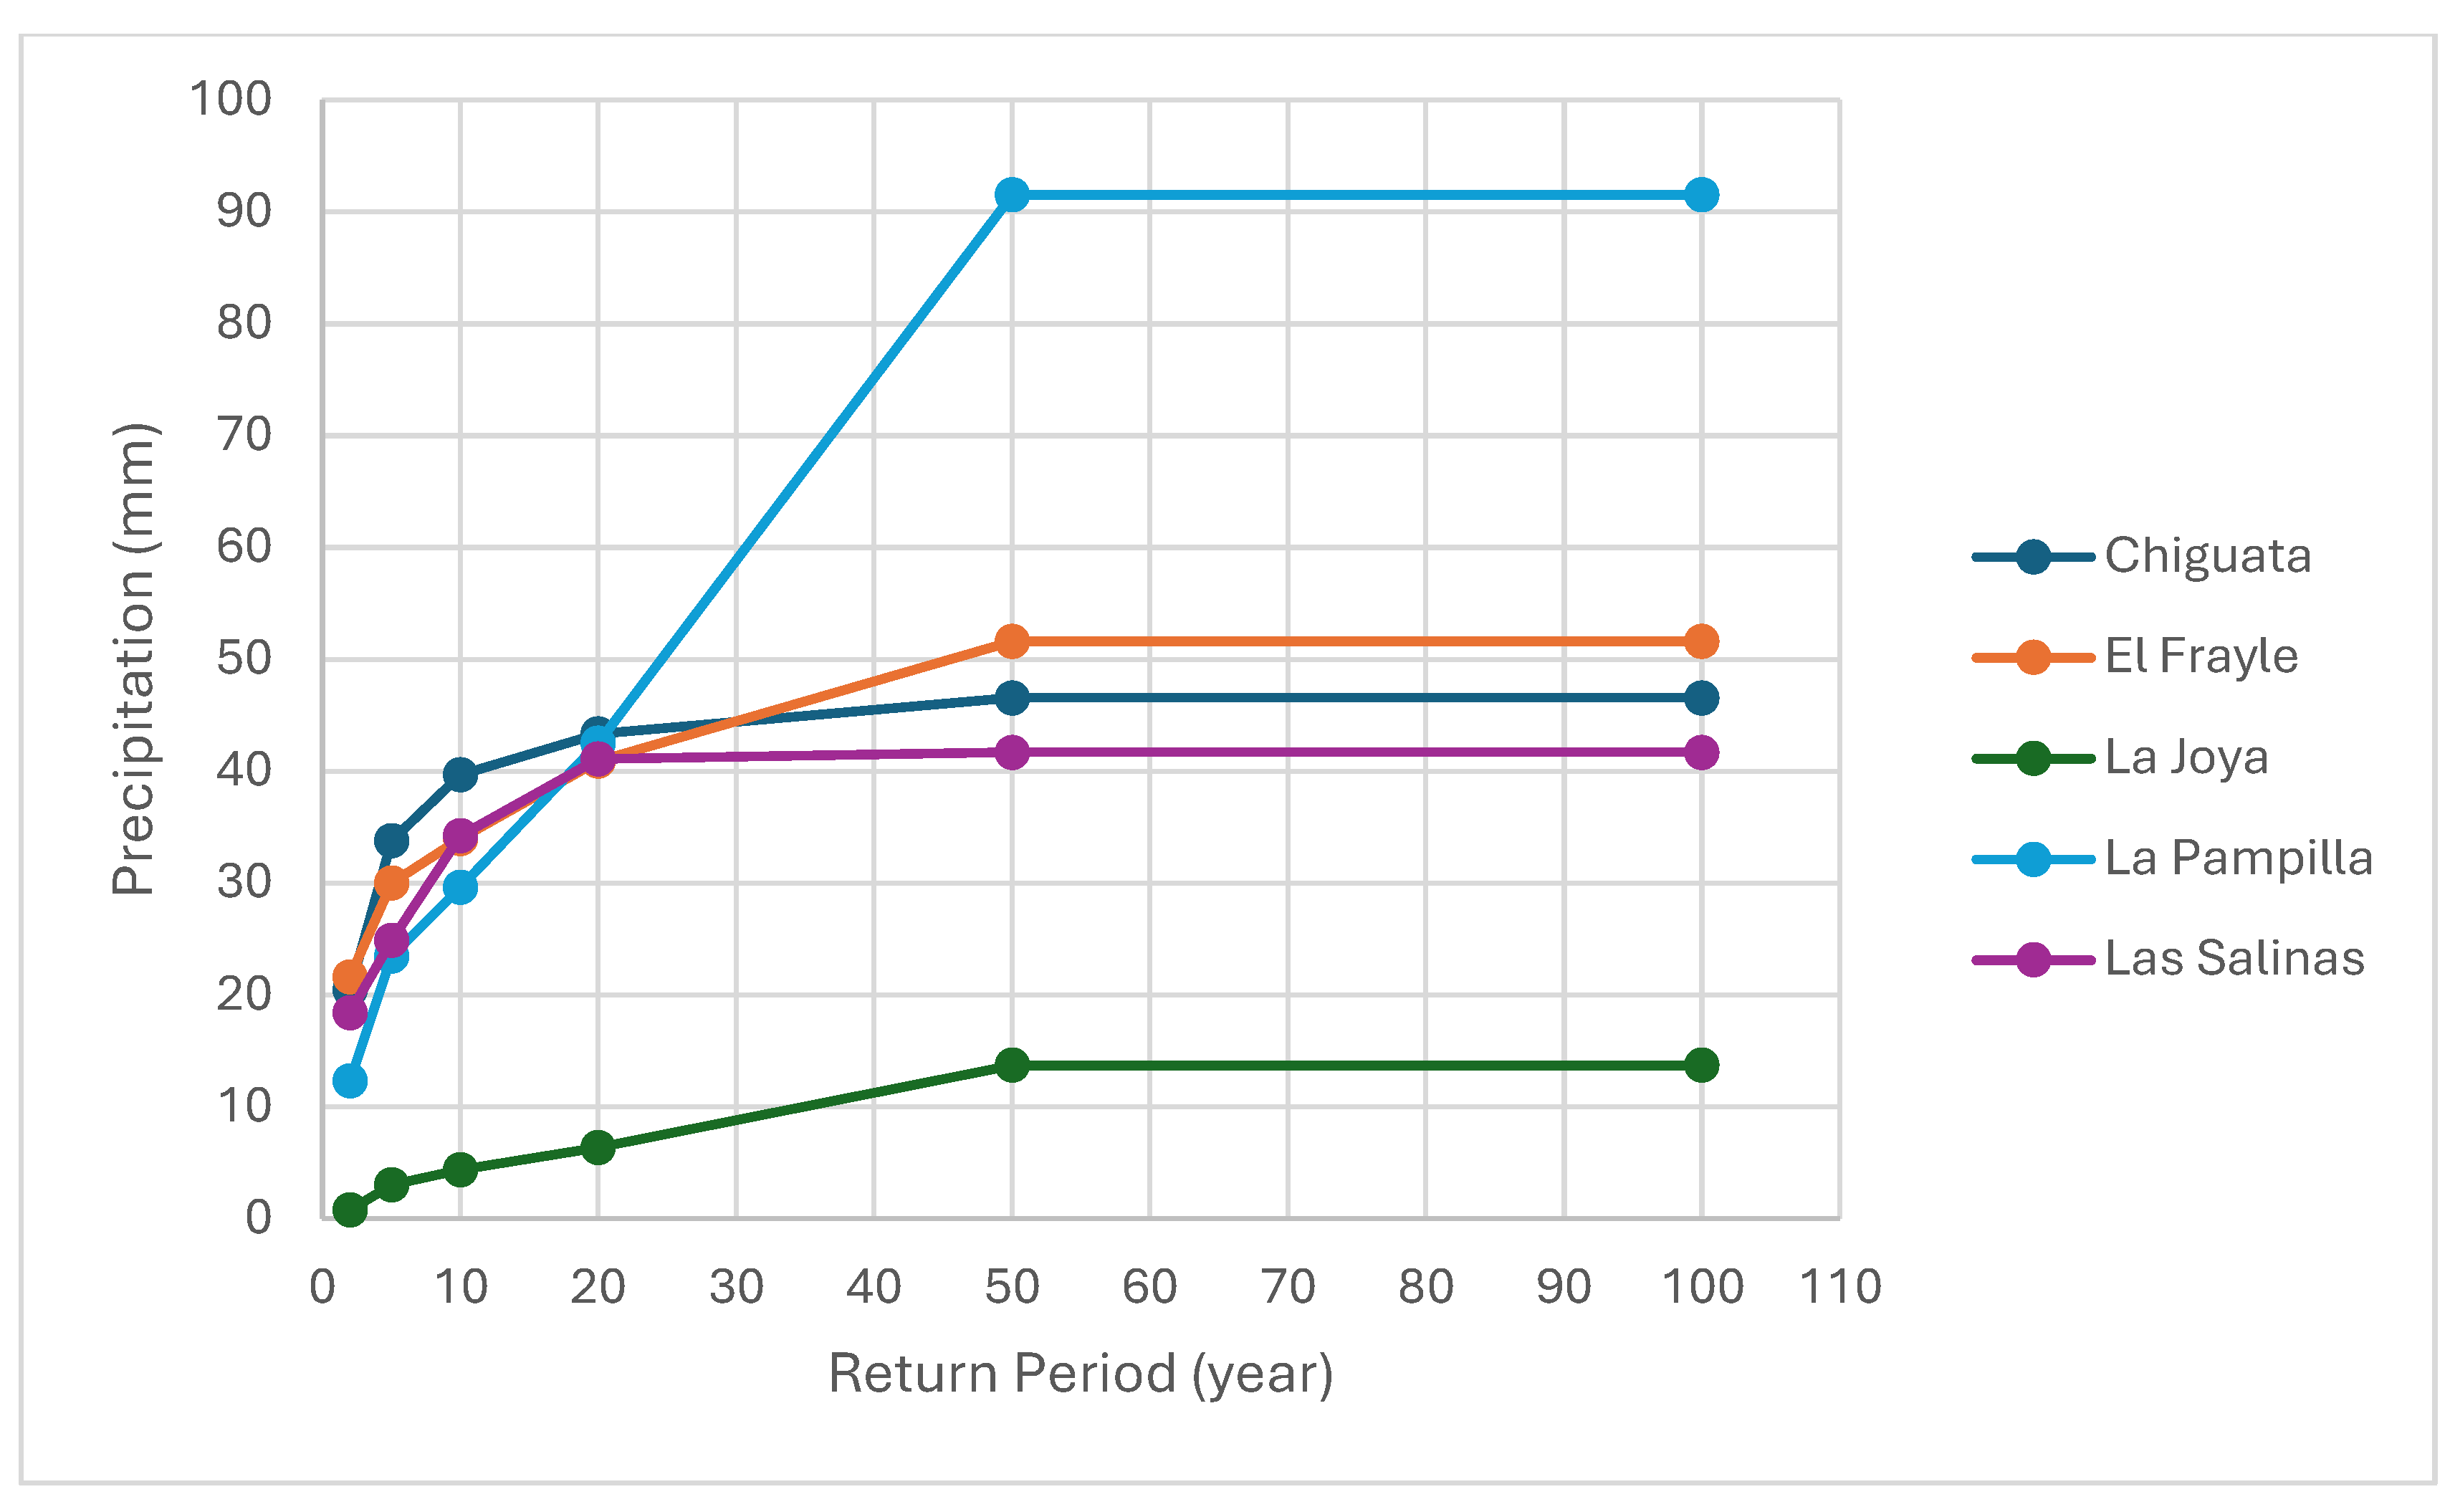

Table 1.
Statistical results and Best-Fit Distribution for each station with comparison of RMSE for Best-Fit Distribution and Random Forest.
Table 1.
Statistical results and Best-Fit Distribution for each station with comparison of RMSE for Best-Fit Distribution and Random Forest.
| N° | Station Name | Mean | Standard Deviation | Best Fit Statistic Results | RMSE of Best-Fit Distribution | RMSE of RF | |
|---|---|---|---|---|---|---|---|
| By K-S Test | D max | ||||||
| 1 | Chiguata | 21.8 | 11.4 | GEV - Min (L-Moments) | 0.05815 | 1.3572 | 0.9108 |
| 2 | El Frayle* | 23.6 | 8.9 | GEV - Max (k specified, L-Moments) | 0.06645 | 1.1408 | 1.4561 |
| 3 | La Joya | 1.8 | 3 | Pearson III | 0.10001 | 0.3698 | 0.0779 |
| 4 | La Pampilla | 16.7 | 18.4 | Log Pearson III | 0.04174 | 1.204 | 0.621 |
| 5 | Las Salinas | 19.8 | 9 | GEV - Min (L-Moments) | 0.0503 | 1.7653 | 1.1432 |
Table 2.
Return Periods results with PDFs.
| N° | Station Name | Return Period using the Best Fit Distribution (mm) | |||||
|---|---|---|---|---|---|---|---|
| 2 | 5 | 10 | 20 | 50 | 100 | ||
| 1 | Chiguata | 20.0623 | 31.205 | 37.7953 | 43.5582 | 50.3423 | 55.0198 |
| 2 | El Frayle | 21.4111 | 28.9544 | 34.7028 | 40.8594 | 49.8822 | 57.5199 |
| 3 | La Joya | 0.50552 | 2.44163 | 4.77694 | 7.544 | 11.6142 | 14.9007 |
| 4 | La Pampilla | 12.1171 | 23.2693 | 32.7275 | 43.3751 | 59.5553 | 73.5711 |
| 5 | Las Salinas | 17.5087 | 26.2854 | 32.2689 | 37.9196 | 45.0286 | 50.1978 |
Table 3.
Return Periods results with RF.
| N° | Station Name | Return Period using Random Forest (mm) | |||||
|---|---|---|---|---|---|---|---|
| 2 | 5 | 10 | 20 | 50 | 100 | ||
| 1 | Chiguata | 20.4393 | 33.797 | 39.641 | 43.304 | 46.5453 | 46.5453 |
| 2 | El Frayle | 21.6073 | 30.0127 | 33.9537 | 40.8773 | 51.587 | 51.587 |
| 3 | La Joya | 0.7347 | 3.02 | 4.3387 | 6.3653 | 13.676 | 13.676 |
| 4 | La Pampilla | 12.2967 | 23.4273 | 29.6063 | 42.4827 | 91.5047 | 91.5047 |
| 5 | Las Salinas | 18.3933 | 24.8417 | 34.188 | 41.0773 | 41.6797 | 41.6797 |
Disclaimer/Publisher’s Note: The statements, opinions and data contained in all publications are solely those of the individual author(s) and contributor(s) and not of MDPI and/or the editor(s). MDPI and/or the editor(s) disclaim responsibility for any injury to people or property resulting from any ideas, methods, instructions or products referred to in the content. |
© 2024 by the authors. Licensee MDPI, Basel, Switzerland. This article is an open access article distributed under the terms and conditions of the Creative Commons Attribution (CC BY) license (http://creativecommons.org/licenses/by/4.0/).
Copyright: This open access article is published under a Creative Commons CC BY 4.0 license, which permit the free download, distribution, and reuse, provided that the author and preprint are cited in any reuse.