
Submitted:
05 November 2024
Posted:
06 November 2024
You are already at the latest version
Abstract
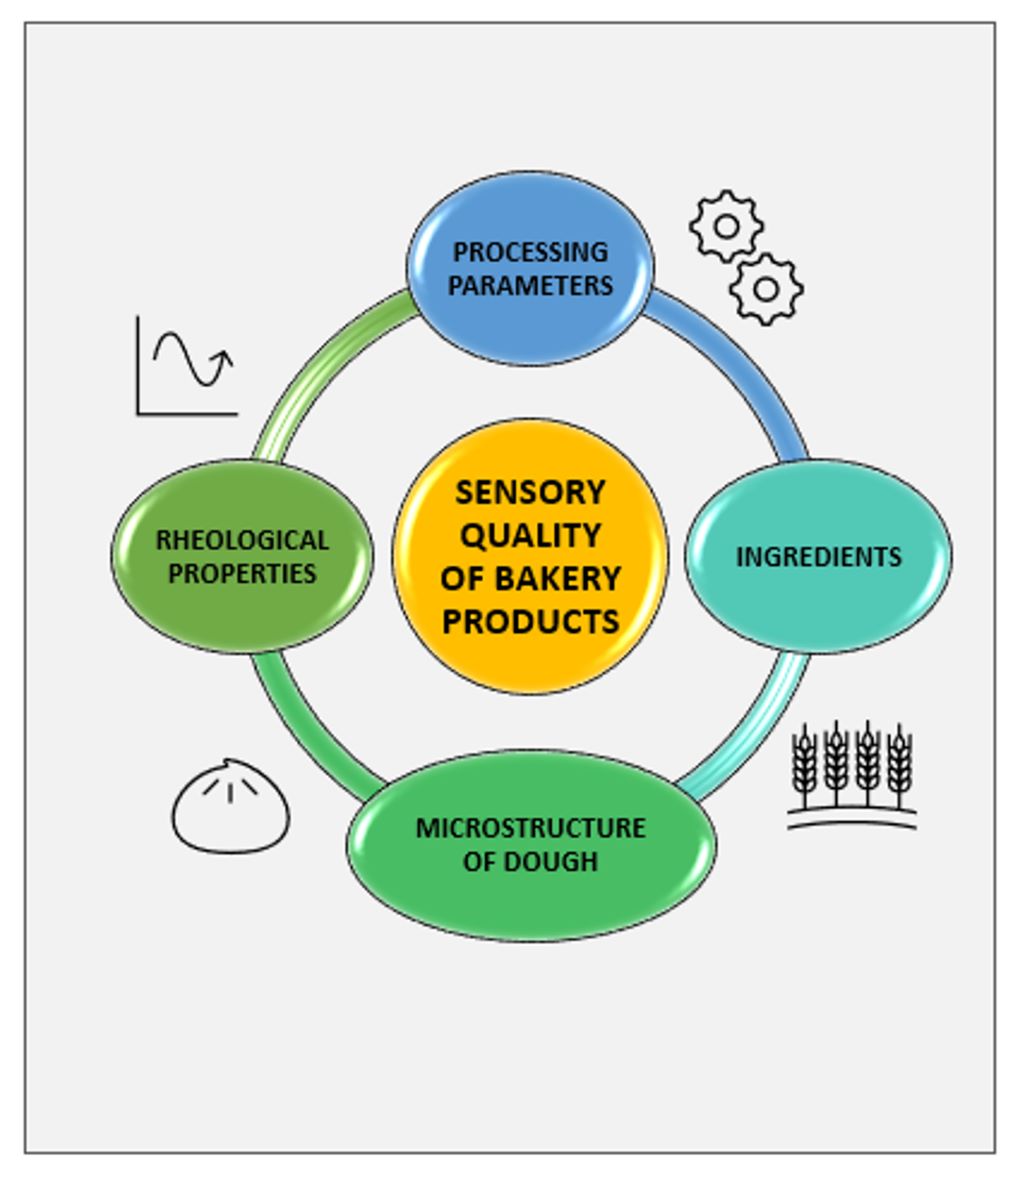
The quality of bread is mainly affected by the three key phases of the production chain: kneading, leavening and baking. Each step contributes to the final rheological and sensory properties of the bread. However, especially during the mixing phase, the choice of ingredients and the optimization of processing parameters such as mixing time, dough temperature, mixing speed and total water content, affect the development and microstructure of the dough.
In general, rheological tests measure the technological properties of doughs and represent the main analyses carried out in the bakery sector. Considering the heterogeneity and variability of raw materials and processing conditions, rheology aids in process control and in the simulation of the response of the dough to the complex deformation that it undergoes during its processing. The results obtained can be related to the final structure and the texture of the bread.
Although the effects of mixing and rheological behaviour of wheat doughs have been systematically examined in the literature, there is no comprehensive review of the current knowledge about the effect of the processing on sensory quality and final texture characteristics. This paper aims to shed light on factors that affect the quality of bread, emphasizing both technological and sensory aspects.
Keywords:
bakery products
; bread
; cereal grain processing
; dough rheology
; process parameters
; quality
; sensory evaluation
; wheat flour
; mixing
1. Introduction
The baking industry plays an important role in the world's food industry. Among bakery products, bread is a staple food, and its widespread consumption ensures a steady and significant demand, which allows it to have a dominant position in the market. According to the last forecast, the market of bread is expected to grow annually by 6.34% (CAGR 2024-2029) and show a volume growth of 3.8% in 2025 [1].
Wheat is the most cultivated cereal after corn; over 95% of the wheat cultivated worldwide is soft wheat (cv. Triticum aestivum spp. vulgare L.) used for producing cakes, biscuits and other baked goods [2]. On the other hand, hard wheat (cv. Triticum turgidum L. subsp. durum Desf.) usually provides strong flour with higher protein levels, suitable for bread production [3]. Unlike other cereals, wheat has a unique feature. With the addition of energy during mixing, hydrated proteins connect, creating a spatial network commonly referred to as gluten. The dough also contains dispersed gas and a certain amount of free water in which starch granules and water-soluble components are dissolved. Among these components, gluten proteins primarily define the sensory and rheological properties of the final product [4]. Generally, the quantity and quality of proteins in wheat grains affect raw material prices, trading relationships and establishing differences between various types of wheat. In the dough, gluten gives viscoelastic properties, structure, mixing tolerance and the ability to retain gas during leavening [5]. From the first stage of the production process (mixing flour and water with other ingredients) to the last stage (baking), several chemical and physical changes occur during the ingredients mixing [6,7]. Each stage of bread-making has optimal processing parameters, i.e. optimal water absorption, mixing time, and resting time, to mention a handful of the numerous processing variables that are employed in the baking process. Each of these parameters must be adjusted to the type of product such as bread, biscuits, or cakes, and during the production phases according to the variability of the characteristics of the raw materials involved in the recipe. The incorrect application of these variables can have an important effect on the final quality of the product as well as the properties of the resulting dough. Therefore, it is essential to accurately determine and apply the best conditions to produce an optimised and appreciated final product. Product functionality and rheology are related. Numerous rheological tests are usually conducted to imitate the performance of the dough during mixing, sheeting, leavening, and baking stages. Moreover, rheology is closely related to the microstructure and composition of the dough and aids in controlling and predicting the quality of the final products. [7]. In general, the quality of food can be measured by objective or subjective methods. Objective methods concern physical, chemical, or mechanical tests that result in numerical values. In the food industry, measuring the textural properties of bakery products is crucial in quality control and for the development of new products. The textural attributes most frequently evaluated by instrumental methods include hardness, cohesiveness, springiness and chewiness [8]. Subjective methods can determine the same attributes. They regard mainly sensory tests, that involve sensory organs as measurement tools. The assessment of instrumental data (structural features and appearance) and sensory data (profiles) could provide a combined approach to describe the quality of bread [8]. For example, although the “texture” of the finished product is fundamentally a physical property, its perception can be influenced by chemical-physical factors, psychological and cultural aspects [9]. Numerous researchers have examined the debated topic of correlations between instrumental and sensory methods [9,10,11,12]. However, these relationships can be difficult to determine due to the complex composition, structure of the bread, as well as the difficulties in accounting for the changes to the food during chewing processing. Since creating and maintaining a trained panel is more expensive than instrumental analyses, researchers frequently use instrumental rather than sensory methods to evaluate the rheological characteristics of the goods [13]. Sensory methods are usually employed to assess the formulation of a new product or a recipe change. Although some studies have shown the influence of formulation and processing steps in the sensory attributes of wheat bread, this aspect needs to be examined in more detail [14,15]. Therefore, the interaction of process design stages, processing conditions and sensory attributes should be evaluated during the handling of finished products.
This review aims to investigate the influence of processing on the technological and sensory quality of bread, considering the importance of assessing the rheological behavior of dough in the prediction of sensory properties of the finished product.
2. Factors Affecting the Quality of the Bakery Product
During bread-making, the ingredients greatly impact the final quality of the product. In particular, the particle size of wheat flour, water content, salt, wheat bran, flour improvers have been taken into consideration in this paper. Moreover, processing parameters during mixing phases (i.e. mixing energy, dough temperature, mixing time), leavening and baking must be optimised according to the raw material, the process design, the capacity of the machines, and the finished product required [16]. Nowadays, most of the characteristics of the dough are still analysed by destructive tests and conducted offline. However, more recent approaches have suggested online and real-time monitoring using more sophisticated techniques such as the application of near-infrared (NIR) spectroscopy, X-ray, and ultrasound-acoustic systems [17,18]. Anyway, the application of rheological tests enables the measurement of the mechanical behaviour of the dough, allowing adjustment processing parameters to guarantee a standardized finished product.
2.1. Ingredients
The main ingredients in the bread-making process are flour, water, yeast and salt [19]. Each of these ingredients has a role and function in the preparation of the product. For this reason, it is necessary to evaluate each of their chemical, technological and sensory interactions.
2.1.1. Raw Material: Size of Wheat Flour
The production of a high-quality bakery product begins from the mill with the choice and good processing of the raw material. Wheat milling is a key process that involves removing the germ and bran layers from the endosperm and then gradually decreasing its size to flour [20]. A variety of processing parameters are taken into consideration when milling wheat, including the type of mill used [21], the hardness of the grain [22], the amount of water the grain absorbed before grinding [23], and the physical-chemical structure of the grain [24,25]. Since flour is generally the most abundant ingredient in the formulation of bread, the milling conditions of the wheat affect the flour quality and final characteristics of bread.
The size of the wheat flour particles is affected by methods and instruments employed in the wheat milling process, such as mechanical force and milling intensity. Because various types of equipment apply different mechanical forces to wheat flour, consequent differences in particle size are expected. Using the same equipment but modifying the process parameters or processing times affects the particle size of wheat flour [26].
Besides the presence of bran, the particle size of flour has an important effect on rheological, baking, and mixing properties that have a close connection to the quality of the gluten network and sensory attributes.
In whole-grain wheat flour, gluten is more affected by coarse particles, which results in a lower specific volume of baking and less stability and resistance to extension. Conversely, higher fine whole-grain wheat flour baking quality involves a greater contact surface that provides a combination of physical and chemical mechanisms that act efficiently on the development and function of the gluten network [27]. Mirza et al. [28] have showed that a particle size of <125μm gave a dough with the highest extensibility due to the high-quality high gluten content and relatively strong gluten network, which minimized dough rupture, and increased the gas retention capacity in the resting stage, resulting in high volume products. Moreover, dough made with a particle size of < 125 μm exhibited higher development time and stability than dough with >150 μm size. They have reported that the wet gluten content decreased with increasing particle size in the outermost layer.
Moreover, according to Extensograph test, fine bran resulted in greater dough resistance than coarse bran after a 180-minute resting time. A reduction in gluten quality and a weakening of the gluten network resulting from the presence of flour in larger particle sizes decreased some rheological properties (energy and dough extension), which may contribute to dough rupture.
The external layers of the wheat grain are characterised by an increase in the particle size of flour, to the detriment of following quality of the gluten network. Furthermore, the flour particle size influences dough properties such as water absorption, dough softening degree and the bread texture. The finer fractions resulted in bread with a softer texture and improved sensory qualities. In particular, the bread made from the finer particle size of flour showed significantly higher sensory scores for colour, texture, layers, mouthfeel and overall quality score than the coarser fractions [29]. Contrary, the bread with the coarser fractions showed dense crumb grain with thick cell walls and slight residual formation during chewing [29]. Pang et al. [30] have demonstrated that in steamed bread the particle size increased, viscoelasticity of the dough significantly improved. Increased milling strength can strengthen the gluten network, according to the results of disulfide bond content and gluten to the results of disulfide bond content and gluten microstructure analysis. But smaller particle-size wheat flour produced steamed bread with a brighter surface, harder crumbs, and a lower specific volume. The size of particles of wheat flour and wheat bran affects also the quality of biscuits [31,32,33].
Additionally, the most noticeable result of the flour particle size reduction is an increase in the amount of damaged starch. It impacts the quality of the final product because it absorbs much more water than intact starch [34,35]. However, a certain degree of damage to the starch granules is desirable. Usually, the degree of starch damage for wheat flours is 4–10%. In general, hard wheat flour shows higher values and soft wheat flour has a lower degree of starch damage [36]. Jukic et al. [36] have demonstrated that the level of starch damage (high 6,13% or low 3,15%) had an important effect on the dough rheological properties (increased water absorption, time and stability) and the bread quality parameters (decreased in a specific volume of bread).
Memon et al. [37] have showed that the size of flour particles also affects the nutritional composition. They have found a positive correlation between the content of some phenolic acids and particle size and a negative correlation between particle size and carbohydrate content and energy.
The technological and sensory quality of the final product is noticeably impacted by the particle size of the flour. The flour fractions size showed significant differences in bread quality. For this reason, flour generally contains a combination of small and large particle sizes [29].
2.1.2. Water
After wheat flour, water is the second most important ingredient added to the dough [38]. The viscoelastic properties of the dough depend on the quantity and the quality (i.e. hardness and pH) of water added. Insufficient water content results in a stiff dough and causes problems during the production process. On the other hand, dough with excessive water added shows a low viscosity and could lose its shape, and it sticks to processing equipment. Dough water levels are also dependent on bread variety, bread-making process and processing methods [39]. A water content ranging from 38% to 44% is frequently added to the dough, while the water content in bread dough is around 65% [40]. In this system, water forms hydrogen bonds with water-soluble components such as proteins and solubilizes starch and sugars. However, an independent, continuous aqueous phase begins to form in the dough when the overall water content reaches a value of between 23% and 35% (total basis) [41]. The chemical reactions taking place during dough development and fermentation are mediated by this "free" water phase. Furthermore, it is probable that during mixing, air bubbles are trapped in this liquid phase, where they later expand during fermentation [42]. The rheological behaviour and quality of the final product are influenced by the water content of the dough. The effect of reducing added water in the dough from about 44% to 34% on the rheological characteristics of the dough was examined by Hardt et al. [43]. As a result, the maximum compliance to the sliding has been reduced by 1-2 orders of magnitude, the mixing resistance increased, the Farinograph Brabender unit values increased, and the values G’ and G’’ increased. Farahnaki et al. [19] have evaluated the interaction of three main processing parameters such as temperature, water content and salt levels on rheological parameters. The addition of salt caused a decrease in consistency and total energy but increased the hydration time at low water content, due to its competition with flour in water absorption. Water softened the dough and decreased the hydration time, and the energy required for mixing. Temperature increased had a negative effect on consistency, hydration time and total energy.
The viscoelastic behaviour of wheat dough samples with different water contents has been investigated through oscillation frequency sweep experiments conducted in the linear viscoelastic range by Letang et al. [44]. The storage modulus (G′) indicates the elastic nature of the sample and the loss modulus (G″) is related to its viscous behaviour. The loss tangent tanδ is often used to measure the ratio of viscous and elastic responses of the material being tested. As reported by Patel et al. [45], besides baking, elasticity affects the handling qualities of doughs during processing. Doughs expand exiting cutters, rounders, dividers, moulders and sheeting rolls. This spring back can be a barrier in processing doughs, especially in sheeting methods as it defeats the objective of the process. Moreover, the viscoelasticity of gluten influences the microstructure of the dough and therefore its final texture is appreciable through the sensory organs. However, hydrocolloids or enzymes can be added to the dough to control water consistency and absorption [19,46]. Linlaud et al. [47] have compared the effects of increased hydrocolloid concentrations on the absorption capacity of flour using the Farinograph. The Farinograph test is one of the most frequently used rheological tests for flour quality worldwide. The outcomes serve as parameters in the formulation that decide the quantity of water needed for making dough, evaluate the effects of ingredients on mixing properties, assess flour mix requirements, and verify flour uniformity. Additionally, the results are utilized to predict processing effects, including mixing requirements for dough development, tolerance to overmixing, and dough consistency during production. It is also possible to predict the texture of the finished products using the Farinograph results. For example, strong mixing properties of the dough are associated with firm product texture [48].
During mixing, shear resistance of the dough is recorded. Among the parameters, Farinographic water absorption is positively related to protein content.
Figure 1 shows a common Brabender Farinograph output and the main parameters along the Farinographic curve are shown. In particular, the amount of time that passes after adding water to flour until the dough reaches its maximum torque is known as the dough development time. The dough development time depends on the amount and quality of gluten in the flour and its water-binding capacity. Stability is an indicator of flour tolerance to mixing. Higher values suggest a stronger dough. The higher the tolerance, the longer the dough should be mixed. Higher values of the degree of softening indicate that dough will not be able to tolerate long mechanical processing strain (overmixing) [49,50].
Following Rohlich and Bruckener's classification, strong flour has a water-absorbing capacity of over 59%, a dough development time of more than 3 minutes, a dough constancy of more than 4 minutes, and a softening value of less than 40. For weak flour: softening above 150 FU, development time less than 2 min, consistency less than 1 min, and water-absorbing capacity less than 51% [51]. However, the rheological characteristics of wheat dough can be also significantly altered by even a slight variation in moisture content [52]. Thus, it is fundamental to comprehend the rheological characteristics of the wheat flour-water system to improve food manufacturing process control and produce high-quality final goods [53].
Water quality also plays an important role in defining dough properties. For example, water hardness influences the rheological parameters of flour dough, the mixing behaviour of dough, especially, the stability of dough and the Farinograph Quality Number (FQN) [54]. In fact, the hardness water affects the mixing performance of the flour, because it increases the time required for mixing and consequently also the total energy consumption. In addition, the pH of the water contributes to the formation of the viscoelastic network of gluten and the development of the dough. Water with a pH of 9.0 to 9.8 resulted in lower gas production and longer baking times due to the inhibited activity of the lactic bacteria, yeast, and diastasis. Water with a slight acidity (i.e. pH 5.97) is required because alkaline water negatively affects the shape and plasticity of gluten [55].
The method used to add water can impact the rheology of the dough. Water and flour need to be added gradually to allow for the hydration and lubrification of the water-soluble ingredients and the development of an optimal gluten structure. Consequently, the elasticity of the dough increased, and its fluidity decreased. When the stress relaxation and creep recovery characteristics of the dough were measured, the coefficient of viscosity of the dough was greater [56].
As far as sensory evaluation is concerned, Mastromatteo et al. [57] have showed that by increasing the water added to the dough, the only parameters acceptable were colour and appearance. The textural qualities of the loaf worsened, and its volume collapsed due to the high content of water, giving the appearance of a flat, unevenly distributed loaf filled with large bubbles.
Sai Manohar [52] has observed that in the case of biscuits, if the water content was lowered below the optimal level, the colour would remain unchanged, although their surfaces would become slightly rougher. However, the texture of biscuits becomes slightly firmer, and their surface becomes smoother when the water content is increased above the optimal level. Anyway, the technological and sensory effects on the dough must be investigated in greater depth in future research.
2.1.3. Salt
Currently, the level of salt used in bread-making is between 18 and 22 g kg−1; therefore, bread is considered one of the key contributors to dietary salt intake, accounting for approximately 25% of the total [58].
Salt affects the bread-making process in both technological and sensory aspects. According to Preston et al. [59] dough made with 0.05–0.10 M NaCl had higher strength than dough with no salt. Additionally, it increases the optimum mixing time and the stability of the dough, enhances the texture, decreases staling and increases the microbial shelf life of the bread by lowering the water activity (aw). Moreover, salt concentration influences the sensory acceptability of bread in terms of taste, improves its flavor and leads to the Maillard reaction to produce the brown color of the crust [60].
The technological effect of salt in the dough is easily explained through rheological measurements of the dough. Salovaara [61] have compared salted wheat doughs using the Farinograph and have found that dough with 1–2% sodium chloride added had an increase in peak time (i.e. increase in dough strength), while water adsorption decreased (i.e. a decrease in water binding). These results have been confirmed by more recent studies by Beck et al. [62] on dough made without salt that showed significantly lower Farinograph stability than a dough containing 10–20 g NaCl kg−1 wheat flour. No significant differences have been observed within the range 10–20 g NaCl kg−1 wheat flour, whereas a further increase of Farinograph stability have been observed at levels of NaCl as high as 30–40 g kg−1 wheat flour. In addition, the effect of increasing mixing time is to increase loaf height and improvement of overall bread quality.
Lynch et al. [63] have used an Extensograph to define extensibility and resistance to the extension of doughs containing 0, 0.3, 0.6 and 1.2% sodium chloride. It has been found that doughs that contained 0.3–1.2% sodium chloride did not differ significantly in their resistance to extension (Rmax) and extensibility (E’). However, dough containing 1.2% sodium chloride significantly differed from dough without sodium chloride. These results have suggested that removing sodium chloride significantly affects dough extensibility.
Salt is crucial for the proper development of dough structure. Specifically, the interaction of salt with gluten is pivotal to forming a high-quality breadcrumb. Gluten protein consists of about 40% hydrophobic amino acids (mainly leucine and isoleucine) and a low proportion of charged amino acids at the protein surface. In the presence of NaCl some of the charges on these external amino acids may be shielded, therefore reducing protein hydration. This decrease in protein surface charge reduces the electrostatic repulsion between the protein molecules allowing for them to interact more closely through strong hydrophobic interactions which increases protein intermolecular β-sheet structure [64].
A reduction of sodium chloride levels in dough leads to a weakening of the gluten network, increasing dough stickiness. During the industrial manufacture of bread, this can stop processing lines leading to downtime and wastage [65,66]. Moreover, the adhesiveness decreased significantly as soon as a small amount of salt (0.35% d.b.) was added [64]. Contrary, Beck et al. [62] have reported a decreased dough stickiness with decreasing NaCl concentration (40–0 g/kg flour) in bread dough.
Insufficient or an excessive amount of salt in the dough could be undesirable. Bread without sodium chloride has been reported to be perceived as tasteless and have yeasty and sourdough-like flavours [67]. The study by Pflaum et al. [68] have revealed that an increase in sodium chloride level leads to a decrease in floury/watery, yeasty and musty flavours. Sodium chloride influences Maillard reactions which occur during baking. It improves the mobility of the reactants, enhancing the Maillard reactions, and producing a darker coloured crust [69]. Conversely,baked bread lacking salt shows a lighter-coloured crust [70].
2.1.4. Wheat Bran
Dietary fiber from wheat bran has a high impact on the rheological properties of the dough. Specifically, the addition of fiber negatively influences the appropriate formation of dough, irrespective of the amount of addition (0–12%). Because of their longer formation time, shorter stability time, and notably higher weakening degree, fiber-fortified doughs usually have difficulty to achieve their optimal state during the mixing stage [71]. These properties could also be examined using fundamental rheological methods such as in the frequency sweep, strain sweep and creep recovery test. In general, as shown by Bonilla et al. [72], the elasticity of the dough significantly increased when fiber was present, but when strain was applied, the dough became more brittle. This could be due to the redistribution of water in gluten, as well as the damage that fiber leads to the gluten matrix. It demonstrates the detrimental effects of fiber on the formation of the gluten network, which may result in a decrease in gluten viscoelasticity and a decline in the quality of products made with fiber-enriched flour. Low molecular weight (LMW) and high molecular weight (HMW) glutenins combine to form aggregates in the early stages of mixing (arrival time). When combined with gliadins, glutenins are deformed and create a homogeneous network until the dough reaches peak time. The glutenin polymers are stabilized by inter-chain disulfide bonds, most of which involve cysteine residues in HMW glutenins. Bonds between LMW-GS and HMW-GS and between two LMW-GS proteins have also been identified. It has therefore been suggested that the HMW subunits form the “backbone” of gluten, providing a framework for interactions with LMW-GS and with gliadins, other glutenin polymers and other dough components by non-covalent forces [73].
With more mixing, the network breakdown and ensuing decrease in dough strength occur in two stages. LMW glutenins first dissociate from the network and condense into an aggregate (peak time to departure time). The second stage is identified by a consistent decrease in dough strength and occurs after departure time. Combined with LMW glutenin aggregates, HMW glutenins separate from gliadins to form aggregates. These modifications in the way that HMW glutenins aggregate seem to be the primary cause of the ongoing disruption of the network and the decline in dough strength [74]. Therefore, incorporating wheat bran in cereal-based products negatively affects their production process.
Compared to products containing refined flour, whole-wheat products offer a clear nutritional advantage. However, one of the main problems is their overall low sensory acceptance, which has not been investigated as carefully as the sensory liking of white bread. To enhance the sensory quality of whole wheat bread, further studies are required to evaluate taste, aroma, perception in the mouth, and overall acceptability, besides instrumental analysis for evaluation of variables such as texture, volume or honeycombing [75]. Navrotsky et al. [76] have reported a significant increase in firmness and hardness of the crumb when adding wheat bran or whole wheat flour in higher concentrations. Moreover, a lower specific volume of bread, a lower consistency of the crumb and a darker colour of the bread crumb were observed. In the past few years, several strategies have been investigated to improve the technological functionality of bran and the sensory aspects that are typically associated with wheat bran incorporation in bread-making. Among strategies, there is the use of high protein flour, adding water, adjusting processing, and adding bread improvers such as surfactants, enzymes, and commercial gluten [71,77].
2.1.5. Flour Improvers
Flour treatment agents (also called improving agents or dough conditioners) are food additives that are usually combined with flour to improve baking functionality. Apart from enhancing the strength and workability of the dough, they also shorten its rising time. Flour improvers can be divided into enzymatic and non-enzymatic. Non-enzymatic enhancers are those added for emulsifying purposes, or oxidizing, such as emulsifier and ascorbic acid. Whereas, the enzymatic ones are divided, in turn, into endogenous and exogenous. The first are those naturally present in the grain of cereals or those that are produced during fermentation by microorganisms. The most common are α-amylases, β-amylases, lipases, phosphatases, and oxidases. On the other hand, exogenous ones are added to flour to increase its functional and processing characteristics [78,79]. Proteolytic enzymes are included to modify the rheological properties of dough, particularly their extensibility and to decrease the mixing time [74].
However, enzymes and improvers intentionally added to flour must comply with current legislation. If the enzymes are without functional impact on the final goods, they are considered processing aids. Alternatively, the enzymes must be listed on the label as food ingredients [80]. Generally, they are used to accelerate production processes, adjust the viscosity of the dough, allow optimal processing, give resistance to dough during fermentation, improve the structure of the crumb, delay the aging of bread, making the dough more extensible. Specifically, some of them affect the rheological properties of flour: to increase the strength of flour, oxidizing agents including ascorbic acid and dry gluten are used. The ascorbic acid enhances the oxidizing processes that take place in the dough. Additionally, it is used to strengthen the gluten network, which means a higher resistance of the dough and a reduction of its extensibility. The ascorbic acid also determines an increase in the ability of the dough to retain gas. Oxidizing agents have a noticeable influence on texture, layer formation, mouthfeel, handfeel and overall quality of bread. In the case of medium-quality flours, with strength W >180, the addition of 50-70 ppm of ascorbic acid is enough. Above this level, ascorbic acid produces no improvement effect, probably due to the depletion of SH reactive groups [81].
On the contrary, to reduce the strength of the flour, protease or cysteine are used. Adding L-cysteine hydrochloride and potassium metabisulphide weakens the dough and increases its extensibility. Increased reducing agent content results in very soft bread lacking the usual chewiness.
However, the widespread use in breadmaking is α-amylase [74]. The latter degrades starch polymers and it is employed to promote fermentation, improve texture, increase loaf volume, and decrease bread staling. Błaszczak et al [82] have reported that adding fungal and bacterial α-amylases increased specific loaf volume. The addition of α-amylases greatly influenced fresh crumb hardness, causing its decrease from 24.14 kPa for control bread to 19.27 and 16.78 kPa for bread with fungal and bacterial α-amylase, respectively. Chen et al. [83] have showed that the supplementation of maltogenic amylase hasn’t been exhibited significant effects on specific volume (3.1 ± 0.1 mL/g) compared to the control bread (2.8 ± 0.1 mL/g), whereas a significant increase in specific volume (3.4 ± 0.1 mL/g) has been observed in the bread containing maltotetraose-producing amylase. In addition, compared to maltogenic amylase, maltotetraose-producing amylase demonstrated a better antistaling ability.
Therefore, the machinability of the final product and its sensory properties could be optimized, by using the appropriate dough improvers.
2.2. Mixing
One of the essential unit operations in the baking industry is mixing. It increases homogeneity by minimizing phase separation or unevenness in mixtures of multiple components [84]. The ingredients are first dispersed, then the flour particles start to hydrate, and the protein aggregates in the flour are sheared and stretched over time [85]. The formation of the viscoelastic network of gluten is made possible by the hydration of the flour and the application of mechanical energy. The dough receives mechanical energy from the mixing component in the form of tension, elongation, compression, and shear [86]. In particular, during mixing the strains exercised on dough have a substantial impact on the molecular arrangement of gluten. The dough gradually becomes coherent and exhibits elasticity, plasticity and viscous properties [87]. Commonly empirical rheological measurements at large deformation are conducted to determine the mechanical behaviour of the dough during the mixing process. At small deformations, where the dough responds in a linear viscoelastic way, the storage and loss modulus (G′ and G″) are indicative of the elastic and viscous properties of dough, and they define the fundamental rheological behavior of the dough [38,43]. However, this linear viscoelastic behavior occurs only at small amplitudes of shear strain, that is, γ ≤ 0.2% [88]. At higher strain amplitudes, G′ and G″ display nonlinear viscoelastic behavior. Currently, large-amplitude oscillatory shear (LAOS) has gained increased interest as a method to describe the behaviour of food because of its ability to simulate industrial processing conditions [89]. The correlation between the behaviour of the dough and the structure of the finished product can be assessed by empirical and fundamental rheological tests. For example, empirical rheological studies have reported a positive correlation of crumb uniformity to dough extensigraph parameters, that is, maximum resistance to extension and the ratio of resistance to extensibility [90]. Other studies have demonstrated a positive correlation between dough extensibility to loaf volume [91]. Fundamental rheological studies have reported that there is an inverse and nonlinear correlation of loaf volume to dough dynamic rheological parameters, that is, storage modulus G′ (r2 = 0.75) and loss modulus G″ (r2 = 0.72) [92]. Moreover, loaf volume has been correlated with creep–recovery measurement parameters also. For example, the instantaneous recovery of dough was positively correlated with loaf volume (r2 = 0.66) [93]. Hence, empirical and fundamental tests are crucial for a complete understanding of the rheological properties of the dough.
The rheological properties of gluten are dependent upon the ratio of glutenins to gliadins, and the interactions of these structures. In particular, gliadins contribute more to the viscous nature and extensibility of the dough, whereas glutenins are cohesive and contribute to dough strength and elasticity. Disulfide bonds play a key role in determining the structure of gluten proteins. They are formed between thiol (SH-) groups of cysteine residues either within one protein (intrachain) or between more than one protein (interchain). Intrachain bonds stabilize the tertiary structure of the protein, whereas interchain bonds induce the formation of protein aggregates. Thus, cysteine is decisive for the structure of gluten proteins, although it belongs to the minor amino acids (about 2 mol%) [94].
The mixing phase is crucial in bread-making and all bakery goods processes because it is not possible to correct a failed dough. For these reasons, it is necessary to pay attention to every processing parameter that can be controlled and modified to achieve a standardized and optimized production process. In particular, mixing parameters such as mixing speed, dough temperature and mixing time strongly impact the technological and sensory properties of the bread [15].
2.2.1. Mixing Speed
During the mixing phase, part of the mechanical energy used for the rotation of the mixer is released as heat. It spreads throughout the dough and the air [95]. This energy facilitates the gluten network development and contributes to the rheological properties of the dough, in particular, its capacity to retain gas. Many studies have underlighted the influence of mixing speed on the aeration of the dough [96,97,98]. The combined effects of gas production and retention largely determine loaf volume, crumb structure, and the texture of the bread. In particular, bread volume is a key determinant of bread quality, with higher volumes usually being preferred [84]. While being mixed, the dough becomes increasingly resistant to the formation of the gluten network, and sustaining the rotation speed demands more power until the gluten network achieves its maximum cohesion. On the other hand, overmixing the dough weakens the gluten network, which leaves it sticky and loses its viscoelastic properties. Even a slight undermixing can result in small, unmixed regions that interfere with the proofing phase. To allow the dough to fully develop, it must be mixed for enough time [99]. Although the mixing speed greatly impacts bread quality, few and contradictory effects have been reported in the literature about this issue. Laboratory simulation through Farinograph [100,101] and high-speed mixer [102,103] has been conducted to establish the correct mixing rate. Moreover, Micro-doughLAB has been tested to predict the dough quality since the possibility of varying mixing speed (low speed 63 rpm and medium-high speed 120 rpm). Strong correlations have been found between Micro-doughLAB parameters and bread quality obtained using high-speed mixer [104].
However, Sangpring et al. [53] have noticed that mixing speed had an impact on dough development; specifically, dough consistency rose as dough speed increased. The same result has been found by Pastukhov and Dogan [105] by increasing the mixing speed, dough consistency increased, irrespective of the mixing temperature. The effect of the mixing speed is a variable that changes the rate of energy supply to the developing dough [16]. The studies conducted on wheat flour reported that to achieve dough readiness, mixing intensity and the amount of work imparted to the dough should be above a minimum critical level, which changes related to the flour type [106]. Increasing the mixing speed resulted in significant effects on dough properties such as a reduction of dough mixing stability [107], an increase in dough peak torque [108], and a decrease in the mixing time [109].
2.2.3. Dough Temperature
The temperature of the dough can be managed either by controlling the temperature of the ingredients added to the dough or by using cooling methods applied to the dough. Cappelli et al. [84] have assessed the effect of CO2 snow addition on dough thermoregulation and bread characteristics. Their study have found that the addition of high percentages of CO2 snow (up to 10% by flour weight) maintained a low dough temperature during mixing, and led to increased bread-specific volume and loaf height. The studies by Quayson et al. [110] also indicate that mixing temperature has a significant effect on protein structure characteristics and dough quality. The mixing temperature was observed to have a greater impact on dough consistency and stability than the mixing speed [53,111].
A low dough temperature during mixing appears to be essential to guarantee correct dough development and bread quality. Low dough temperatures improve gluten development because they strengthen and increase hydrogen bonds, which are crucial for preserving and enhancing the network [84]. Farahnakt et al. [19] have estimated the effect of temperature on dough rheology. They tested five levels of dough temperature (20, 25, 30 35, 40°C). In particular, an increase in temperature decreases the consistency of the dough and decreases the hydration time measured by the Farinograph.
Başaran et al. [112] have investigated the effects of low-temperature mixing (17°C) versus high-temperature mixing (30°C). They have showed that the highest loaf volume and the best crumb structure has been determined in the bread made of the dough which was mixed at 17 °C. From the technological point of view, with decreasing dough temperature, the dough became harder and firmer and reached a higher water absorption value. Furthermore, it was found that mixing temperature had greater influences on stability and dough consistency than mixing speed.
2.2.2. Mixing Time
The full breadmaking potential of the dough is reached only at the optimum point of dough development [113]. Exceeded the point of optimum mixing, resistance to extension no longer increases and the dough starts to break down. As dough breaks down, it becomes wet and sticky and it is considered overmixed [114]. Extending the mixing time shows an increase in the textural parameters, i.e., the hardness, adhesiveness, cohesiveness and consistency of dough. A decrease in these parameters of doughs was observed with a further extension of mixing time. Brabec et al. [109] have studied the effect of overmixing and undermixing on the final volume of the loaf. Mixing over the peak for more than 40 s resulted in baked loaf volume losses of 20–60 cm3. Higher mixing time resulted in smaller average loaf volumes. Moreover, after reaching optimal dough development, additional increases in mixing time led to a decrease in G′ [115] and G”[116], but to an increase in tan δ [44]. Therefore, overmixing increases dough softness and decreases dough elasticity.
Considering results obtained by rheological tests at small strains, the behaviour of dough is scarcely affected by the mixing time. Instead, the effect of mixing time has been showed most clearly at large strains. Since the gluten network is largely responsible for the behavior of the dough at large strains [117], this result suggests that the mixing time has an impact on the gluten network. For this reason, the effect of mixing time on the G ′ and G ″ curves is very limited: linear rheological tests are not very sensitive to differences in the gluten network [40]. According to Peighambardoust et al. [5], as mixing time increases, the strength of the dough and the degree of strain-hardening decrease. As with the linear oscillatory tests, the linear creep tests fail to perceive any substantial differences between doughs mixed for different mixing times. The effect of mixing time only becomes clear in non-linear creep tests, as only these tests besides the non-linear extensional tests adequately investigate the response of the gluten network.[38].
The effect of mixing time on the rheological properties of the dough and consumer acceptability has been investigated. As shown by Adebowale et al. [118] mixing time in breadmaking varied from 10 to 50 min, but preference was more on bread processed from dough mixed for 20 minutes.
Mixing conditions are crucial. Although the mixing of the ingredients is the most decisive step in determining the final characteristics of the baked product, this relation has not been adequately explored in the literature [119]. As shown in the study conducted by Rozyho et al. [120] the effect of the change of process parameters during mixing is determined only via instrumental tests such as Texture Analyzer, neglecting sensory analysis. Table 1 summarizes the impact of the principal processing conditions and the most common ingredients used in bread recipes on technological and sensory properties.
2.3. Leavening
Generally, two categories of leavening agents are used in bread-making: baker’s yeast (sponge, Poolish, biga) and sourdough which is a combination of natural yeasts and lactic bacteria [121].
During the leavening stage, yeast (Saccharomyces cerevisae spp.) convert fermentable sugars of flour into alcohol, carbon dioxide and aromatic compounds. Alcohol formed, which is water-miscible, influences the colloidal nature of the wheat proteins and alters the interfacial tension within the dough. In addition, carbon dioxide, which partly dissolves in the aqueous phase of the dough, migrates toward the initial nuclei of the air bubbles formed during mixing causing their growth. The growth of gas cells depends on the cell size and the dough composition [122].
The gluten network lends dough the ability to entrap gas bubbles and subsequently form a stable foam structure. In particular, the number and the size of bubbles that are formed during the mixing phase can change the ability to retain the gas in the leavening phase. However, previous studies provided by Bloksma [123] have suggested that dough aeration affects the rheology and mixing of the dough. Newer studies by Chin et al. [124] on measuring the rheology of aerated dough, suggested that gas bubbles in the dough interrupt the integrity of the dough structure, thus confirming the presence of the aeration effect on the rheology of the dough, reformulating the relationship between rheology of the dough and aeration as a two-way relationship [41]. Moreover, metabolites are produced in situ and their concentrations change over time, yeast activity results in a very complex system that is challenging to characterize from both a microstructural and rheological point of view. Although their mechanisms were demonstrated to be significantly different, the most important yeast metabolites softened the unfermented dough. Ethanol, succinic acid, and glutathione radically changed the structure of the gluten network, whereas glycerol only had a diluting effect [125].
Furthermore, longer leavening time increased by about 30% the nonlinear mechanical response of wheat dough, an effect probably induced by variations in the secondary structure of wheat proteins and to the gassing of the dough microstructure because of the yeast metabolic activity. Consequently, LAOS is a suitable method for the characterisation of the nonlinear mechanical response of wheat dough, especially for assessing the effect of processing conditions (e.g., leavening time and yeast content) [126].
Because of its technological qualities, baker's yeast—a commercial term for a yeast strain derived from Saccharomyces cerevisiae spp.—is the bakery sector's most common biological leavening agent. Commercial yeast strains were industrially selected for their performance, fermentation power, and flavor development, besides the increase of nutritional value. One benefit of using baker's yeast is that it can help simplify the production process, maximize yields, and reduce costs [127]. Different factors affect the fermentative performance of yeast cells during dough fermentation, including dough ingredients, fermentation conditions, the type of yeast strain used, and yeast growth conditions [128]. In the baking industry cream yeast is currently the most used type. It is a liquid product, and it can be transferred into sterile tanks/containers and distributed to bakeries, where it is used to produce yeast-based products. The advantage of cream yeast is that it excludes any human handling thus reducing the risk of contamination, however, due to its high (water) volume, transport costs can be expensive. For this reason, distribution is generally confined to a particular area [129].
During the leavening phase, the choice of yeast can produce baked goods with different sensory profiles. In particular, the sourdough influences the aroma and increases the taste of the finished product [130,131,132].
The primary chemical groups that contribute to bread crumb aroma are acids, alcohols, aldehydes, esters, and ketones. Flavor and aroma profiles are considered quality parameters during breadmaking due to bread fermentation that modifies the bread's aroma characteristics. The alteration of the aroma profiles is primarily caused by genetic variations among Saccharomyces cerevisiae strains [130].
Sourdough is an ancient biological starter that is traditionally used in regional bakery products. This dough, which is made of flour and water, is naturally fermented by yeasts and lactic acid bacteria (LAB), whose metabolic processes—such as lactic acid fermentation, proteolysis, flavor synthesis, and antimicrobial compound synthesis—have a major impact on the quality of sourdough bread [133]. Gobbetti et al. [134] have used a rheofermentometer to investigate the interactions between lactic acid bacteria and yeasts in sourdough. Yeast fermentation in the presence of heterofermentative lactic acid bacteria was faster than that of homofermentative bacteria, and it produced more carbon dioxide, as compared to sourdough made with yeast alone. The sourdough products had a longer shelf life, a higher flavor concentration, and more elastic dough due to the synergistic growth of LAB and yeasts compared to other yeast-fermented products [135]. Sourdough fermentation enhanced the rheological qualities of bread, Panettone, flat bread (Piadina), bread rolls, toast bread, burger buns, pizza, biscuits, cakes, crackers, and puff pastry if compared to baker's yeast. Texture (hardness, adhesiveness, resilience, cohesiveness, chewiness, springiness, and gumminess), shape, specific volume, color of the crust and crumb, moisture, retention, and crumb structure were the main points of improvement. On the opposite hand, microorganisms utilized moisture, air, and nutrients during proofing to produce metabolites such as ethanol, organic acids, and exopolysaccharides, which had significant effects on the gluten networks and ultimately altered the rheology of the dough [136]. Notable variations have been observed between the dough made with sourdough and that obtained with commercially compressed yeast. After proofing, the viscoelastic properties of the dough completely changed; the final rheological characteristics were influenced by the types of fermentation and pH levels. Various factors, such as variations in the quantity or rate of acid production, could be responsible for these changes. The addition of sourdough resulted in a less elastic and firm dough by changing the protein network physicochemically. It has been showed that suscinic acid (SA) was the primary cause of the dough's acidification and consequent pH drop. In addition to SA, fermenting dough included acetic and lactic acids. Apart from SA, acetic acid [137]. Thanks to the production of these acids and secondary compounds, the bread aroma profiles, and crumb structure are more distinctive, with compounds associated with sour aromas produced, and preferred by the sensory panel [131,132,138,139]. Table 2 reported the impact of bakery’s yeast and sourdough on the technological and sensory properties of bread.
2.4. Baking
Baking is the final crucial phase in bread production. It requires very high temperatures, usually ranging from 160 to 250 °C. During baking, dough undergoes many physical and chemical changes, including water evaporation, dough-crumb transition, formation of crumb and crust, volume expansion, protein denaturation and starch gelatinization. A non-optimal baking technique and an appropriate oven temperature can jeopardize all the progress made by introducing innovations in milling and mixing [140]. During the baking process, heat and mass transfer occur simultaneously, and the transformation of fermented dough into bread requires significant structural changes. Temperature influences the product quality, affecting enzymatic reactions, volume expansion, starch gelatinization, protein denaturation, non-enzymatic browning reactions, and water migration. During baking, changes in temperature profiles in the dough are determined by several factors, such as the size of the product (i.e. crispbread versus bread loaf), the ratio between top, side and bottom heat flow, the expansion of cells which reduces the thermal conductivity. The latter allows the transport of water vapour from the surface layers to the core, where it condenses and releases energy. During baking, the starch and protein modification, as well as the changes in dough temperature and moisture, have a significant impact on dough rheology. In the early stages of baking, between 26 and 60°C, dough consistency gradually softens as an immediate effect of gluten protein weakening[140].
The water content is a key factor since a variation of 4% leads to a modification in viscosity. When the dough reaches a temperature of 55–60 °C, the processes of starch gelatinization and gluten protein aggregation are triggered, viscosity increases rapidly until the dough reaches approximately 75 °C. In French bread using differential scanning calorimetry (DSC) dough/crumb transition started after the beginning of starch gelatinisation, but ended before the complete melting of starch. Hence, dough stiffening might be more due to gluten aggregation rather than to the progressive swelling of starch granules [141].
A further temperature increase leads to a reduction in a dough viscosity related to the breaking up of swollen starch granules and melting of remaining crystallites [140]. Viscosity diminishing is not observed when the moisture content of the crust zone decreases below 37 % and a long-lasting plateau of viscosity is evident. In the final baking stage when the dough reaches the water boiling point, viscosity increases proportionally to the rate of the decrease in the water content [84,142]. Completion of the final baking phase is generally estimated by two characteristics of the product: colour and moisture content for low-moisture products. Concerning the products with high moisture content, colour and starch gelatinization allow to evaluate the final cooking process. In addition, the optimized baking conditions affect the appearance and overall sensory liking of consumers. The baking process involves the formation of colour of bakery products due to the Maillard reaction and caramelization of sugars. It is responsible for other relevant changes occurring in bread during baking, i.e. production of flavour and aroma compounds. Therefore, it is essential to correlate the baking time and the baking temperature with the organoleptic characteristics to obtain the best sensory characteristics on the finished product.
3. Gluten: Structure-Function Relationship
According to the so-called Osborne fractionation, gluten proteins can be divided into two equal fractions, based on their solubility in gluten-alcohol-water solutions (e.g. 60% ethanol): soluble gliadins and insoluble glutenins. They differ in one important respect: the gliadins are monomeric whereas the glutenins form polymers stabilized by inter-chain disulfide bonds. Both fractions contribute significantly to the rheological properties of the dough, but their functions are dissimilar. Hydrated gliadins impart low elasticity and are less cohesive than glutenins, contributing mainly to the viscosity and extensibility of the dough. In contrast, hydrated glutenins are responsible for the strength and elasticity of the dough. Glutenin polymers are formed by high molecular weight- (HMW) and low molecular weight-glutenin subunits (LMW), which are cross-linked by intermolecular disulfide bonds. The HMW and LMW represent about 30 and 60% of the glutenin polymer, respectively, whereas the remaining 10% is composed by chain terminator proteins and thiols. The HMW plays a major role in determining dough strength, accounting for up to 70% of the variation in bread-making characteristics, despite representing only about 10–12% of the total grain proteins (corresponding to about 1–1.7% of the flour dry weight) [143]. However,gluten proteins are among the most complex protein networks in nature due to numerous different components and different size, and due to variability caused by genotype, growing conditions and technological processes. Gluten can be defined as a "two-component glue", whereas gliadins can be understood as a "plasticizer" of glutenins. A correct mixture of both fractions is essential to impart the viscoelastic properties of the dough, combining the properties of a purely viscous fluid and an elastic solid, and the quality of the final product [144]. The gliadin monomers and glutenin polymers interact by covalent and non-covalent forces, particularly hydrogen bonds. These different reactions and interactions are crucial for forming the gluten network during dough mixing. With the same protein content, the main factor determining the rheological behaviour such as mixability, strength of hydrated gluten, is precisely the gli/glu ratio. The effect of the gli/ glu ratio on the functional properties of the dough was studied by adding glutenin or gliadin to the original flour [145]. Furthermore, hydration and mixing of gluten significantly influence the structure and mechanical properties during dough formation. The dough properties depend greatly on the water content and mixing energy. As a solubilizer, water acts as a plasticizer and increases the mobility of the system. It affects functional properties by inducing conformational changes that enable hydrophobic interactions. Water also acts as a solvent for hydrophilic low molecular-weight gluten proteins. Hydration associated with mixing results in the breakdown and unfolding of tightly packed gluten proteins and in the formation of a viscoelastic network, which contributes to the optimal volume of bakery products during baking [146]. The techniques for measuring the viscoelastic properties of dough are mainly based on two types of loading patterns (deformation patterns), either transient or dynamic, which hold close relations in interpreting the relationship between stress with strain and time. The transient loading patterns, mainly creep test and stress relaxation test, have been employed commonly in past studies. The techniques based on dynamic loading patterns have been employed much more commonly in recent decades.
The final component of bakery rheology is the evaluation of product texture following baking. Food texture is a combination of many sensory features. The dynamic properties of sensory perception can be perceived from the great diversity of texture attributes and expressions for texture description such as firmness, stickiness, gumminess, cohesiveness, and springiness [147]. Firmness is of primary concern, however, as it is strongly correlated with bread “freshness” perception by consumers [148,149]. However, gluten is not the only important contributor to wheat dough: starch also plays an important role. The starch granules are dispersed within the continuous network made up of gluten proteins. However, it should be noted that although starch dominates in quantity, the gluten mesh is primarily responsible for the overall viscoelastic properties of the dough [18].
4. Rheological Tests of Wheat Dough
Rheology plays an key role in the food industry and especially in the bakery sector because it describes the macroscopic and molecular structure of the dough. The macroscopic behaviour of a dough depends on its composition and microstructure such as the spatial arrangement of its components and type of bonds. Dough rheology analyses are carried out to measure the mechanical properties of the dough, determine the relationship between the rheology of the dough and its molecular structure and composition, study the process performance of the dough, and predict and optimize the quality of the final products. This characteristic is also very useful for industrial plants, because the machines are sized and optimized according to the rheological properties of the product to be formulated [7]. The rheological methods are usually classified according to the type of the method, such as fundamental and empirical and the extent of deformation imposed, such as small or large deformation [86] (Table 3). Empirical methods have been developed to monitor dough behaviour during various processing steps such as mixing, mixing, shaping, proofing, and baking. Recording mixers such as Mixograph, Alveograph, Extensograph, and Farinograph use large deformations by shearing and stretching to develop and subsequently break down dough structures. Various flour parameters such as development time, stability and dough softening can be recorded during mixing by measuring the resistance of the dough to mixing. A relatively new device for dough analysis, Mixolab, measures the behaviour of the dough during mixing and heating by simulating a baking process. Empirical tests are easy to perform and are often used in practice in factories. They provide useful data real-time to evaluate performance during processing and for quality control. They have in common that the sample is subjected to a high load of strain, temperature, pressure, time, or energy input. In every case, this is accompanied by the destruction of the sample or the alteration of the structure as they are designed to simulate the use, manipulation, or consumption of the intermediate or final product [150]. However, the stress and deformation conditions that are applied to the dough in empirical tests are uncontrolled, complex, and non-uniform. As a result, defining rheological parameters such as stress, strain, strain rate, modulus, or viscosity is non-possible. Fundamental rheological properties are being considered to overcome the limitations of empirical measurements. However, there is not yet a single fundamental rheological method that can completely replace empirical methods. This is mainly because dough systems are far more complex than the synthetic polymers for which fundamental methods are routinely used. The most common types of fundamental rheological tests used in grain testing are (I) small strain dynamic shear oscillation; (II) shear creep and stress relaxation for small and large deformations; (III) extensional measurements of large deformations; and (IV) flow viscometry. The results of fundamental measurements have provided valuable information on the relationship between complex systems of dough chemical and rheological properties and how these are influenced by processing conditions. In the case of the fundamental rheological methods, only one of the basic types of deformation is applied during the measurement. The fundamental rheological methods are characterized by the easy use of the calculation software related physical properties, easy manipulation, robustness, and non-destructiveness. Small samples are used to avoid inertia phenomena and the samples are protected against alterations like drying out. These methods are very common in science but not in the cereal industry [150,151].
The problems encountered with such fundamental tests are related to the complex instrumentation, which is expensive, time-consuming, difficult to maintain in an industrial environment, and requires high levels of technical expertise. A direct comparison and correlation between empirical and fundamental methods can lead to incorrect conclusions. In recent years, fundamental rheological methods have been developing for a correct prediction of the properties of bakery products [150]. Because the purpose of empirical dough testing methods is to quantify changes in the rheological properties of dough under deformations similar to those occurring during some stages of dough processing, these methods involve large deformations. However, it is possible to apply fundamental rheological methods with both small and large deformations. The linear viscoelastic properties of the dough are mainly determined by the fundamental SAOS (Small Amplitude Oscillatory Shear) tests conducted under small deformations. SAOS allows analysis of the linear viscoelastic response by observing the strain and frequency dependence of the elastic modulus (G′) and viscous modulus (G″) at small strains. Furthermore, under a comparatively wide range of conditions, linear methods display the molecular interactions, microstructure, and structural characteristics of the material. However, the wheat flour dough is mostly subjected to significant deformations during processing, such as mixing, proofing, sheeting, and oven-rise, at deformation rates ranging from low (i.e., from fermentation or resting) to high (i.e., mixing) [41]. Because small deformation tests are typically carried out under deformation conditions unsuitable for breadmaking, they consequently exhibit little correlation with end-use performance. Therefore, a deeper comprehension of dough rheological responses under real processing conditions can be obtained by characterising their nonlinear rheological properties. Under controlled conditions, nonlinear rheological testing methods provide quantitative measures of dough deformation experiences. Fundamental nonlinear rheological methods include lubricated squeeze flow, nonlinear creep and creep recovery, and Large Amplitude Oscillatory Shear (LAOS) testing. The latter testing has been increasingly used over the past several decades to provide a fuller picture of food rheological behaviour. LAOS has the potential to be a valuable tool for investigating food structure–function–texture relationships, but much work remains to develop the connection between LAOS to sensory attributes. Large strain tests have several benefits, but they also have drawbacks that limit the development and application of LAOS rheology in the food industry [152]. They characterise the viscoelastic properties of flour dough, which is primarily exposed to large deformations, and they show the real-time structure of complex food. They also separate different types of wheat flour. The instruments for fundamental rheological testing are expensive. LAOS data analysis requires data processing software more complicated than used in SAOS [151]. On the other hand, the long-term instrumentation costs may be compensated by data acquisition under controlled deformations that result in precise and timely interventions in industrial productions. Early experiments with the fundamental rheological methods described by Dobraszczyk and Salmanowicz [7] showed that these instruments were inadequate in the industrial field due to interference and random errors. Therefore, nowadays, due to better computing power, it should be easier to use scientific rheometers for industrial applications such as quality control or product development. These inconveniences could be avoided or eliminated. Therefore, large strain rheology provides a basis for studying structural changes in the protein phase of the dough microstructure, which has been shown to explain its viscoelastic behaviour and end-use quality. Many food processes operate with large strain extension flow, whereas most food rheological tests are performed with small strain shear oscillations. Measurements under large strains often show a very different rheological response than those under small strains, especially if the material contains high molecular weight (HMW) polymers [5]. It is necessary to define the set of deformation conditions that the food undergoes in practice and carry out tests under similar conditions.
5. Sensory Evaluation
Apart from fulfilling the nutritional and energy requirements, bread must also contribute to ensuring sensory satisfaction after consumption. In general, the acceptance of consumers by sensory analysis is one of the major factors of the success of a new bakery good. Sensory evaluation is defined as “the scientific discipline which encompasses all methods to evoke, measure, analyse and interpret human responses to the properties of foods and materials, as perceived by the five senses: taste, smell, touch, sight and hearing” [154]. Food companies and supply bakery foods need to employ sensory tools for decision-making during product formulation, evaluation of ingredients, optimisation of technological processes and finished products. Through sensory evaluation, decisions can be made on whether further improvement is required before product marketing [155]. Sensory evaluation is also pivotal from a technological and economic point of view to minimize losses during production, storage, or transport. [8]. Knowing the parameters that most influence the hedonic aspects during the distribution chain of the bakery product allows to obtain optimised products and less waste in the food company.
Sensory properties are closely dependent on the texture of the product, besides its physical-chemical composition and physical behaviour. Because how a food deforms, fractures, flows, and breaks down is a key component of textural sensations, significant effort has been given to determining relationships between food rheological behaviours and sensory texture attributes [156].
Bread characteristics are affected by numerous factors, including the type and amount of ingredients added, processing conditions such as mixing, resting, and baking. Human sensory evaluation is of considerable interest and a practical way to conceptualize the overall bread quality and to relate its physical and chemical properties with its behaviour and perception in the mouth. Moreover, these characteristics can be used to evaluate the completion of baking [157].
However, underlying challenges surrounding bread persist despite the largely industrialization process of bread production, mostly due to its perishability, with a short mould-free shelf life of 4 to 10 days influenced by the storage and treatment conditions due to the high-water activity of bread, being generally around 0.95 [158]. Additionally, the “freshness” property of bread that is closely associated with overall bread quality only lasts for a brief duration of time [159]. Bread is characterized by relative softness while maintaining springiness and chewiness to a certain degree for the bread crumb cellular structure while having a dry, thin layer of crust enclosed on the exterior [160]. Bread quickly deteriorated during storage, associated with a multitude of alterations and changes, including microbial spoilage, textural loss, and off-flavour development. The issue of bread flavour has been neglected for many years, but it is now becoming an important characteristic for the baking industry as consumers link it to the primary bread quality [161].
However, sensory evaluation is mainly carried out for research and formulation of new products, to predict product acceptance on the market, and to test changes in the formulation of added ingredients. Currently, functional foods are widespread and ingredients with beneficial functions for human health are often added to baked goods. Many researchers have assessed the acceptability of these enriched products in addition to their technological impact on the structure of the product. Fortification of traditional bakery products by functional ingredients obtained from by-products enhanced their nutritional value [162,163,164,165,166]. However, these new ingredients can impair some sensory properties such as taste and texture. In addition, recently there has been a great interest in the field of gluten-free products. They often have lower-quality flavour and texture than wheat bakery products [155,167,168]. Therefore, the modification and replacement of an ingredient in the recipe requires an adequate sensory study on the consumer.
The dough is the intermediate product between flour and finished product and its rheological properties are of crucial importance as they influence the machinability of dough and the quality of bakery products. The variation of process parameters and rheological properties of dough can modify decisively the sensory attributes and the overall sensory product acceptance. As shown in Table 1 the sensory properties are closely related to the formulation and processing condition of the bread.
Textural properties can be analyzed by instrumental methods, sensory evaluation, or both. Instrumental methods consist of measuring the physical properties such as using Texture Analyzer and penetrometer [149,169,170,171,172].
The textural attributes most frequently considered in bread and baked goods include hardness, cohesiveness, springiness, and chewiness, provided by the instrumental measurements [8]. According to Szczesniak [173], hardness is the force necessary to attain a given deformation; springiness is the rate at which a deformed material returns to the undeformed condition after deforming force is removed; cohesiveness is the strength of the internal bonds making up the body of the product; and chewiness is the energy required to masticate a solid product to a state ready for swallowing.
The same attributes can be evaluated through a panel test. Specifically, the sensory texture attributes are hardness, elasticity, cohesiveness and chewiness, characterized using the definition according to Civille and Szczesniak [174] hardness, the force required to compress a component between molar teeth; elasticity, the degree with which the product returns to its original shape after it is compressed between teeth; cohesiveness, the degree to which a component is fully compressed between teeth before rupturing; chewiness, the time required to chew a sample at a constant speed of force application to reduce it to proper consistency for swallowing.
However, data obtained from the above-cited measurements are subjected to a large variability depending on the experimental followed analysis procedures. For that reason, it is difficult to compare the results from many of the published reports obtained with different instruments and procedures [175].
On the other hand, sensory tests are carried out by some panelists/judges, with or without training, in a standard tasting room. In general, sensory evaluation of food can be performed by affective (subjective) methods, such as consumers' acceptance test, and by analytical (objective) methods. Analytical methods require a trained panel of judges to describe qualitatively and quantitatively the sensory attributes of the product. In this way, a sensory profile of the product is generated. Descriptive analysis can also be used to evaluate the impact of ingredients (different wheat sources, flour quality) or processing conditions on bakery product quality. The consumer test, which is reserved for untrained consumers, is the most used method. It is based on factors relating to the product evaluation (using a scale) and generally on the intention to repeat purchases of consumers. The benefits and drawbacks of every assessment approach are useful and change in their suitability based on whether the setting is an industrial production facility or a stage of product development. Sensory tests offer comprehensive information that is more compatible with customer perception, while instrumental tests yield faster and more accurate results [176]. According to Guinè [8], the two types of methods (instrumental and sensorial) can be mixed in the analysis of textural parameters of bread. The product texture profile can be independently measured and precise values are obtained with the use of instrumental texture analyzers, producing data that is easily interpreted and compared. However, the methods of sensory analysis are especially adequate to appreciation and preference of goods based on their textural characteristics.
Usually, sensory evaluation is carried out after a change in product formulation such as enrichment with functional ingredients or ingredients derived from industrial by-products or different amounts of ingredients normally used in the dough. Sensory analysis is little employed after the change of process parameters such as different mixing speeds or different mixing or leavening temperatures. These parameters strongly impact the final characteristics of the product because they can alter the release of volatile components, the final aroma and the chemical interactions between the added components. The characteristics of bread and bakery products can be examined in more detail by using a sensory analysis, in order to correlate the effects of the various processing parameters to the finished quality product.
6. Conclusions and Future Perspectives
The mixing phase of raw materials, leavening, and baking are the stages that most affect the overall quality of bread, besides the choice and appropriate amount of each ingredient in the product formulation. They contribute to altering the gluten network and the texture of the dough, responsible for different rheological behaviours. Rheological parameters are well studied in the baking industry, but the relationship between rheology and sensory analysis is neglected, despite being closely related. This review summarized knowledge of the factors in the baking process that impact the quality of bakery products, in particular bread, emphasizing both technological and sensory aspects. It has been verified that there are many studies on the sensory evaluation of bakery products after changing one or more ingredients. In contrast, occasionally the impact of process parameters on sensory quality is considered.
In addition, very often the texture of bread and bakery products is analysed only through instrumental methods. Although they give an objective result, they will never replace human perception. Multidisciplinary collaborations must make significant advances in the development of fundamental food structure–function–texture relationships. Thus, it is crucial to deepen the topic with new studies dealing with the relationship between the changes in technological parameters and the sensory characteristics of the finished product, besides the overall consumer acceptance.
Author Contributions
Conceptualization, F.G., A.L. and C.P.; methodology, F.G., N.C..; investigation, A.L. and F.G..; resources, F.G.,C.P. and L.C.M..; data curation, A.L. and F.G..; writing—original draft preparation, A.L., F.G.; writing—review and editing, A.L., F.G., M.D.C., C.P.; visualization; F.G., C.P. and L.C.M.; supervision, F.G., N.C., C.P., L.C.M., and M.D.C.; project administration, F.G., L.C.M., C.P. All authors have read and agreed to the published version of the manuscript.”.
Funding
This research received no external funding.
Conflicts of Interest
The authors declare that the research was conducted without any commercial or final relationships with the company that could be construed as potential conflicts of interest.
References
- Bread – Worldwide. Available online: https://www.statista.com/outlook/cmo/food/bread-cereal-products/bread/worldwide (accessed on 25 October 2024).
- FAO. Crop prospects and food situation – Quarterly global report No. 2, July 2023. [CrossRef]
- Lai, H. M.; Lin, T. C. Bakery Products: Science and Technology. John Wiley & Sons, 2008, pp. 4-5.
- Breuillet, C.; Yildiz, E.; Cuq, B.; Kokini, J.L. Study of the anomalous capillary bagley factor behaviour of three types of wheat flour doughs at two moisture contents. J Texture Stud 2002, 33, 315–340. [CrossRef]
- Peighambardoust, S.H.; Van Der Goot, A.J.; Van Vliet, T.; Hamer, R.J.; Boom, R.M. Microstructure formation and rheological behaviour of dough under simple shear flow. J Cereal Sci 2006, 43, 183–197. [CrossRef]
- Córdoba, A. Quantitative fit of a model for proving of bread dough and determination of dough properties. J Food Eng 2010, 96, 440–448. [CrossRef]
- Dobraszczyk, B.J.; Morgenstern, M.P. Rheology and the breadmaking process. J Cereal Sci 2003, 38, 229–245.
- Guiné, R.P.F. Textural properties of bakery products: a review of instrumental and sensory evaluation studies. Appl Sci 2022, 12. [CrossRef]
- Barbieri, S.; Bendini, A.; Balestra, F.; Palagano, R.; Rocculi, P.; Gallina Toschi, T. Sensory and instrumental study of taralli, a typical italian bakery product. Eur Food Res Technol 2018, 244, 73–82. [CrossRef]
- Szczesniak, A.S.; Kahn, E.L. Consumer awareness of and attitudes to food texture. J Texture Stud 1971, 3, 280 -295. [CrossRef]
- Matos, M.E.; Rosell, C.M. Relationship between instrumental parameters and sensory characteristics in gluten-free breads. Eur Food Res Technol 2012, 235, 107–117. [CrossRef]
- Lassoued, N.; Delarue, J.; Launay, B.; Michon, C. Baked Product Texture: Correlations between instrumental and sensory characterization using flash profile. J Cereal Sci 2008, 48, 133–143. [CrossRef]
- Joyner, S.H. Explaining food texture through rheology. Curr Opin Food Sci 2018, 21, 7 -14. [CrossRef]
- Tamba-Berehoiu, R.; Popa,C.N.; Vişan L.; Popescu S. Correlations between the quality parameters and the technological parameters of bread processing, important for product marketing. Rom Biotechnol Lett 2014, 19.
- Mollakhalili-Meybodi, N.; Sheidaei, Z.; Khorshidian, N.; Nematollahi, N.; Khanniri, E. Sensory attributes of wheat bread: a review of influential factors. J Food Meas Charact 2023, 2172–2181. [CrossRef]
- Haegens, N. Mixing, Dough Making, and Dough Make up. Bakery Products Science and Technology 2014, Second Edition, 17. [CrossRef]
- Koksel, F.; Scanlon, M.G.; Page, J.H. Food Res Int 2016, 89, 74 – 89. [CrossRef]
- Jerome, R.E.; Singh, S.K.; Dwivedi, M. Process analytical technology for bakery industry: a review. J Food Process Eng 2019, 42, e13143. [CrossRef]
- Farahnaki, A.; Hill, S. The effect of salt, water and temperature on wheat dough rheology. J Text Stud 2007, 38, 499-519. [CrossRef]
- Prabhasankar, P.; Rao, P.H. Effect of different milling methods on chemical composition of whole wheat flour. Eur Food Res Technol 2001, 213, 465-569. [CrossRef]
- Aprodu, I.; Banu, I.; Stoenescu, G.; Ionescu, V. Effect of the industrial milling process on the rheological behavior of different types of wheat flour. St Cerc St 2010, 11, 429-437.
- Choy, A.; Walker, C.; Panozzo, J.; Investigation of wheat milling yield based on grain hardness. Cereal Chem 2015, 92, 544-550. [CrossRef]
- Meneghetti, V.; Pohdorf, R.; Biduski, B.; Zavarese, E.; Gutkoski, L.; Elis, M. Wheat grain storage at moisture milling: control of protein quality and bakery performance. J Food Process Preserv 2019, 43. [CrossRef]
- Li, E.; Dhital, S.; Hasjim, J. Effects of grain milling on starch structures and flour/starch properties. Starch 2014, 66, 15-27. [CrossRef]
- Patwa, A.; Kingsly, R.; Dogan, H.; Casada, M. Wheat mill stream properties for discrete element method modelling. American Soc Agric Biol Eng 2014, 57, 891-899. [CrossRef]
- Ma, S.; Wang, C.; Li, L.; Wang, X. Effects of particle size on the quality attributes of wheat flour made by the milling process. Cereal Chem 2020, 97, 172-182. [CrossRef]
- Bressiani, J.; Oro, T.; Santetti, G.S.; Almeida, J.L.; Bertolin, T.E.; Gómez, M.; Gutkoski, L.C. Properties of whole grain wheat flour and performance in bakery products as a function of particle size. J Cereal Sci 2017, 75, 269–277. [CrossRef]
- Mirza Alizadeh, A.; Peivasteh-Roudsari, L.; Tajdar-Oranj, B.; Beikzadeh, S.; Barani-Bonab, H.; Jazaeri, S. Effect of flour particle size on chemical and rheological properties of wheat flour dough. Iranian J Chem Engin 2022, 41, 682–694. [CrossRef]
- Sakhare, S.D.; Inamdar, A.A.; Soumya, C.; Indrani, D.; Rao, G.V. Effect of flour particle size on microstructural, rheological and physico-sensory characteristics of bread and south indian parotta. J Food Sci Technol 2014, 51, 4108–4113. [CrossRef]
- Pang, J.; Guan, E.; Yang, Y.; Li, M.; Bian, K. Effects of wheat flour particle size on flour physicochemical properties and steamed bread quality. Food Sci Nut 2021, 9, 4691-4700. [CrossRef]
- Protonotariou, S.; Batzaki, C.; Yanniotis, S.; Mandala, I. Effect of jet milled whole wheat flour in biscuits properties. L W T 2016, 74, 106 -113.
- Gujral H.S.; Mehta, S.; Samra, I.S.; Goyal, P. Effect of wheat bran, coarse wheat flour, and rice flour on the instrumental texture of cookies. Int J Food Prop 2003, 6, 329 – 340. [CrossRef]
- Sozer, N.; Cicerelli, L.; Heinio, R.L.; Poutanen, K. Effect of wheat bran addition on vitro starch digestibility, physiochemical and sensory properties of biscuits. J Cereal Sci 2014, 60, 105 – 113. [CrossRef]
- Putri, N.A.; Shalihah, I.M.;Widyasna, A.F.;Damayanti, R.P. A review of starch damage on physicochemical properties of flour. Food Sci Technol J 2020, 2, doi: :10.33512/fsj.v2i1.7936.
- Li, E.; Sushil, D.; Jovin, H. Effects of grain milling on starch structures and flour/starch properties. Starch 2014, 66, 15-27. [CrossRef]
- Jukic, M.; Koceva-Komlenic D.; Mastanjevic Kresimir, M.M.; Mirela, L; Popovici, C.; Nakov, G.; Lukinac, J. Influence of damaged starch on the quality parameters of wheat dough and bread. Ukr Food J 2019, 8, 512-521. [CrossRef]
- Memon, A.; Mahar, I.; Memon, R.; Soomro, S.; Harnly, J.; Memon, N.; Bhangar, M.; Luthria, D. Impact of flour particle size on nutrient and phenolic acid composition of commercial wheat varieties. J Food Comp Analysis 2020, 86. [CrossRef]
- Sun, X.; Koksel, F.; Scanlon M.G.; Nickerson M.T. Effects of water, salt, and mixing on the rheological properties of bread dough at large and small deformations: a review. Cereal Chem 2022, 99, 709-723. [CrossRef]
- Luchian, M.I. Influence of water on dough rheology and bread quality. J Food Packag Sci 2013, 2.
- Meerts, M.; Cardinaels, R.; Oosterlinck, F.;Courtin, C.M.; Moldenaers, P. The impact of water content and mixing time on the linear and non-linear rheology of wheat flour dough. Food Bioph 2017, 12, 151-163. [CrossRef]
- Upadhyay, R.; Ghosal, D.; Mehra, A. Characterization of bread dough: rheological properties and microstructure. J Food Engin 2012, 109,104-113. [CrossRef]
- Pauly, A.; Pareyt, B.; Fierens, E.; Delcour, J.A. Fermentation affects the composition and foaming properties of the aqueous phase of dough from soft wheat flour. Food Hydro 2014, 37, 221-228. [CrossRef]
- Hardt, N.; Boom, R.; van der Goot, A. Wheat dough rheology at low water contents and the influence of xylanases. Food Res Int 2014, 66, 478-484. [CrossRef]
- Letang, C; Piau, M.; Verdier, C. Characterization of wheat flour -water doughs. Part I: Rheometry and microstructure. J Food Eng 1999, 41, 121-132. [CrossRef]
- Patel, M.J.; Chakrabarti- Bell, S. J Food Eng 2013, 115, 371-383. [CrossRef]
- Zhang, H.; Shuchang, L.; Feng, X.; Ren, F.; Wang, J. Effect of hydrocolloids on gluten proteins, dough, and flour products: a review. Food Res Int 2023, 164, 112292. [CrossRef]
- Linlaud, N.; Puppo, M.; Ferrero, C. Effect of hydrocolloids on water absorption of wheat flour and farinograph and textural characteristics of dough. Cereal Chem 2009, 86, 376-382. [CrossRef]
- Dobraszczyk, B.J.; Salmanowicz, B.P. Comparison of predictions of baking volume using large deformation rheological properties. J Cereal Sci 2008, 47, 292–301. [CrossRef]
- Torbica, A.; Belović, M.; Popović, L. Comparative study of nutritional and technological quality aspects of minor cereals. J Food Sci Technol 2002, 58, 311-322. [CrossRef]
- Lacko-Bartošová, M.; Konvalina, P.; Lacko-Bartošová, L.; Štěrba, Z. Quality evaluation of emmer wheat genotypes based on rheological and Mixolab parameters. Czech J Food Sci 2019, 37, 192-198. [CrossRef]
- Biel, W.; Jaroszewska, A.; Stankowski, S.; Sobplewska, M.; Pacelik, J.K. Comparison of yield, chemical composition and farinograph properties of common and ancient wheat grains. European Food Res Technol 2021, 247, 1525-1538. [CrossRef]
- Sai Manohar, R.; Rao, P.; Haridas Rao, P. Effects of water on the rheological characteristics of biscuit dough and quality of biscuits. Eur Food Res Technol 1999, 209, 281-285. [CrossRef]
- Sangpring, Y.; Fukuoka, M.; Ban, N.; Oishi, H.; Sakai, N. Evaluation of relationship between state of wheat flour-water system and mechanical energy during mixing by colour monitoring and low-field 1h nmr technique. J Food Eng 2017, 211, 7–14. [CrossRef]
- Ștefan, E.-M.; Voicu, G.; Constantin, G.-A.; Ferdeș, M.; Muscalu, G. The effect of water hardness on rheological behaviour of dough. J Engin Stud Research 2015, 21.
- Sana, M.; Sinanai, A.; Xhabiri, G. The water quality of some sources in Albania and their influence on the dough rheology. J Hygien Engi Des 2022, 41, 170-175.
- Yang, Y.; Guan, E.; Zhang, T.; Li, M.; Bian, K. Influence of water addition methods on water mobility characterization and rheological properties of wheat flour dough. J Cereal Sci 2019, 89. [CrossRef]
- Mastromatteo, M.; Guida, M.; Danza, A.; Laverse, J.; Frisullo, P.; Lampignano, V.; Del Nobile, M.A. Rheological, microstructural and sensorial properties of durum wheat bread as affected by dough water content. Food Research International 2013, 51, 458–466. [CrossRef]
- Joossens, J. V., Sasaki, S., & Kesteloot, H. Bread as a source of salt: an international comparison. J Am Coll Nutr 1994, 13, 179-183.
- Preston, K. R. Effects of neutral salts of the lyotropic series on the physical dough properties of a Canadian red spring wheat flour. Cereal Chemistry 1989, 66, 144-148.
- Pasqualone, A.; Caponioa, F.; Pagani, M.A.; Summoa, C.; Paradiso V.M. Effect of salt reduction on quality and acceptability of durum wheat bread. Food Chem 2019, 289, pp. 575-581. [CrossRef]
- Salovaara, H. Effect of partial sodium chloride replacement by other salts on wheat dough rheology and breadmaking. Cereal Chem 1982, 59, 422-426.
- Beck, M.; Jekle, M.; & Becker, T. Impact of sodium chloride on wheat flour dough for yeast-leavened products. II. Baking quality parameters and their relationship. J Sci Food Agr 2012, 92, 299-306.
- Lynch, E. J.; Dal Bello, F.; Sheehan, E. M.; Cashman, K. D.; Arendt, E. K. Fundamental studies on the reduction of salt on dough and bread characteristics. Food Res Int 2009, 42(7), 885-891.
- Silow,C.; Axel,C.; Zannini, E.; Arendt, E.K. Current status of salt reduction in bread and bakery products – A review. J Cereal Sci 2016, 72, 135-145. [CrossRef]
- Wehrle, K.; Grau, H.; Arendt, E.K. Effects of lactic acid, acetic acid, and table salt on fundamental rheological properties of wheat dough. Cereal Chem 1997, 74, 739-744.
- Silow, C.; Zannini, E.; Axel, C.; Lynch, K. M.; & Arendt, E. K. Effect of salt reduction on wheat-dough properties and quality characteristics of puff pastry with full and reduced fat content. Food Res Int 2016, 89, 330-337.
- Diler, G.; Le-Bail, A.; Chevallier, S. Salt reduction in sheeted dough: A successful technological approach. Food Res Int 2016, 88, 10-15.
- Pflaum, T.; Konitzer, K.; Hofmann, T.; Koehler, P. Influence of texture on the perception of saltiness in wheat bread. J Agr Food Chem 2013, 61(45), 10649-10658.
- Moreau, L.; Lagrange, J.; Bindzus, W.; Hill, S. Influence of sodium chloride on colour, residual volatiles and acrylamide formation in model systems and breakfast cereals. Int J Food Sci Technol 2009, 44(12), 2407-2416.
- Czuchajowska, Z.; Pomeranz, Y.; Jeffers, H. C. Water activity and moisture content of dough and bread. Cereal Chem 1989, 66(2), 128-132.
- Hemdane, S.; Jacobs, P.; Dornez, E.; Verspreet, J.; Delcour, J.; Courtin, C. Wheat (Triticum aestivum L.) bran in bread making: a critical review. Comp Rev Food Sci Food Safety 2016, 15. [CrossRef]
- Bonilla, J.C.; Schaber, J.A.; Bhunia, A.K.; Kokini, J.L. Mixing dynamics and molecular interactions of HMW glutenins, LMW glutenins, and gliadins analyzed by fluorescent co-localization and protein network quantification. J Cereal Sci 2019, 89. [CrossRef]
- Shewry, P.R.; Belton, P.S. What do we really understand about wheat gluten structure and functionality? J of Cereal Sci 2024, 103895.
- Tebben, L.; Shen, Y.; Li, Y. Improvers and functional ingredients in whole wheat bread: a review of their effects on dough properties and bread quality. Trends Food Sci Technol 2018, 81, 10–24. [CrossRef]
- Gómez, M.; Gutkoski, L.C.; Bravo-Núñez, Á. Understanding Whole-Wheat Flour and Its Effect in Breads: A Review. Compr Rev Food Sci Food Saf 2020, 19, 3241–3265. [CrossRef]
- Navrotskyi, S.; Guo, G.; Baenziger, P.S.; Xu, L.; Rose, D.J. impact of wheat bran physical properties and chemical composition on whole grain flour mixing and baking properties. J Cereal Sci 2019, 89. [CrossRef]
- Heiniö,R.L.; Noort, M.W.J.;Katina, K.; Alam, S.A.; Sozer, N.; de Kock, H.L.; Hersleth, M.;Poutanen K. Sensory characteristics of wholegrain and bran-rich cereal foods – A review. Trends Food Sci Technol 2016, 47, 25-38. [CrossRef]
- Skendi,A.; Seni, I.;Varzakas, T.;Alexopoulos, A.;Papageorgiou, M. preliminary investigation into the effect of some bakery improvers in the rheology of bread wheat dough. Biol Life Sci Forum 2021, 6. [CrossRef]
- Liang, Z.; Gao, J.; Peixuan Y.; Yang, D. History, mechanism of action, and toxicity: a review of commonly used dough rheology improvers. Critical Rev Food Sci Nutr 2023, 63, 947-963. [CrossRef]
- Regulation (EC) number 1333/2008 on food additives. https://eur-lex.europa.eu/eli/reg/2008/1333/oj.
- Baratto, C.M.; Becker, N.B.; Gelinski, J.M.L.N.; Silveira, S.M. Influence of enzymes and ascorbic acid on dough rheology and wheat bread quality. African J Biotechnol 2015, 14. [CrossRef]
- Błaszczak, W.; Sadowska, J.; Rosell, C.M; Fornal, J. Structural changes in the wheat dough and bread with the addition of alpha-amylases. Eur Food Res Technol 2004, 219, 348–354. [CrossRef]
- Chen, Y.; Eder, S.; Schubert, S.; Gorgerat, S.; Boschet, E.; Baltensperger, L.; Windhab, E.J. Influence of amylase addition on bread quality and bread stalin. ACS Food Sci Technol, 2021 1 (6), 1143-1150.
- Cappelli, A.; Bettaccini, L.; Cini, E. The kneading process: a systematic review of the effects on dough rheology and resulting bread characteristics, including improvement strategies. Trends Food Sci Technol 2020, 104, 91–101. [CrossRef]
- Mirsaeedghazi, H.; Emam-Djomeh, Z.; Mohammad, S.; Mousavi, A. rheometric measurement of dough rheological characteristics and factors affecting it. Int J Agric Biol 2008, 1, 112-119. [CrossRef]
- Yazar, G. Wheat flour quality assessment by fundamental non-linear rheological methods: a critical review. Foods 2023, 12. [CrossRef]
- Chin, N. L.; Martin, P. J. Rheology of bread and other bakery products. Bakery Products Sci Technol 2014, 453–472. [CrossRef]
- Leroy, V.; Pitura, K. M.; Scanlon, M. G.; Page, J. H. The complex shear modulus of dough over a wide frequency range. J Non-Newt Fluid Mechan 2010, 165(9-10), 475-478.
- Yazar, G.; Duvarci, O. C.; Tavman, S.; Kokini, J. L.Effect of mixing on LAOS properties of hard wheat flour dough. J Food Eng 2016, 190, 195-204.
- Horvat, D.; Magdić, D. Šimić, G. Dvojković, K. Drezner, G. The relation between dough rheology and bread crumb properties in winter wheat. Agr Conspectus Sci 2008, 73(1), 9-12.
- Janssen, A. M.; Van Vliet, T.; Vereijken, J. M. Fundamental and empirical rheological behaviour of wheat flour doughs and comparison with bread making performance. J Cereal Sci 1996, 23(1), 43-54.
- Van Bockstaele, F.; De Leyn, I.; Eeckhout, M.;Dewettinck, K. Rheological properties of wheat flour dough and their relationship with bread volume. II. Dynamic oscillation measurements. Cereal Chem 2008, 85(6), 762-768.
- Van Bockstaele, F.; De Leyn, I.; Eeckhout, M.; Dewettinck, K. Rheological properties of wheat flour dough and the relationship with bread volume. I. Creep-recovery measurements. Cereal Chem 2008, 85(6), 753-761.
- Biesiekierski, J.R. What is gluten? J Gastroent Henteropat 2017, 32, 78-81. [CrossRef]
- Canja, C.M.; Lupu, M.; Taulea, G. The influence of mixing time on bread dough quality. Agr Food Engi 2014, 7.
- Peighambardoust, S. H., Fallah, E., Hamer, R. J., & Van Der Goot, A. J. (2010). Aeration of bread dough influenced by different way of processing. J Cereal Sci 2010, 51(1), 89-95.
- Chin, N. L.; Campbell, G. M. Dough aeration and rheology: Part 2. Effects of flour type, mixing speed and total work input on aeration and rheology of bread dough. J Sci Food Agr 2005, 85(13), 2194-2202.
- Campbell, G. M.; Martin, P. J. Bread aeration and dough rheology: An introduction. In Breadmaking 2020 (pp. 325-371). Woodhead Publishing.
- Parenti, O.; Guerrini, L.; Mompin, S.B.; Toldrà, M.; Zanoni, B. The determination of bread dough readiness during mixing of wheat flour: A review of the available methods. J Food Engi 2021, 309. [CrossRef]
- Oliver, J. R.; Allen, H. M. (1992). The prediction of bread baking performance using the farinograph and extensograph. J Cereal Sci 1992 , 15(1), 79-89.
- Connelly, R. K.; McIntier, R. L. Rheological properties of yeasted and nonyeasted wheat doughs developed under different mixing conditions. J Sci Food Agr 2008, 88(13), 2309-2323.
- Wilson, A. J.; Morgenstern, M. P.; Kavale, S. Mixing response of a variable speed 125 g laboratory scale mechanical dough development mixer. J Cereal Sci 2001, 34(2), 151-158.
- Wilson, A. J.; Wooding, A. R.; Morgenstern, M. P. Comparison of work input requirement on laboratory-scale and industrial-scale mechanical dough development mixers. Cereal Chem 1997, 74(6), 715-721.
- Torbica, A.; Blažek, K. M.; Belović, M.; Hajnal, E. J. Quality prediction of bread made from composite flours using different parameters of empirical rheology. J Cereal Sci 2019, 89, 102812.
- Pastukhov, A.; Dogan, H. Studying of mixing speed and temperature impacts on rheological properties of wheat flour dough using mixolab; Agronomy Res 2014, 12, 779-786.
- Connelly, R. K.; McIntier, R. L. Rheological properties of yeasted and nonyeasted wheat doughs developed under different mixing conditions. J Sci Food Agr, 2008, 88(13), 2309-2323.
- Hwang, C. H., & Gunasekaran, S. (2001). Determining wheat dough mixing characteristics from power consumption profile of a conventional mixer. Cereal Chemistry, 78(1), 88-92.
- Chin N.L.; Campbell, G.M. Dough aeration and rheology: Part 1. Effects of mixing speed and headspace pressure on mechanical development of bread dough. J Sci Food Agr 2005, 85, 2184-2193. [CrossRef]
- Brabec, D.; Rosenau, S.; Shipman, M. Effect of mixing time and speed on experimental baking and dough testing with a 200 g pin mixer. Cereal Chem 2015, 92(5), 449-454.
- Quayson, E. T.; Marti, A.; Bonomi, F.; Atwell, W.; Seetharaman, K. Structural modification of gluten proteins in strong and weak wheat dough as affected by mixing temperature. Cereal Chem 2016, 93(2), 189-195.
- Muchová, Z.; Žitný, B. New approach to the study of dough mixing processes; Czech J Food Sci 2010, 28, 94-107.
- Başaran, A.; Göçmen, D. The effects of low mixing temperature on dough rheology and bread properties. Eur Food Res Technol 2003, 217, 138–142. [CrossRef]
- Calderón-Domínguez, G.; Vera-Domínguez, M.; Farrera-Rebollo, R.; Arana-Errasquín, R.; Mora-Escobedo, R. Rheological Changes of Dough and Bread Quality Prepared from a Sweet Dough: Effect of Temperature and Mixing Time. Int J Food Prop 2004, 7(2), 165–174. [CrossRef]
- Spies , R .Application of rheology in the bread industry . In Dough Rheology and Baked Product Texture 1990, Edited by: Faridi , H. and Faubion , J.M. 343 – 359 . New York.
- Mani, K.; Trägårdh, C.; Eliasson, A. C.; Lindahl, L. Water content, water soluble fraction, and mixing affect fundamental rheological properties of wheat flour doughs. J Food Sci 1992, 57(5), 1198-1209.
- Wehrle, K., Grau, H., & Arendt, E. K. (1997). Effects of lactic acid, acetic acid, and table salt on fundamental rheological properties of wheat dough. Cereal chemistry, 74(6), 739-744.
- Tronsmo, K. M.; Magnus, E. M.; Baardseth, P.; Schofield, J. D.; Aamodt, A.; Færgestad, E. M. Comparison of small and large deformation rheological properties of wheat dough and gluten. Cereal Chem 2003, 80(5), 587-595.
- Adebowale, O.J.; Alokun – Adesanya, O.A. Dough Mixing Time: Impact on Dough Properties, Bread-Baking Quality andConsumer Acceptability. Fed Polytech Ilaro J Pure Appl Sci 2022, 4(2), 37–43.
- Zheng, H.; Morgenstern, M.P.; Campanella, O.H.; Larsen, N.G. Rheological properties of dough during mechanical dough development. J Cereal Sci 2000, 32, 293-306. [CrossRef]
- Rozyho, R. Effect of process modification in two cycles of dough mixing on physical properties of wheat bread baked from weak flour. Food Bioprocess Technol 2014. [CrossRef]
- Devos, F. Traditional versus modern leavening systems. Cereal Foods World 2018, 63(2).
- Romano, A.; Toraldo, G.; Cavella, S.; Masi, P. Description of leavening of bread dough with mathematical modelling. J Food Eng 2007 , 83 (2), 142-148.
- Bloksma, A. H. Effect of surface tension in the gas-dough interface on the rheological behaviour of dough. Cereal Chem 1981, 58, 481-486.
- Chin, N. L.; Tan; L. H.; Yusof, Y. A.; Rahman, R. A. Relationship between aeration and rheology of breads. J Text Stud 2009, 40(6), 727-738.
- Meerts, M.; Ramirez Cervera, A.; Struyf, N.; Cardinaels, R.; Courtin, C.M.; Moldenaers, P. The effects of yeast metabolites on the rheological behaviour of the dough matrix in fermented wheat flour dough. J Cereal Sci 2018, 82, 183–189. [CrossRef]
- Alvarez-Ramirez, J., Carrera-Tarela, Y., Carrillo-Navas, H., Vernon-Carter, E. J., & Garcia-Diaz, S. Effect of leavening time on LAOS properties of yeasted wheat dough. Food Hydro 2019, 90, 421-432.
- van der Sman, R.G.M. Thermodynamic description of the chemical leavening in biscuits. Curr Res Food Sci 2021, 4, 191–199. [CrossRef]
- Struyf, N.; Van der Maelen, E.; Hemdane, S.; Verspreet, J.; Verstrepen, K.J.; Courtin, C.M. Bread dough and baker’s yeast: an uplifting synergy. Compr Rev Food Sci Food Saf 2017, 16, 850–867. [CrossRef]
- Ali, A.; Shehzad, A.; Khan, M. R.; Shabbir, M. A.; Amjid, M. R. Yeast, its types and role in fermentation during bread making process-A. Pakistan J Food Sci 2012, 22(3), 171-179.
- Heitmann, M.; Zannini, E.; Axel, C.; Arendt, E. Correlation of flavour profile to sensory analysis of bread produced with different saccharomyces cerevisiae originating from the baking and beverage industry. Cereal Chem 2017, 94, 746–751. [CrossRef]
- Winters, M.; Panayotides, D.; Bayrak, M.; Rémont, G.; Viejo, C.G.; Liu, D.; Le, B.; Liu, Y.; Luo, J.; Zhang, P.; et al. Defined co-cultures of yeast and bacteria modify the aroma, crumb and sensory properties of bread. J Appl Microbiol 2019, 127, 778–793. [CrossRef]
- Crowley, P.; Schober, T.J.; Clarke, C.I.; Arendt, E.K. The effect of storage time on textural and crumb grain characteristics of sourdough wheat bread. European Food Res Technol 2002, 214, 489–496. [CrossRef]
- Rizzello, C.G.; Portincasa, P.; Montemurro, M.; di Palo, D.M.; Lorusso, M.P.; de Angelis, M.; Bonfrate, L.; Genot, B.; Gobbetti, M. Sourdough fermented breads are more digestible than those started with baker’s yeast alone: an in vivo challenge dissecting distinct gastrointestinal responses. Nutrients 2019, 11. [CrossRef]
- Gobbetti, M.; Corsetti, A.; Rossi, J. Interaction between lactic acid bacteria and yeasts in sour-dough using a rheofermentometer; World J Microbiol Biotechnol 1995,11,625-630. [CrossRef]
- Siepmann, F.B.; Ripari, V.; Waszczynskyj, N.; Spier, M.R. Overview of sourdough technology: from production to marketing. Food Bioproc Tech 2018, 11, 242–270. [CrossRef]
- Zhang, D. Effect of proofing on the rheology and moisture distribution of corn starch-hydroxypropylmethylcellulose gluten-free dough. Foods 2023, 12. [CrossRef]
- Jayaram, V.B.; Cuyvers, S.; Verstrepen, K.J.; Delcour, J.A.; Courtin, C.M. Succinic acid in levels produced by yeast (saccharomyces cerevisiae) during fermentation strongly impacts wheat bread dough properties. Food Chem 2014, 151, 421–428. [CrossRef]
- Zolfaghari, M.S.; Ardebili, S.M.S.; Asadi, G.H.; Larijani, K. Effect of sourdough, bakery yeast and sodium bicarbonate on volatile compounds, and sensory evaluation of lavash bread. J Food Process Preserv 2017, 41. [CrossRef]
- Taglieri, I.; Sanmartin, C.; Venturi, F.; Macaluso, M.; Zinnai, A.; Tavarini, S.; Serra, A.; Conte, G.; Flamini, G.; Angelini, L.G. Effect of the leavening agent on the compositional and sensorial characteristics of bread fortified with flaxseed cake. Appl Sci 2020, 10. [CrossRef]
- Cappelli, A.; Lupori, L.; Cini, E. Baking Technology: A Systematic review of machines and plants and their effect on final products, including improvement strategies. Trends Food Sci Technol 2021, 115, 275–284. [CrossRef]
- Rouillé, J.; Chiron, H.; Colonna, P.; Della Valle, G.; Lourdin, D. Dough/crumb transition during French bread baking. J Cereal Sci 2010, 52(2), 161-169.de Kock, H.L.; Magano, N.N. Sensory tools for the development of gluten-free bakery foods. J Cereal Sci 2020, 94. [CrossRef]
- Purlis, E. Bread baking: technological considerations based on process modelling and simulation. J Food Eng 2011, 103, 92–102. [CrossRef]
- Lafiandra, D.; Shewry, P.R. Wheat glutenin polymers 2. the role of wheat glutenin subunits in polymer formation and dough quality. J Cereal Sci 2022, 106. [CrossRef]
- Wieser, H. Chemistry of gluten proteins. Food Microbiol 2007, 24, 115–119. [CrossRef]
- Li, M.; Yue, Q.; Liu, C.; Zheng, X.; Hong, J.; Wang, N.; Bian, K. interaction between gliadin/glutenin and starch granules in dough during mixing. LWT 2021, 148. [CrossRef]
- Wang, P.; Jin, Z.; Xu, X. Physicochemical alterations of wheat gluten proteins upon dough formation and frozen storage - a review from gluten, glutenin and gliadin perspectives. Trends Food Sci Technol 2015, 46, 189–198. [CrossRef]
- Chen, J.; Stokes, J. R. Rheology and tribology: Two distinctive regimes of food texture sensation. Trends in Food Sci Technol 2012, 25(1), 4-12.
- Dong, Y.N.; Karboune, S. A review of bread qualities and current strategies for bread bioprotection: flavour, sensory, rheological, and textural attributes. Compr Rev Food Sci Food Saf 2021, 20, 1937–1981. [CrossRef]
- Angioloni A.; Collar, C. Bread crumb quality assessment: a plural physical approach. Europ Food Res Technol 2009, 229, 21-30. [CrossRef]
- Tietze, S.; Jekle, M.; Becker, T. Possibilities to Derive Empirical Dough Characteristics from Fundamental Rheology. Trends Food Sci Technol 2016, 57, 1–10. [CrossRef]
- Janssen, A. M.; Van Vliet, T.; Vereijken, J. M. Fundamental and empirical rheological behaviour of wheat flour doughs and comparison with bread making performance. J Cereal Sci 1996, 23(1), 43-54.
- Joyner, H. S. Nonlinear (large-amplitude oscillatory shear) rheological properties and their impact on food processing and quality. Annual Rev Food Sci Technol 2021, 12(1), 591-609.
- Wang, Y.; Selomulya, C. Food rheology applications of large amplitude oscillation shear (LAOS). Trends Food Sci Technol 2022, 127, 221–244. [CrossRef]
- Civille, G.V.; Oftedal, K.N. Sensory evaluation techniques - make “good for you” taste “good.” Physiol Behav 2012, 107, 598–605. [CrossRef]
- de Kock, H.L.; Magano, N.N. Sensory tools for the development of gluten-free bakery foods. J Cereal Sci 2020, 94. [CrossRef]
- Pedreschi, F.; León, J.; Mery, D.; Moyano, P. Development of a computer vision system to measure the colour of potato chips. Food Res Int 2006, 39, 1092–1098. [CrossRef]
- Purlis, E. Browning development in bakery products - a review. J Food Eng 2010, 99, 239–249. [CrossRef]
- Cauvain, S. Breadmaking: An overview. In S. Cauvain (Ed.), Breadmaking 2012, (pp. 9–31). Cambridge: Woodhead Publishing Ltd.
- Rosell, C. M. The science of doughs and bread quality. In Victor R. Preedy, Ronald Ross Watson & Vinood B. Patel (Eds.), Flour and breads and their fortification in health and disease prevention 2011, (pp. 3–14). London: Academic Press.
- Longin, F.; Beck, H.; Gütler, H.; Heilig, W.; Kleinert, M.; Rapp, M.; Stich, B. Aroma and quality of breads baked from old and modern wheat varieties and their prediction from genomic and flour-based metabolite profiles. Food Res Int 2020, 129, 108748.
- Rapp, M.; Beck, H.; Gütler, H.; Heilig, W.; Starck, N.; Römer, P.; Cuendet, C.; Uhlig, F.; Kurz, H.; Würschum, T.; Longin, C.; Friedrich, H. Spelt: Agronomy, Quality, and Flavor of Its Breads from 30 Varieties Tested across Multiple Environments. Crop Sci 2017, 57(2), 739. [CrossRef]
- Martins, Z.E.; Pinho, O.; Ferreira, I.M.P.L.V.O. Food industry by-products used as functional ingredients of bakery products. Trends Food Sci Technol 2017, 67, 106–128. [CrossRef]
- Yalcin, E.; Ozdal, T.; Gok, I. Investigation of textural, functional, and sensory properties of muffins prepared by adding grape seeds to various flours. J Food Process Preserv 2022, 46. [CrossRef]
- Khan, A.; Rafiq, S.I.; Saini, C.S.; Hossain, S.; Rafiq, S.M. Studies on physico-chemical, functional, textural and sensory properties of flaxseed fortified bakery products. J Food Measur Charact 2024. [CrossRef]
- Belghith-Fendri, L.; Chaari, F.; Kallel, F.; Zouari-Ellouzi, S.; Ghorbel, R.; Besbes, S.; Ellouz-Chaabouni, S.; Ghribi-Aydi, D. Pea and broad bean pods as a natural source of dietary fiber: the impact on texture and sensory properties of cake. J Food Sci 2016, 81, C2360–C2366. [CrossRef]
- Bangar, S.P.; Siroha, A.K. Functional Cereals and Cereal Foods: Properties, Functionality and Applications; Springer International Publishing, 2022; ISBN 9783031056116.
- Tóth, M.; Kaszab, T.; Meretei, A. Texture profile analysis and sensory evaluation of commercially available gluten-free bread samples. Eur Food Res Technol 2022, 248, 1447–1455. [CrossRef]
- Di Cairano, M.; Condelli, N.; Galgano, F.; Caruso, M.C. Experimental gluten-free biscuits with underexploited flours versus commercial products: preference pattern and sensory characterisation by check all that apply questionnaire. Int J Food Sci Technol 2022, 57, 1936–1944. [CrossRef]
- Carson, L.; Sun, X. S. Creep-recovery of bread and correlation to sensory measurements of textural attributes. Cereal Chem 2001, 78(1), 101-104.
- Liu, Z.; Scanlon, M. G. Predicting mechanical properties of bread crumb. Food Biopr proc 2002, 81(3), 224-238.
- Nagy, M.; Meretei, A.; Fekete, A. Bread type characterization by rheological and mechanical properties. In 2007 ASAE Annual Meeting (p. 1). American Society of Agricultural and Biological Engineers.
- Young, L. S. Applications of texture analysis to dough and bread. In Breadmaking 2012 (pp. 562-579). Woodhead Publishing.
- Szczesniak, A.S. Texture is a sensory property. Food Qual Prefer 2002, 13, 215–225.
- Civille, G. V.; Szczesniak, A. S. Guidelines to training a texture profile panel. J Text Stud 1973, 4(2), 204-223.
- Scheuer, P. M.; Luccio, M. D.; Zibetti, A. W.; de Miranda, M. Z.; de Francisco, A. Relationship between instrumental and sensory texture profile of bread loaves made with whole-wheat flour and fat replacer. J Text Stud 2016, 47(1), 14-23.
- Callejo, M.J. Present situation on the descriptive sensory analysis of bread. J Sensory Stud 2011, 26, 255-268. [CrossRef]
Figure 1.
Typical Brabender Farinograph output. DDT (development time of dough); DS (degree of softening 10 min after beginning); DS (ICC) (degree of softening 12 min after); S2-S1 (stability), C (consistency).
Figure 1.
Typical Brabender Farinograph output. DDT (development time of dough); DS (degree of softening 10 min after beginning); DS (ICC) (degree of softening 12 min after); S2-S1 (stability), C (consistency).
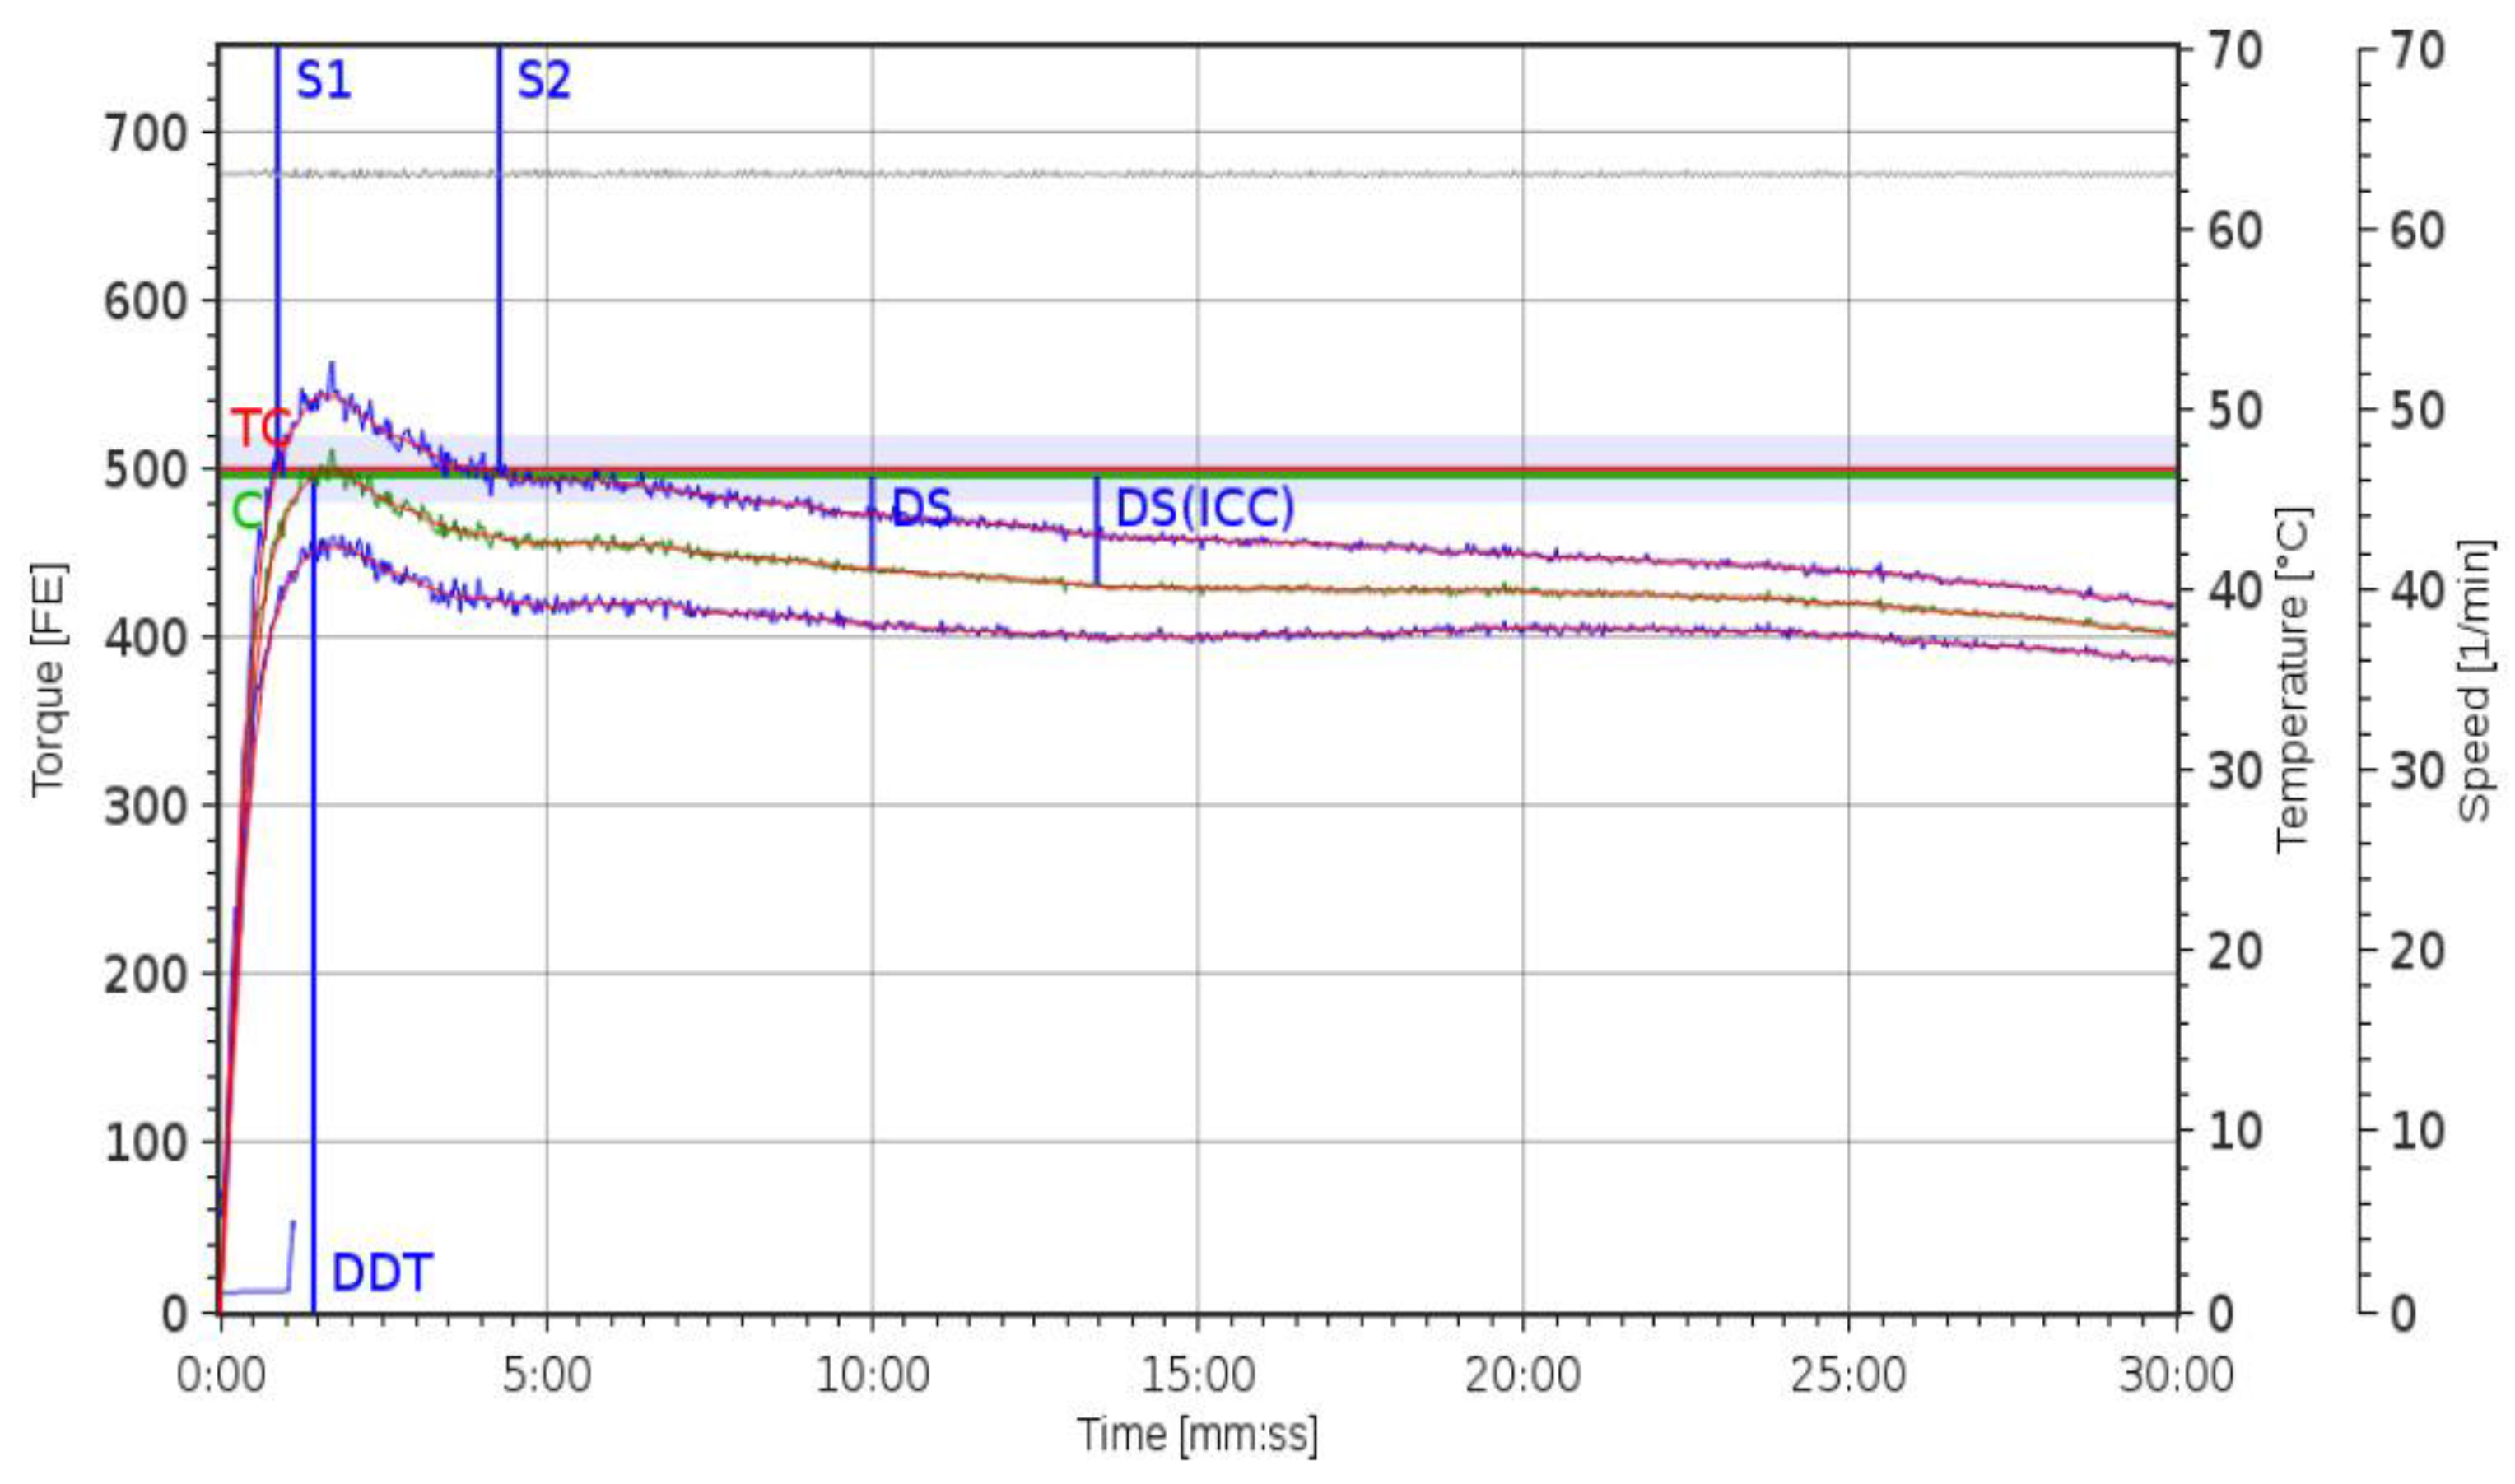

Table 1.
Impact of formulation and processing parameters on bread characteristics.
| Ingredients / Processing parameters | Limits | Technological effect | Sensory effect | References |
|---|---|---|---|---|
| Particle size of wheat flour | <125 μm | ↑ dough development time; ↑ dough stability; ↓ resistance to extension. |
soft texture; ↑ sensory characteristics. |
[28] |
| >150 μm | ↓ dough development time; ↑ water absorption level; ↑ resistance to extension. |
dense crumb grain; ↓ overall sensory quality. |
[28,29] | |
| Water | From 44% to 34% | ↑peak time; ↑ dough consistency; ↑G’ and G”. |
compact crumb with small bubbles; ↑ crust firmness. | [43,57] |
| ≈ 74% | ↓ dough consistency; ↓ G’ and G”. |
↓ loaf volume; Irregular crumb structure with large bubble. |
[57] | |
| Salt | 0% | ↓ dough strength; ↓ dough stability; |
tasteless; ↑ yeasty and sourdough-like flavours. |
[61,67] |
| 1-2% | ↑peak time; ↓ water adsorption; ↑ dough stability. |
↑ darker colour crust; ↓ floury and yeasty flavours. |
[61,68,69] | |
| Wheat bran | From 0 to 12% | ↑ dough development time; ↓ stability time; ↑weakening degree; ↑ water absorption of dough. |
↑crumb firmness ↓specific volume ↑dark crumb ↓ overall acceptability |
[71,76] |
| Ascorbic acid | 50-70 ppm | ↑dough strength; ↑ dough elasticity of the dough. |
↑ hardness; ↓ handfeel; ↓ texture; ↓ mouthfeel. |
[81] |
| L-cysteine hydrochloride | -- | ↓ resistance to extension; ↓ extensograph area; ↑ extensibility. |
↓ hardness; ↓ texture; ↓ chewiness. |
[81] |
| α-amylase | -- | ↓ dough stability; ↓ Mixograph peak height. |
↓ bread hardness; ↑ bread volume; ↑ crumb structure. |
[74,82,83] |
| Mixing speed | High (i.e 200 rpm) |
↓dough stability; ↑ dough consistency; ↑peak time. |
↑ loaf volume; ↑ crumb texture. |
[53,84,104] |
| Low (i.e 63 rpm) |
↓ dough consistency; | ↓ loaf volume | [53,84,104] | |
| Dough temperature |
17°C | ↑ water absorption level; ↑ dough development time; ↑ dough consistency. |
↑ crumb texture; ↑ loaf volume. |
[84,98] |
| 30°C | ↓ dough consistency; ↓ water absorption time. |
↓ loaf volume | [84,98] | |
| Mixing time | overmixing | ↓ dough consistency; slack and sticky dough. |
↓ loaf volume | [95,101] |
| undermixing | ↑ dough consistency; ↓ leavening ability. |
↓ loaf volume | [95,101] | |
| ↑: increase; ↓: reduction | ||||
Table 2.
Impact of bakery’s yeast and sourdough on technological and sensory properties of bread.
| Leavening agent |
Compounds produced |
Technological effect |
Sensory effect |
References | |
|---|---|---|---|---|---|
| Baker’s yeast (Saccharomyces cerevisiae spp.) |
CO2 Ethanol organic acid glycerol |
ethanol, succinic acid, glutathione alter the structure of the gluten network; ↑ softening effect on dough. |
Differences in the genes of Saccharomyces cerevisiae strains play a major role in the change of the aroma profiles | [128,129] | |
| Sourdough (Saccharomyces cerevisiae spp. + Lactic acid bacteria) |
CO2 ; ethanol; organic acid; glycerol helps to produce enzymes such as maltase, invertase and zymase |
↓elastic and firm dough; ↑ bread-specific volume; ↓ crumb firmness over time; ↑dough expansion during fermentation. |
Bread aroma profiles and crumb structure are more distinctive, due to sour aromas produced, and preferred by sensory panels produced | [131,132,133,134,135,136,137,138] | |
| ↑: increase; ↓: reduction | |||||
Table 3.
Advantages and drawbacks of main rheological tests.
| Tests | Advantages | Drawbacks | References | ||
|---|---|---|---|---|---|
| Nature of | Empirical | Mixograph; | Easy; robust; capable, | The sample geometry is | [7,86] |
| method | Alveograph; | do not require technically | variable and not | ||
| Extensograph; | trained personnel | well-defined; | |||
| Farinograph; | the stress and strain states | ||||
| Mixolab; | are uncontrolled, complex | ||||
| Rheofermentograph | and non-uniform | ||||
| Fundamental | Small deformation dynamic shear | One type of deformation is | Complex instrumentation; | [7,86] | |
| oscillation; | applied, | expensive, time-consuming; | |||
| small and large deformation shear | scientific instruments; | difficult to maintain in an | |||
| creep and stress relaxation; | small number of samples | industrial environment and | |||
| large deformation extensional | required | require high levels of tech- | |||
| measurements; | nical skill | ||||
| flow viscometry | |||||
| Deformation | Small ampli- | Linear deformation, | Understanding molecular | Little relationship with | [7,86] |
| applied | tude oscilla- | analyzes the linear viscoelastic | interactions and micro- | end-use performance; | |
| tory shear | response by observing the strain | structure; | not being appropriate in | ||
| (SAOS) | and frequency dependence of the | material structural proper- | practical processing situa- | ||
| elastic modulus (g′) and viscous | ties under a relatively ex- | tions due to the rates at | |||
| modulus (g″) at small strains | tended range of conditions | which the test can be used | |||
| Large ampli- | Non linear deformation; | Provide structure of com- | Requiring complex compu- | [7,86,153] | |
| tude oscilla- | capillary flow; | plex food in real-time; | tation with data processing | ||
| tory shear | lubricated squeezing flow; | Differentiate different | software | ||
| (LAOS) | Stress relaxation, | types of wheat flours, | |||
| Stress growth, | Characterise the viscoelas- | ||||
| Creep and creep recovery, | tic properties of flour; | ||||
| Large amplitude oscillatory shear | dough is mainly exposed | ||||
| tests | to large deformations | ||||
Disclaimer/Publisher’s Note: The statements, opinions and data contained in all publications are solely those of the individual author(s) and contributor(s) and not of MDPI and/or the editor(s). MDPI and/or the editor(s) disclaim responsibility for any injury to people or property resulting from any ideas, methods, instructions or products referred to in the content. |
© 2024 by the authors. Licensee MDPI, Basel, Switzerland. This article is an open access article distributed under the terms and conditions of the Creative Commons Attribution (CC BY) license (http://creativecommons.org/licenses/by/4.0/).
Copyright: This open access article is published under a Creative Commons CC BY 4.0 license, which permit the free download, distribution, and reuse, provided that the author and preprint are cited in any reuse.


