Submitted:
04 November 2024
Posted:
05 November 2024
You are already at the latest version
Abstract
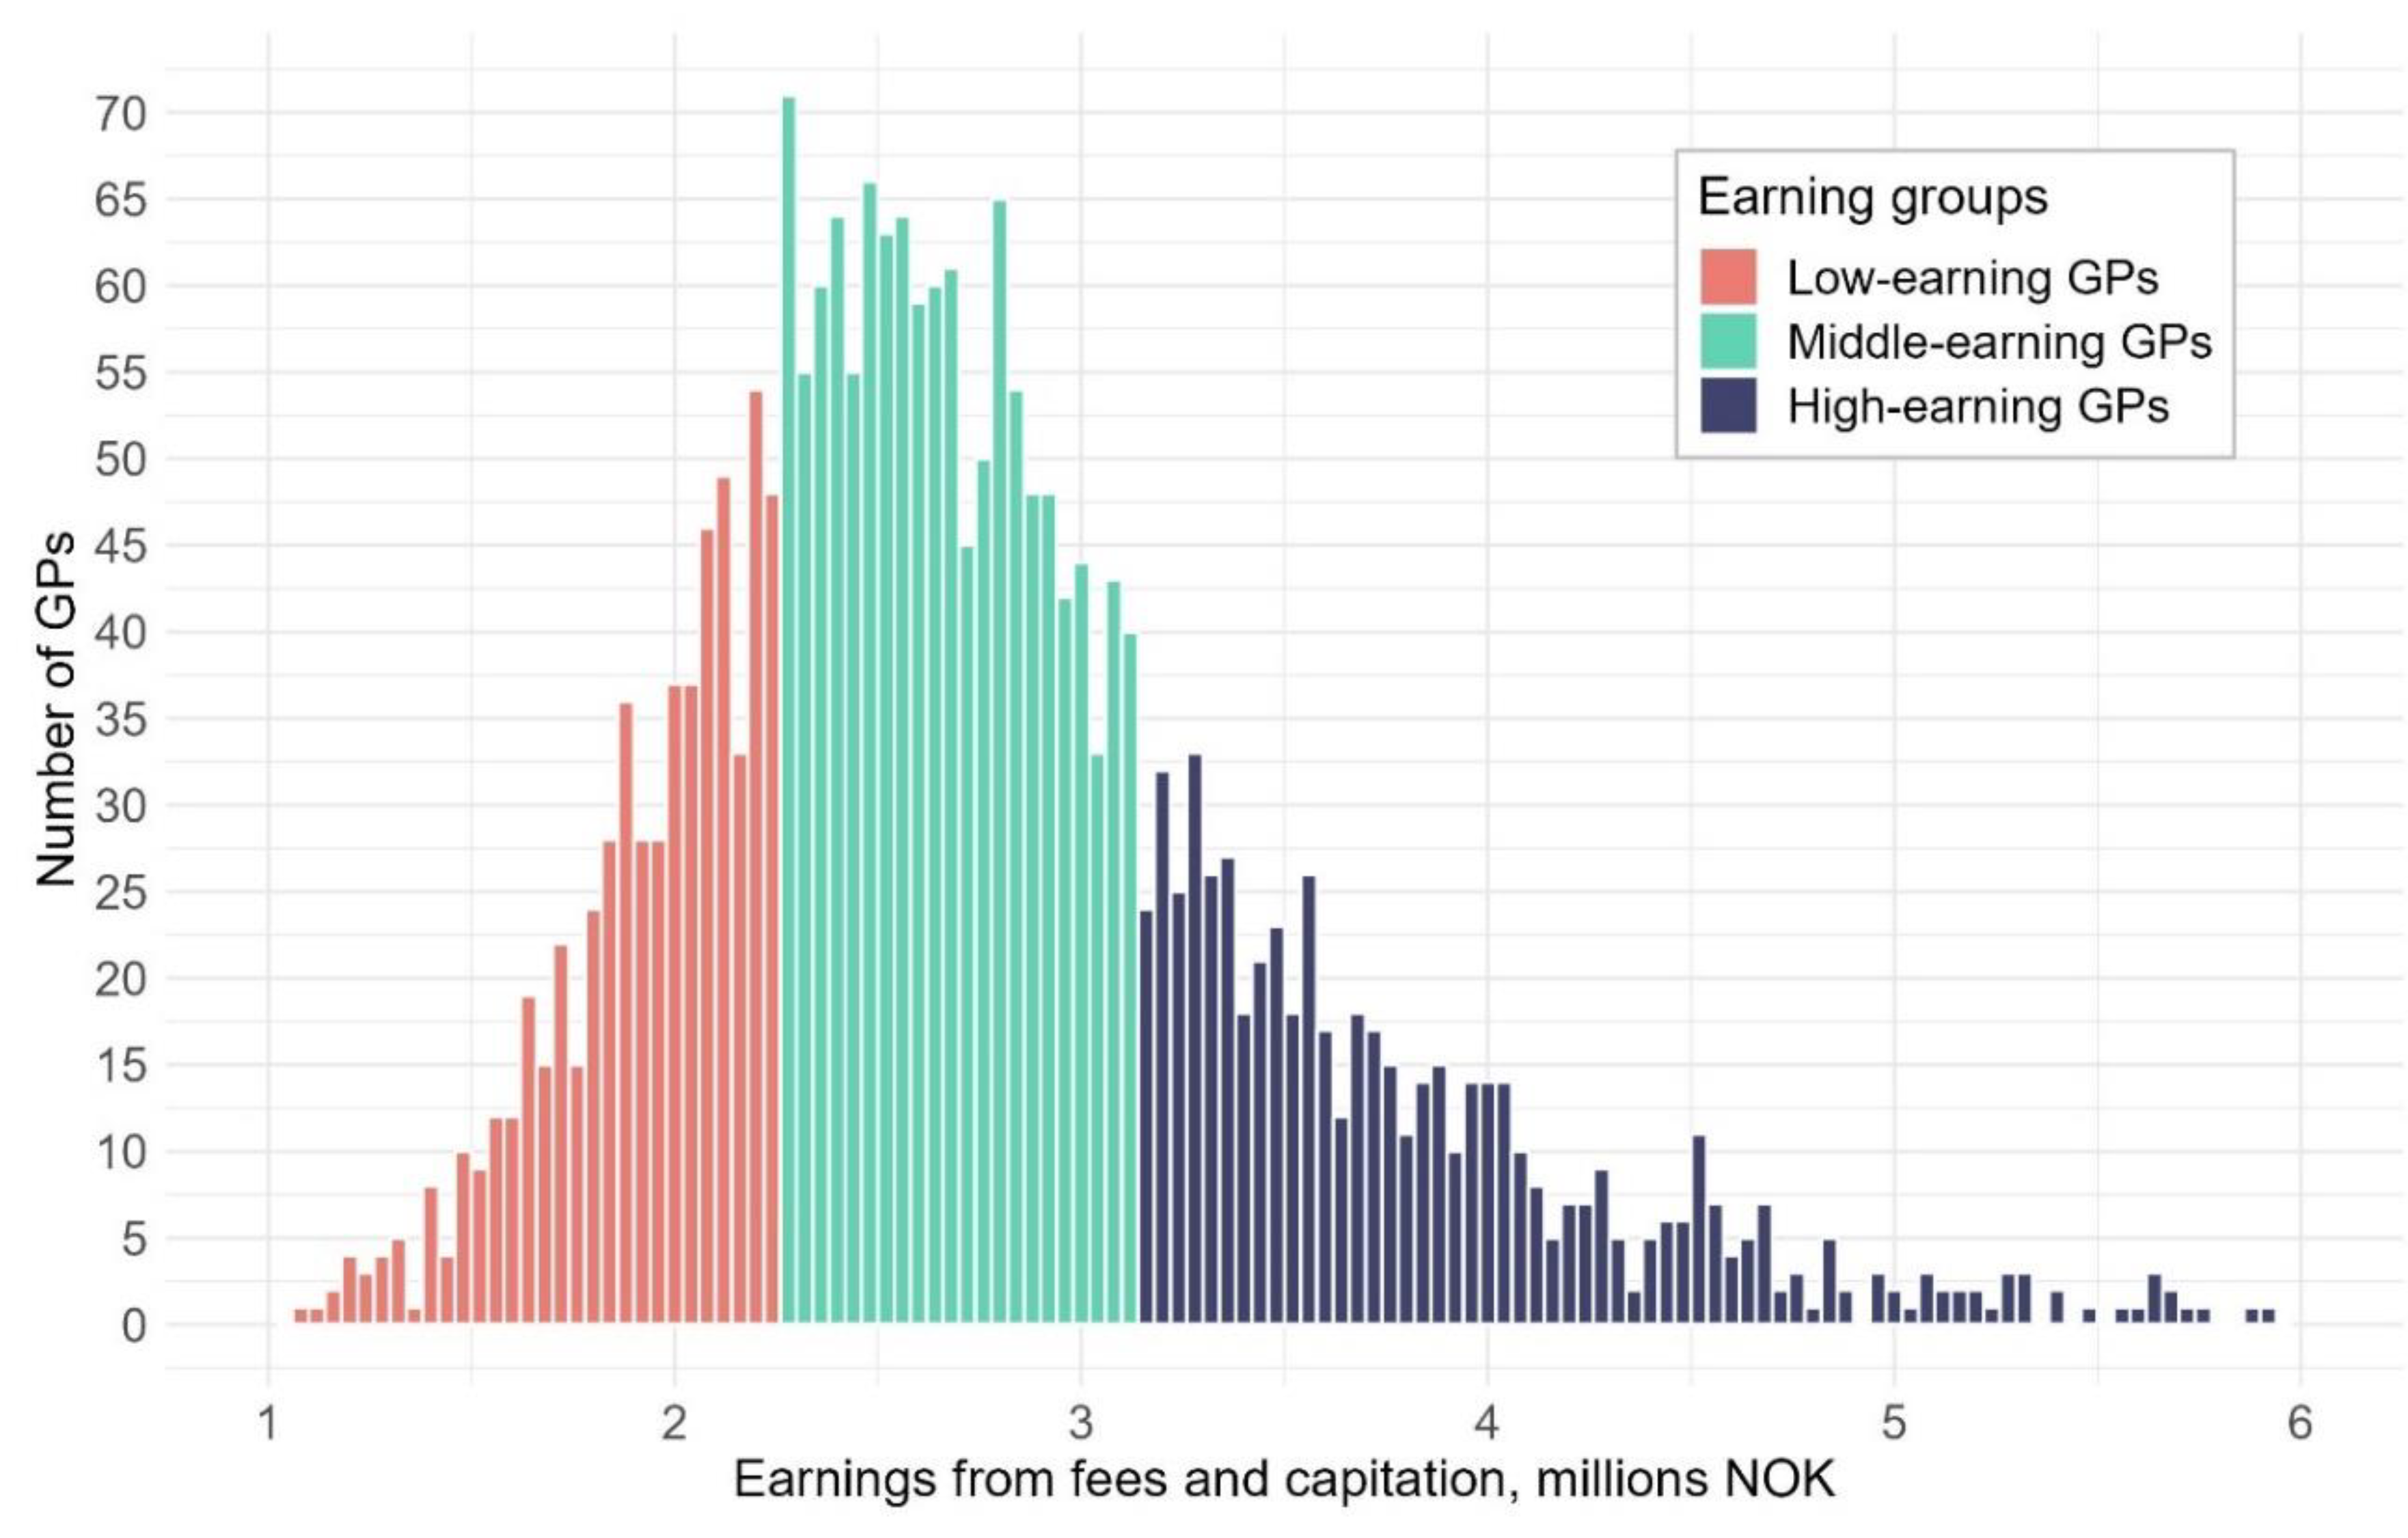
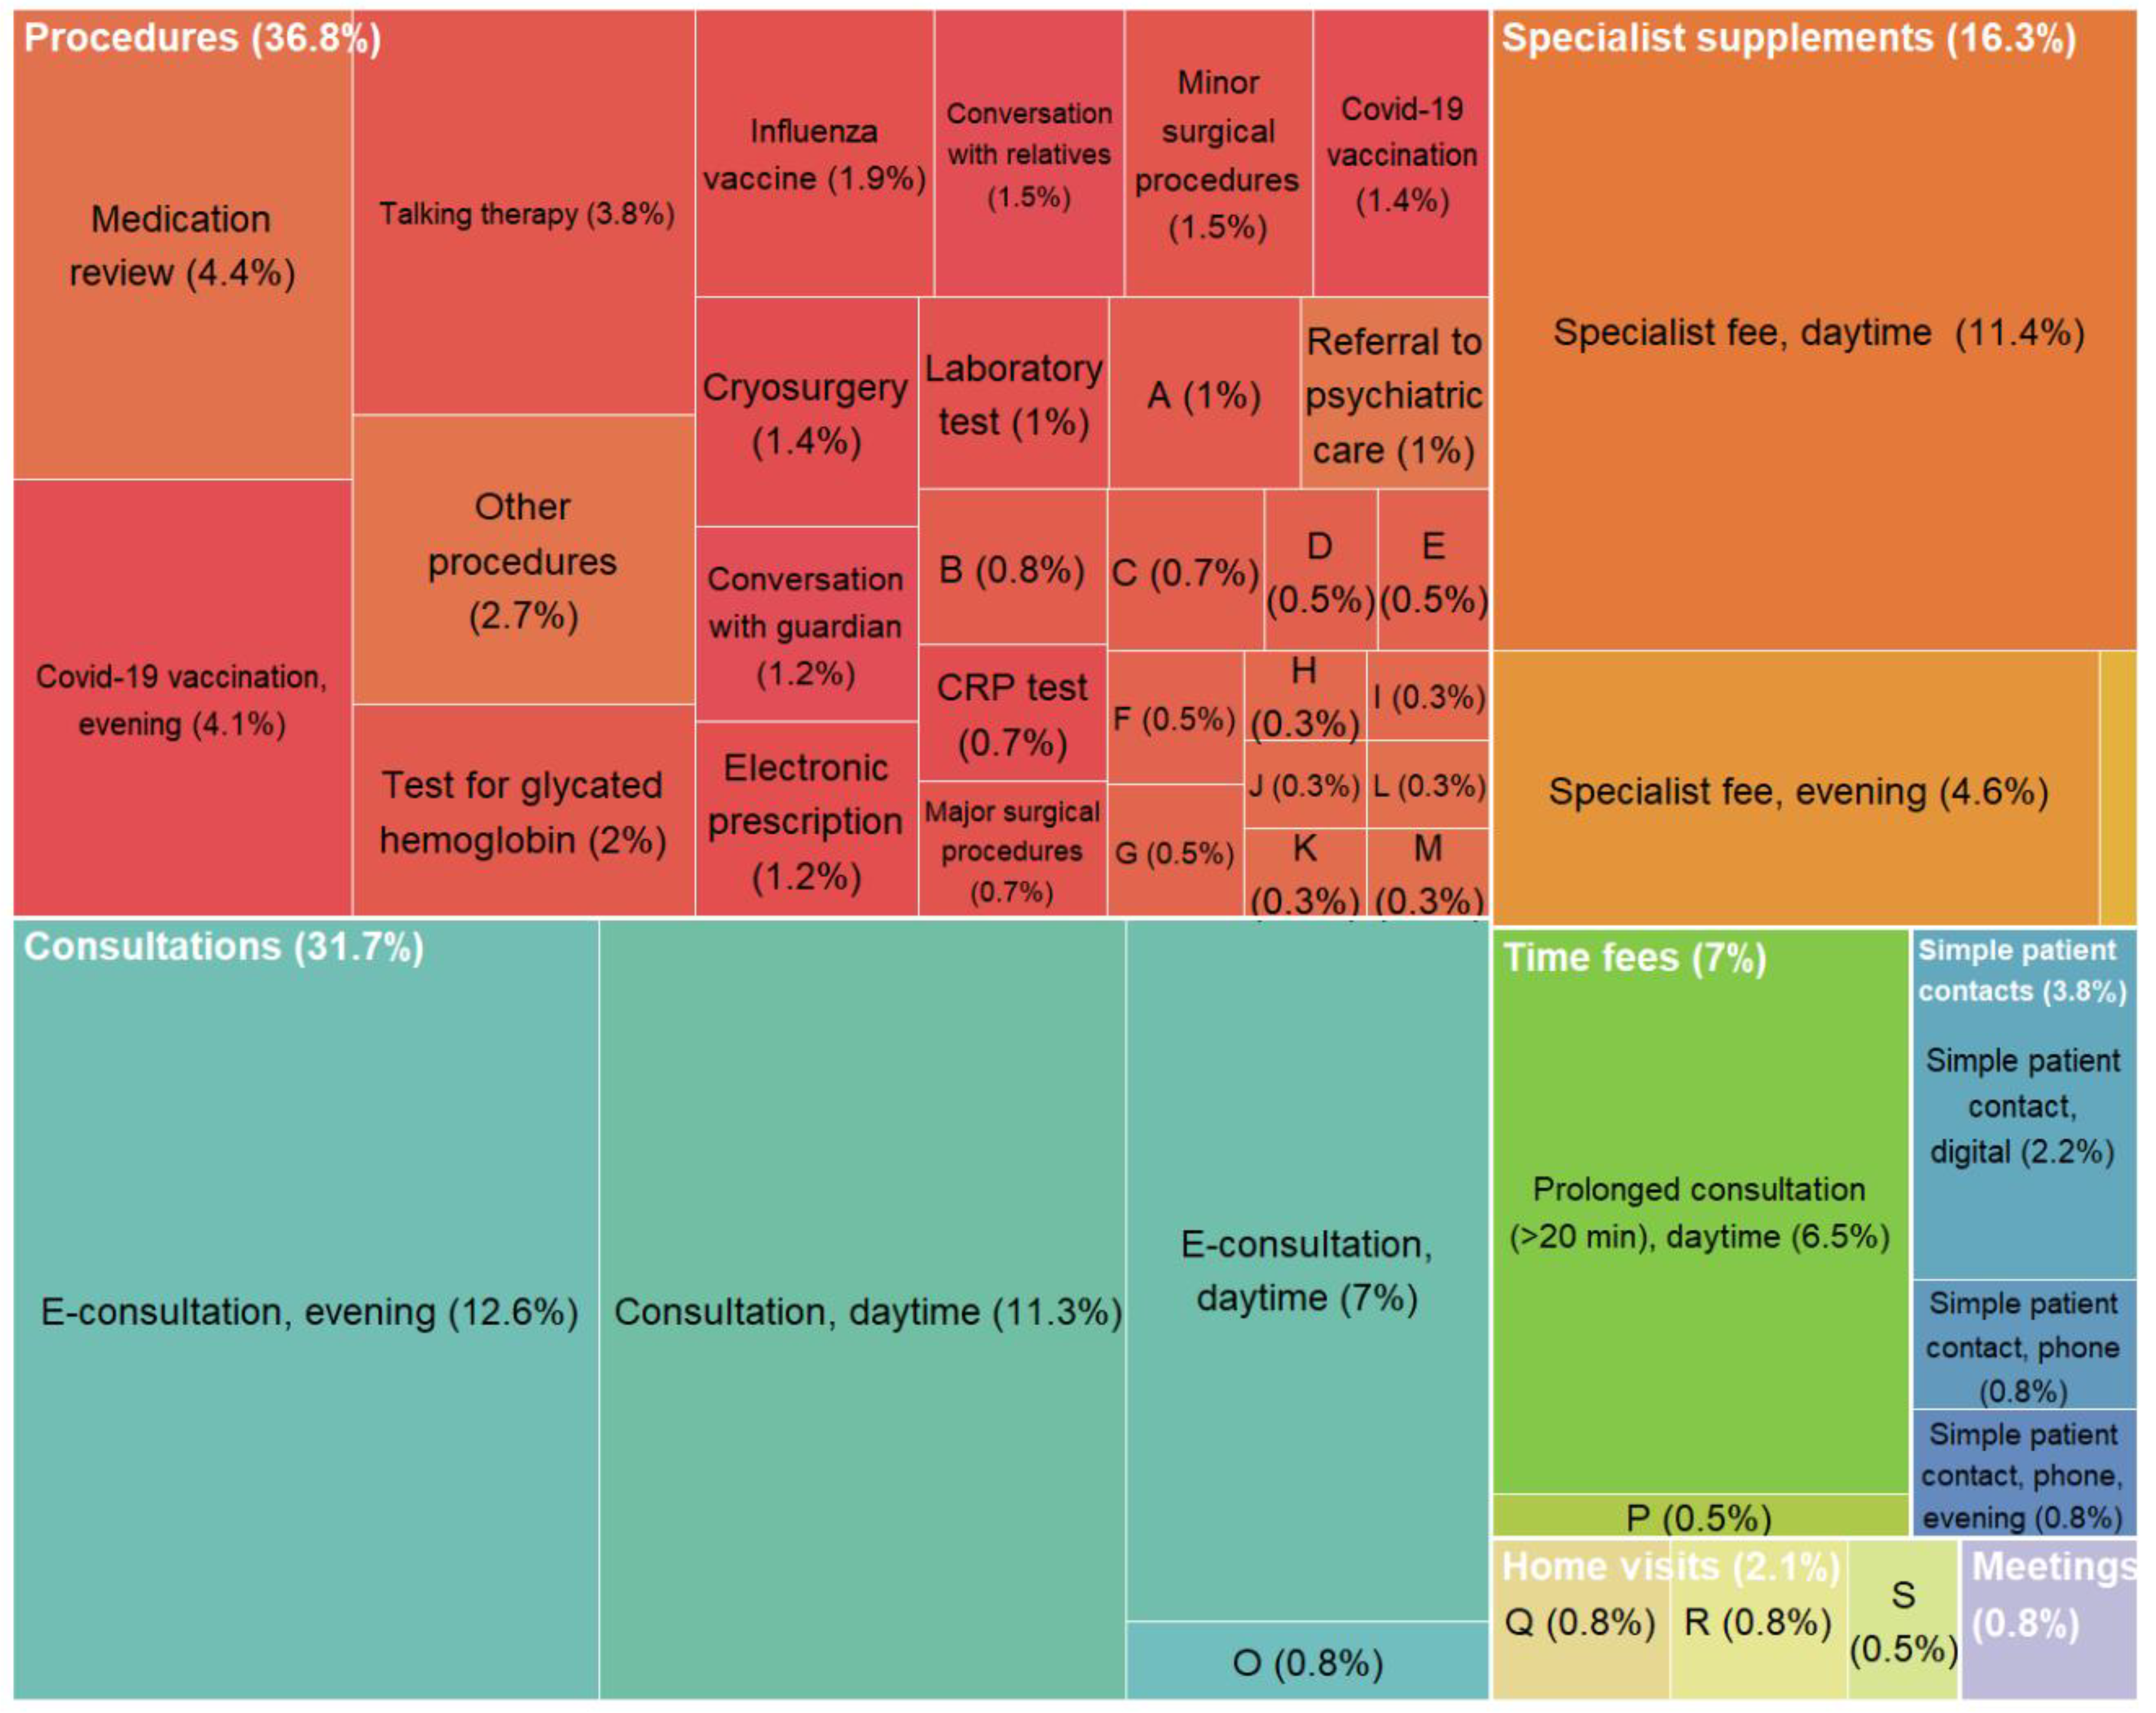
In Norway, 78% of publicly funded general practitioners (GPs) are self-employed, remunerated through a mix of capitation and fee-for-service, while 22 % are salaried. GPs register consultations and procedures using nationally standardized fees for health services, which allows for variations in earnings. Our study aims to examine whether high and low earning GPs also differ in their earnings per list patient and, if so, identify the specific fees that contribute to this difference. Additionally, we aim to compare practice characteristics between high and low earning GPs. We analyse national registry data from 2021 for all GPs with at least 100 working days (N=2546) and calculate annual earnings from capitation and fees. High earning GPs (upper quartile) have 55% more listed patients than low earning GPs (lower quartile), yet they earn 40% more from fees per patient (average €178 versus €127). Nearly half of the earnings difference per patient can be attributed to high earning GPs more frequently conducting consultations with patients. Still, patients of high earning GPs receive less minutes in consultations yearly (average 35 versus 38 min), due to high earners’ shorter consultation duration (average 15 versus 20 min). The remaining earning difference comes from higher utilization of procedure fees among high earners (average 5.6 versus 3.9 procedures per patient). Prolonged consultation, medication review, and talking therapy are some of the fees that contribute most to this difference. The findings highlight that considerable earning variations are linked to fee utilization and practice styles among GPs.
Keywords:
1. Introduction
2. Institutional Background
3. Methods
Data and Variable Definitions
Study Sample
Analysis
4. Results
Earnings Difference per List Patient
Practice Variation
Supplementary Analysis
5. Discussion
Differences in Activity or Differences in Fee Usage?
How Can this Study Add to the Existing Literature?
Strengths and Limitations
Implications
6. Conclusions
Supplementary Materials
| 1 | The reason for the latter exclusion is that it is likely that the estimation does not captures actual consultation duration, but the largest possible duration or other systematic biases. Although we have tried to exclude the largest possible sources of errors, it still will probably overestimate the consultation duration. However, we do not believe that the overestimation is likely to be large and systematic. |
| 2 | We have chosen to focus on GPs with specialisation of two reasons. First, there are specific fees that only can be used by GPs with specialisation, and therefore, including both specialised and not-specialised GPs would induce an earnings difference that have low analytical interest. Second, all GPs with a specialization have worked as general practitioners for many years, and differences due to length of experience are minimized. However, we have conducted similar analysis for GPs without specialisation (supplementary Table S4 a-c), and these results are presented briefly in the end of the result section. |
| 3 | We define a working day as any weekday with at least five daytime consultations. We choose to include only GPs with more than 100 days in order to balance two considerations: One the one hand, exclude the GPs that have low earnings because they work few days. On the other hand, we wanted to include variations of what can be considered as a normal working load among GPs in order to maintain a high degree of external validity. |
| 4 | Specialist fees can be used together with consultations, and can therefore be viewed as a part of the earnings from consultations. |
| 5 | Particularly when comparing remuneration schemes that provides different incentives to use fees, in addition to provide services. |
References
- The Commonwealth Fund. Country Profiles: International Health Care System Profiles [Internett]. 2020 [sitert 21. august 2024]. Tilgjengelig på: https://www.commonwealthfund.
- Brekke KR, Holmås TH, Monstad K, Straume OR. How does the type of remuneration affect physician behavior? Fixed salary versus fee-for-service. Am J Health Econ. 2020, 6, 104–38.
- Chaix-Couturier C, Durand-Zaleski I, Jolly D, Durieux P. Effects of financial incentives on medical practice: results from a systematic review of the literature and methodological issues. Int J Qual Health Care. 1. april 2000, 12, 133–42.
- Gosden T, Forland F, Kristiansen I, Sutton M, Leese B, Giuffrida A, mfl. Capitation, salary, fee-for-service and mixed systems of payment: effects on the behaviour of primary care physicians. Cochrane Effective Practice and Organisation of Care Group, redaktør. Cochrane Database Syst Rev [Internett]. 24. juli 2000 [sitert 30. mai 2023];2011(10). Tilgjengelig på:. [CrossRef]
- Brekke KR, Holmås TH, Monstad K, Straume OR. Do treatment decisions depend on physicians’ financial incentives? J Public Econ. november 2017, 155, 74–92.
- Clemens J, Gottlieb JD. Do Physicians’ Financial Incentives Affect Medical Treatment and Patient Health? Am Econ Rev. april 2014, 104, 1320–49.
- Kantarevic J, Kralj B, Weinkauf D. Income effects and physician labour supply: evidence from the threshold system in Ontario. Can J Econ Can Déconomique. 2008, 41, 1262–84.
- Van Den Berg MJ, De Bakker DH, Westert GP, Van Der Zee J, Groenewegen PP. Do list size and remuneration affect GPs’ decisions about how they provide consultations? BMC Health Serv Res. desember 2009, 9, 39.
- O’Halloran J, Oxholm AS, Pedersen LB, Gyrd-Hansen D. Going the extra mile? General practitioners’ upcoding of fees for home visits. Health Econ. 2024, 33, 197–203.
- Brunt, CS. CPT fee differentials and visit upcoding under Medicare Part B. Health Econ. 2011, 20, 831–41. [Google Scholar] [CrossRef]
- Cheng TC, Scott A, Jeon S, Kalb G, Humphreys J, Joyce C. WHAT FACTORS INFLUENCE THE EARNINGS OF GENERAL PRACTITIONERS AND MEDICAL SPECIALISTS? EVIDENCE FROM THE MEDICINE IN AUSTRALIA: BALANCING EMPLOYMENT AND LIFE SURVEY. Health Econ. november 2012, 21, 1300–17.
- Morris S, Goudie R, Sutton M, Gravelle H, Elliott R, Hole AR, mfl. Determinants of general practitioners’ wages in England. Health Econ. 2011, 20, 147–60.
- Claus G, Hove IH. Fastlegers inntekter og kostnader 2020. SSB. 2020.
- Hoff EH, Kraft KB, Østby KA, Mykletun A. Arbeidsmengde, konsultasjonstid og utilsiktede effekter av takstsystemet. Oslo: Norwegian Institute of Public Health; 2023.
- Grytten J, Sørensen R. Practice variation and physician-specific effects. J Health Econ. mai 2003, 22, 403–18.
- Brekke KR, Holmås TH, Monstad K, Straume OR. How Does the Type of Remuneration Affect Physician Behavior? Fixed Salary versus Fee-for-Service. Am J Health Econ. 2020, 6, 104–38.
- Godager G, Wiesen D. Profit or patients’ health benefit? Exploring the heterogeneity in physician altruism. J Health Econ. 1. desember 2013, 32, 1105–16.
- Brosig-Koch J, Hennig-Schmidt H, Kairies-Schwarz N, Wiesen D. The Effects of Introducing Mixed Payment Systems for Physicians: Experimental Evidence. Health Econ. 2017, 26, 243–62.
- Pedersen K, Godager G, Tyrihjell J, Værnø S, Gundersen M, Iversen T, mfl. Evaluering av handlingsplan for allmennlegetjenesten 2020-2024, Evalueringsrapport 2 [Internett]. Oslo; 2023 [sitert 1. juni 2023]. Report No.: 2. Tilgjengelig på: https://osloeconomics.no/wp-content/uploads/2023/05/HPA-evalueringsrapport-II-2023.
- Helfo - for helseaktører [Internett]. [sitert 2. april 2024]. HELFO. Tilgjengelig på: https://www.helfo.
- The Norwegian Directorate of Health. Nærmere om basistilskudd, grunntilskudd og utjamningstilskudd [Internett]. [sitert 8. oktober 2024]. Tilgjengelig på: https://www.helsedirektoratet. 2021.
- Kraft KB, Hoff EH, Nylenna M, Moe CF, Mykletun A, Østby K. Time is money: general practitioners’ reflections on the fee-for-service system. BMC Health Serv Res. 15. april 2024, 24, 472.
- Hoff EH, Kraft KB, Moe CF, Nylenna M, Østby KA, Mykletun A. The cost of saying no: general practitioners’ gatekeeping role in sickness absence certification. BMC Public Health. 12. februar 2024, 24, 439.
- Linder JA, Singer DE, Stafford RS. Association between antibiotic prescribing and visit duration in adults with upper respiratory tract infections. Clin Ther. 1. september 2003, 25, 2419–30.
- Neprash HT, Mulcahy JF, Cross DA, Gaugler JE, Golberstein E, Ganguli I. Association of Primary Care Visit Length With Potentially Inappropriate Prescribing. JAMA Health Forum. 10. mars 2023, 4, e230052.
- Hutchinson JM, Foley RN. Method of physician remuneration and rates of antibiotic prescription. Canadian Medical Association. 1999, 160, 1013–7.
- Markussen S, Røed K. The market for paid sick leave. J Health Econ. september 2017, 55, 244–61.
- Olsen, KR. Patient complexity and GPS’ income under mixed remuneration. Health Econ. 2012, 21, 619–32. [Google Scholar] [CrossRef] [PubMed]

| 2021 | Self-employed | Fixed salary | ||||
|---|---|---|---|---|---|---|
| All self-employed | Low earning GPs (1st quartile) |
Middle earning GPs (2nd and 3rd quartile) |
High earning GPs (4th quartile) | All | ||
| a. GP characteristics | ||||||
| Number of GPs | 2415 | 603 | 1208 | 604 | 131 | |
| Age (mean) | 52 | 51,5 | 51,6 | 53,3 | 48,7 | |
| Females (%) | 41 | 53 | 44 | 22 | 46 | |
| Number of list patient | 1211 | 957 | 1199 | 1488 | 853 | |
| B. List patient characteristics | ||||||
| Female patients (%) | 50 | 51 | 50 | 47 | 50 | |
| Age (%) | ||||||
| 19 or less | 24 | 25 | 24 | 22 | 23 | |
| 20-66 | 58 | 57 | 58 | 60 | 58 | |
| 67 or more | 18 | 18 | 17 | 18 | 19 | |
| c. Fee earnings | ||||||
| Fee earnings | 2 063 992 | 1 352 675 | 1 959 283 | 2 983 551 | 1 299 0191 | |
| Fee earnings per list patient | 1738 | 1488 | 1691 | 2081 | 15871 | |
| Fee information (1) | Self-employed (2) |
Fixed salary (3) | |||||||
|---|---|---|---|---|---|---|---|---|---|
| (1a) Fee name |
(1b) Fee code |
(1c) Fee claim |
(2a) All self-employed |
(2b) Low earning GPs (1st quartile) |
(2c) Middle earning GPs (2nd and 3rd quartile) |
(2d) High earning GPs (4th quartile) |
(2e) Earnings difference between high-and low earning GPs |
(2f) Percent of earnings difference attributed to the fee |
|
| Fee earnings per list patient | Fee earnings per list patient | Fee earnings per list patient | Fee earnings per list patient | Fee earnings per list patient | Percent | Earnings per list patient | |||
| Total | 1738 | 1488 | 1691 | 2081 | 593 | 100 | 1587 | ||
| E-consultation, evening | 2AEK | 307 | 39 | 13 | 28 | 87 | 74 | 12,63 | 5 |
| Specialist fee, daytime | 2DD | 99 | 273 | 241 | 272 | 308 | 67 | 11,43 | 229 |
| Consultation, daytime | 2AD | 160 | 330 | 305 | 322 | 371 | 66 | 11,26 | 297 |
| E-consultation, daytime | 2AE | 170 | 126 | 100 | 131 | 141 | 41 | 7 | 87 |
| Prolonged consultation (>20 min), daytime | 2CD | 211 | 230 | 213 | 228 | 251 | 38 | 6,48 | 192 |
| Specialist fee, evening | 2DK | 111 | 15 | 5 | 11 | 32 | 27 | 4,61 | 2 |
| Medication review | 2LD | 174 | 23 | 12 | 21 | 38 | 26 | 4,44 | 9 |
| Covid-19 vaccination, evening | 61B | 286 | 16 | 6 | 14 | 30 | 24 | 4,1 | 17 |
| Talking therapy | 615 | 170 | 28 | 18 | 28 | 40 | 22 | 3,75 | 13 |
| Simple patient contact, digital | 1BE | 65 | 37 | 30 | 38 | 43 | 13 | 2,22 | 28 |
| Test for glycated hemoglobin | 709 | 130 | 22 | 16 | 21 | 28 | 12 | 2,05 | 20 |
| Influenza vaccine | V1 | 200 | 24 | 18 | 24 | 29 | 11 | 1,88 | 20 |
| Minor surgical procedures | 100 | 119 | 19 | 16 | 18 | 25 | 9 | 1,54 | 21 |
| Conversation with relatives | 612A | 250 | 9 | 5 | 8 | 14 | 9 | 1,54 | 3 |
| Cryosurgery | 111 | 96 | 6 | 3 | 6 | 11 | 8 | 1,37 | 2 |
| Covid-19 vaccination | 61A | 220 | 17 | 15 | 15 | 23 | 8 | 1,37 | 66 |
| Electronic prescription | 1I | 55 | 59 | 56 | 59 | 63 | 7 | 1,19 | 62 |
| Conversation with guardian | 612B | 250 | 6 | 3 | 6 | 10 | 7 | 1,19 | 2 |
| Communication with physiotherapist, social welfare services etc. | 1F | 100 | 38 | 35 | 37 | 41 | 6 | 1,02 | 40 |
| Referral to psychiatric care | 616 | 300 | 10 | 7 | 10 | 13 | 6 | 1,02 | 6 |
| Laboratory test | 701A | 60 | 74 | 73 | 71 | 79 | 6 | 1,02 | 108 |
| Home visit, evening | 11AK | 634 | 4 | 2 | 3 | 7 | 5 | 0,85 | 1 |
| Home visit, for chronic illness | 11E | 505 | 6 | 4 | 5 | 9 | 5 | 0,85 | 4 |
| Collaboration meeting | 14 | 750 | 30 | 28 | 29 | 33 | 5 | 0,85 | 39 |
| Simple patient contact, phone | 1BD | 64 | 33 | 31 | 31 | 36 | 5 | 0,85 | 49 |
| Simple patient contact, phone, evening | 1BK | 79 | 4 | 2 | 3 | 7 | 5 | 0,85 | 3 |
| Consultation, evening | 2AK | 297 | 3 | 1 | 2 | 6 | 5 | 0,85 | 0 |
| Identify patients for Covid-19 vaccine | 62 | 375 | 16 | 13 | 16 | 18 | 5 | 0,85 | 6 |
| Major surgical procedures | 105 | 219 | 5 | 4 | 5 | 8 | 4 | 0,68 | 5 |
| CRP test | 705K | 42 | 9 | 8 | 9 | 12 | 4 | 0,68 | 10 |
| Microalbumin urine test | 712 | 125 | 4 | 2 | 3 | 6 | 4 | 0,68 | 3 |
| Home visit, time fee, evening | 11CK | 300 | 2 | 1 | 1 | 4 | 3 | 0,51 | 0 |
| Prolonged consultation (>20 min), evening | 2CK | 174 | 2 | 1 | 1 | 4 | 3 | 0,51 | 0 |
| Spirometry | 507C | 200 | 4 | 3 | 4 | 6 | 3 | 0,51 | 3 |
| Systematic risk assessment, per > 30 min | 6B | 750 | 2 | 1 | 2 | 4 | 3 | 0,51 | 1 |
| Electrocardiogram (ECG) | 707 | 120 | 7 | 6 | 7 | 9 | 3 | 0,51 | 7 |
| Medical certification of work | L40 | 804 | 19 | 18 | 19 | 21 | 3 | 0,51 | 17 |
| Dietary counselling | 101 | 150 | 1 | 1 | 1 | 3 | 2 | 0,34 | 1 |
| Self-employed |
Fixed salary |
||||
| All | Low earning GPs (1st quartile) | Middle earning GPs (2nd and 3rd quartile) | High earning GPs (4th quartile) | ||
| a) Frequency of procedure fees and consultations per list patient annually. Mean (SD) | |||||
| Procedure fees (in cons.) | 4.63 (1.691) | 3.89 (1.544) | 4.49 (1.383) | 5.63 (1.915) | 3.65 (1.387) |
| Consultation, daytime | 2.06 (0.615) | 1.9 (0.602) | 2.02 (0.559) | 2.32 (0.659) | 1.86 (0.507) |
| E-consultation, daytime | 0.74 (0.427) | 0.59 (0.37) | 0.77 (0.39) | 0.83 (0.507) | 0.51 (0.427) |
| E-consultation, Evening | 0.13 (0.261) | 0.04 (0.096) | 0.09 (0.167) | 0.28 (0.416) | 0.02 (0.061) |
| Sick leave certification (L1) | 0.61 (0.182) | 0.57 (0.194) | 0.61 (0.169) | 0.65 (0.185) | 0.54 (0.193) |
| Consultation with talking therapy (daytime) | 0.14 (0.139) | 0.09 (0.099) | 0.13 (0.121) | 0.2 (0.18) | 0.07 (0.108) |
| Prolonged consultation (daytime) | 1.03 (0.507) | 0.96 (0.524) | 1.01 (0.478) | 1.13 (0.532) | 0.86 (0.519) |
| b) Estimated consultation* duration in minutes. Mean (SD) | |||||
| Consultation, daytime | 17.75 (4.06) | 20.04 (3.651) | 17.79 (3.448) | 15.38 (4.246) | 20.78 (3.722) |
| E-consultation, daytime | 10.01 (3.744) | 11.83 (3.885) | 9.99 (3.248) | 8.24 (3.68) | 12.05 (4.657) |
| Consultation with sick leave certification (daytime) | 18.66 (4.411) | 21.08 (4.085) | 18.67 (3.861) | 16.2 (4.412) | 22.14 (4.586) |
| Consultation with talk therapy (daytime) | 24.28 (6.869) | 28.16 (7.839) | 24.3 (6.125) | 20.78 (5.263) | 29.84 (7.912) |
| Prolonged consultation (daytime) | 22.99 (4.347) | 25.55 (3.923) | 23.01 (3.72) | 20.39 (4.388) | (4.445) |
| c) Total estimated consultation* minutes in a year per list patient. Mean (SD) | |||||
| Consultation, daytime | 35.87 (11.686) | 37.86 (13.637) | 35.39 (10.646) | 34.82 (11.342) | 38.41 (12.823) |
| E-consultation, daytime | 7.32 (4.815) | 7.11 (5.048) | 7.73 (4.697) | 6.7 (4.74) | 6.42 (5.931) |
Disclaimer/Publisher’s Note: The statements, opinions and data contained in all publications are solely those of the individual author(s) and contributor(s) and not of MDPI and/or the editor(s). MDPI and/or the editor(s) disclaim responsibility for any injury to people or property resulting from any ideas, methods, instructions or products referred to in the content. |
© 2024 by the authors. Licensee MDPI, Basel, Switzerland. This article is an open access article distributed under the terms and conditions of the Creative Commons Attribution (CC BY) license (http://creativecommons.org/licenses/by/4.0/).


