
Submitted:
01 November 2024
Posted:
05 November 2024
You are already at the latest version
Abstract
Artificial intelligence techniques including machine learning models have shown success in variety of domains. This is more evident with complex models including deep learning. However, such success accompanied by vagueness around how the models work, the internal mechanism and making a decision. Explainable Artificial intelligence (XAI) emerged as a new field of research to uncover the mystery around how the complex models work. The ultimate aim of XAI is to make the complex models more transparent, trustworthy and understandable even by lay-persons with no technical background. XAI could come in different forms including heatmaps applied to images, significant concepts to the model when making a decision, informative features with tabular data, one-feature effect on the outcome, fuzzy logic rules, textual explanation through images captioning, uncertainty quantification and much more. There are several factors affect the XAI forms including the used data and the model. This paper is dedicated to review and group the current XAI methods in the literature based on the outcome form. In addition, the paper discusses the XAI groups, how they work, strengths and weaknesses. Our paper shows that although e XAI methods have been used extensively within the research context, their employability in real life problems especially in sensitive domains might be unreasonable in the current stage.
Keywords:
Machine learning
; explainable artificial intelligence
; XAI forms
1. Introduction
Although artificial intelligence (AI) have been used extensively and shown massive success in most of the domains, their deployment in sensitive domains is limited. One of the biggest reason that slows down adopting AI systems is lack of trust. Advanced models which they proved to perform very well and predict the outcome more accurately, they are not understandable and it is not clear how the model works or how the input were transferred to the output. This necessitate to emerge new types of models that aim to explain the complex models or make the complex models interpretable in their design [1].
eXplainable artificial intelligence (XAI) are sets of algorithms and tools aiming to explain how machine learning models including deep learning reach a specific outcome and the rationale behind their decision. Moreover, XAI are employed to reveal whether the model is fair or not against minor groups, bias detection, build a responsible and accountable AI, and allow end-users feel more confident with the AI systems. Their ultimate aim is to increase the transparency of the models, trust AI systems and convert the outcome of complex AI models into a more understandable form from human point of view [2].
XAI could come in different forms including heatmaps applied to images data which show which regions affected the prediction of the model. Moreover, it might come as a list of informative features with tabular data, fuzzy rules, concepts that are significant to the model outcome and uncertainty estimate through confidence interval or prediction interval. There are two reasons why there are so many forms of XAI. The first reason is that there is no a standard agreed definition what does XAI mean, represent, what should cover or how it should look like. The second reason is that XAI form depends on the used data and model. For instance, XAI based on heatmaps or concepts are applied with complex models using images or signals as input. On the other hands, list of informative features and fuzzy rules are applied to classical machine learning models with tabular data [3].
Other factors might affect the form of the XAI is that whether it is model-agnostics or model-specific. Model-agnostic means that the XAI can be applied to any AI model while model-specific indicates that it can be applied to a specific model or specific group of models. Moreover, another factor effects the form of the XAI is whether the XAI has the ability to explain the model globally for all instances in the model or locally for a specific instance. Finally, the domain also might have a significant impact on the final form of the XAI.
There have been many papers and reviews to discuss what is XAI, their methods, performance and how they work. However, there is no one paper that groups and discusses the forms of the XAI from an end-user point of view. The current paper aims to list the current forms of XAI in the literature and group them according to their forms. The paper does not discuss or group them based on how they work, it rather group and discuss them based on how they look like to the end users as the final outcome of an AI system. Moreover, the paper discusses the rationale behind each group and their aims. Finally, the paper discusses some open issues and research direction.
2. Current XAI approaches
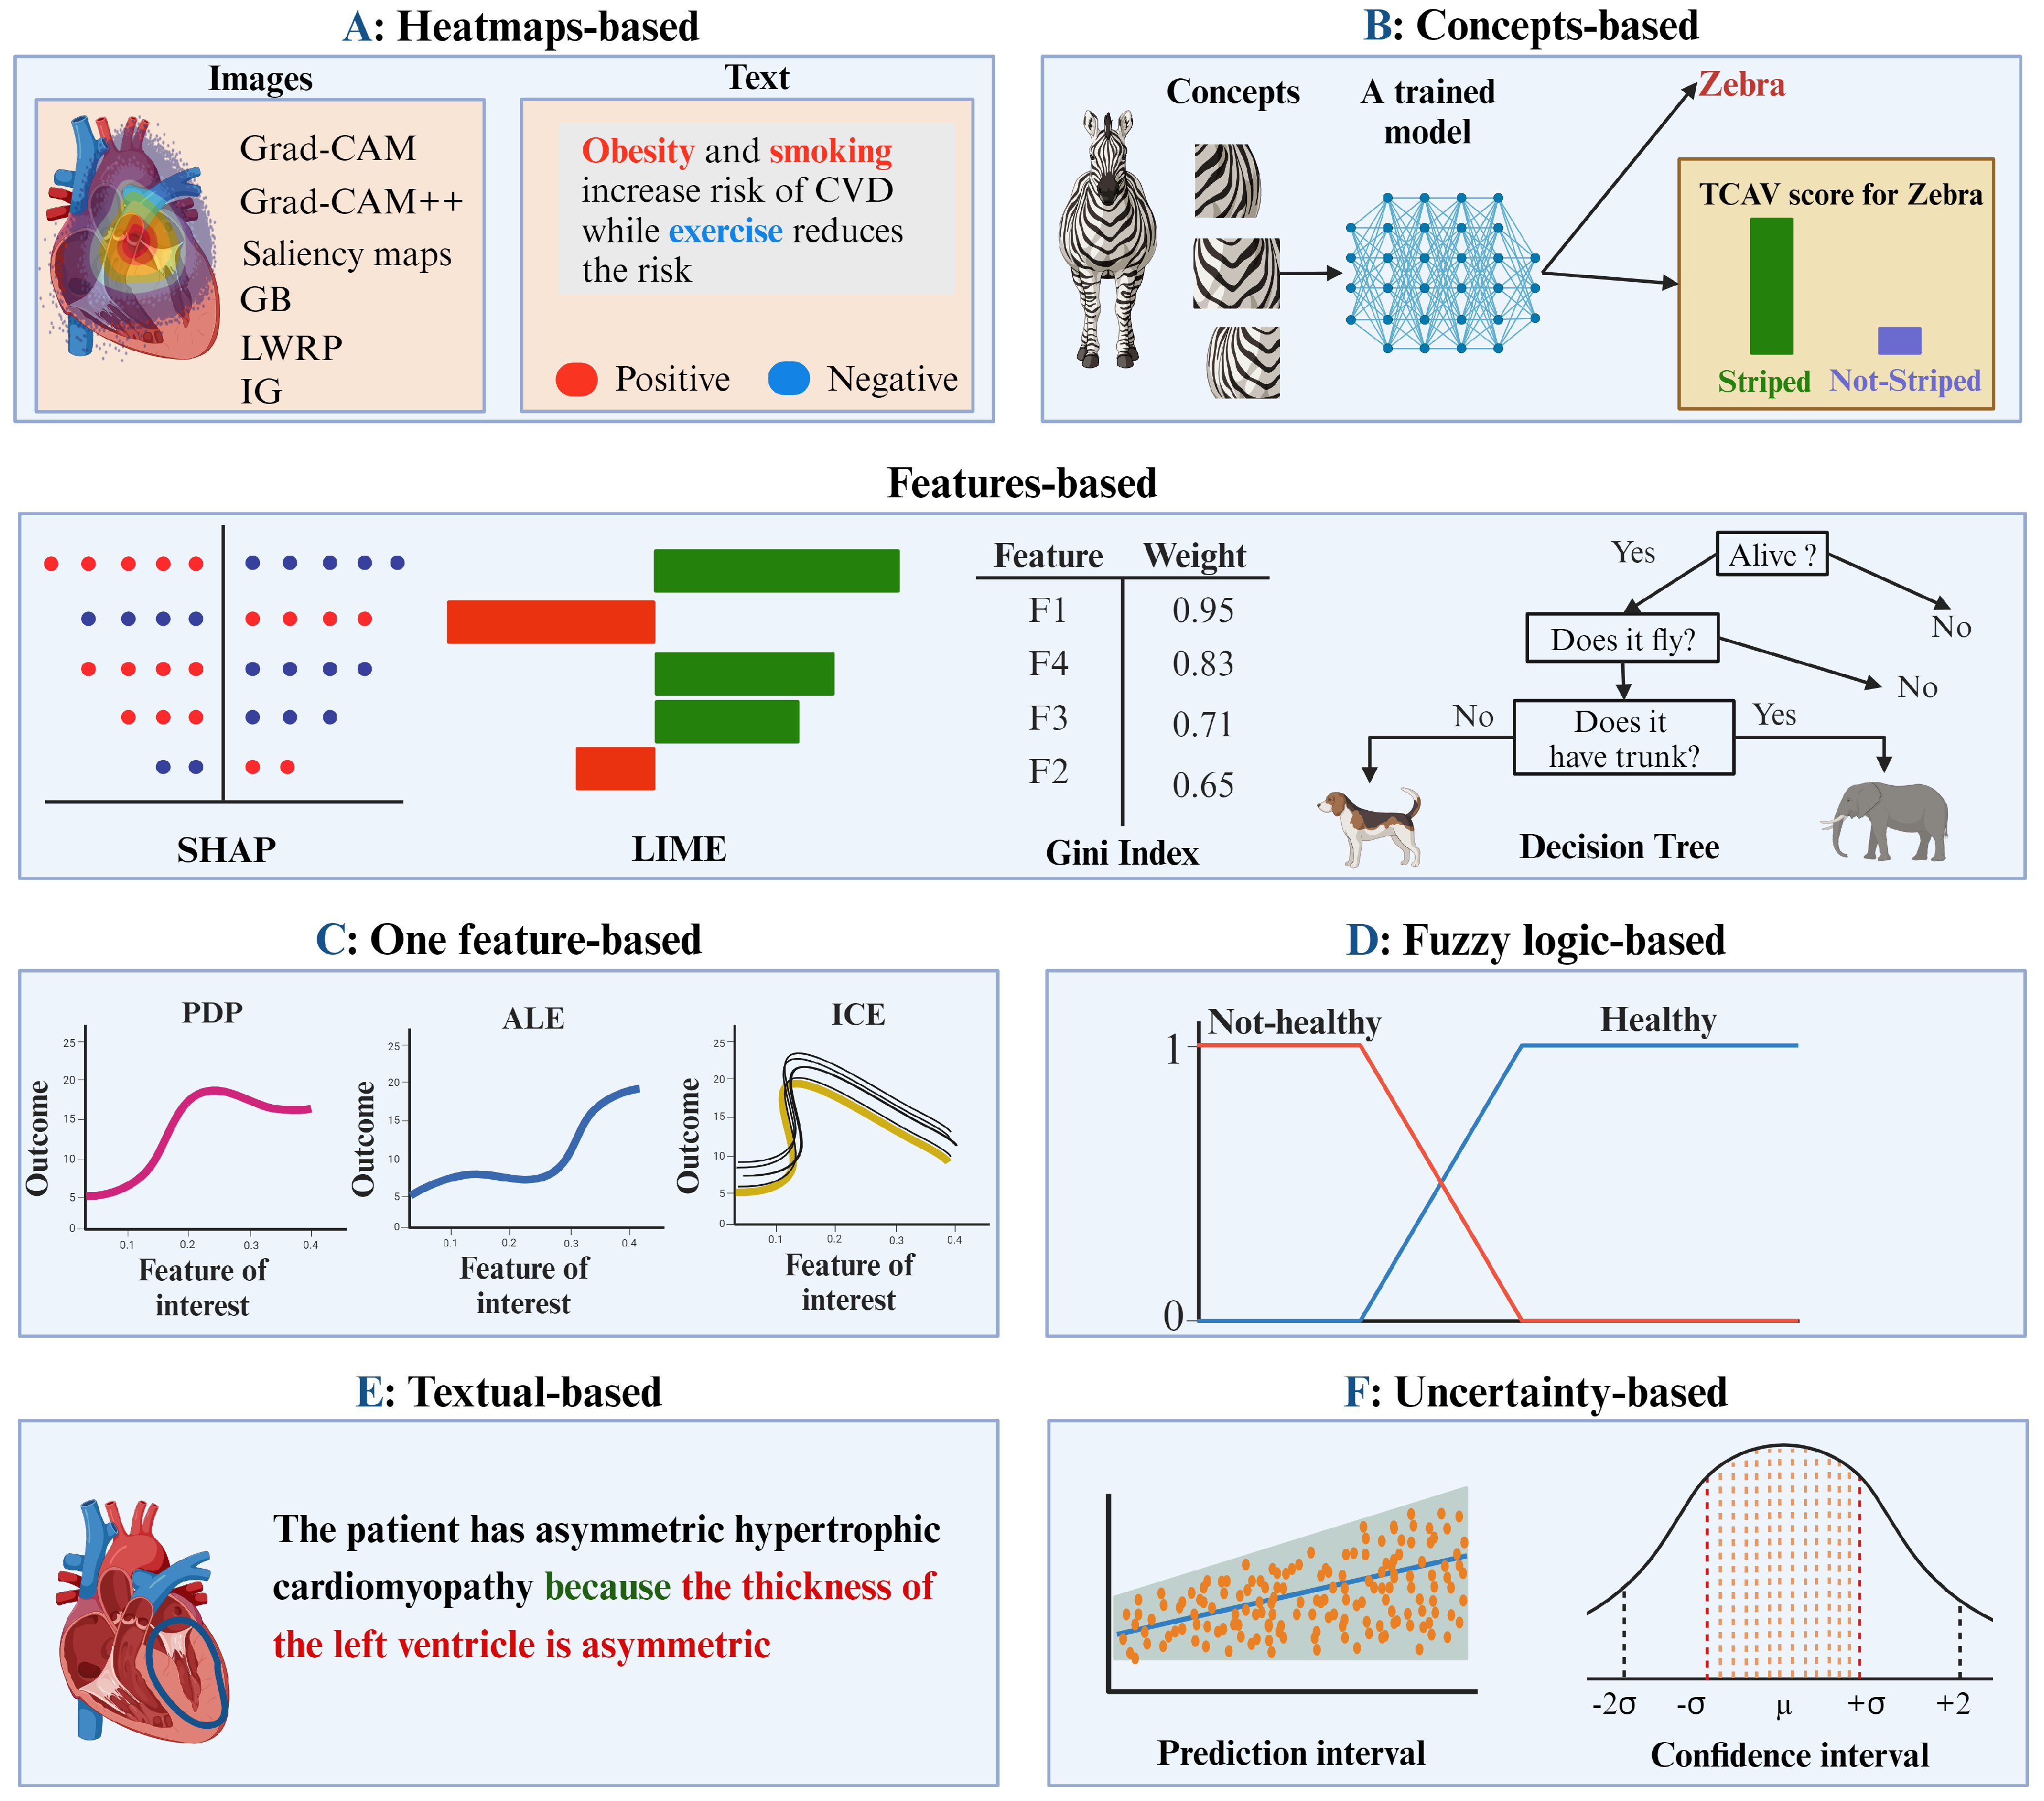
It is somehow difficult to group the current XAI outcomes due to the variation in the used model, the type of the data and whether the XAI is intrinsic or post-hoc. However, we tried to group them based on the XAI form that is generated for the end-users. Figure 1 lists the current XAI forms that are heatmaps-based, concepts-based, features-based, one feature-based, fuzzy logic-based, textual-based and uncertainty-based. For some of these XAI forms (e.g., heatmaps-based), we included some common XAI methods for that group but it is not comprehensive because this is out of the scope of the current paper. In addition, the figure shows what the form looks like and what does represent. Subsections are dedicated for each from to discuss and explain each group.
2.1. Heatmaps-based explanation
Heatmap-based explanation are type of explanation applied to images (e.g.,magnetic resonance imaging, X-ray and ultrasound) [4] or signals such as electrocardiogram (ECG) [5]. It highlights the region within an image which show the most influential pixels (voxels) in the images that affect model decision. In other words, it is the spatial support for a specific class in an image in the model. The heatmap is usually represented as a spot of spectrum of colors where the red color in the center represents the most significant region while the color on the edges of the heatmap is represented in blue color which indicates less impact regions compared to the center of the heatmap. This kind of forms is usually generated when complex models including convolutional neural network are applied. Moreover, this kind of explanation is implemented with natural language processing because complex models are usually used to either generate a text, perform classification tasks or machine translation using text data as input. In this situation, XAI identifies the key-words in the text that either contribute positively or negatively to the model outcome [6].
There have been many methods developed and proposed to interpret complex models using heatmap-based explanation. Figure 1A shows some of the common XAI methods including Saliency maps [7], Class Activation Mapping [8], Gradient-weighted Class Activation Mapping (Grad-CAM) [9], Grad-CAM++ [10], Guided backpropagation [11], Integrated gradients [12] and Layer-wise relevance propagation [13]. This approach of explanation has been used extensively with medical images. However, the heatmap does not tell or report to the end-user what is the difference or the variation in the highlighted region compared to a control which made the model to use it in the decision making process.
2.2. Concept-based explanation
Testing with Concept Activation Vectors (TCAV) [14] based explanation is another kind of explanation that aims to make the explanation as easy as possible in a way that anyone can understand the XAI outcome even without strong background in AI. It aims to explain complex models based on concepts and where a specific concept (e.g, gender or ethnicity) is significant to the model or not when making the decision. Another positive point of the approach is that the model does not need to be re-trained every time when the user is interested in a new or a specific concept. Figure 1B shows an example of how concepts might be used with this kind of explanation. The figure shows that there is a pre-trained model to classify pictures into Zebra vs non-Zebra. Thereafter, the user is keen to know if a specific concept has an impact on the classification model or not. In this case, the user defined the strip as the concept of interest. Thereafter, the user has to feed the pre-trained model pictures of the concept (strip) alongside other random pictures to examine the impact of the strip on the model. The final outcome is to give score to the concept (striped vs not-striped) which show if it is significant to the model or not. TCAV then was extended to consider causal concept [15].
TCAV was proposed and implemented primarily for images, sequential and graph-structured data. However, concept-based explanation is extended recently to include tabular data with neural networks [16]. Tabular Concept Bottleneck Models (TabCBMs) was proposed to explain tabular data based on concepts. Moreover, TabCBMs has the ability to explain the model when the concepts are defined (concept-supervised) or when the annotation of the concepts is missing (concept-unsupervised). Moreover, their definition of the concepts in tabular data is inspired by the multicollinearity among the features. One possible limitation with CAV is that the model might learn meaningless concepts yet they are significant in the model [14].
2.3. Informative features-based explanation
This kind of explanation is usually applied with classical machine learning models and tabular data. It generates a list of informative features in a descending order based on their impacts on the model outcome being the top one is the one with the highest impact. In addition, the features might be coded into colors which represent whether the association of that feature is positive or negative with the outcome. Moreover, the features might be represented in colors which show their contribution in each class when they are applied to classification models. Each one of these methods follow different steps, criterion and algorithms to reveal the contribution of the features on the model outcome. The vast majority of them explain the model globally for all samples while other methods explain the model locally for a specific instance in the model. The most common XAI methods for this kind of explanation are SHapley Additive exPlanations (SHAP) [17] and Local Interpretable Model-Agnostic Explanations (LIME) [18]. Other classical machine learning models have the ability to generate such list including Random forest [19] through Gini index [20].
Although, these methods were mainly designed to show the impact of the features on the model outcome and for the purpose of explanation, many researchers are using them as feature selection methods by excluding those with less impact on the model output. One possible issue with this kind of explanation is that many XAI methods do not report the effect size in the raw unit or does not consider the intersection between the features when reporting the effect size. Such issue might generate either a meaningless or biased explanation.
2.4. One feature-based explanation
One feature-based explanation aims to explain one feature in the model and how it is associated with the outcome. Their aim is to reveal whether the association between the feature of interest with the outcome is linear, monotonic or more complex. Partial Dependence Plot (PDP) [21], Accumulated Local Effects (ALE) [22] and Individual conditional expectation (ICE) plot [23] are most common methods applied to tabular data and aim to explain the features in the model.
PDP shows the marginal effect of one feature on the outcome by fixing or considering other features in the model as random variables. PDP considers that the feature of interest is independent from the rest of the features in the model. Accordingly, if the features are not independent, the PDP plot might be biased or does not reflect the actual affect. ICE on the other hand plots the effect of a feature on the outcome for each instance in the model with one line per sample. It shows how the changes in the feature of interest affects the outcome at individual level. In away, both PDP and ICE are similar to the coefficient value in a linear regression model but PDP provides an average effect while ICE calculates it at individual level. Although this type of XAI easy to understand and plot in the raw unit to reveal the impact of one feature on the outcome, the multicollinearity might not be considered and represented correctly.
2.5. Fuzzy logic-based explanation
Fuzzy logic (FL) is another method got much attention recently as a way to interpret and explain machine learning models especially the advanced complex. It tries to mimic how human think and make approximate decision rather than presenting how brain works and provide precise estimates [24]. FL uses linguistics to define variables that seem unclear and more into a gray area than white and black. Then, it uses IF-THEN rules to make the decision and give a state as membership degree in each class. For example, "an individual might decide IF the temperature is 6 Celsius, wind speed 25 KM per hour and humidity 60%, THEN, will wear the brown coat". Using FL, the process to make the decision will be more fuzzy using imprecise linguistic variables. The sentence will be re-written as "IF it is cold, windy and the humidity is moderated, THEN, will wear the brown coat" [25]. Accordingly, the words "cold", "windy" and "moderated" will be interpreted differently by each individual. Although the words are with vague labels, yet human use them to communicate and make decision without accompany them with precise numerical values.
One possible way to make these linguistics variables clearer is by setting an agreed threshold by most people. For example, temperature up to 10 Celsius would be agreed as cold and beyond 10 would be considered as moderate. However, even with such agreement, it is difficult to set boundaries between the labels. This is because which label we might assign to a temperature 10.1 Celsius? is it cold or moderate?. Instead of such restricted boundaries, fuzzy rules might be employed in a way that each value might be belong to more than one case (cold vs moderate) by given a degree of membership for each case. This will then bring the fuzzy rules and the IF-THEN statement to present the information in a way that is understandable by lay persons because they are comprehensible and intuitive [26]. For this favorable property, FA rules has been used as XAI method in diseases prediction including cardiac arrhythmia, seizures and epilepsy [24].
2.6. Textual-based explanation
Inspired by machine translation, textual-based explanation is kind of explanation which provides or generates a text automatically in a form of a report describing an image or a video to explain. The text description might be simple or more complicated as a medical report. Such report helps to understand how and why the model made the decision and the rationale behind it based on the visual exam of the image or the video. This kind of explanation might be divided into two categories that are: captioning the image and captioning the image with visual explanation [27]. The first type can be divided into retrieval-based, template-based, and generation-based approaches. Retrieval-based and template-based do not generate the text from scratch, they rather generate responses from already existing information knowledge or answers from a database. Moreover, they have proved to generate text that are grammatically correct but their ability is limited to report new or novel concepts or findings. On the other hand, generation-based approaches got more attention because it supports novel concepts and findings [28].
Captioning the image with visual explanation is similar to captioning the image but with visual representation. It might include a heatmap applied to an image to show the region that the caption describes. Textual-based explanation usually combines two models that are a convolutional neural network (CNN) and a recurrent neural network (RNN) model. CNN passes an mage through a pre-trained model to extract features and then use the extracted features in the RNN model to caption the image. This kind of approach might be more align with how human accept or reject a decision because it justifies the decision visually and with a text report.
2.7. Uncertainty-based explanation
Uncertainty estimate is one of the most desirable component of any machine learning model especially the complex one because they are over-trusted due to their high performance. It measures to what extend the model is confident toward the prediction. It could be measured and represented as prediction or confidence intervals [29]. Prediction interval estimates the range of values for data points for a given population while confidence interval estimates the mean or the standard deviation of a sample. Moreover, prediction interval uses the current data point to predict future event while confidence interval uses the past in the estimation. It is usually prediction interval wider than the confidence interval. In the case of the confidence interval, the wider the interval the higher the uncertainty [30].
Uncertainty and XAI are usually separated because they aim different objectives where the first one shows to what extend the model is confident toward the prediction while the second one explains how the model reached to the outcome. However, both methods aim a very significant objective which is whether to trust a model or not [31]. Accordingly, uncertainty could become one of the main element of XAI especially a formal standard agreed definition of what is XAI is still missing in the literature. One possible obstacle with uncertainty as an aim to explain a model is the boundaries or the threshold to use in order to identify models with higher certainty from those with lower certainty.
3. Discussion and future direction
In summary, XAI could come in different forms and each has its own strengths and limitations. There are several factors affect how the XAI would look like including the used data and the applied model. The literature is rich in many papers that employed variety of XAI methods with different data and models. However, we think that adopting the current XAI methods in real-life problems especially in sensitive domains is far from the reality. This is because the vast majority of the XAI methods were designed mainly and solely by technical people without considering or including the end-users which is the main target. Moreover, the current XAI methods were built within the research context and might not be possible to extend and adopt them in real-life problems because they were not designed for this purpose. Below our comments on the current XAI methods:
- Heatmaps-based explanation is useful but it is abstract and dose not provide justification why a specific region was highlighted.
- Concept-based explanation seems reasonable and more close to how human think. But, the method might learn and consider meaningless concepts that are irrelevant to the domain. Accordingly, the concepts need to be identified and defined by the experts in the domain prior applying the method.
- Informative features-based explanation is useful in the research context but cannot be considered in some sensitive domain such as healthcare where the effect size in the original unit is preferred and considering the intersections between the features.
- One feature-based explanation does not capture the whole picture of how the input data might simultaneously affect each other and the outcome.
- Fuzzy logic-based explanation are more close to human thinking and reasoning to predict based on approximation rather than on precise measure. However, this kind of system or explanation need extensive test and validation before considering the results and make a decision to avoid inaccurate results.
- Textual-based explanation might be the promising approach to adopt in the future because it justifies the decision made by the model. However, report analysis through textual explanation might be subjective because different people might come with different conclusion for the same text.
- Uncertainty evaluation is domain-dependent as how wide the confidence interval to consider it with high certainty depends on the domain and the cost of mistake.
Acknowledgments
AMS acknowledges support from The Leicester City Football Club (LCFC). All figures are generated by Biorender (https://www.biorender.com).
References
- Bharati, S.; Mondal, M.R.H.; Podder, P. A review on explainable artificial intelligence for healthcare: why, how, and when? IEEE Transactions on Artificial Intelligence 2023. [Google Scholar] [CrossRef]
- Salih, A.M.; Galazzo, I.B.; Gkontra, P.; Rauseo, E.; Lee, A.M.; Lekadir, K.; Radeva, P.; Petersen, S.E.; Menegaz, G. A review of evaluation approaches for explainable AI with applications in cardiology. Artificial Intelligence Review 2024, 57, 240. [Google Scholar] [CrossRef] [PubMed]
- Bennetot, A.; Donadello, I.; El Qadi El Haouari, A.; Dragoni, M.; Frossard, T.; Wagner, B.; Sarranti, A.; Tulli, S.; Trocan, M.; Chatila, R.; others. A practical tutorial on explainable AI techniques. ACM Computing Surveys 2021. [Google Scholar] [CrossRef]
- Salih, A.; Boscolo Galazzo, I.; Gkontra, P.; Lee, A.M.; Lekadir, K.; Raisi-Estabragh, Z.; Petersen, S.E. Explainable artificial intelligence and cardiac imaging: toward more interpretable models. Circulation: Cardiovascular Imaging 2023, 16, e014519. [Google Scholar] [CrossRef] [PubMed]
- Rahman, T.; Akinbi, A.; Chowdhury, M.E.; Rashid, T.A.; Şengür, A.; Khandakar, A.; Islam, K.R.; Ismael, A.M. COV-ECGNET: COVID-19 detection using ECG trace images with deep convolutional neural network. Health Information Science and Systems 2022, 10, 1. [Google Scholar] [CrossRef]
- Xu, Q.; Feng, Z.; Gong, C.; Wu, X.; Zhao, H.; Ye, Z.; Li, Z.; Wei, C. Applications of explainable ai in natural language processing. Global Academic Frontiers 2024, 2, 51–64. [Google Scholar]
- Simonyan, K. Deep inside convolutional networks: Visualising image classification models and saliency maps. arXiv preprint arXiv:1312.6034 2013. [Google Scholar]
- Zhou, B.; Khosla, A.; Lapedriza, A.; Oliva, A.; Torralba, A. Learning deep features for discriminative localization. Proceedings of the IEEE conference on computer vision and pattern recognition, 2016, pp. 2921–2929.
- Selvaraju, R.R.; Cogswell, M.; Das, A.; Vedantam, R.; Parikh, D.; Batra, D. Grad-cam: Visual explanations from deep networks via gradient-based localization. Proceedings of the IEEE international conference on computer vision, 2017, pp. 618–626.
- Chattopadhay, A.; Sarkar, A.; Howlader, P.; Balasubramanian, V.N. Grad-cam++: Generalized gradient-based visual explanations for deep convolutional networks. 2018 IEEE winter conference on applications of computer vision (WACV). IEEE, 2018, pp. 839–847.
- Springenberg, J.T.; Dosovitskiy, A.; Brox, T.; Riedmiller, M. Striving for simplicity: The all convolutional net. arXiv preprint arXiv:1412.6806 2014. [Google Scholar]
- Sundararajan, M.; Taly, A.; Yan, Q. Axiomatic attribution for deep networks. International conference on machine learning. PMLR, 2017, pp. 3319–3328.
- Bach, S.; Binder, A.; Montavon, G.; Klauschen, F.; Müller, K.R.; Samek, W. On pixel-wise explanations for non-linear classifier decisions by layer-wise relevance propagation. PloS one 2015, 10, e0130140. [Google Scholar] [CrossRef]
- Kim, B.; Wattenberg, M.; Gilmer, J.; Cai, C.; Wexler, J.; Viegas, F.; others. Interpretability beyond feature attribution: Quantitative testing with concept activation vectors (tcav). International conference on machine learning. PMLR, 2018, pp. 2668–2677.
- Goyal, Y.; Feder, A.; Shalit, U.; Kim, B. Explaining classifiers with causal concept effect (cace). arXiv preprint arXiv:1907.07165 2019. [Google Scholar]
- Zarlenga, M.E.; Shams, Z.; Nelson, M.E.; Kim, B.; Jamnik, M. Tabcbm: Concept-based interpretable neural networks for tabular data. Transactions on Machine Learning Research 2023. [Google Scholar]
- Lundberg, S. A unified approach to interpreting model predictions. arXiv preprint arXiv:1705.07874 2017. [Google Scholar]
- Ribeiro, M.T.; Singh, S.; Guestrin, C. " Why should i trust you?" Explaining the predictions of any classifier. Proceedings of the 22nd ACM SIGKDD international conference on knowledge discovery and data mining, 2016, pp. 1135–1144.
- Breiman, L. Random forests. Machine learning 2001, 45, 5–32. [Google Scholar] [CrossRef]
- Lorenz, M.O. Methods of measuring the concentration of wealth. Publications of the American statistical association 1905, 9, 209–219. [Google Scholar] [CrossRef]
- Greenwell, B.M.; Boehmke, B.C.; McCarthy, A.J. A simple and effective model-based variable importance measure. arXiv preprint arXiv:1805.04755 2018. [Google Scholar]
- Apley, D.W.; Zhu, J. Visualizing the effects of predictor variables in black box supervised learning models. Journal of the Royal Statistical Society Series B: Statistical Methodology 2020, 82, 1059–1086. [Google Scholar] [CrossRef]
- Christoph, M. Interpretable machine learning: A guide for making black box models explainable; Leanpub, 2020.
- Cao, J.; Zhou, T.; Zhi, S.; Lam, S.; Ren, G.; Zhang, Y.; Wang, Y.; Dong, Y.; Cai, J. Fuzzy inference system with interpretable fuzzy rules: Advancing explainable artificial intelligence for disease diagnosis—A comprehensive review. Information Sciences 2024, 662, 120212. [Google Scholar] [CrossRef]
- Fumanal-Idocin, J.; Andreu-Perez, J. Ex-Fuzzy: A library for symbolic explainable AI through fuzzy logic programming. Neurocomputing 2024, p. 128048.
- Chimatapu, R.; Hagras, H.; Starkey, A.; Owusu, G. Explainable AI and fuzzy logic systems. Theory and Practice of Natural Computing: 7th International Conference, TPNC 2018, Dublin, Ireland, December 12–14, 2018, Proceedings 7. Springer, 2018, pp. 3–20.
- Van der Velden, B.H.; Kuijf, H.J.; Gilhuijs, K.G.; Viergever, M.A. Explainable artificial intelligence (XAI) in deep learning-based medical image analysis. Medical Image Analysis 2022, 79, 102470. [Google Scholar] [CrossRef]
- Singh, S.; Karimi, S.; Ho-Shon, K.; Hamey, L. From chest x-rays to radiology reports: a multimodal machine learning approach. 2019 Digital Image Computing: Techniques and Applications (DICTA). IEEE, 2019, pp. 1–8.
- Sluijterman, L.; Cator, E.; Heskes, T. How to evaluate uncertainty estimates in machine learning for regression? Neural Networks 2024, 173, 106203. [Google Scholar] [CrossRef]
- Shimizu, K.; Yamada, T.; Yamada, T.J. Uncertainty evaluation in hydrological frequency analysis based on confidence interval and prediction interval. Water 2020, 12, 2554. [Google Scholar] [CrossRef]
- Thuy, A.; Benoit, D.F. Explainability through uncertainty: Trustworthy decision-making with neural networks. European Journal of Operational Research 2024, 317, 330–340. [Google Scholar] [CrossRef]
Figure 1.
eXplainable artificial intelligence forms. Grad-CAM: gradient-weighted class activation mapping; GB: guided backpropagation; IG: integrated gradients; LWRP: layer-wise relevance propagation; TCAV: testing with concept activation vectors; SHAP: SHapley Additive exPlanations; LIME: local interpretable model-agnostic explanations; PDP: partial dependence plot; ALE: accumulated local effects; ICE: individual conditional expectation.
Disclaimer/Publisher’s Note: The statements, opinions and data contained in all publications are solely those of the individual author(s) and contributor(s) and not of MDPI and/or the editor(s). MDPI and/or the editor(s) disclaim responsibility for any injury to people or property resulting from any ideas, methods, instructions or products referred to in the content. |
© 2024 by the authors. Licensee MDPI, Basel, Switzerland. This article is an open access article distributed under the terms and conditions of the Creative Commons Attribution (CC BY) license (http://creativecommons.org/licenses/by/4.0/).
Copyright: This open access article is published under a Creative Commons CC BY 4.0 license, which permit the free download, distribution, and reuse, provided that the author and preprint are cited in any reuse.


