Submitted:
31 October 2024
Posted:
04 November 2024
You are already at the latest version
Abstract
It is established that BCG vaccination results in the development of both a specific immune response to mycobacterial infections and a nonspecific (heterologous) immune response, designated as trained immunity (TRIM), to other pathogens. We hypothesized that local BCG immunization may induce early immune response of bone marrow and spleen innate immunity cells. The early transcriptomic response of various populations of innate immune cells, including monocytes, neutrophils, and natural killer (NK) cells, to BCG vaccination was examined. To this end, C57Bl/6J mice were subcutaneously immunized with 10⁶ CFU of BCG. Three days following BCG administration, the three cell populations were collected from the control and BCG-vaccinated groups by FACS. All cell populations obtained were utilized for the preparation and sequencing of RNA-seq libraries. The analysis of FACS data revealed an increase in the proportion of splenic NK cells and monocytes 3 days post-vaccination. Transcriptomic analysis revealed deregulation of genes associated with regulation of immune response (according to Gene Ontology terms) in NK cells, monocytes, and unsorted bone marrow. Two NK cell-specific immune ligands (Tnfsf14 and S100a8) and two bone marrow-specific immune receptors (C5ar1 and Csf2rb) were identified among differentially expressed genes. No alterations were identified in neutrophils in either the percentage or at the transcriptomic level. Thus, in this study we demonstrated that BCG vaccination provides the early increase in the proportion of murine bone marrow and spleen immune cell populations, as well as the transcriptomic alterations in monocytes, NK cells, and non-sorted bone marrow. This early innate immune response may be beneficial for enhancing TRIM.
Keywords:
trained immunity
; BCG
; innate immunity
; vaccination
; transcriptome
; RNA-seq
1. Introduction
Epidemiological studies have demonstrated that BCG vaccination significantly reduces infant mortality, which cannot be solely explained by a decrease in tuberculosis incidence [1]. The capacity of BCG vaccination to provide nonspecific (heterologous) protection against respiratory infections was substantiated by randomized clinical trials in adults [2,3,4]. These and other data indicated that innate immunity and relevant cells, such as monocytes, are involved in this protection [5,6]. The long-lasting functional changes in monocytes are linked to transcriptional, epigenetic, and metabolic reprogramming of innate immune myeloid cell precursors in individuals vaccinated with BCG [7] and represent what has been termed "trained immunity" (TRIM). There is evidence that TRIM is at least partially responsible for how BCG vaccination confers protection against viral infections [8,9,10].
TRIM results in enhanced responsiveness of immune cells to secondary stimuli, providing protection against reinfection in a T/B-cell-independent manner [11]. It is orchestrated by distinct signaling pathways, metabolic alterations, and epigenetic rewriting in both circulating myeloid cells and bone marrow progenitors [10]. In the case of BCG, there is also evidence that TRIM can be developed through NK cells [12].
In the process of TRIM development, the alterations in intracellular metabolite levels determine the activity of histone modification enzymes. In particular, significant alterations occur in glycolysis, oxidative phosphorylation (OXPHOS), the tricarboxylic acid cycle (TCA cycle), and lipid metabolism systems, leading to alterations in the metabolite levels and subsequent epigenetic alterations. The induction of trained immunity is also influenced by DNA methylation in innate immune cells. It has been demonstrated that individuals vaccinated with BCG and who have successfully developed trained immunity exhibit a noticeable reduction in DNA methylation in promoters of the genes the function of which is associated with immunity, when compared to non-susceptible individuals [13]. This particular epigenetic change indicates the activation of immunity-related gene expression. Thus, metabolic and epigenetic processes involved in the development of trained immunity are closely interrelated. BCG-induced TRIM directly impacts the adaptive immune response. For example, BCG-trained monocytes produce pro-inflammatory mediators such as TNF, IL-1β, and IL-6, exhibit increased expression of MHC-II and costimulatory molecules (CD80/CD86), and elevated aerobic glycolysis levels [14,15]. Increased expression of these proteins results in altered T cell plasticity. For example, the balance between Th1 and Th2 phenotypes may be shifted towards cytotoxic Th1 response, and the balance between Treg and Th17 phenotypes – towards activation of inflammatory reactions via Th17. At the same time, the enhanced production of IFN-γ by Th1 cells and IL-17 by Th17 cells may mutually influence the function of innate immune cells. The mutual interaction between trained and adaptive immunity is also supported by the study [16], which showed that BCG vaccination prevents antibody-dependent enhancement of infection following vaccination against respiratory syncytial virus (RSV) through induced trained immunity and T-cell alterations. In contrast to the RSV vaccine alone, which promotes macrophage tolerance and suppresses their functions upon secondary pathogen stimulation, the combination of RSV vaccination with BCG prevents this tolerance by creating trained macrophages that can rapidly reactivate in response to subsequent stimuli [16]. IFN-γ-dependent induction of trained immunity in tissue-resident macrophages has also been demonstrated [15] The administration of BCG as a priming booster prior to acellular pertussis vaccine vaccination in a sample of healthy volunteers in a randomized clinical trial [17] demonstrated that BCG-induced trained immunity enhances production of pertussis-specific antibodies, Th1 responses to pertussis, and general memory B-cell response two weeks post-immunization. This observation positively correlated with an increase in the production of trained immunity biomarkers, including IL-1β and IL-6, thereby confirming the modulation of both trained and adaptive immunity. Therefore, BCG induces lasting changes in the immune system, which are linked to the heterologous response to infections, both at the level of innate trained immunity and in terms of heterologous responses of the adaptive immune system [18].
However, the duration of TRIM, as well as the time required for TRIM development, remains unclear. According to some data, TRIM can last for several months to over a year due to the presence of long-lived trained macrophages and/or myeloid precursors in the bone marrow [19]. In the case of listeriosis, TRIM can persist for extended periods, with studies showing protection up to 9 weeks post-training [20]. It was also shown that BCG vaccination induces long-lasting effects on both TRIM and heterologous Th1/Th17 immune responses, lasting up to 1 year [21]. TRIM induced by β-glucan one week before infection confers prolonged protection against lethal Listeria monocytogenes infection [20]. It is noteworthy that TRIM is particularly significant in newborns and infants, whose adaptive immunity is still developing [22]. For a deeper understanding of the mechanisms ultimately leading to TRIM, it is also important to identify the initial molecular and cellular events that trigger the reprogramming of innate immune cells. In this study, we aimed to evaluate the early response of innate immunity cells to subcutaneous BCG vaccination. To this end, we have vaccinated healthy C57Bl/6J mice with either BCG or phosphate buffer saline (as a control), and analyzed the immune cell composition of the bone marrow and spleen, as well as the transcriptomic changes in neutrophils, monocytes and NK cells. The findings obtained within our study can provide deeper insight into the mechanisms underlying the development of trained immunity.
2. Materials and Methods
2.1. Animals and Vaccination Procedure
C57Bl/6JCit mice (female, 6–8-weeks old, hereinafter referred to as C57Bl/6J) were used throughout the study. C57BL/6J mice were bred and maintained under conventional conditions with water and food provided ad libitum at the Animal Facilities of the Central Tuberculosis Research Institute (Moscow, Russia), according to the guidelines of the Russian Ministry of Health, National Institutes of Health Office of Laboratory Animal Welfare (OLAW). The studies using mice were reviewed and approved by the Animal Care and Use Committee of the Central Institute for Tuberculosis, Moscow, Russia (protocol 1 from 03 March 2022). All animal manipulations were performed according to the recommendations of the European Convention for the Protection of Vertebrate Animals Used for Experimental and Other Scientific Purposes, Council of Europe (ETS 123).
Mycobacterium bovis/BCG culture (Medgamal, Russia) was used for vaccination of animals. Two weeks prior to administration to experimental animals, BCG were cultivated in Middlebrook 7H9 Broth (Millipore Sigma, UK) liquid medium with Middlebrook ADC Growth Supplement (HiMedia Laboratories Pvt. Limited, India) in an incubator at 37°C. To determine the concentration of mycobacteria in the culture, a series of fivefold dilutions of the suspension was applied as 20 µl drops to Petri dishes with Dubos agar (Dubos, Difco, USA). After the drops dried, the petri dishes were covered and incubated at 37°C. After 3-4 days of incubation, cultures were microscopically examined at x20 magnification in an inverted microscope, the smallest dilution with non-adherent BCG microcolonies was selected, and at least 500 microcolonies were counted with a total area of counted fields of view ≥ 5% of the total area of the dried drop. The concentration of mycobacteria in the filtrate was expressed as number of colony-forming units per ml (CFU/ml) and calculated using the following formula: CFU/ml = N×(D2/d2/n)×(1000/V)× F. In this equation, N is the number of counted microcolonies in all fields of view, D is the diameter of the dried dilution drop in mm, d is the diameter of the field of view in mm, n is the number of fields of view, V is the initial drop volume in µl, and F is the dilution factor. After determination of mycobacterial concentration, BCG cultures were resuspended in PBS at a concentration of 107 CFU/ml.
Mice were subcutaneously vaccinated with 106 CFU of Mycobacterium bovis/BCG in 100 µl of phosphate-buffered saline (PBS), mice in the control group were subcutaneously injected with 100 µl of PBS. Three days following BCG administration, vaccinated and control animals were sacrificed under isoflurane anesthesia, by exsanguination and subsequent cervical dislocation, after which spleen and bone marrow were collected for further analysis. Downstream cell isolation for each tissue proceeded immediately.
2.2. Cell Suspension Obtainment
To obtain cell suspension from spleen and bone marrow, the organs were washed with 5 ml PBS, homogenized with a flat pestle, then passed through a cell filter (70 μm, Cell Strainer), centrifuged at 250 g and 4˚C for 7 min. To remove erythrocytes, the cell pellet was resuspended in 1 ml Red Blood Cell Lysing Buffer Hybri-Max (Sigma–Aldrich, St. Louis, MO, USA), incubated for 1 min at room temperature, after which 14 ml PBS was added. Cells were resuspended and centrifuged at 250 g and 4˚C for 7 min. The precipitate was then resuspended in 5 ml of cold PBS, centrifuged again at 300 g 4 C for 5 min. The cells were resuspended in 1 ml of cold PBS, after which the number of cells in the resulting suspension was determined through Trypan Blue staining using an automatic cell counter Countess II FL (Invitrogen; Thermo Fisher Scientific Inc. Waltham, Massachusetts, USA). For further staining and FACS, 1 million bone marrow cells and 1 million spleen cells were resuspended in FACS buffer (1% fetal bovine serum and 2 mM EDTA in PBS). Additionally, 1 million unsorted bone marrow cells were collected.
2.3. Antibody Staining, Flow Cytometry and Cell Sorting
In order to exclude non-specific cell staining, we first incubated the cell suspensions with blocking anti-mouse CD16/CD32 antibodies (Mouse BD Fc Block™, Pharmingen, San Diego, CA) for 10 minutes at room temperature, and then – with conjugated antibodies against CD45 (PerCP/Cy5.5 dye, Cat.№ 103132 Biolegend, USA), CD11b (FITC dye, Cat.№ 101217, Biolegend), NK1.1 (PE dye, Cat.№156504, Biolegend), Ly6G (APC dye, Cat.№127613, Biolegend), and Ly6C (APC/Cyanine7 dye, Cat.№ 128025, Biolegend) on ice in the dark for 30 min. To exclude the dead cells, we also stained the cell suspensions with DAPI (Bio-Rad, USA). Besides that, Fluorescence Minus One (FMO)-controls for each used antibody were prepared for better gating during cell sorting. After the staining, cells were washed twice with FACS buffer (4˚C, 500g, 7 min) and filtered through a 40 µm Cell Strainer.
Cell population analysis and FACS were performed using BD FACSAria III (BD Biosciences) sorter, BD FACSDiva (BD Biosciences) software and FlowingSoftware (University of Turku, Finland). The parameters of the cell sorter were first adjusted according to the sample staining and FMO-controls. After the adjustment of the parameters, the gates containing target cell populations (Monocytes CD45+CD11b+Ly6C+, Neutrophils: CD45+CD11b+Ly6G+, NK-cells: CD45+CD11b-NK1.1+) were set. To estimate the statistical significance of the differences between populations from control and BCG-vaccinated mice, the Mann-Whitney test was used. The p-values < 0.05 were considered significant. For both Control and BCG vaccinated groups of C57Bl/6J mice, cell suspensions from 3 bone marrow and 3 spleen samples were sorted and further processed for RNA isolation and sequencing.
2.4. RNA Isolation and Sequencing
The workflow of preparation of samples for RNA sequencing and further data analysis is presented in the Figure 1. The sorted 300,000 neutrophils, 50,000 monocytes, 50,000 NK cells, as well as 1 million unsorted bone marrow cells of each mouse, were collected by centrifugation and lysed using ExtractRNA reagent (Evrogen, Moscow, Russian Federation). The cell lysates were stored at −70 °C until RNA extraction. RNA was extracted with RNA Clean & ConcentratorTM-5 (Zymo Research, Irvine, CA, USA). DNase I treatment was performed in-column during the extraction. The total RNA was quantified using Qubit RNA HS Assay Kit (Thermo Fisher Scientific, Waltham, MA, USA) and Invitrogen Qubit Fluorometer (Thermo Fisher Scientific, Waltham, MA, USA). The quality of the extracted RNA was determined using TapeStation 2200 (Agilent Technologies, Santa Clara, CA, USA) with Agilent High Sensitivity RNA ScreenTape (Agilent Technologies). rRNA depletion was performed using NEBNext rRNA Depletion Kit v2 (Human/Mouse/Rat) with RNA Sample Purification Beads (New England BioLabs, Ipswich, MA, USA). The NEBNext Ultra II Directional RNA Library Prep Kit for Illumina with Sample Purification Beads (New England BioLabs) and a NEBNext Multiplex Oligos for Illumina (Unique Dual Index UMI Adaptors RNA Set 1, New England BioLabs) were used for the preparation of libraries.
Finally, the resulting 24 individually indexed RNA-seq libraries (3 × Bone Marrow-Control, 3 × Bone Marrow-BCG, 3 × Neutrophils-Control, 3 × Neutrophils-BCG, 3 × Monocytes-Control, 3 × Monocytes-BCG, 3 × NK-Control, 3 × NK-BCG) were mixed in equimolar amounts, the final mixture was analyzed with Agilent High Sensitivity DNA ScreenTape (Agilent Technologies). The median fragment length of the pooled fragments was 357 b.p., distributed between 200 and 700 b.p. The sequencing was performed with an Illumina NovaSeq 6000 System (Illumina, San Diego, CA, USA, SP-type, pair-end reads, 150 bp).
2.5. RNA-seq Data Analysis
The sequencing data was uploaded to the Galaxy web platform, and analysis of the data was conducted using the public server available at usegalaxy.org. The quality of raw reads of 24 samples was assessed using the MultiQC tool [23]. The reads were trimmed using CutAdapt tool [24]. The reads were further aligned to murine reference genome (GRCm38/mm10) via HISAT2 [25], counted with featureCount tool [26] (GENCODE vM23, GRCm38.p6 was used as the reference transcriptome) and normalized with DESeq2 [27]. Raw sequencing data and DESeq2 normalized counts have been deposited in NCBI’s Gene Expression Omnibus [28] and are accessible through GEO Series accession number GSE261448 (https://www.ncbi.nlm.nih.gov/geo/query/acc.cgi?acc=GSE261448). The full description of the data is also available at [29].
3. Results
3.1. The Bone Marrow and Spleen Immune Cell Composition Following Subcutaneous BCG Vaccination
The available data on the time required for TRIM development suggests that TRIM is usually induced between 7 and 14 days after the BCG vaccination [20]. We investigated the early changes in the innate immune response of mice 3 days following vaccination, when the pathogen-induced immune response just starts evolving into TRIM. Immunophenotyping of bone marrow and spleen cells was performed 3 days following subcutaneous BCG vaccination. Samples of murine bone marrow and spleen were collected 3 days following subcutaneous BCG injection or subcutaneous PBS injection as a control. The samples were stained using a panel of antibodies that enabled the differentiation of populations of monocytes, neutrophils, and natural killer (NK) cells, and analyzed by flow cytometry (the gating strategy is presented in Figure 2A). Briefly, gates for populations of alive, doublet-free and debris-free cells were initially established. Then, among them, a population of CD45-positive leukocytes was distinguished, which was subdivided into two subpopulations: (i) CD11b-positive myeloid cells and (ii) NK1.1-positive NK cells. The population of myeloid cells was further divided into subpopulations of Ly6C-postitive monocytes and Ly6G-positive neutrophils. As a result, the percentages of NK cells, monocytes, and neutrophils in the bone marrow and spleen 3 days following BCG vaccination were evaluated (Figure 2B,C).
The analysis revealed a slight increase in the percentage of splenic monocytes (p < 0.05) and NK cells (p < 0.05), Figure 2B, 3 days following BCG vaccination compared to PBS-injected mice. In contrast, no statistically significant changes were observed in the percentages of splenic neutrophils and bone marrow innate immune cell populations 3 days following BCG vaccination compared to the control (Figure 2B,C).
3.2. The Transcriptomic Response of Innate Immune Cells 3 Days Following BCG Vaccination
To gain a deeper understanding of the impact of BCG vaccination on innate immune cells, we have obtained the samples of murine neutrophils, monocytes, and NK cells 3 days following BCG vaccination using FACS and subjected them to RNA sequencing (Figure 1). The samples of non-sorted bone marrow cells were also collected for each mouse and subjected to RNA sequencing.
3.2.1. RNA-seq Data Quality Assessment
In total, 1,418,200,000 double-end 150 b.p. reads were obtained. The fastq files were analyzed with FASTQC tool [32], the resulting report indicated acceptable sequencing quality for all 24 samples. The mean number of paired-end reads per library was 57 million. The quality parameters of the obtained RNA-seq libraries are presented in the Table 1.
The reads were subsequently aligned to the murine reference genome (GRCm38/mm10) via HISAT2 [25] tool. The successfully aligned reads were then counted with featureCount tool [26] (GENCODE vM23, GRCm38.p6 was used as the reference transcriptome) and normalized with DESeq2 [27]. The obtained read counts were converted into Transcripts Per Million (TPM) values and averaged over the triplicates. The percentage of successfully aligned reads for each library is presented in the Table 1.
To confirm the phenotype of isolated cell populations (NK cells, neutrophils, monocytes) and quality of cell sorting, we analyzed the expression level of genes corresponding to surface markers of the targeted populations, which were used for cell sorting. The results are presented in the Supplementary Figure 1. The expression of genes was estimated using the transcripts per million (TPM) method proposed by Galaxy.
As anticipated, the sorted neutrophils and monocytes exhibited high expression levels of the Ptprc (pan-leukocyte antigen CD45) and Itgam (myeloid cell marker CD11b) genes. The expression level of their specific markers Ly6g (neutrophil marker Ly6G) and Ly6c1/2 (Monocyte marker Ly6C) corresponded with the respective population, thereby confirming the phenotype of sorted cell populations. The phenotype of sorted NK cells was also confirmed, since elevated expression of the Ptprc and Klrb1b/c (NK cell marker NK1.1) was observed.
In the case of non-sorted bone marrow cells, elevated Ptprc gene expression was observed. Since the bone marrow contains heterogenous populations of hematopoietic and nonhematopoietic cells, the observed expression level of Ptprc was relatively low compared to the sorted cell populations. The cellular composition of bone marrow includes a variety of myeloid cells. This was corroborated by the expression of Itgam gene. Additionally, the bone marrow transcriptomes exhibited the expression of Ly6g, Ly6c1 and Ly6c2 genes, which correspond to monocyte and neutrophil populations. In turn, the observed Klrb1b/c gene expression was low, which can be attributed to the migration of mature NK cells outside the bone marrow.
In order to examine the interrelations among populations, we plotted all samples in a two-dimensional principal component analysis (PCA)-plot based on their gene expression levels (Figure 3A). PCA-analysis revealed general differences between groups of samples: PC1 divided the samples by sub-types, with myeloid monocytes and neutrophils being clearly separated from lymphoid NK cells. At the same time, PC2 clearly separated non-sorted bone marrow and sorted cell populations.
To identify differentially expressed genes (DEGs) between BCG-induced and control cells of each population, we defined genes with an adjusted p-value of less than 0.05 and fold change of higher than 2 as DEGs (Figure 3B, Supplementary Table S1). Using the DESeq2 approach [27], a total of 63 DEGs (3 upregulated and 60 downregulated) were identified in BCG-induced unsorted murine bone marrow cells compared to control non-vaccinated mice; 26 downregulated genes were observed in BCG-induced monocytes (with no upregulated genes); 70 upregulated and 92 downregulated genes were identified in BCG-induced NK cells. The gene expression profile of neutrophils did not differ between BCG-vaccinated and control mice. Thus, NK cells, Monocytes and non-sorted bone marrow cells exhibited transcriptomic alterations as early as three days following vaccination. Subsequently, we sought to identify the specific genes that were involved in this response.
3.2.2. Gene Ontology (GO) and Pathway Enrichment Analyses
The identified differently expressed genes (DEGs) from Bone Marrow, Monocyte and NK cell samples were subjected to gene ontology (GO) function and pathway enrichment analyses using Metascape [30].
3.2.3. Transcriptomic Alterations in NK Cells
To determine early changed processes and pathways in NK cells after BCG vaccination, we analyzed 179 DEGs (p-adjusted < 0.05, FC > 1.5 and FC < 0.6). The top 25 GO terms that were enriched in NK cells upon BCG vaccination are represented in the Figure 4A. Using Metascape, the subclass of representative terms from gene function analysis was transformed into a network arrangement (Supplementary Figure 2A). The complete list of enriched GO terms and corresponding enrichment scores are presented in the Supplementary Table.
The results demonstrated a significant enrichment in GO terms associated with the regulation of immunological response upon BCG vaccination, including the «inflammatory response», «innate immune response», «antimicrobial peptides», «neutrophil degranulation», «myeloid leukocyte activation», «antifungal humoral response», «response to fungus», «response to yeast», «defense response to bacterium», «immunoregulatory interactions between a lymphoid and a non-lymphoid cell», «NF-kappa B signaling pathway», etc (Figure 4A, Supplementary Figure 2A). Another set of enriched GO terms was associated with metabolic and molecular processes: «production of molecular mediator involved in inflammatory response», «positive regulation of reactive oxygen species metabolic process», «iron ion transport», «positive regulation of cytokine production», «positive regulation of cysteine-type endopeptidase activity», etc (Figure 4A, Supplementary Figure 2A). The enrichment in general cellular processes was also observed, including «cytoskeleton in muscle cells», «positive regulation of phosphorylation», «positive regulation of cell migration», «positive regulation of cell motility», «positive regulation of locomotion», «modulation of process of another organism», «positive regulation of response to external stimulus», etc.
These results indicate the involvement of genes whose expression was altered in NK cells upon BCG vaccination in metabolic, molecular, and cellular processes, aligning with the mechanisms underlying the development of TRIM at later timepoints.
3.2.4. Transcriptomic Alterations in Monocytes
To determine early changed processes and pathways in Monocytes following BCG vaccination, we analyzed all 30 down-regulated genes (p-adjusted < 0.05, FC < 0.6). The top GO terms that were enriched in monocytes upon BCG vaccination are represented in the Figure 4B, and the network analysis of the subclasses of these terms is represented in the Supplementary Figure 2B.
The analysis revealed a significant enrichment in GO terms related to various processes involved in the regulation of immune response upon BCG vaccination, including «regulation of inflammatory response», «positive regulation of inflammatory response», «leukocyte activation», «positive regulation of defense response», «neutrophil degranulation»; «cellular transport and endocytosis: lysosomal transport», «vacuolar transport», «receptor-mediated endocytosis»; «cellular sensing and response: response to mechanical stimulus», «positive regulation of response to external stimulus», «cellular homeostasis and structure: tissue homeostasis», «anatomical structure homeostasis»; «platelet activation and hemostasis: platelet activation, signaling, and aggregation», and «hemostasis».
3.2.5. Transcriptomic Alterations in the Non-Sorted Bone Marrow
To evaluate early changed processes and pathways in bulk bone marrow cells after BCG vaccination, we analyzed 184 DEGs (19 upregulated and 165 downregulated, p-adjusted < 0.05, FC < 0.6 and FC > 1.5). The top GO terms that were enriched in the bone marrow cells upon BCG vaccination are represented in the Figure 4C, and the network analysis of the subclasses of these terms is represented in the Supplementary Figure 2C.
The enriched upon vaccination GO terms can be subdivided into 4 categories. The first category, similar to NK cells and monocytes, was associated with immune system-related processes. It can be further subdivided into two categories, first being inflammatory response and cytokine regulation («inflammatory response», «cytokine production involved in immune response», «cytokine-mediated signaling pathway», «positive regulation of cytokine production», etc.), and the second being immune response regulation («regulation of leukocyte activation», «regulation of immune response», «negative regulation of immune response», «regulation of T cell activation»). The second category included GO terms associated with cell migration and chemotaxis, including «positive regulation of cell migration», «positive regulation of leukocyte chemotaxis», «positive regulation of chemotaxis», «regulation of leukocyte migration», etc. The third category was comprised of GO terms united by cellular activation and differentiation processes, such as «positive regulation of cell activation», «positive regulation of leukocyte differentiation», «regulation of myeloid cell differentiation», «myeloid leukocyte differentiation». Finally, the last category was associated with metabolic processes and signaling pathways: «adenosine and purine metabolic processes», «insulin signaling pathway», «toll-like receptor signaling pathway», «glycerolipid and lipid metabolism», etc.
The analysis of the identified categories demonstrated a significant association between the deregulated processes and the immune system. Many of these processes, such as «inflammatory response», «cytokine regulation», «cell migration», and «cellular activation», are directly linked to immune functions and TRIM formation. Additionally, the observed regulation of metabolic pathways and signaling cascades indicates a coordinated early response of bone marrow to the administration of BCG, suggesting a proactive engagement of the immune system in the defense against external stimuli. The intricate interplay of these processes highlights the dynamic nature of immune activation and underscores the comprehensive immune-modulatory mechanisms involved in response to immunological triggers such as BCG.
3.2.6. Analysis of Common Altered Processes
To gain a more comprehensive understanding of the early transcriptomic response of different immune cells to BCG vaccination, we compared the enriched GO terms in NK cells, monocytes and non-sorted bone marrow cells following BCG vaccination. The comparison revealed several common processes (Figure 5A). Four common GO terms were shared between the three cell populations: «neutrophil degranulation», «leukocyte activation», «positive regulation of response to external stimulus», and «positive regulation of defense response». Three GO terms were shared between NK cells and Monocytes: «positive regulation of inflammatory response», «regulation of inflammatory response», «hemostasis». Finally, 24 terms were shared between bone marrow and NK cells. These terms were clustered using TreeMap visualization (Figure 5B) from Revigo [31], the majority of terms was associated with immune response, cytokine signaling, and cell migration (the complete list of common GO terms can be found in the Supplementary Table).
3.2.7. Immune Ligand and Receptor Analysis
The Gene Ontology enrichment analysis revealed that the transcriptomic alterations were predominantly associated with immune responses, albeit with considerable ambiguity. To identify the specific genes responsible for these alterations, as well as to better understand the immunity-related processes that occur upon BCG vaccination, we conducted an analysis of immune ligand and receptor gene expression. To this end, we selected genes associated with immune response from the DEGs for each population (NK cells, monocytes, and non-sorted bone marrow cells) and analyzed their expression in terms of transcripts per million (TPM). The analysis revealed four genes, two of which were specific to NK cells (Tnfsf14 and S100a8), and two of which were specific to non-sorted bone marrow cells (C5ar1 and Csf2rb), as illustrated in Figure 6. No such genes were revealed for monocytes.
4. Discussion
In this study, we evaluated the early response of innate immunity cells to subcutaneous BCG vaccination using the analysis of immune cell population composition and transcriptomic changes in neutrophils, monocytes and NK cells derived from murine bone marrow and spleen. To this end, we have immunized C57Bl/6J mice with 10⁶ CFU of BCG or phosphate-buffered saline as a control. Three days following BCG administration, the three cell populations were collected from the control and BCG-vaccinated groups by FACS.
Bone Marrow and Spleen Immune Cell Composition
First, we observed a slight increase in the percentage of splenic monocytes 3 days following subcutaneous BCG vaccination, Figure 2B.
The adult spleen contains a reservoir of monocytes that can be rapidly recruited in response to injury or inflammation [33,34]. It has been demonstrated that during inflammation, splenic Ly6C-high and Ly6C-low monocytes are mobilized into the circulation via Angiotensin-II/AGTR1A-signaling [35]. According to available data, the vaccination triggers changes in splenic neutrophils, with immature neutrophils appearing 2 to 3 days post-vaccination, followed by mature neutrophils on day 3, which are then released from the spleen 24 hours after the challenge [36]. A mouse model of sepsis and persistent inflammation, immunosuppression, and catabolism syndrome (PICS) also showed an increase in total neutrophil counts in the spleen by day 8 [37].
The observed in our experiments increase in splenic monocytes may represent the part of the emergency granulopoiesis induced by BCG vaccination, providing rapid protection against infections [36].
Second, we observed a slight increase in the percentage of splenic NK cells 3 days following subcutaneous vaccination (Figure 2B). Spleen, an important secondary lymphoid organ, contains significant number of NK cells [38,39]. In a study by Dokun et al. [40], the kinetics of the percentage of splenic NK-cells during viral infection in mice was investigated. The authors demonstrated an indiscriminate decrease in the total number of NK cells by day 2 following the infection, with a subsequent increase by day 6. This initial decrease could have been attributed to either cellular migration or cell death.
It is established that BCG vaccination induces rapid and robust NK cell responses in infants. Within 24 to 30 hours of stimulation with extracellular BCG, NK cells demonstrate the peak IFN-γ production [41]. The vaccination of newborns with BCG results in significantly higher percentages of IFN-γ-expressing NK cells compared to unvaccinated infants at 5 and 9 weeks of age [15,42]. These BCG-reactive NK cell responses correlate with increased levels of secreted cytokines, including IL-2, IFN-γ, IL-6, IL-1β, and TNF [42]. However, the response varies depending on the site and route of vaccine administration. While peritoneal NK cell activity is markedly enhanced by intraperitoneal BCG injection in mice, splenic NK cell activity is suppressed for a period of 5-14 days post-injection [43].
Our results align with these findings, highlighting a pivotal role of NK cells in the early immune response to BCG vaccination. This suggests that NK cells may contribute to protection against tuberculosis and other infections by enhancing innate immune functions.
Finally, we did not detect immediate changes in the percentages of bone marrow innate immune cell populations, as well as splenic neutrophils, 3 days following BCG vaccination.
Other research has indicated that systemic BCG vaccination induces a myeloid differentiation bias at the level of hematopoietic stem cells within the bone marrow, resulting in an increased release of monocytes with enhanced cytokine secretion and pathogen-killing abilities [7]. This reprogramming at the progenitor cell level in the bone marrow can result in the emergence of trained monocytes, which can be identified in the circulation of BCG-vaccinated individuals for at least three months post-vaccination [44]. Furthermore, macrophages derived from the bone marrow of BCG-vaccinated mice exhibit increased bacterial killing capacity for an extended period post-vaccination [45]. This enhanced bacterial killing capacity has been associated with distinct gene expression signatures in macrophages derived from vaccinated mice compared to those from unvaccinated mice [46].
In conclusion, while the immediate impact on bone marrow monocyte levels may not be evident shortly after BCG vaccination, the reprogramming of hematopoietic stem cells and progenitor cells in the bone marrow leads to significant changes at the transcriptomic level, affecting the functional capabilities of monocytes in the long term.
The Early Transcriptomic Response of Innate Immune Cells to BCG Vaccination
To gain a deeper understanding of the impact of BCG vaccination on innate immune cells, we have obtained the samples of murine neutrophils, monocytes, and NK cells 3 days following BCG vaccination using FACS and subjected them to RNA sequencing. The samples of non-sorted bone marrow were also collected and subjected to RNA-sequencing.
Firstly, we have identified the differently expressed genes (DEGs) between BCG-vaccinated and control mice and subjected these genes to gene ontology (GO) function and pathway enrichment analyses. The gene expression profile of neutrophils did not differ between BCG-vaccinated and control mice. At the same time, we have identified 179 DEGs in NK cells, 30 DEGs in monocytes, and 184 DEGs in non-sorted bone marrow cells. The GO terms enriched in NK cells upon BCG vaccination were associated with the regulation of immunological response, metabolic and molecular processes, and general cellular processes (Figure 4A). In the case of monocytes, most of the GO terms enriched upon BCG vaccination were associated with the regulation of immune response (Figure 4B). Finally, the unsorted bone marrow cells following BCG vaccination were enriched in GO terms associated with immune system processes (inflammatory response and cytokine regulation, immune response regulation), cell migration and chemotaxis, cellular activation and differentiation metabolic processes and signaling pathways (Figure 4C).
The analysis of the identified categories demonstrated a significant association between the deregulated processes and the immune system. The observed regulation of metabolic pathways and signaling cascades in bone marrow indicates a coordinated early response to the administration of BCG, suggesting a proactive engagement of the immune system in the defense against external stimuli. The intricate interplay of these processes highlights the dynamic nature of immune activation and underscores the comprehensive immune-modulatory mechanisms involved in response to immunological triggers such as BCG.
Secondly, we conducted an analysis of the expression of immune ligand and receptor genes to identify the specific genes that may be responsible for the corresponding transcriptomic alterations. The analysis identified the most significantly altered genes for further examination. Four genes were revealed: two specific to NK cells (Tnfsf14 and S100a8) and two specific to non-sorted bone marrow cells (C5ar1 and Csf2rb), as shown in Figure 6.
Tnfsf14, also designated as LIGHT, exhibits a paradoxical function with respect to inflammatory processes and immune responses. Several studies demonstrate that LIGHT enhances inflammatory processes [47,48,49,50]. Increased LIGHT expression has been shown to promote the development of colitis [48], skin inflammation [49], and lung inflammation [50]. Furthermore, LIGHT is predominantly expressed on activated T cells and activated NK cells [51]. Conversely, other studies indicate that LIGHT plays a protective role in the prevention of colitis [52,53].
Accordingly, the observed decline in LIGHT expression three days following BCG vaccination may be attributed to either the attenuation of the initial inflammatory response triggered by vaccination or the promotion of subsequent inflammation. Based on the transcriptomic analysis results, it appears more likely that the former scenario applies in this case. Regarding NK cell-specific LIGHT production, the available data are limited. For instance, the activation of LIGHT production by NK cells has been observed in tumor-sensing NK cells, leading to the priming of novel antitumor responses through the interaction of NK-derived LIGHT with its receptor, HVEM (Tnfrsf14), on the surface of dendritic cells [51]. This interaction accounts for the majority of the immune-stimulating properties of LIGHT. The HVEM receptor is expressed on the surface of both NK and T cells, and it serves as an important T cell costimulatory agent, leading to activation, proliferation, and survival. Another major LIGHT receptor, LTβR, has been demonstrated to play a pivotal role in the development of T-cell-mediated immunity against infection [54].
S100a8 is a gene that encodes a subunit of the S100A8/A9 proinflammatory protein. During the inflammatory process, S100A8/A9 is released actively and exerts a critical role in modulating the inflammatory response by stimulating leukocyte recruitment and inducing cytokine secretion [55]. The dysregulation of S100A8/A9 expression has been associated with severe inflammatory reactions, such as those observed in critical cases of Coronavirus Disease 2019 (COVID-19), especially during the initial stages of infection [56]. Transcriptomic analysis has revealed a notable decline in S100a8 expression in NK cells three days following vaccination, suggesting that the initial inflammatory response may be suppressed by the third day.
Given the observed suppression of inflammation in NK cells three days following subcutaneous BCG vaccination, and the effect of LIGHT on T cells, it can be postulated that the suppression of Tnfsf14 and S100a8 in NK cells may serve as a connection between innate and adaptive immunity during the development of the early immune response following BCG vaccination. However, this hypothesis requires further investigation.
C5ar1 is one of the receptors of the complement anaphylatoxin C5a. This complement contributes to host defense against infection [57]. Activation of C5ar1 has been observed to stimulate various processes, including chemotaxis, granule enzyme release, intracellular calcium release, and superoxide anion production. In particular, the interaction of C5a initiates the accumulation of complement and phagocytic cells at sites of infection, as well as recruitment of antigen-presenting cells to lymph nodes [58]. As evidenced by human single-cell RNA-seq data [59,60], C5ar1 expression within the bone marrow is predominantly observed in macrophages.
Considering that the site of infection was in the right flank of the mice, it is unsurprising that there was a reduction in C5ar1 expression in the bone marrow on day 3 after BCG vaccination. This may be attributed to two possible mechanisms: first, macrophages expressing this receptor may migrate to the site of inflammation; second, the expression of the receptor in macrophages may be suppressed to prevent overactivation of the immune system.
Csf2rb encodes a common beta chain of type I cytokine receptors, which include receptors for GM-CSF, IL3 and IL5 [61]. These hematopoietic cytokines play an important role in inflammation. However, their precise functions are extremely diverse [62], and thus no single conclusion can be drawn regarding their role in the development of trained immunity. As with the previously described proteins, the suppression of this gene's expression may be related to the suppression of the early immune response at day 3 post-BCG vaccination.
Thus, we confirmed that the local BCG immunization elicits early immune response of bone marrow and spleen innate immunity cells. The insights obtained within our study can provide valuable information on the mechanisms underlying trained immunity.
5. Conclusions
In this study, we assessed the early response of mice to subcutaneous BCG vaccination by examining immune cell populations in the bone marrow and spleen, as well as the transcriptomic alterations occurring in neutrophils, monocytes, NK cells, and non-sorted bone marrow cells. An increase in the proportion of splenic NK cells and monocytes was observed following vaccination. In contrast, no alterations were identified in neutrophils, both in terms of cell percentage and at the transcriptomic level, following BCG vaccination. Transcriptomic analysis revealed the enrichment in Gene Ontology terms related to regulation of immune response in NK cells, monocytes, and unsorted bone marrow cells following BCG vaccination. Two NK cell-specific immune ligands (Tnfsf14 and S100a8) and two bone marrow-specific immune receptors (C5ar1 and Csf2rb) were identified. However, further research is required to elucidate the roles of identified genes and gain a deeper understanding of the trained immunity phenomenon.
Supplementary Materials
The following supporting information can be downloaded at the website of this paper posted on Preprints.org, Figure S1: FACS quality control; Figure S2: The Network Analysis of enriched GO terms; Table S1: Deseq2 and Metascape results.
Author Contributions
Conceptualization, I.A. and E.S.; methodology, L.K., V. P., I.L., E.S., and S.K.; validation, A.K., L.K. and O.R.; formal analysis, L.K., O.R., A.K. and V.P.; data curation, L.K., O.R., I.L., S.K..; writing—original draft preparation, L.K., O.R. and V.P..; writing—review and editing, A.K., O.R. and E.S.; visualization, L.K.; supervision, I.A. and E.S..; project administration, I.A.; funding acquisition, E.S. All authors have read and agreed to the published version of the manuscript.
Funding
This study was supported by Russian Science Foundation (grant № 22-14-00308), https://rscf.ru/en/project/22-14-00308/.
Institutional Review Board Statement
The studies using mice were reviewed and approved by the Animal Care and Use Committee of the Central Institute for Tuberculosis, Moscow, Russia (protocol 1 from 03 March 2022). All animal manipulations were performed according to the recommendations of the European Convention for the Protection of Vertebrate Animals Used for Experimental and Other Scientific Purposes, Council of Europe (ETS 123).
Informed Consent Statement
Not applicable.
Data Availability Statement
Raw sequencing data and DESeq2 normalized counts have been deposited in NCBI’s Gene Expression Omnibus [28] and are accessible through GEO Series accession number GSE261448 (https://www.ncbi.nlm.nih.gov/geo/query/acc.cgi?acc=GSE261448). The full description of the data is also available at [29].
Acknowledgments
In this section, you can acknowledge any support given which is not covered by the author contribution or funding sections. This may include administrative and technical support, or donations in kind (e.g., materials used for experiments).
Conflicts of Interest
The authors declare no conflicts of interest.
References
- Shann, F. The Non-Specific Effects of Vaccines. Arch Dis Child 2010, 95, 662–667. [CrossRef]
- Stensballe, L.G.; Nante, E.; Jensen, I.P.; Kofoed, P.-E.; Poulsen, A.; Jensen, H.; Newport, M.; Marchant, A.; Aaby, P. Acute Lower Respiratory Tract Infections and Respiratory Syncytial Virus in Infants in Guinea-Bissau: A Beneficial Effect of BCG Vaccination for Girls. Vaccine 2005, 23, 1251–1257. [CrossRef]
- Nemes, E.; Geldenhuys, H.; Rozot, V.; Rutkowski, K.T.; Ratangee, F.; Bilek, N.; Mabwe, S.; Makhethe, L.; Erasmus, M.; Toefy, A.; et al. Prevention of M. Tuberculosis Infection with H4:IC31 Vaccine or BCG Revaccination. New England Journal of Medicine 2018, 379, 138–149. [CrossRef]
- Giamarellos-Bourboulis, E.J.; Tsilika, M.; Moorlag, S.; Antonakos, N.; Kotsaki, A.; Domínguez-Andrés, J.; Kyriazopoulou, E.; Gkavogianni, T.; Adami, M.-E.; Damoraki, G.; et al. Activate: Randomized Clinical Trial of BCG Vaccination against Infection in the Elderly. Cell 2020, 183, 315-323.e9. [CrossRef]
- Spencer, J.C.; Ganguly, R.; Waldman, R.H. Nonspecific Protection of Mice against Influenza Virus Infection by Local or Systemic Immunization with Bacille Calmette-Guerin. Journal of Infectious Diseases 1977, 136, 171–175. [CrossRef]
- Kleinnijenhuis, J.; Quintin, J.; Preijers, F.; Joosten, L.A.B.; Ifrim, D.C.; Saeed, S.; Jacobs, C.; van Loenhout, J.; de Jong, D.; Stunnenberg, H.G.; et al. Bacille Calmette-Guérin Induces NOD2-Dependent Nonspecific Protection from Reinfection via Epigenetic Reprogramming of Monocytes. Proceedings of the National Academy of Sciences 2012, 109, 17537–17542. [CrossRef]
- Cirovic, B.; de Bree, L.C.J.; Groh, L.; Blok, B.A.; Chan, J.; van der Velden, W.J.F.M.; Bremmers, M.E.J.; van Crevel, R.; Händler, K.; Picelli, S.; et al. BCG Vaccination in Humans Elicits Trained Immunity via the Hematopoietic Progenitor Compartment. Cell Host Microbe 2020, 28, 322-334.e5. [CrossRef]
- Arts, R.J.W.; Moorlag, S.J.C.F.M.; Novakovic, B.; Li, Y.; Wang, S.-Y.; Oosting, M.; Kumar, V.; Xavier, R.J.; Wijmenga, C.; Joosten, L.A.B.; et al. BCG Vaccination Protects against Experimental Viral Infection in Humans through the Induction of Cytokines Associated with Trained Immunity. Cell Host Microbe 2018, 23, 89-100.e5. [CrossRef]
- Mulder, W.J.M.; Ochando, J.; Joosten, L.A.B.; Fayad, Z.A.; Netea, M.G. Therapeutic Targeting of Trained Immunity. Nat Rev Drug Discov 2019, 18, 553–566. [CrossRef]
- Hu, Z.; Lu, S.; Lowrie, D.B.; Fan, X. Trained Immunity: A Yin-Yang Balance. MedComm (Beijing) 2022, 3. [CrossRef]
- Netea, M.G. Training Innate Immunity: The Changing Concept of Immunological Memory in Innate Host Defence. Eur J Clin Invest 2013, 43, 881–884. [CrossRef]
- Kleinnijenhuis, J.; Quintin, J.; Preijers, F.; Joosten, L.A.B.; Jacobs, C.; Xavier, R.J.; van der Meer, J.W.M.; van Crevel, R.; Netea, M.G. BCG-Induced Trained Immunity in NK Cells: Role for Non-Specific Protection to Infection. Clinical Immunology 2014, 155, 213–219. [CrossRef]
- Verma, D.; Parasa, V.R.; Raffetseder, J.; Martis, M.; Mehta, R.B.; Netea, M.; Lerm, M. Anti-Mycobacterial Activity Correlates with Altered DNA Methylation Pattern in Immune Cells from BCG-Vaccinated Subjects. Sci Rep 2017, 7, 12305. [CrossRef]
- Singh, S.; Saavedra-Avila, N.A.; Tiwari, S.; Porcelli, S.A. A Century of BCG Vaccination: Immune Mechanisms, Animal Models, Non-Traditional Routes and Implications for COVID-19. Front Immunol 2022, 13. [CrossRef]
- Murphy, D.M.; Mills, K.H.G.; Basdeo, S.A. The Effects of Trained Innate Immunity on T Cell Responses; Clinical Implications and Knowledge Gaps for Future Research. Front Immunol 2021, 12. [CrossRef]
- Wang, Y.; Ge, F.; Wang, J.; Li, H.; Zheng, B.; Li, W.; Chen, S.; Zheng, X.; Deng, Y.; Wang, Y.; et al. Mycobacterium Bovis BCG Given at Birth Followed by Inactivated Respiratory Syncytial Virus Vaccine Prevents Vaccine-Enhanced Disease by Promoting Trained Macrophages and Resident Memory T Cells. J Virol 2023, 97. [CrossRef]
- Gillard, J.; Blok, B.A.; Garza, D.R.; Venkatasubramanian, P.B.; Simonetti, E.; Eleveld, M.J.; Berbers, G.A.M.; van Gageldonk, P.G.M.; Joosten, I.; de Groot, R.; et al. BCG-Induced Trained Immunity Enhances Acellular Pertussis Vaccination Responses in an Explorative Randomized Clinical Trial. NPJ Vaccines 2022, 7, 21. [CrossRef]
- Kleinnijenhuis, J.; Quintin, J.; Preijers, F.; Benn, C.S.; Joosten, L.A.B.; Jacobs, C.; van Loenhout, J.; Xavier, R.J.; Aaby, P.; van der Meer, J.W.M.; et al. Long-Lasting Effects of BCG Vaccination on Both Heterologous Th1/Th17 Responses and Innate Trained Immunity. J Innate Immun 2014, 6, 152–158. [CrossRef]
- Subiza, J.L.; Palomares, O.; Quinti, I.; Sánchez-Ramón, S. Editorial: Trained Immunity-Based Vaccines. Front Immunol 2021, 12. [CrossRef]
- Théroude, C.; Reverte, M.; Heinonen, T.; Ciarlo, E.; Schrijver, I.T.; Antonakos, N.; Maillard, N.; Pralong, F.; Le Roy, D.; Roger, T. Trained Immunity Confers Prolonged Protection From Listeriosis. Front Immunol 2021, 12. [CrossRef]
- Kleinnijenhuis, J.; Quintin, J.; Preijers, F.; Benn, C.S.; Joosten, L.A.B.; Jacobs, C.; van Loenhout, J.; Xavier, R.J.; Aaby, P.; van der Meer, J.W.M.; et al. Long-Lasting Effects of BCG Vaccination on Both Heterologous Th1/Th17 Responses and Innate Trained Immunity. J Innate Immun 2014, 6, 152–158. [CrossRef]
- Levy, O.; Wynn, J.L. A Prime Time for Trained Immunity: Innate Immune Memory in Newborns and Infants. Neonatology 2014, 105, 136–141. [CrossRef]
- Ewels, P.; Magnusson, M.; Lundin, S.; Käller, M. MultiQC: Summarize Analysis Results for Multiple Tools and Samples in a Single Report. Bioinformatics 2016, 32, 3047–3048. [CrossRef]
- Martin, M. Cutadapt Removes Adapter Sequences from High-Throughput Sequencing Reads. EMBnet J 2011, 17, 10–12. [CrossRef]
- Kim, D.; Langmead, B.; Salzberg, S.L. HISAT: A Fast Spliced Aligner with Low Memory Requirements. Nat Methods 2015, 12, 357–360. [CrossRef]
- Liao, Y.; Smyth, G.K.; Shi, W. FeatureCounts: An Efficient General Purpose Program for Assigning Sequence Reads to Genomic Features. Bioinformatics 2014, 30, 923–930. [CrossRef]
- Love, M.I.; Huber, W.; Anders, S. Moderated Estimation of Fold Change and Dispersion for RNA-Seq Data with DESeq2. Genome Biol 2014, 15, 550. [CrossRef]
- Edgar, R.; Domrachev, M.; Lash, A.E. Gene Expression Omnibus: NCBI Gene Expression and Hybridization Array Data Repository. Nucleic Acids Res 2002, 30, 207–210. [CrossRef]
- Kondratyeva, L.; Kuzmich, A.; Linge, I.; Pleshkan, V.; Rakitina, O.; Kondratieva, S.; Snezhkov, E.; Sass, A.; Alekseenko, I. Early Transcriptomic Response of Innate Immune Cells to Subcutaneous BCG Vaccination of Mice. BMC Res Notes 2024, 17, 253. [CrossRef]
- Zhou, Y.; Zhou, B.; Pache, L.; Chang, M.; Khodabakhshi, A.H.; Tanaseichuk, O.; Benner, C.; Chanda, S.K. Metascape Provides a Biologist-Oriented Resource for the Analysis of Systems-Level Datasets. Nat Commun 2019, 10, 1523. [CrossRef]
- Supek, F.; Bošnjak, M.; Škunca, N.; Šmuc, T. REVIGO Summarizes and Visualizes Long Lists of Gene Ontology Terms. PLoS One 2011, 6, e21800. [CrossRef]
- Andrews, S. FastQC: A Quality Control Tool for High Throughput Sequence Data Available online: http://www.bioinformatics.babraham.ac.uk/projects/fastqc/.
- Deniset, J.F.; Surewaard, B.G.; Lee, W.-Y.; Kubes, P. Splenic Ly6Ghigh Mature and Ly6Gint Immature Neutrophils Contribute to Eradication of S. Pneumoniae. Journal of Experimental Medicine 2017, 214, 1333–1350. [CrossRef]
- Kratofil, R.M.; Kubes, P.; Deniset, J.F. Monocyte Conversion During Inflammation and Injury. Arterioscler Thromb Vasc Biol 2017, 37, 35–42. [CrossRef]
- Teh, Y.C.; Ding, J.L.; Ng, L.G.; Chong, S.Z. Capturing the Fantastic Voyage of Monocytes Through Time and Space. Front Immunol 2019, 10. [CrossRef]
- Brook, B.; Harbeson, D.J.; Shannon, C.P.; Cai, B.; He, D.; Ben-Othman, R.; Francis, F.; Huang, J.; Varankovich, N.; Liu, A.; et al. BCG Vaccination–Induced Emergency Granulopoiesis Provides Rapid Protection from Neonatal Sepsis. Sci Transl Med 2020, 12. [CrossRef]
- Sengupta, S.; Caldwell, C.C.; Nomellini, V. Distinct Neutrophil Populations in the Spleen During PICS. Front Immunol 2020, 11, 804. [CrossRef]
- Grégoire, C.; Chasson, L.; Luci, C.; Tomasello, E.; Geissmann, F.; Vivier, E.; Walzer, T. The Trafficking of Natural Killer Cells. Immunol Rev 2007, 220, 169–182. [CrossRef]
- Wang, B.; Zhou, J.; Chen, Y.; Wei, H.; Sun, R.; Tian, Z.; Peng, H. A Novel Spleen-Resident Immature NK Cell Subset and Its Maturation in a T-Bet-Dependent Manner. J Autoimmun 2019, 105, 102307. [CrossRef]
- Dokun, A.O.; Kim, S.; Smith, H.R.C.; Kang, H.-S.P.; Chu, D.T.; Yokoyama, W.M. Specific and Nonspecific NK Cell Activation during Virus Infection. Nat Immunol 2001, 2, 951–956. [CrossRef]
- Esin, S.; Batoni, G.; Pardini, M.; Favilli, F.; Bottai, D.; Maisetta, G.; Florio, W.; Vanacore, R.; Wigzell, H.; Campa, M. Functional Characterization of Human Natural Killer Cells Responding to Mycobacterium Bovis Bacille Calmette-Guérin. Immunology 2004, 112, 143–152. [CrossRef]
- Murphy, M.; Suliman, S.; Briel, L.; Veldtsman, H.; Khomba, N.; Africa, H.; Steyn, M.; Snyders, C.I.; van Rensburg, I.C.; Walzl, G.; et al. Newborn Bacille Calmette-Guérin Vaccination Induces Robust Infant Interferon-γ-Expressing Natural Killer Cell Responses to Mycobacteria. International Journal of Infectious Diseases 2023, 130, S52–S62. [CrossRef]
- Ito, M.; Ralph, P.; Moore, M.A.S. Suppression of Spleen Natural Killing Activity Induced by BCG. Clin Immunol Immunopathol 1980, 16, 30–38. [CrossRef]
- Netea, M.G.; Joosten, L.A.B.; Latz, E.; Mills, K.H.G.; Natoli, G.; Stunnenberg, H.G.; O’Neill, L.A.J.; Xavier, R.J. Trained Immunity: A Program of Innate Immune Memory in Health and Disease. Science (1979) 2016, 352. [CrossRef]
- Sun, S.; Aguirre-Gamboa, R.; de Bree, L.; Sanz, J.; Dumaine, A.; Joosten, L.; Divangahi, M.; Netea, M.; Barreiro, L. BCG Vaccination Impacts the Epigenetic Landscape of Progenitor Cells in Human Bone Marrow. bioRxiv [Preprint] 2023. [CrossRef]
- Ochando, J.; Mulder, W.J.M.; Madsen, J.C.; Netea, M.G.; Duivenvoorden, R. Trained Immunity — Basic Concepts and Contributions to Immunopathology. Nat Rev Nephrol 2023, 19, 23–37. [CrossRef]
- Shaikh, R.B.; Santee, S.; Granger, S.W.; Butrovich, K.; Cheung, T.; Kronenberg, M.; Cheroutre, H.; Ware, C.F. Constitutive Expression of LIGHT on T Cells Leads to Lymphocyte Activation, Inflammation, and Tissue Destruction . The Journal of Immunology 2001, 167, 6330–6337. [CrossRef]
- Shih, D.Q.; Targan, S.R. Immunopathogenesis of Inflammatory Bowel Disease. World J Gastroenterol 2007, 14, 390. [CrossRef]
- Herro, R.; Antunes, R.D.S.; Aguilera, A.R.; Tamada, K.; Croft, M. The Tumor Necrosis Factor Superfamily Molecule LIGHT Promotes Keratinocyte Activity and Skin Fibrosis. Journal of Investigative Dermatology 2015, 135, 2109–2118. [CrossRef]
- Herro, R.; Da Silva Antunes, R.; Aguilera, A.R.; Tamada, K.; Croft, M. Tumor Necrosis Factor Superfamily 14 (LIGHT) Controls Thymic Stromal Lymphopoietin to Drive Pulmonary Fibrosis. Journal of Allergy and Clinical Immunology 2015, 136, 757–768. [CrossRef]
- Holmes, T.D.; Wilson, E.B.; Black, E.V.I.; Benest, A. V.; Vaz, C.; Tan, B.; Tanavde, V.M.; Cook, G.P. Licensed Human Natural Killer Cells Aid Dendritic Cell Maturation via TNFSF14/LIGHT. Proceedings of the National Academy of Sciences 2014, 111. [CrossRef]
- Krause, P.; Zahner, S.P.; Kim, G.; Shaikh, R.B.; Steinberg, M.W.; Kronenberg, M. The Tumor Necrosis Factor Family Member TNFSF14 (LIGHT) Is Required for Resolution of Intestinal Inflammation in Mice. Gastroenterology 2014, 146, 1752-1762.e4. [CrossRef]
- Giles, D.A.; Zahner, S.; Krause, P.; Van Der Gracht, E.; Riffelmacher, T.; Morris, V.; Tumanov, A.; Kronenberg, M. The Tumor Necrosis Factor Superfamily Members TNFSF14 (LIGHT), Lymphotoxin β and Lymphotoxin β Receptor Interact to Regulate Intestinal Inflammation. Front Immunol 2018, 9. [CrossRef]
- Stanley, A.C.; de Labastida Rivera, F.; Haque, A.; Sheel, M.; Zhou, Y.; Amante, F.H.; Bunn, P.T.; Randall, L.M.; Pfeffer, K.; Scheu, S.; et al. Critical Roles for LIGHT and Its Receptors in Generating T Cell-Mediated Immunity during Leishmania Donovani Infection. PLoS Pathog 2011, 7, e1002279. [CrossRef]
- Wang, S.; Song, R.; Wang, Z.; Jing, Z.; Wang, S.; Ma, J. S100A8/A9 in Inflammation. Front Immunol 2018, 9. [CrossRef]
- Lee, J.; Kim, H.; Kim, M.; Yoon, S.; Lee, S. Role of Lymphoid Lineage Cells Aberrantly Expressing Alarmins S100A8/A9 in Determining the Severity of COVID-19. Genes Genomics 2023, 45, 337–346. [CrossRef]
- Horst, S.A.; Itzek, A.; Klos, A.; Beineke, A.; Medina, E. Differential Contributions of the Complement Anaphylotoxin Receptors C5aR1 and C5aR2 to the Early Innate Immune Response against Staphylococcus Aureus Infection. Pathogens 2015, 4, 722–738. [CrossRef]
- Gerard, N.P.; Gerard, C. The Chemotactic Receptor for Human C5a Anaphylatoxin. Nature 1991, 349, 614–617. [CrossRef]
- He, S.; Wang, L.-H.; Liu, Y.; Li, Y.-Q.; Chen, H.-T.; Xu, J.-H.; Peng, W.; Lin, G.-W.; Wei, P.-P.; Li, B.; et al. Single-Cell Transcriptome Profiling of an Adult Human Cell Atlas of 15 Major Organs. Genome Biol 2020, 21, 294. [CrossRef]
- https://www.Proteinatlas.Org/ENSG00000197405-C5AR1/Single+cell+type/Bone+marrow.
- Woodcock, J.M.; Zacharakis, B.; Plaetinck, G.; Bagley, C.J.; Qiyu, S.; Hercus, T.R.; Tavernier, J.; Lopez, A.F. Three Residues in the Common Beta Chain of the Human GM-CSF, IL-3 and IL-5 Receptors Are Essential for GM-CSF and IL-5 but Not IL-3 High Affinity Binding and Interact with Glu21 of GM-CSF. EMBO J 1994, 13, 5176–5185. [CrossRef]
- Martinez-Moczygemba, M.; Huston, D.P. Biology of Common Beta Receptor-Signaling Cytokines: IL-3, IL-5, and GM-CSF. J Allergy Clin Immunol 2003, 112, 653–665; quiz 666. [CrossRef]
Figure 1.
RNA-Seq experiment and sequencing analysis workflow.
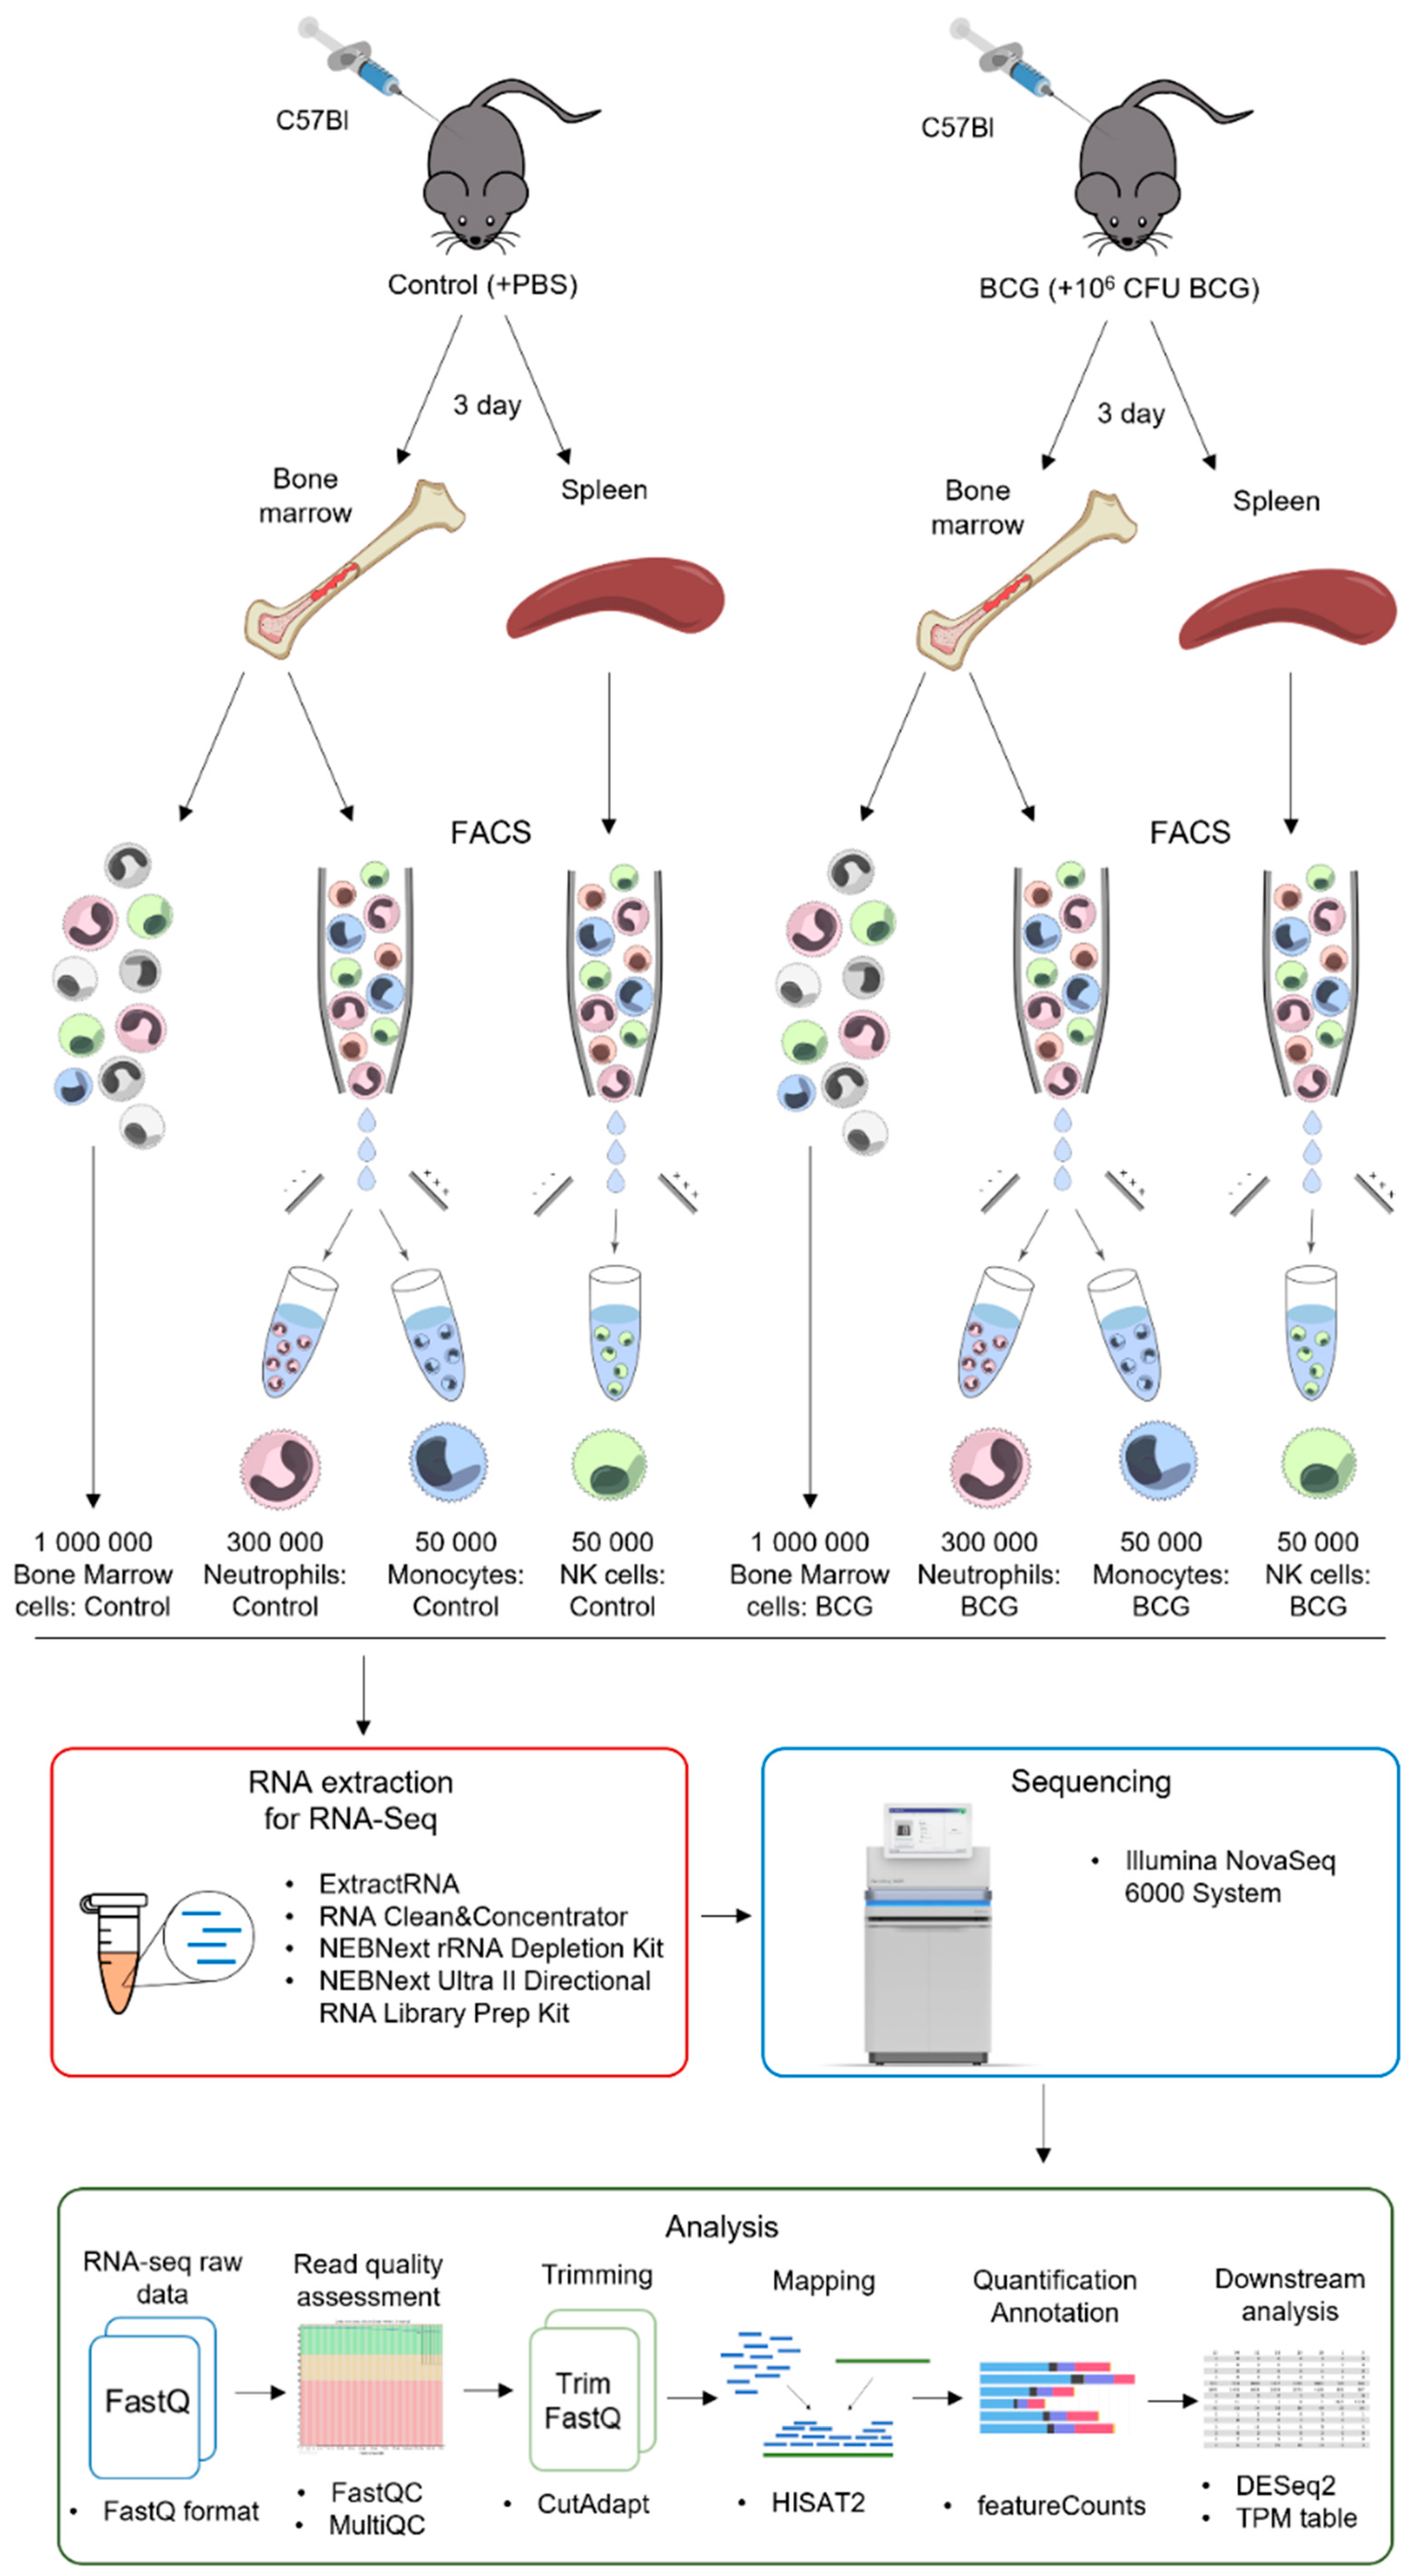
Figure 2.
The analysis of murine bone marrow and spleen immune cell populations following BCG vaccination. A. An example of the gating strategy for bone marrow sample: first, a debris-free and DAPI-negative (live cells) cell population was isolated. Then, among them, a population of leukocytes (CD45+) was distinguished, which was subdivided into two subpopulations: CD45+ CD11b+ (myeloid cells) and CD45+ NK1.1+ (NK cells) immune cells. The population of myeloid cells (CD45+ CD11b+) was further divided into subpopulations of monocytes (CD45+ CD11b+ Ly6C+) and neutrophils (CD45+ CD11b+ Ly6G+). B and C. Changes in the proportions of innate immune cell populations in the spleen (B) and bone marrow (C) 3 days following subcutaneous BCG vaccination. The percentage of neutrophils, monocytes, and NK cells was calculated relative to the total number of leukocytes in the samples. Bars representing mean among 5 mice per group ± S.D. * p < 0.05 (Mann-Whitney test).
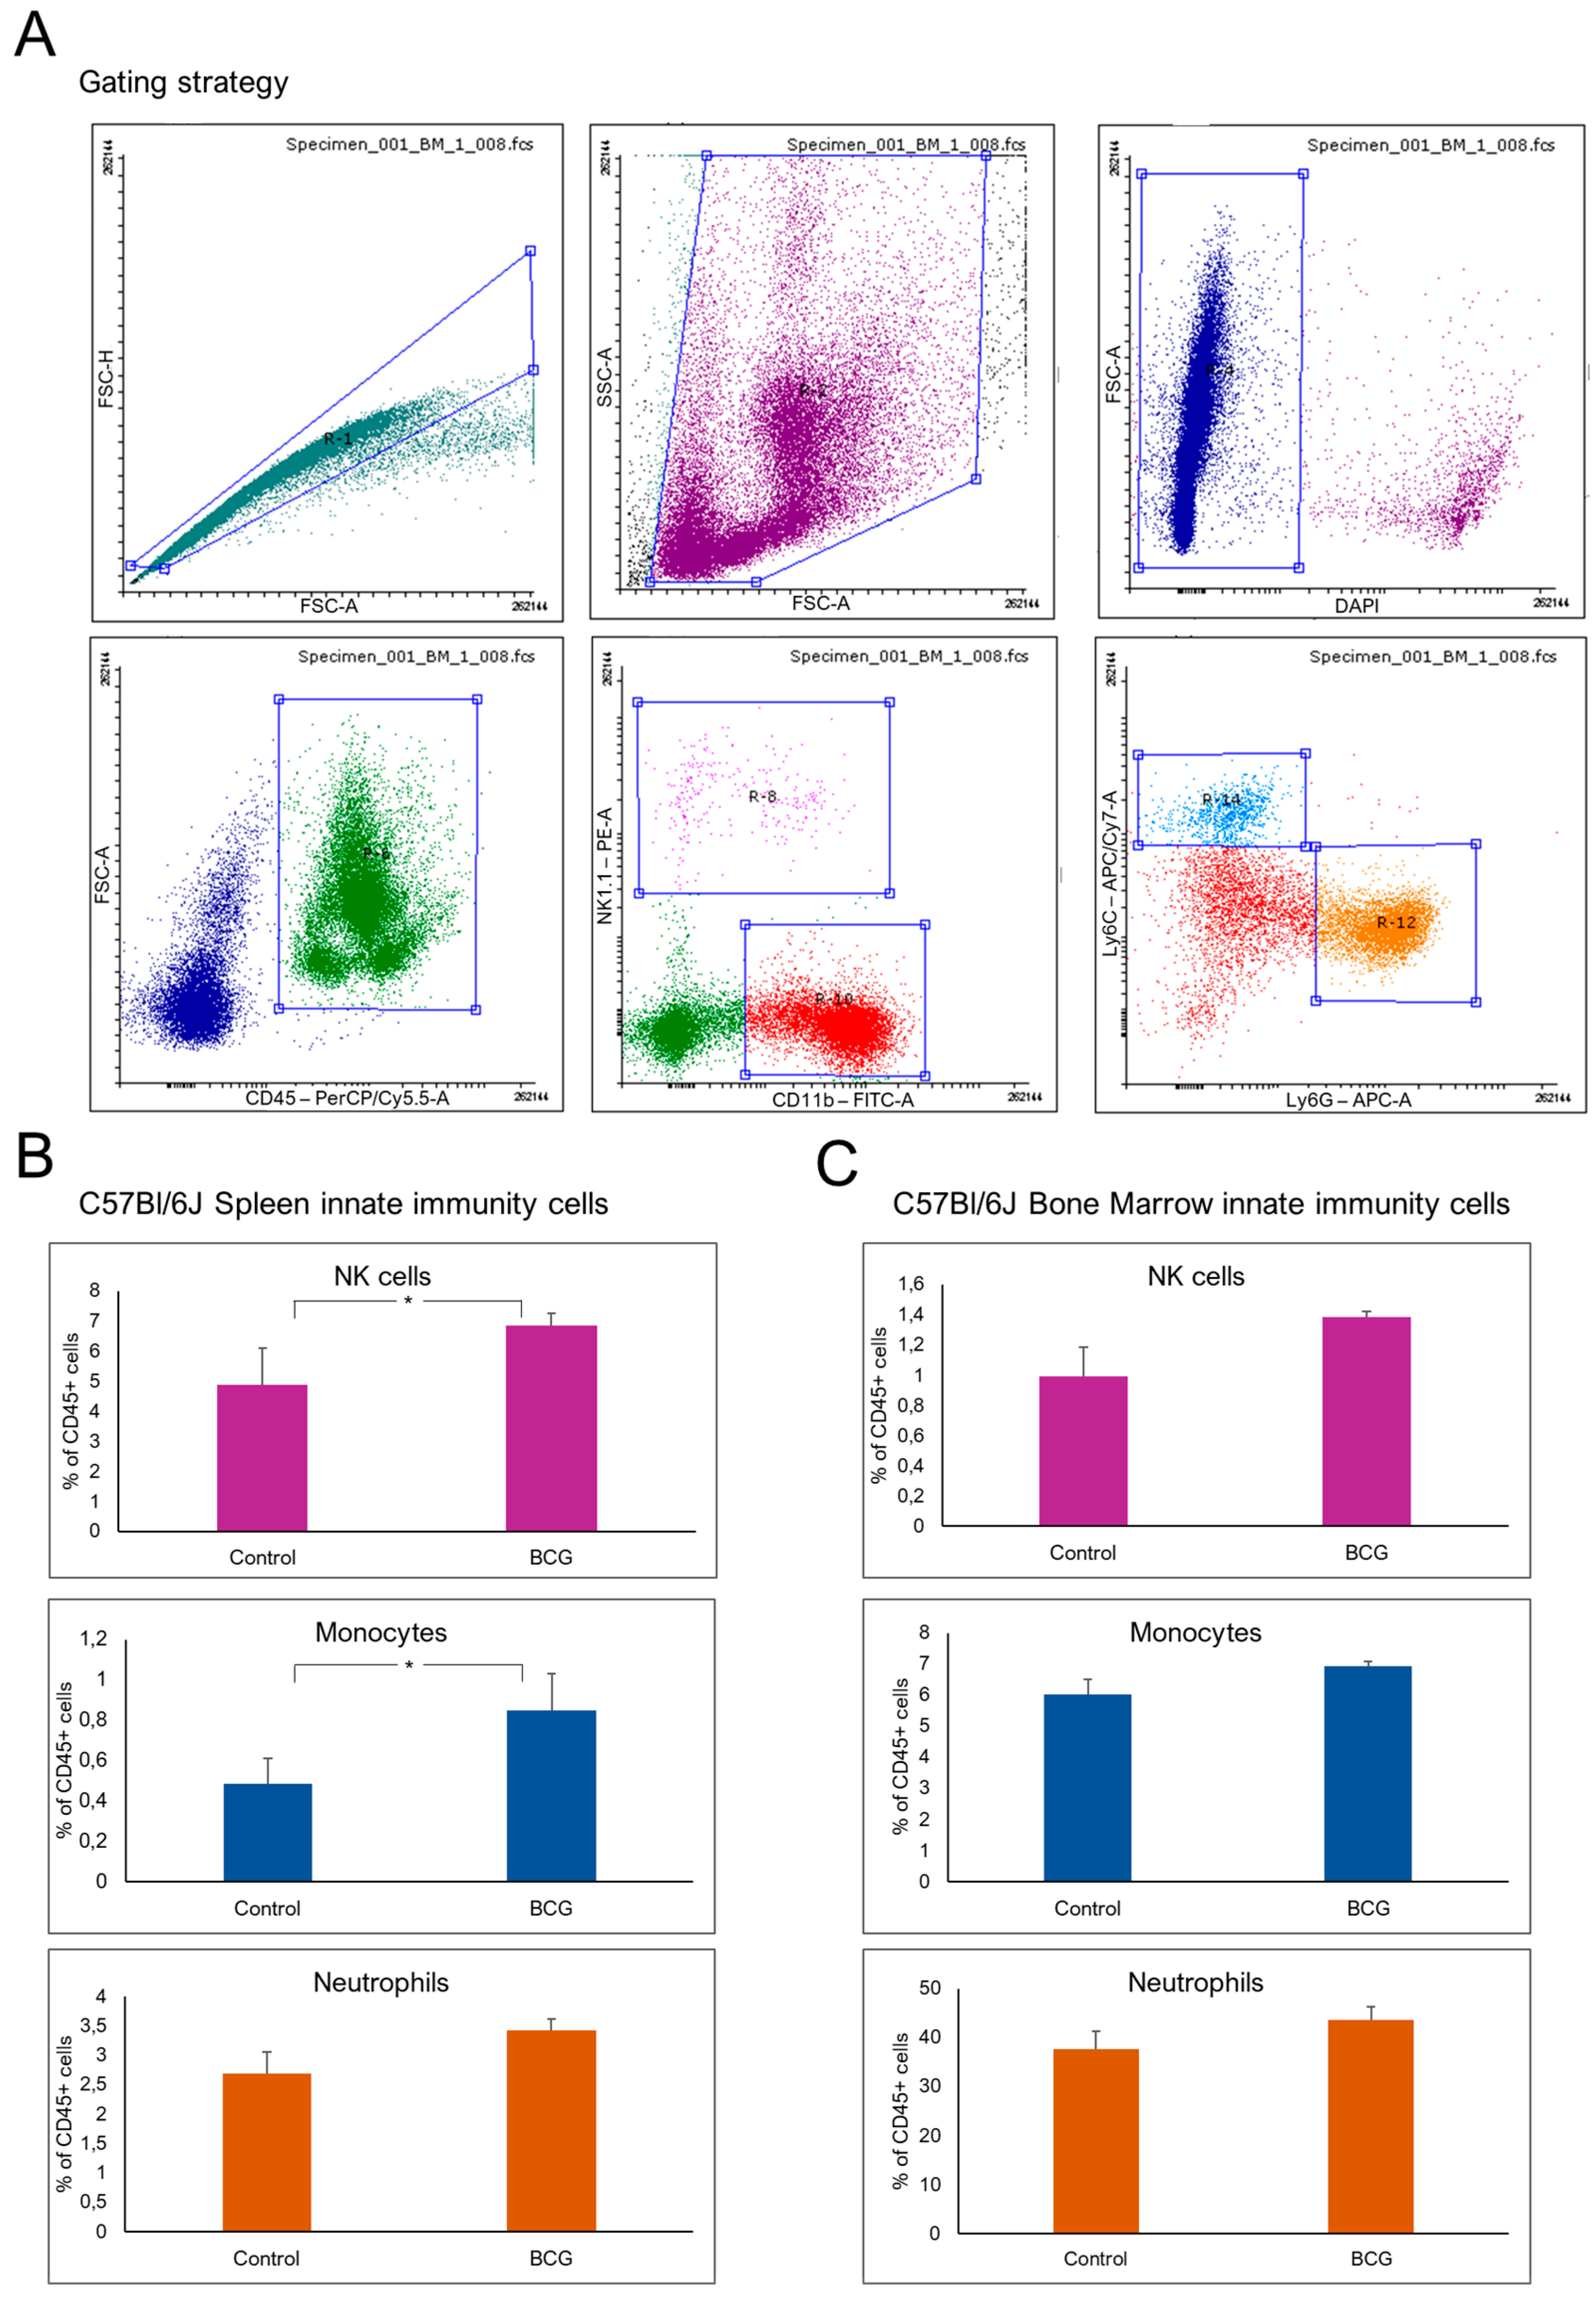
Figure 3.
The analysis of transcriptomic data via DESeq2. A. Principal component analysis (PCA) of the normalized RNAseq data of innate immune cells in response to subcutaneous administration of BCG. B. Volcano plots of DESeq2 results based on RNA-seq analysis of BCG-induced innate immune cells over control. Changes in transcript levels are represented by the log2fc, the log 2 fold change in normalized read counts between the immune populations derived from BCG-vaccinated and control mice, as obtained from DESeq2 analysis [27] (x-axis). The statistical significance of the change is represented as −log 10 P adj (y-axis). Differentially expressed genes (DEGs) are highlighted in red (upregulated) and blue (downregulated) with significant adjusted p-values (padj < 0.05).
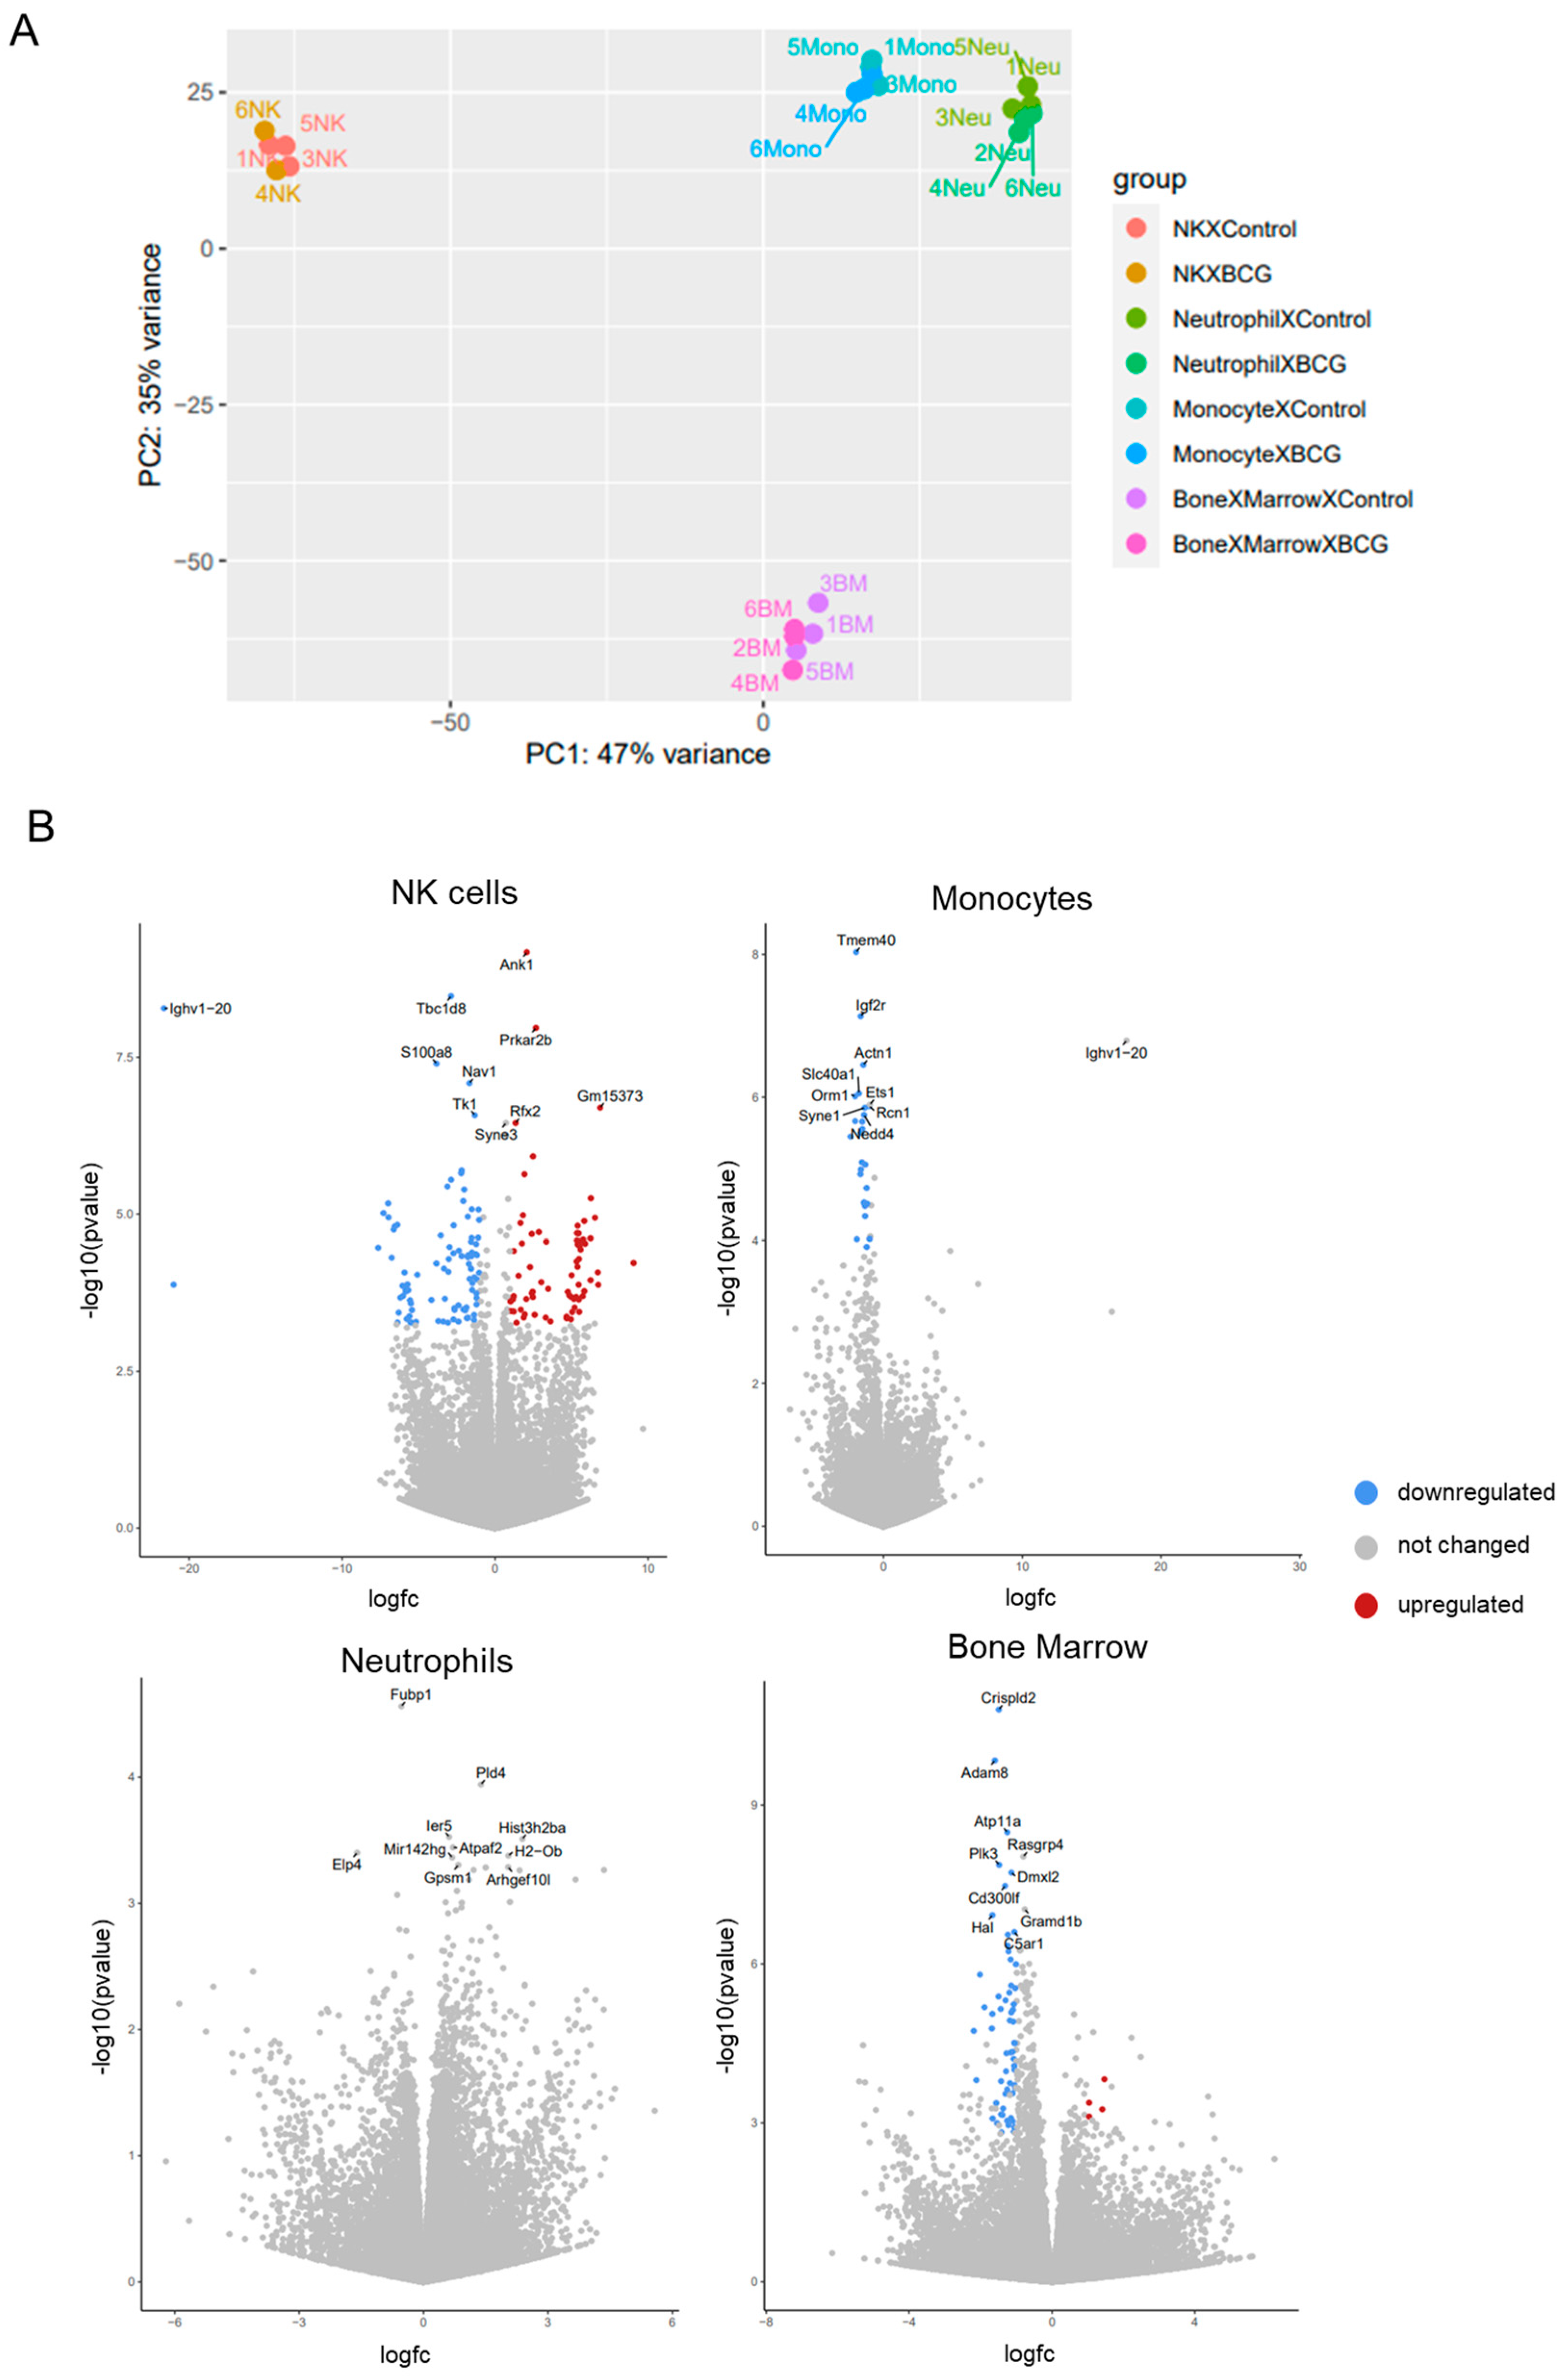
Figure 4.
The functional annotation of the revealed DEGs. A. The functional annotation of 162 DEGs from splenic NK-cells from mice after BCG vaccination was conducted using Metascape web-platform, resulting in the representation of the top 25 terms in a bar plot based on their p-value (log10 scale). B. The functional annotation of 30 DEGs from Bone Marrow Monocytes from mice after BCG vaccination was conducted using Metascape web-platform, resulting in the representation of overall 20 terms in a bar plot based on their p-value (log10 scale). C. The functional annotation of 184 DEGs from bulk Bone Marrow cells from mice after BCG vaccination was conducted using Metascape web-platform, resulting in the representation of top 25 terms in a bar plot based on their p-value (log10 scale).
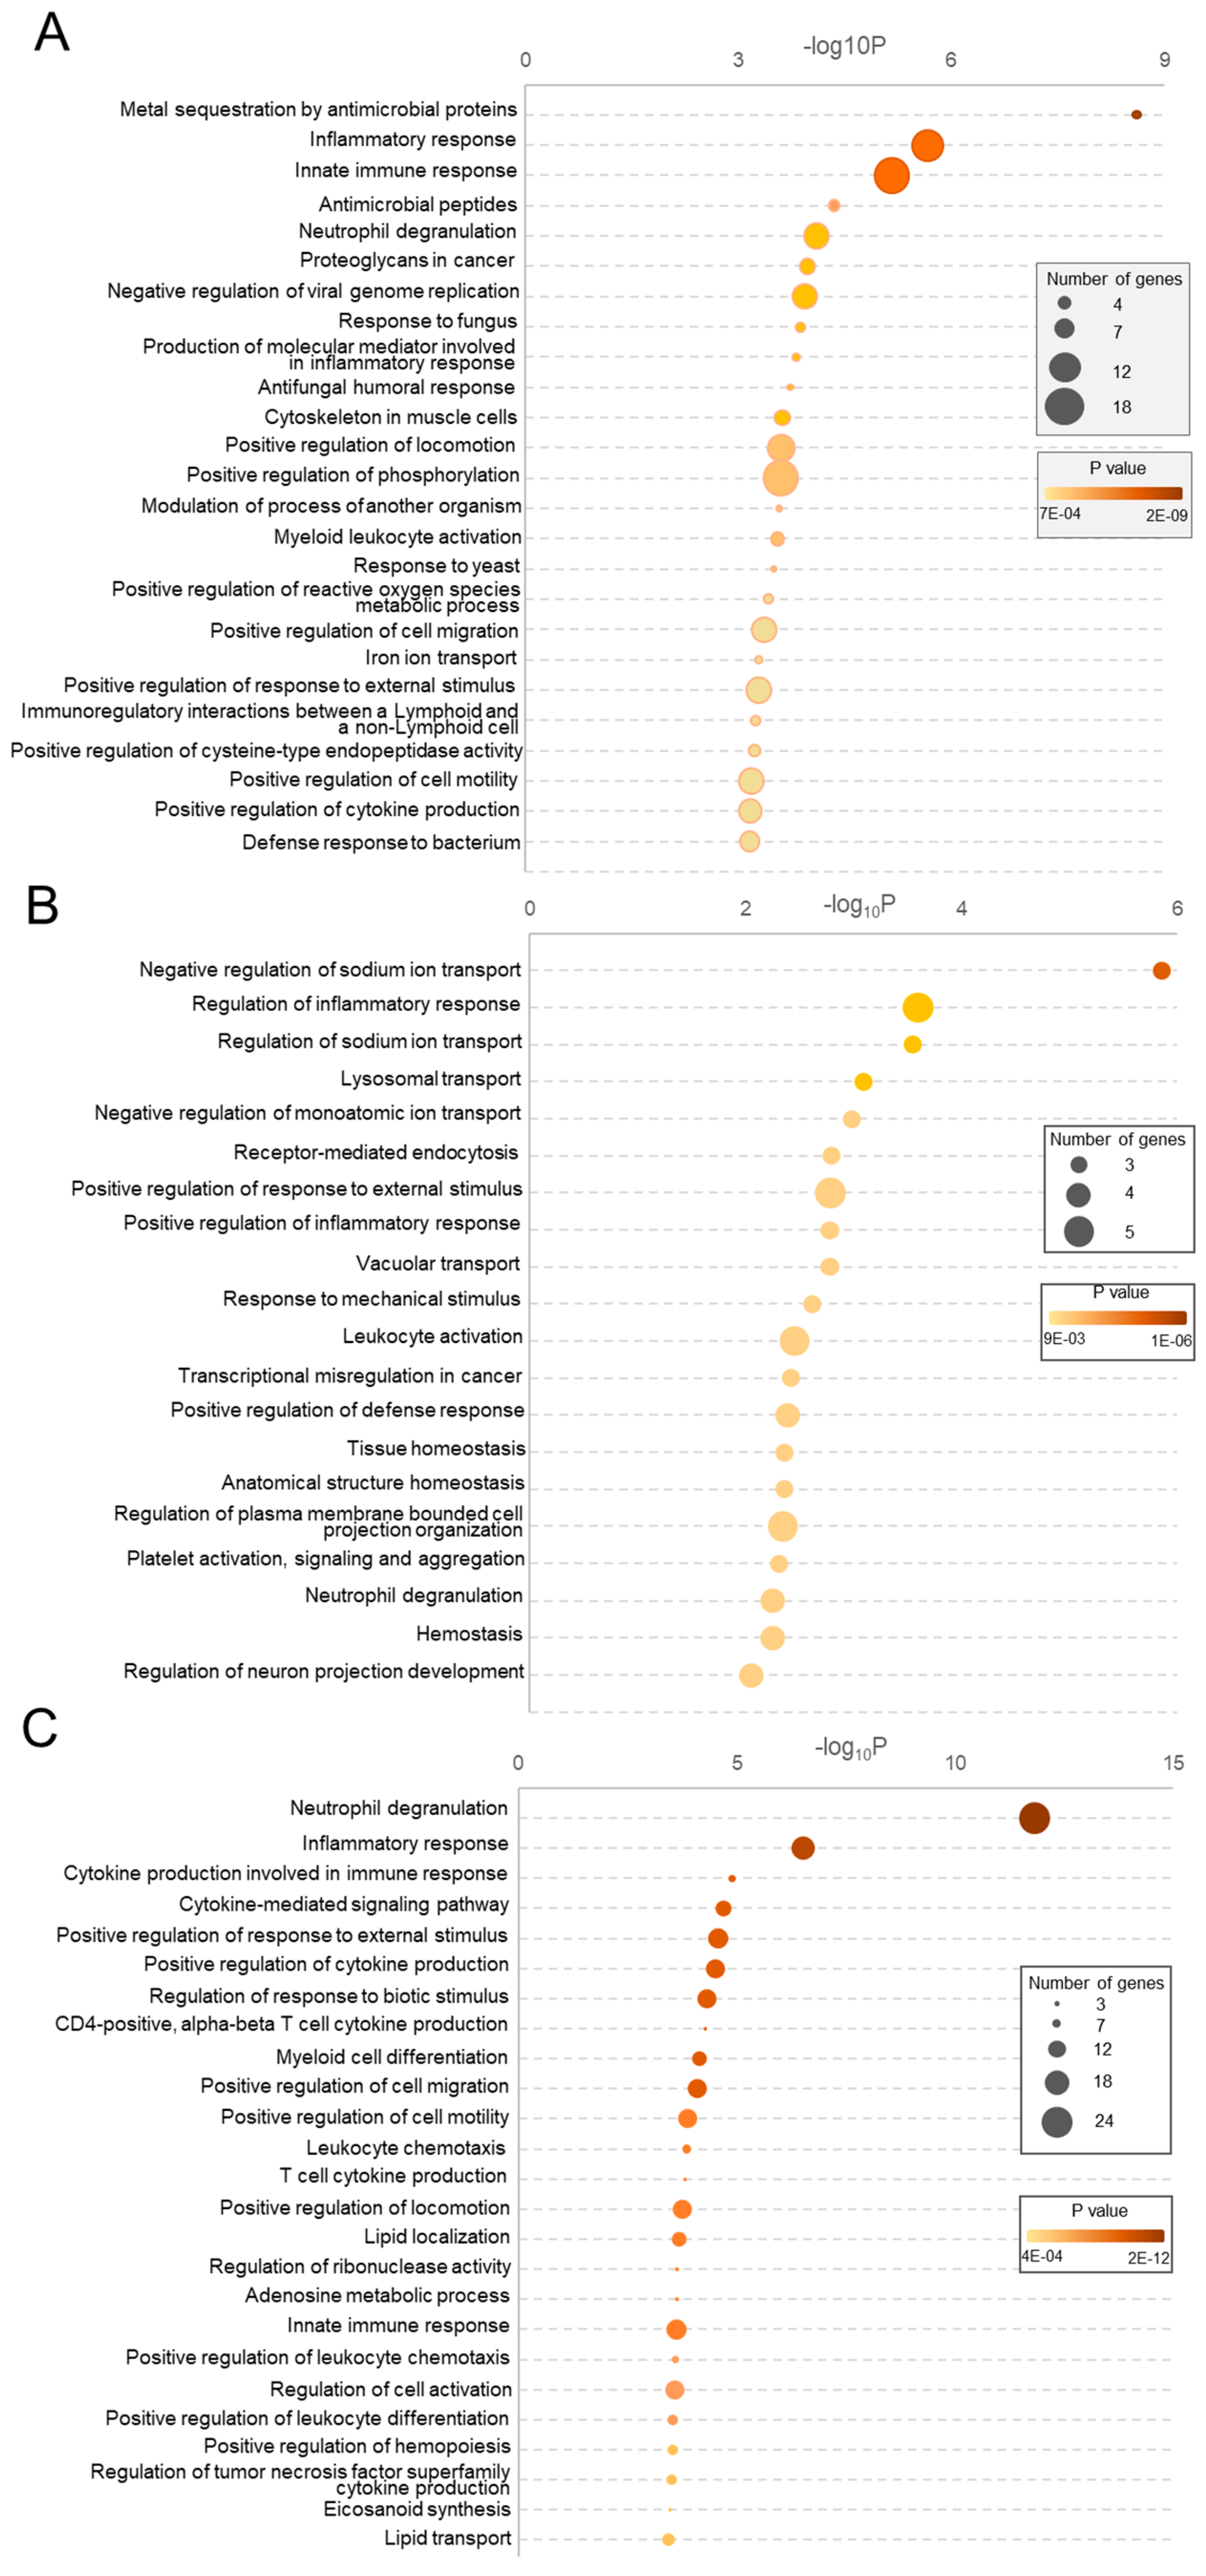
Figure 5.
The analysis of common altered processes. Venn Diagram represents common processes were found for DEGs of NK cells, Monocytes and Bone Marrow after BCG treatment. B. TreeMap visualization of clustered common deregulated processes in NK cells, Monocytes and Bone Marrow after BCG treatment.
Figure 5.
The analysis of common altered processes. Venn Diagram represents common processes were found for DEGs of NK cells, Monocytes and Bone Marrow after BCG treatment. B. TreeMap visualization of clustered common deregulated processes in NK cells, Monocytes and Bone Marrow after BCG treatment.
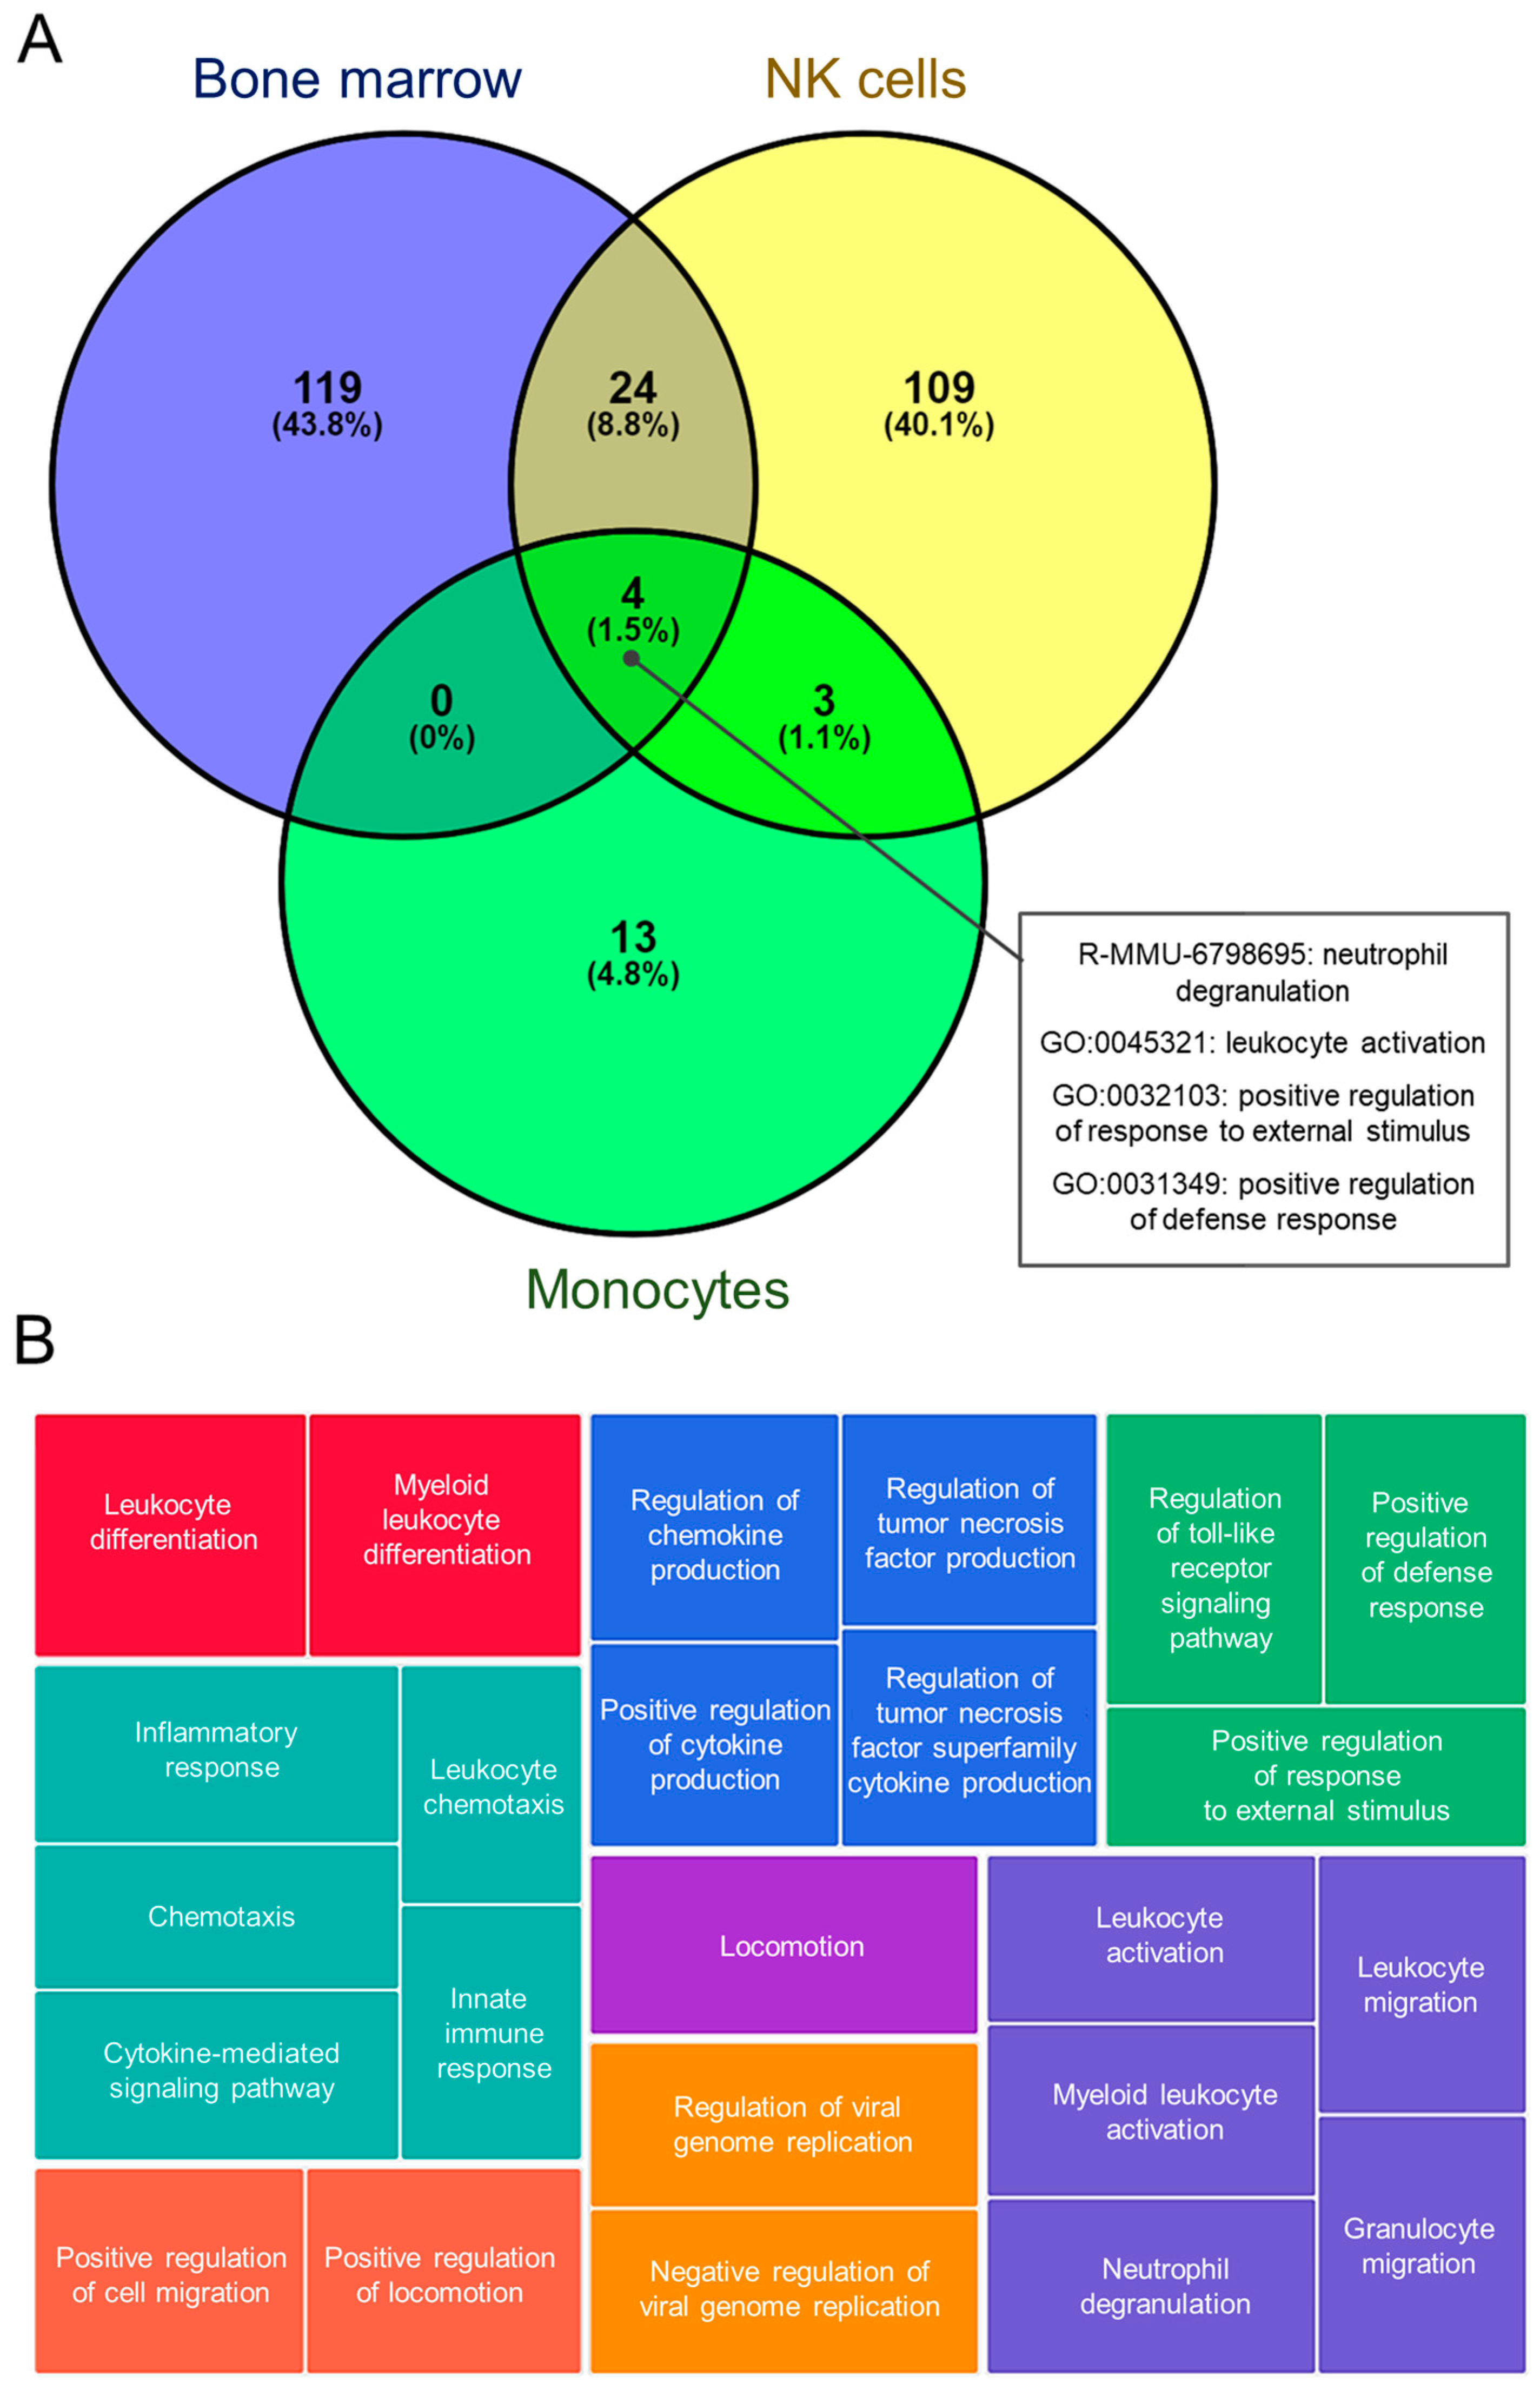
Figure 6.
Analysis of immune ligand and receptor gene expression. The expression levels were extracted from the RNA-seq data and presented as mean TPM (transcripts per million) values with standard deviation bars (y axis) calculated from 3 independent samples. Gene abbreviations: C5ar1, complement C5a Receptor 1; Csf2rb, cytokine receptor common subunit beta; Tnfsf14, tumor necrosis factor superfamily member 14; S100a8, S100 calcium-binding protein A8.


Table 1.
Data quality parameters for each sample.
| Sample | Total number of paired-end reads, mln | Uniquely Mapped Reads, % | Assigned reads, % |
|---|---|---|---|
| 1 NK-Control | 65 162 324 | 83.7 | 44.2 |
| 2 NK-BCG | 48 924 684 | 72.4 | 39.1 |
| 3 NK-Control | 46 873 566 | 84.6 | 42.5 |
| 4 NK-BCG | 64 495 716 | 58.6 | 28.6 |
| 5 NK-Control | 55 366 344 | 82.9 | 46.5 |
| 6 NK-BCG | 74 519 736 | 85.1 | 43.5 |
| 1 Neutrophils-Control | 62 399 420 | 86.6 | 51.9 |
| 2 Neutrophils -BCG | 40 533 212 | 85.6 | 50.3 |
| 3 Neutrophils-Control | 33 291 886 | 87.5 | 52.4 |
| 4 Neutrophils-BCG | 50 416 772 | 85.2 | 51.8 |
| 5 Neutrophils-Control | 62 632 742 | 85.9 | 49.9 |
| 6 Neutrophils-BCG | 96 455 090 | 74.9 | 45.1 |
| 1 Monocytes-Control | 60 950 058 | 83.2 | 52.5 |
| 2 Monocytes-BCG | 82 245 150 | 80.2 | 50.4 |
| 3 Monocytes-Control | 43 105 930 | 79.2 | 52.2 |
| 4 Monocytes-BCG | 29 940 714 | 82.8 | 51.6 |
| 5 Monocytes-Control | 55 015 316 | 83.6 | 52.7 |
| 6 Monocytes-BCG | 61 669 888 | 83.6 | 49.5 |
| 1 Bone Marrow-Control | 63 168 828 | 40.1 | 21.2 |
| 2 Bone Marrow-BCG | 81 364 514 | 38.8 | 17.8 |
| 3 Bone Marrow-Control | 67 743 872 | 53.5 | 28.5 |
| 4 Bone Marrow-BCG | 65 372 628 | 36.8 | 21.1 |
| 5 Bone Marrow-Control | 66 961 914 | 35.9 | 24.8 |
| 6 Bone Marrow-BCG | 39 376 158 | 42.0 | 18.3 |
Disclaimer/Publisher’s Note: The statements, opinions and data contained in all publications are solely those of the individual author(s) and contributor(s) and not of MDPI and/or the editor(s). MDPI and/or the editor(s) disclaim responsibility for any injury to people or property resulting from any ideas, methods, instructions or products referred to in the content. |
© 2024 by the authors. Licensee MDPI, Basel, Switzerland. This article is an open access article distributed under the terms and conditions of the Creative Commons Attribution (CC BY) license (http://creativecommons.org/licenses/by/4.0/).
Copyright: This open access article is published under a Creative Commons CC BY 4.0 license, which permit the free download, distribution, and reuse, provided that the author and preprint are cited in any reuse.


