

Submitted:
01 November 2024
Posted:
01 November 2024
You are already at the latest version
Abstract
The use of neutron reflectors is an effective method for improving the quality of neutron sources and neutron delivery systems. In this work, we further develop the method based on Bragg scattering of neutrons in crystals with large interplanar distances. We compare samples of differently prepared fluorine intercalated graphites by measuring the total cross section for the interaction of neutrons with the samples, depending on the neutron wavelength. The Brag scattering cross section is the dominant part of the total cross section in all the cases. The results show that all samples provide high reflection efficiency over the entire range of the so-called “neutron reflectivity gap” and beyond it, and also allow choosing the optimal intercalation methods.
Keywords:
neutron reflector
; graphites intercalated with fluorine
; Bragg diffraction
1. Introduction
The development of neutron reflectors [1,2,3,4] with high albedo [5] over a wide range of wavelengths is an effective method for increasing neutron fluxes and improving the quality of neutron sources [6,7], which is of great interest for both fundamental and applied research [8,9,10,11,12,13,14,15].
For the neutron reflectors considered in this work, the ranges are of interest, which can be divided roughly as follows: thermal neutrons (TN) (), cold neutrons (CN) (), very cold neutrons (VCN) (), ultracold neutrons (UCN) ().
The development of neutron reflectors is especially interesting for those ranges for which alternative methods had been previously absent or inefficient. In particular, the so-called “neutron reflectivity gap” had existed until recently in the hard part of the VCN range and in the soft part of the CN range (). To overcome this limitation, we have developed two methods.
The first method is based on the huge coherent enhancement of VCN scattering on nanoparticles [16]. The best implementation of this method is fluorinated detonation nano-diamond (F-DND) powders [17,18]. They provide record albedo in a wide range of wavelengths (), however, with a decrease in , the required reflector thickness rapidly increases and reaches values that are difficult to implement in practice. Therefore, for practically acceptable reflector thicknesses, the effective range of F-DND reflectors is better defined as () which coinsides precisely with the VCN range.
The second method is based on Bragg-Wulf scattering [19,20] of neutrons by crystals with large interplanar distances [21]; here, crystals with standard interplane distances are not efficient [22,23]. The best implementation of this method, at present, is graphite powders intercalated with fluorine [24,25]. They provide record albedo and acceptable reflector thickness, at least in the wavelength range (). The advantages of materials of this type are the presence of only carbon and fluorine atoms, which have small neutron capture cross sections, large interplanar distances up to Å, high thermal and chemical compound stability as well as hydrophobic character.
In the case of an isotropic scatterer, the angular distribution of neutrons reflected from the plane of the reflector is close to isotropic in the corresponding angular hemisphere [24,26]. In the case of an anisotropic scatterer [25,27], a large increase in the efficiency of reflection of neutrons incident on the surface of the scatterer at certain angles is possible. However, this increase is accompanied by a large weakening of the efficiency of reflection at other angles. The choice of the reflector is carried out in accordance with the type and parameters of the task. In particular, isotropic scattering of neutrons allows them to be effectively stored in closed volumes [28] and/or extracted preferentially in certain directions [29].
In ref. [24], a dedicated home-made neutron diffractometer was built for measurements of double-differential neutron cross sections of crystals with specific large interlayer distances. The advantage of this method is the possibility of direct and absolute measurement of neutron diffraction cross sections in a wide range of and scattering angles . However, such a measurement requires the construction of this experimental configuration for each such measurement at the PF1B instrument [30] at the ILL, as well as a relatively long time for collecting statistics.
Therefore, we carried out a series of short measurements of neutron transmission through various samples of intercalated graphite with the following goals: to compare the efficiency of neutron scattering depending on the intercalation method and the size of intercalated graphite crystals, to expand the wavelength range of measurements towards larger values, to select the types of samples with which in the next stage full measurements of the double-differential scattering cross section will be performed, similar to those presented in ref. [24].
2. Materials and Methods
2.1. Samples
The following types of graphite fluoride powders were investigated: both commercial from Advance Research Chemicals, Inc. (ARC) company (Catoosa, Oklahoma, USA) denoted ARC series and synthesized at the Institute of Chemistry of Clermont-Ferrand in order to cover different ranges of properties, i.e. chemical composition ( molar ratio), structural type, granulometry and C-F bonding. Most of the samples exhibit covalency for the C-F bonds because of their synthesis with pure elemental fluorine () at high temperature, in the 350-600°C range. The details of the fluorination of graphite are given in the corresponding papers for and [32]. was synthesized with the sample graphite but the temperature was fixed at 420°C in order to increase the fluorine content, x in , x is equal to the molar ratio. These 3 samples constitute the second series. Recently, we focus our effort to prepare graphite fluorides with a high content of phase [24]. FKS450, FNG serie (FNG440, FNG460 and FNG600) were then obtained. Only one sample was prepared at room temperature using a catalytic gaseous mixture , HF and [33]. The sample is denoted RT-GF.
The sample parameters are summarized in Table 1. The data are provided by the provider ARC for the commercial products. For the other graphite fluoride, the ratio and the fraction are extracted from solid state nuclear magnetic resonance (see ref. [24]). The granulometry reported is the one of the starting graphite considering that the value doesn’t change during the fluorination. The interlayer distance are extracted from X-ray diffraction [24] and [33].
The studied samples can be divided into several groups, allowing us to study the efficiency of reflectors depending on the following parameters Pi:
P1. Relative content of carbon and fluorine (the ARC serie) with the same structural type and granulometry;
P2. Fluorine content with the same structural type and granulometry (FNG440, FNG460 and FNG600);
P3. Crystal size (, FKS450, FNG440) with a high content of phase;
P4. Relative content of non-fluorinated graphite (, , ) with the same granulometry;
P5. C-F bonding, i.e. weakened covalence for RT-GF and covalence for , with the same fluorine content and granulometry.
Thereafter, the characterization of the samples will evidence their main characteristics useful for the present work. If the readers need further details, see ref. [24]. The granulometry reported is the one of the starting graphite considering that the value doesn’t change during the fluorination. The interlayer distance are extracted from X-ray diffraction [24,32,33].
2.2. FTIR Measurements
Fourier-transform infrared (FTIR) spectra were recorded on a Nicolet 6700 FT-IR (Thermo scientific) spectrometer in the transmission mode at 4 c resolution, and 256 scans were taken for each spectrum. NMR experiments were carried out with a Bruker Avance spectrometer, with the working frequencies for 13C and 19F equal to 73.4 and 282.2 MHz, respectively. A Magic Angle Spinning (MAS) probe (Bruker) operating with 2.5 mm rotors was used. For MAS spectra, a simple sequence was performed with a single pulse length of 4.0 and 3.5 µs for 19F and 13C, respectively. For MAS measurements, the samples must be fragmented. 13C chemical shifts were externally referenced to tetramethylsilane (TMS), while 19F chemical shifts were referenced with respect to . X-ray diffraction (XRD) patterns were recorded using both a PANalytical X’PERT X-ray reflection diffractometer with a Cu (K) radiation ( Å).
2.3. Characterization and Preparation of the Graphite Fluorides
The first characteristic studied is the fluorine content with the same structure ((CF as revealed by the interlayer distance of 6.2 Å, see Table 1), C-F bonding and granulometry. In order to evidence those properties, FTIR spectra of the ARC series were recorded (Figure 1). The vibration band is observed at around 1200 for all the samples. This wavenumber is typical of covalent C-F bonds [34,35]. In accordance with the XRD data (the interlayer distance of 6.2 Å typical of (CF structural type), the spectra of ARC samples don’t exhibit vibrational bands at 1350 and 940 which are typical of graphite fluoride with high content of phase. Only the ratio changes in the ARC series (Parameter P1).
The vibrational bands of phase at 1350 and 940 are observed for FNG series whatever the fluorination temperature and the fluorine content (Figure 1b). XRD data evidence the interlayer distance of 9.2 Å typical of structural type. The 13C NMR spectra of FNG series are composed of two main lines at 84 and 42 ppm which are assigned to the carbon atoms involved in the covalent C-F bonds (denoted C-F in Figure 1c) and non-fluorinated carbons with hybridization (C-C-F) [32,33,35,36]. C-C-F are present only in the phase. According to the integrated surface of the lines and , the ratio 100 / gives the percentage of structural type. The data are summarized in the Table 1. The fractions are 94, 96 and 67% for FNG440, FNG460 and FNG600, respectively. This series will be used to investigate the effect of ratio for samples with structural type (P2).
The samples and FKS450 have the same characteristics that FNG440 but with a different granulometry. This 3 samples allow the crystal size to be investigated (P3).
Because of the presence of carbon atoms, the FTIR spectra of and are ill-defined and 13C MAS NMR spectra are shown to have the main information, in particular to evidence the graphitic region (Figure 1c). Non-fluorinated carbon atoms, then with hybridization, results in a resonance line in the 120-135 ppm range [32,33,35,36]. The shift in comparison with graphite (120 ppm) is explained by the interaction with C-F bonds in their neighboring. The intensity of the line at 130 ppm decrease with the ratio in the , and series which can be used to study the effect of the residual graphitic region (P4).
RT-GF is the only sample with vibration band of wavenumber different than 1200 , i.e. 1100 which is related to weakened covalent C-F bonds (C—F in Figure 1b, covalent C-F is denoted C-F). The fluorination of graphite at room temperature results in such C-F bonding. RT-GF will be compared with a sample which exhibit the same fluorine content and close fluorine content, i.e. , in order to underline the effect of the C-F bonding (P5).
2.4. Neutron Measurements
For neutron measurements, the following experimental configuration was installed: (1) the primary collimator made it possible to reduce backgrounds in the experimental area, (2) the chopper [31] made it possible to measure the neutron flux depending on the value of , (3) a cassette with samples that could be moved automatically or installed manually, (4) reflection of the neutron beam from the supermirror made it possible to remove the hard part of the neutron spectrum and, thus, avoid overloading of (5) the neutron detector, (6) to further reduce the background, the detector was protected from all sides, except for the direction of propagation of the neutron beam (see Figure 2).
Graphite fluoride powders were poured into cylindrical holders with thin aluminum walls thick. The diameters of half of the holders were , and the other half were . The neutron spectrum incident on the detector was measured with an empty aluminum holder. The probability of beam attenuation by samples was measured as a function of .
2.4.1. Justification for the Choice of Experimental Parameters in Neutron Measurements
The sample thickness was chosen in such a way that, on the one hand, the attenuation of the neutron beam was small () and the probability of multiple neutron scattering in the samples didn’t exceed a few percent, and, on the other hand, it was large enough for the difference in neutron fluxes without/with a sample could be measured with the required statistical accuracy in a reasonable time. Note that the intensity of the incident neutron beam decreases rapidly with increasing , so the statistical accuracy decreases rapidly with increasing . To increase the maximum value corresponding to statistically significant attenuation factors, significant time is required for collecting statistics. Fortunately, as we will see below from the analysis of the results obtained, the maximum value of approximately corresponds to the upper value of the interval of interest to us.
Total cross section for elimination of neutrons from the direct beam consists of the diffraction cross section , absorption cross section , small-angle scattering cross section , incoherent scattering cross section , and inelastic scattering cross section :
The characteristic values of for the samples of graphite fluoride powders are equal to several barn per atom in the range of interest to us as follows from the direct measurements [24]. Compared to , the neutron capture cross section is negligible, since the capture cross sections for carbon and fluorine atoms are small ( and ) and the impurities in the samples are insignificant. In order to reduce the contribution of , we used samples with sufficiently large granules (, a characteristic SANS angle is ) and the angular acceptance of the detector was sufficiently large (). Moreover, we verified experimentally that placing the sample closer to the detector and moving it from the position upstream the supermirror to the position downstream the supermirror does not lead to a significant change in the result in the range of interest. values are negligible for carbon and fluorine. values for the particular types of crystals are not known but their typical values are significantly smaller than .
That is, we have reason to believe that measuring is a good way to estimate for the particular samples and conditions used. However, we do not claim to accurately measure using the neutron transmission method. Nevertheless, the trends emerging from comparisons of different analogous samples with a gradually changing parameter are reliable.
2.4.2. Neutron Spectrum Shaping and Wavelength Calibration
The measured spectrum of neutrons without a sample and after the m=3 spectrum shaping supermirror is shown in Figure 3. The decrease in intensity for neutron wavelengths less than ∼ 6 Å is due to the passage of neutrons through the m=3 supermirror and their subsequent absorption. The decrease in intensity for neutron wavelengths greater than ∼ 6 Å is due to their deficiency in the initial neutron beam, as well as their suppression due to the angular collimation of the neutron beam. The spectrum is specially shaped to cover the range of our interest and reduce the background.
To calibrate the wavelength scale of the experimental setup the well-known Bragg edges of aluminium at and were used. To this extent the transmission of a cm aluminium cylinder was measured. The calculated cross section is used to calibrate the wavelength scale.
3. Results
Total cross-sections of neutron interaction with intercalated graphite samples are shown in Figure 4a,b.
3.1. Total Cross-Section Versus Fluorine Content for
Comparison of results for different samples from the ARC series (see Table 1) allows to assess the impact of relative content of carbon and fluorine. Grain size is the same: 1-45 m. Inter-plane distance is the same: 6.2 Å. Structural type is the same: . F/C ratio varies from 1.01 (ARC3) to 0.01 (ARC8). Cross sections increase consistently with increasing F/C ratio in the studied range (0.01-1.01).
3.2. Total Cross-Section Versus Fluorine Content for
Comparison of the samples FNG440, FNG460 and FNG600 allows to assess the impact of the fluorine content. Structural type is the same: (. Granulometry is the same: 200-400 . Inter-plane distances are the same: 9.2 Å. ( from 95% (FNG440, FNG460, i.e. 5% of (CF phase) to 67% (FNG600, 33% of (CF phase). Cross sections decrease with increasing of the content of (CF phase in the studied range (5-33%).
3.3. Total Cross-Section Versus Crystal Size
Comparison of the samples , FKS450 and FNG440 allows to assess the impact of crystal size. In all these samples, the content of is high. No net tendency at shorter wavlengths is observed in the range ( for , for FKS450, while a drop in efficiency is present for larger sizes: for FNG440). The later is apparently due to screening of Bragg scattering in "too large" crystal sizes. Another manifestation of the screening effect is the suppression of cross sections at about 13 Å for FKS450 compared to . This observation allows us to shift the "optimum" crystal size, in the linear approximation, from 44 (FKS450) to ∼ 30 .
3.4. Total Cross-Section Versus Content of Non-Fluorinated Graphite
Comparison of the samples , , allows to assess the impact of relative content of non-fluorinated graphite. The composition can be expressed as: (CF)0.51, (CF)0.61 and (CF)0.71, respectively. Grain sizes are the same, i.e. 7.5 . High graphitic phase content corresponds to noticeably better performance in the studied range (0.29-0.49). This might be a result of the combination of two efficient types of scattering: in graphite at shorter neutron wavelengths and in intercalated graphite at longer neutron wavelengths.
3.5. Total Cross-Section Versus C-F Bonding
Comparison of the samples and RT-GF allows to assess the impact of C-F bonding, i.e. weakened covalence for RT-GF and covalence for . Fluorine content is the same, and grain sizes are the same. The sample with covalent C-F bonds shows a better performance than RT-GF with weakened covalence.
3.6. Wavelength Dependence of Total cross Sections
For all samples studied, the total interaction cross sections increase over the entire range of wavelengths of interest (6-20 Å , Figure 4). This observation is in good agreement with the conclusions of the paper [24], in which this range of neutron wavelengths, however, was not investigated experimentally at the largest wavelengths. The largest cross-section values, as well as the fastest growth of cross-sections with increasing neutron wavelength, are observed for samples with the largest inter-planar distances.
4. Discussion
As noted in the introduction, we performed a series of measurements of the probability of transmitting a neutron beam through various samples of fluorine-intercalated graphite. The wavelength range of the formed neutron beam completely covered the range of the so-called gap in the effective reflectivity of neutron reflectors. For the samples chosen and the measurement parameters, the main part of the total cross section was the diffraction cross section on the crystal lattice.
The properties of the samples were chosen in such a way as to allow an experimental study of the cross-section values depending on several important parameters (neutron wavelength, crystal size in the powder, intercalation type, fluorine content, non-fluorinated graphite content, C-F bonds, etc). Theoretical study of these cross-sections is practically impossible, since it involves precise knowledge of the structure of each sample and requires a fairly complex theoretical calculation. Direct experimental measurement of the neutron diffraction cross-section on all samples in the required range of neutron wavelengths is also unrealistic due to the fact that it requires the construction of a specialized diffractometer (for example, as described in the work [24]), as well as a very long measurement (due to a sharp decrease in statistics for large neutron wavelengths).
Therefore, the strategy we have chosen seems optimal and the only possible one: (1) draw qualitative conclusions about the properties of the samples based on measurements of the total cross-sections, then (2) prepare a few samples, which seem optimal to us based on these conclusions; (3) measure quantitatively the diffraction cross-sections using a specialized diffractometer [24]. The main conclusions are given below.
5. Conclusions
We have studied for the first time the total cross sections of neutron interactions with different samples of intercalated graphite in the entire range of wavelengths covering the so-called reflectivity gap. Since the main part of the total cross section under the specific experimental conditions is the neutron diffraction cross section on the crystal lattice, and also because we compared samples that differ in one parameter (i.e. fluorination rate with (CF)n structural type, relative content of residual graphitic phase, relative content of ( phase, C-F bonding, crystal size), we believe that the qualitative conclusions about the behavior of the diffraction cross sections are sufficiently reliable. In particular, we have experimentally confirmed for the first time the increase in diffraction cross sections with increasing neutron wavelength in the entire range corresponding to the reflectivity gap, including that part of this range that was inaccessible to the measurements [24]. Particularly rapid growth and large values are observed for samples with large inter-planar distances (high content of ( phase). An optimum type of intercalation corresponds approximately to the sample. No net impact of crystal size on the cross sections for shorter wavelengths is observed in the range , while it drops down at the crystal size of , due to screening of Bragg scattering by "too big" crystals. A relative suppression of cross sections above 13 Å for the FKS450 sample allows us to estimate, in the linear approximation, that the suppression would vanish for the entire range of wavelength interest at the crystal size of ∼ 30 . As larger grain sizes allow a larger volume density our current "optimum" reflector should consists of powder with covalent bonds, or around these parameters. ( phase is an intermediate compound which can be described as a stage 2 covalent F-GICs. Its synthesis with molecular fluorine results often in the coexistence with either a residual graphitic phase or a (CF phase (the presence of both is possible), if the fluorination duration is insufficient and/or the temperature not optimal. Typical cases in our study are (( + (CF)n) and (( + (CF)n)). Our measurements show that it is preferable to keep the graphitic phase rather than (CF)n for reflector design, despite the lower fluorination rate. In other words, the content of (CF)n phase must be minimized. Both the location (core-shell or homogeneous) and the size of the residual graphitic phases must be optimized in order to enhance the reflection.
Author Contributions
Conceptualization, M.D. and V.N.; methodology, V.C., M.D. and V.N.; software, V.C.; validation, V.C., M.D. and V.N.; formal analysis, V.C.; investigation, B.C., V.C., M.D., K.H., V.N. and E.P.; resources, M.D. and V.N.; data curation, V.C.; writing—original draft preparation, V.C., M.D. and V.N.; writing—review and editing, V.C., M.D. and V.N.; visualization, V.C.; funding acquisition, M.D. and V.N. All authors have read and agreed to the published version of the manuscript.
Funding
This research was funded by the ANR-20-CE08-0034 grant, France.
Data Availability Statement
Neutron data were obtained from experiment TEST-3370 at the PF1B [30] instrument at the ILL, Grenoble, France.
Conflicts of Interest
The authors declare no conflicts of interest.
References
- Perrin, F. Calcul relatif aux conditions eventuelles de transmutation en chaine de l’uranium. Compt. Rend. 1939, 208, 1394–1396.
- Fermi, E.; Zinn, W.H. Reflection of neutrons on mirrors. Phys. Rev. 1946, 70, 103.
- Marguet, S. Neutron Reflectors. In The Physics of Nuclear Reactors; Springer: New York, NY, USA; 2018, pp. 919-990.
- Fermi, E. A Course in Neutron Physics. In Collected Papers; The University of Chicago Press: Chicago, IL, USA, 1965.
- Amaldi, E.; Fermi, E. On the absorption and the diffusion of slow neutrons. Phys. Rev. 1936, 50, 899-–928.
- Fermi, E. Experimental production of a divergent chain reaction. Amer. J. Phys. S. 1952, 20, 536 . [CrossRef]
- Ageron, P. Cold neutron sources at ILL. Nucl. Instr. Meth. A 1989, 284, 197–199.
- Halpern, I.; Fermi, E. Neutron Physics. s.l. : Los Alamos, 1946.
- Sears, V.F. Neutron Optics. New York – Oxford : Oxford Univ. Press, 1989.
- Willis, B.T.M.; Carlile, C.J. Experimental Neutron Scattering. Oxford : Science, 2009.
- Furrer, A.; Mesot, J.; Strassle, Th. Neutron Scattering. In Condensed Matter Physics, London, World Scientific, 2009.
- Esposito, S.S.; Pisanti, O. Neutron Physics for Nuclear Reactors. Unpublished. Writings by Enrico Fermi. London : World Scientific, 2010.
- Dubbers, D.; Schmidt, M.G. The neutron and its role in cosmology and particle physics. Rev. Mod. Phys. 2011, 83, 1111 . [CrossRef]
- Wietfeldt, F.E.; Greene, G.L. Colloquium: the neutron lifetime. Rev. Mod. Phys. 2011, 83, 1173 . [CrossRef]
- Nesvizhevsky, V.V.; Villain, J. The discovery of the neutron and its consequences (1930–1940). Compt. Rend. Phys. 2017, 18, 592–600 . [CrossRef]
- Nesvizhevsky, V.V. Interaction of neutrons with nanoparticles. Phys. At. Nucl. 2002, 65, 400–408.
- Nesvizhevsky, V.V.; Koester, U.; Dubois, M.; Batisse, N.; Frezet, L.; Bosak, A.; Gines, L.; Williams, O. Fluorinated nanodiamonds as unique neutron reflector. Carbon 2018, 130, 799–805.
- Lychagin, E.V.; Dubois, M.; Nesvizhevsky, V.V. Powders of Diamond Nanoparticles as a Promising Material for Reflectors of Very Cold and Cold Neutrons. Nanomaterials 2024, 14, 387.
- Bragg,W.H.; Bragg,W.L. The reflection of X-rays by crystals. Proc. R. Soc. Lond. A 1913, 88, 428-–438.
- Mitchell, D.P.; Powers, P.N. Bragg Reflection of Slow Neutrons. Phys. Rev. 1936, 50, 486-–487.
- Dubois, M.; Bosak, A.; Le Floch, S.; Nesvizhevsky, V.V.; Pischedda, V.; Vigolo, B.; et al. Reflecteurs de neutrons lents utilisant des nanodiamants et graphite fluores. ANR-20-CE08-0034.
- Anderson, H.L.; Fermi, E.; Marshall, L. Production of low energy neutrons by filtering through graphite. Phys. Rev. 1946, 70, 815-–817.
- Egelstaff, P.A.; Pease, R.S. The design of cold neutron filters. J. Sci. Instrum. 1954, 31, 207.
- Nesvizhevsky, V.V.; Henry, K.; Dauga, L.; Clavier, B.; Le Floch, S.; Lychagin, E.; Muzychka, A.; Nezvanov, A.; Pischedda, V.; Teander, C.; Turlybekuly, K.; Radescu, S.; Vigolo, B.; Cahen, S.; Herold, C.; Ghanbaja, J.; Zhernenkov, K.; Dubois, M. Poly(dicarbon monofluoride) (C2F)n bridges the neutron reflectivity gap. Carbon 2024, 227, 119249(1-11).
- Henry, K.; Colin, M.; Chambery, G.; Vigolo, B.; Cahen, S.; Herold, C.; Nesvizhevsky, V.V.; Le Floch, S.; Pischedda, V.; Chen, S.; Dubois, M. Flexible fluorinated graphite foils with high content of (C2F)n phase for slow neutron reflector. Dalton 2024, 53, 9473-9481.
- Nesvizhevsky, V.V.; Lychagin, E.V.; Muzychka, A.Y.; Strelkov, A.V.; Pignol, G.; Protasov, K.V. The reflection of very cold neutrons from diamond powder nanoparticles. Nucl. Instr. Meth. A 2008, 595, 631-636.
- Nesvizhevsky, V.; Cubitt, R.; Lychagin, E.; Muzychka, A.; Nekhaev, G.; Pignol, G.; Protasov, K.; Strelkov, A. Application of Diamond Nanoparticles in Low-Energy Neutron Physics. Materials 2010, 3, 1768-1781.
- Lychagin, E.V.; Muzychka, A.Y.; Nesvizhevsky, V.V.; Pignol, G.; Protasov, K.V.; Strelkov, A.V. Storage of very cold neutrons in a trap with nano-structured walls. Phys. Lett. B 2009, 679, 186-190.
- Chernyavsky, S.M.; Dubois, M,; Korobkina, E.; Lychagin, E.V.; Muzychka, A.Y.; Nekhaev, G.V.; Nesvizhevsky, V.V.; Nezvanov, A.Y.; Strelkov, A.V.; Zhernenkov, K.N. Enhanced directional extraction of very cold neutrons using a diamond nanoparticle powder reflector. Rev. Sci. Instr. 2022, 93, 123302.
- Abele, H.; Dubbers, D.; Hase, H.; Kleun, M.; Knopfler, A.; Kreuz, M.; Lauer, T.; Markisch, B.; Mund, D.; Nesvizhevsky, V.V.; Petoukhov, A.; Schmidt. C.; Schumann, M.; Soldner, T. Characterization of a ballistic supermirror neutron guide. Nucl. Instr. Meth. A 2006, 562, 407–417.
- Roulier, D.; Nesvizhevsky, V.V.; Clement, B.; Freche, G.; Pignol, G.; Rebreyend, D.; Vezzu, F.; Baessler, S.; Strelkov, A. Design and test of a compact and high-resolution time-of-flight measurement device for cold neutron beams. Phys. Rev. Accel. Beams 2019, 22, 032801.
- Dubois, M.; Giraudet, J.; Guérin, K.; Hamwi, A.; Fawal, Z.; Pirotte, P.; Masin, F. EPR and Solid-State NMR Studies of Poly(dicarbon monofluoride) (C2F)n. J. Phys. Chem. B 110, 2006, 11800–11808.
- Dubois, M.; Guerin, K.; Pinheiro, J. P.; asin, F.; Fawal, Z.; Hamwi, A. NMR and EPR studies of room temperature highly fluorinated graphite heat-treated under fluorine atmosphere Carbon, 42, 2004, 1931-1940.
- Mallouk, T.; Hawkins, B. L.; Conrad, M. P.; Zilm, K.; Maciel, G. E.; Bartlett, N.; Raman, infrared and n.m.r. studies of the graphite hydrofluorides CxF1-delta(HF)delta (2 < x < 5) Philos. Trans. R. Soc. 1985, 314, 179.
- Giraudet, J.; Dubois, M.; K. Guérin, Delabarre, C.; Hamwi, A.; Masin, F. Solid-State NMR Study of the Post-Fluorination of (C2.5F)n Fluorine. J. Phys. Chem. B 111, 2007, 14143-14151.
- Touhara, H.; Kadono, K.; Fujii, Y.; Watanabe, N. On the Structure of Graphite Fluoride. Z. Anorg. Allg. Chem. 544, 1987, 7–20.
Figure 1.
Infrared spectra (ATR mode) of ARC series (a) and of the other graphite fluoride (b); 13C MAS NMR spectra of a selected samples (the spinning rate of 10 KHz).
Figure 1.
Infrared spectra (ATR mode) of ARC series (a) and of the other graphite fluoride (b); 13C MAS NMR spectra of a selected samples (the spinning rate of 10 KHz).
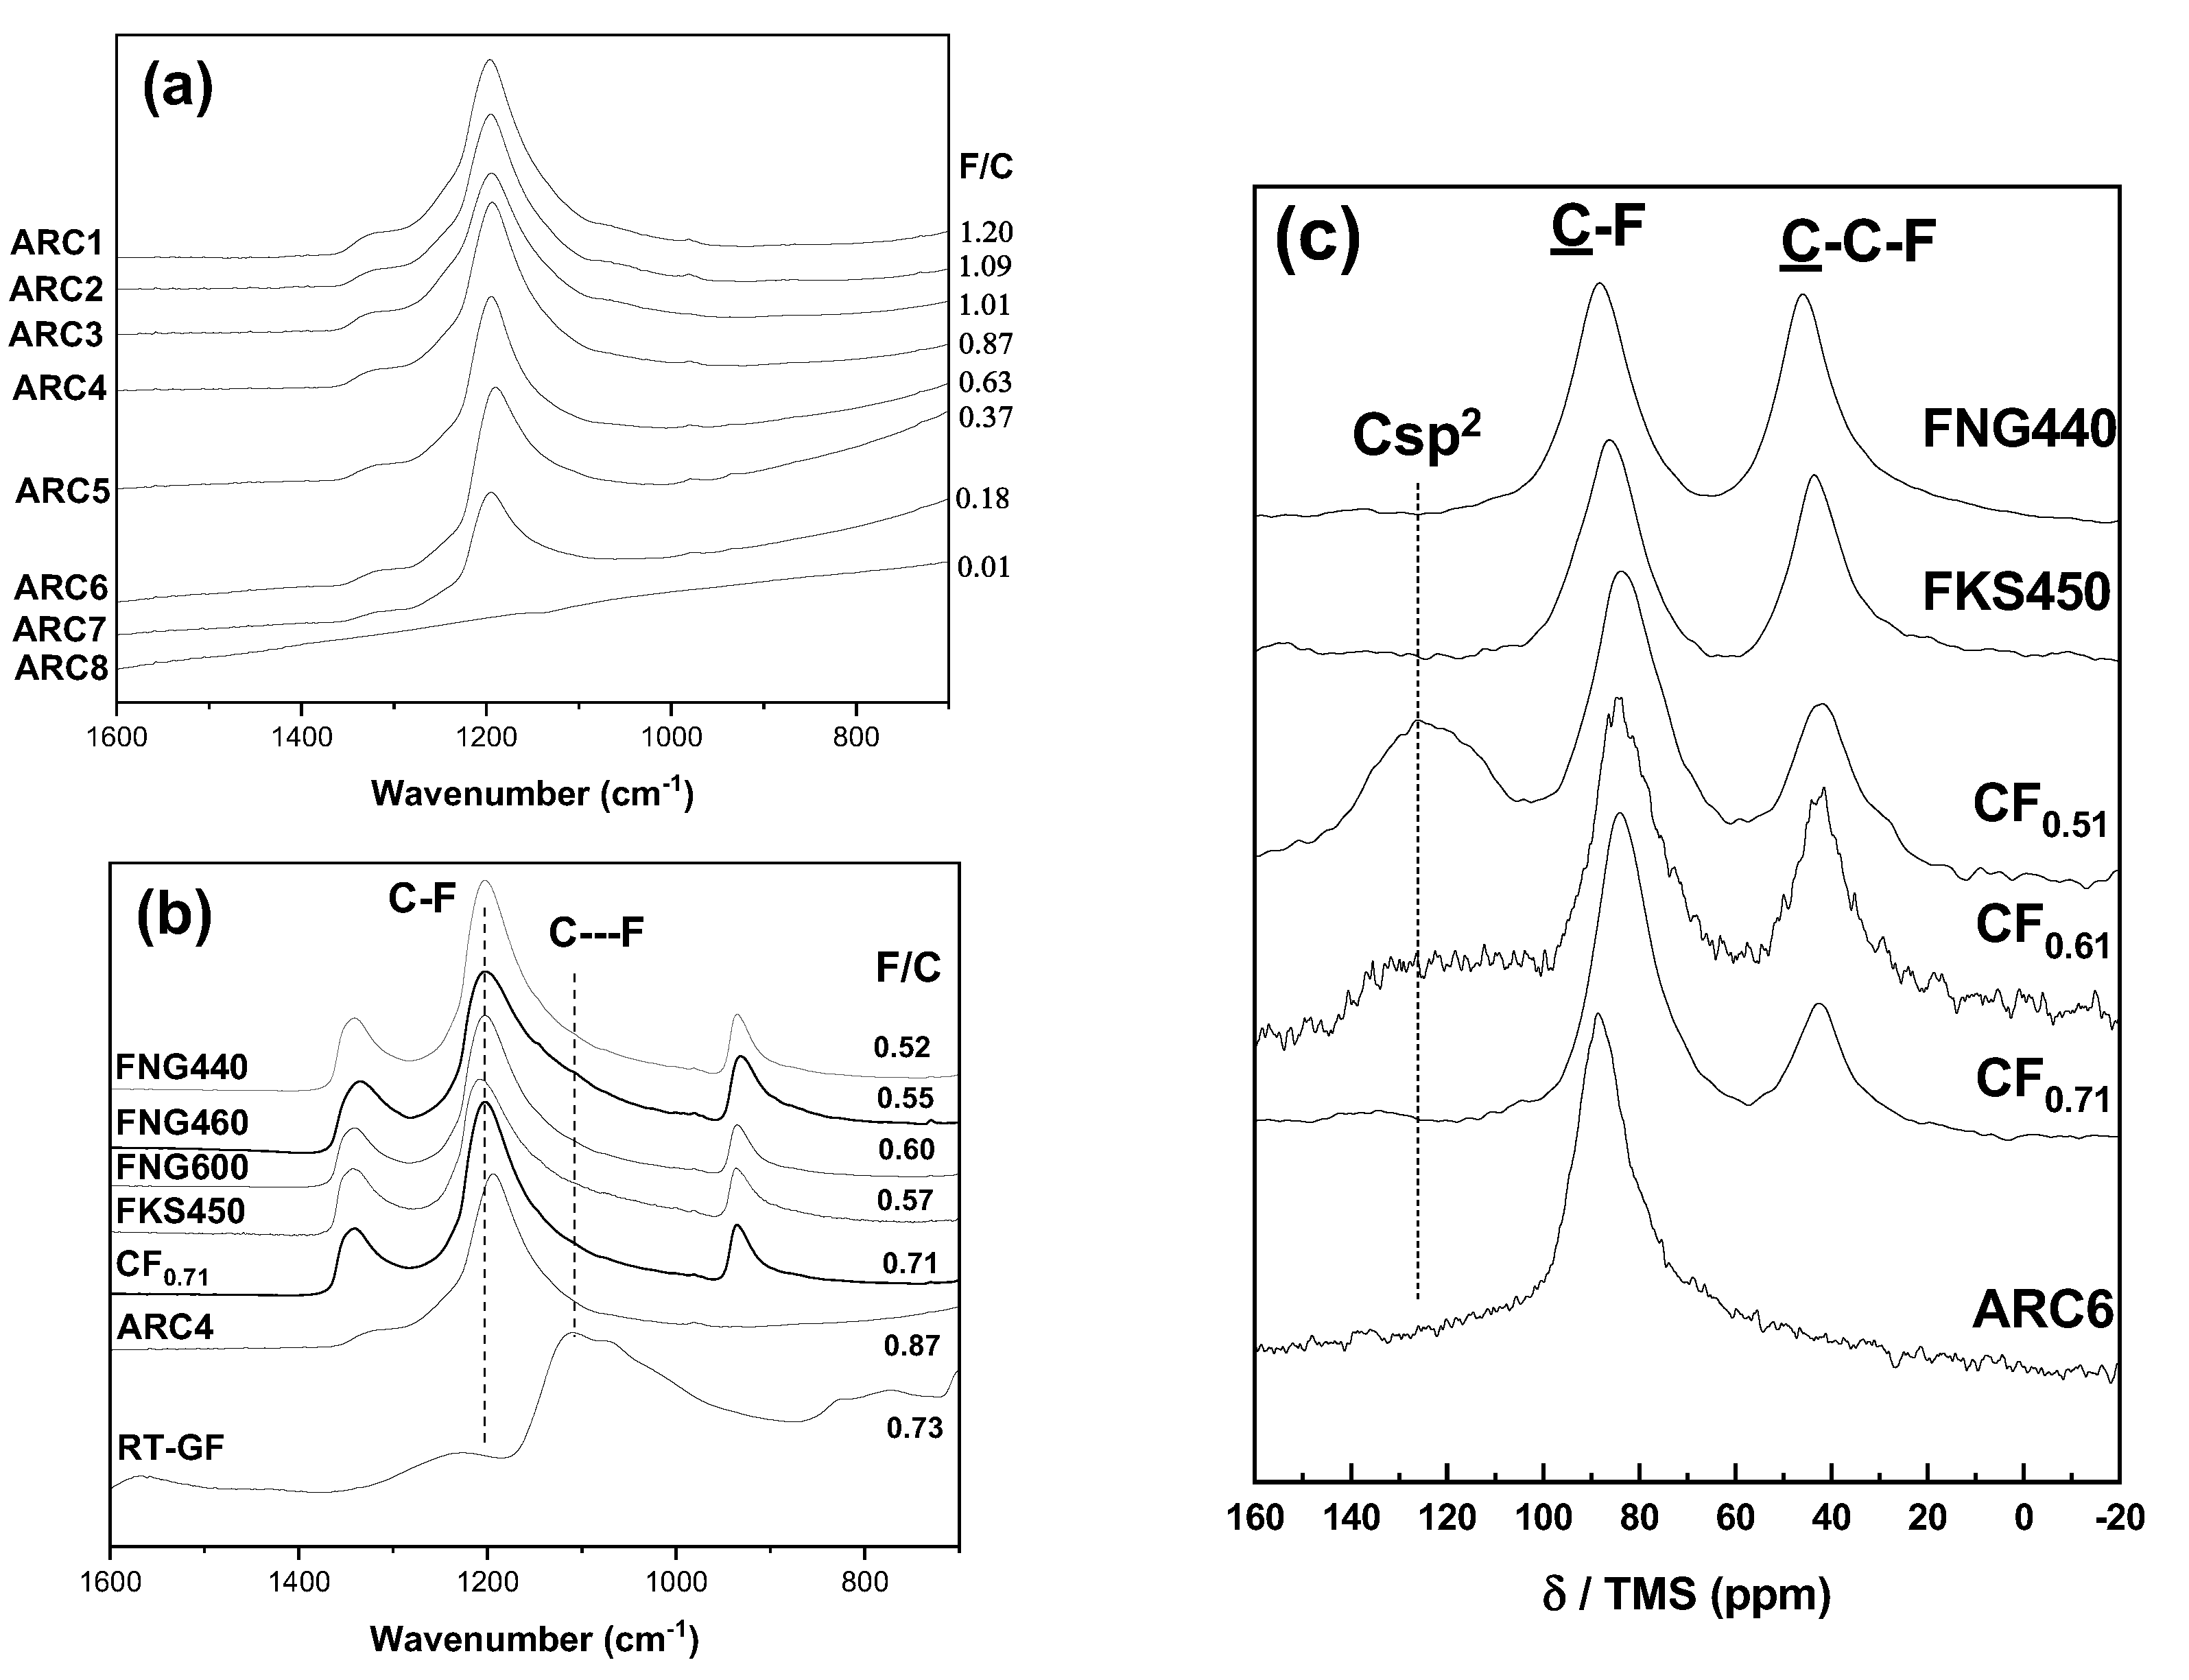
Figure 2.
Outline of the experimental setup at the PF1B instrument. The cold neutron beam enters from the ballistic supermirror ballistic guide H113 on the left and passes through the collimation system containing a series of decreasing apertures in vacuum. When entering the experimental zone the beam passes through a disc chopper followed by a monitor and the sample. An supermirror behind the sample provides a cut-off wavelength of about 5 Å and allows to significantly reduce background in the thermal neutron range due to a non-negligible transmission through the chopper disk. The detector was a 3He-counter with almost 100 % efficiency. A translation stage allows to scan through up to 8 samples per run.
Figure 2.
Outline of the experimental setup at the PF1B instrument. The cold neutron beam enters from the ballistic supermirror ballistic guide H113 on the left and passes through the collimation system containing a series of decreasing apertures in vacuum. When entering the experimental zone the beam passes through a disc chopper followed by a monitor and the sample. An supermirror behind the sample provides a cut-off wavelength of about 5 Å and allows to significantly reduce background in the thermal neutron range due to a non-negligible transmission through the chopper disk. The detector was a 3He-counter with almost 100 % efficiency. A translation stage allows to scan through up to 8 samples per run.
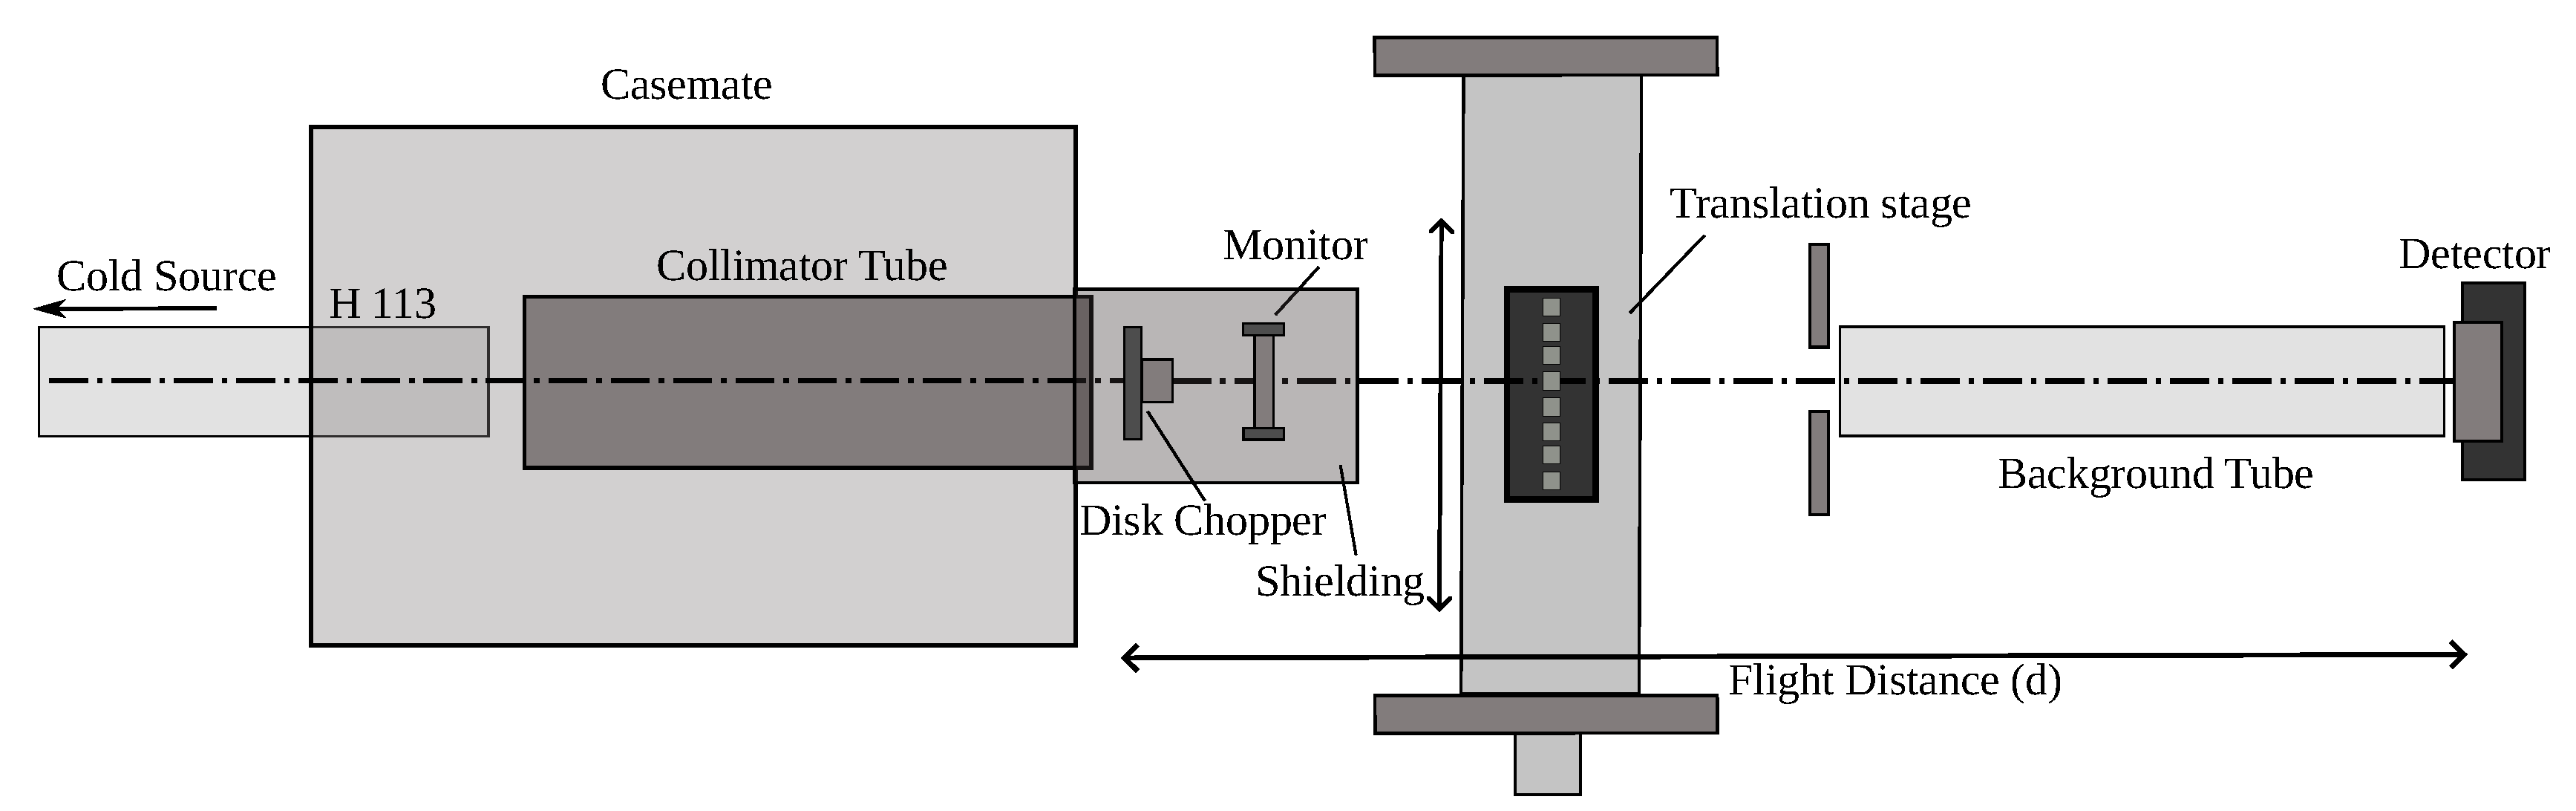
Figure 3.
Neutron spectrum measured without a sample. Intensity on the vertical axis is in arbitrary units. Neutron wavelength on the horizontal axis is in Å.
Figure 3.
Neutron spectrum measured without a sample. Intensity on the vertical axis is in arbitrary units. Neutron wavelength on the horizontal axis is in Å.
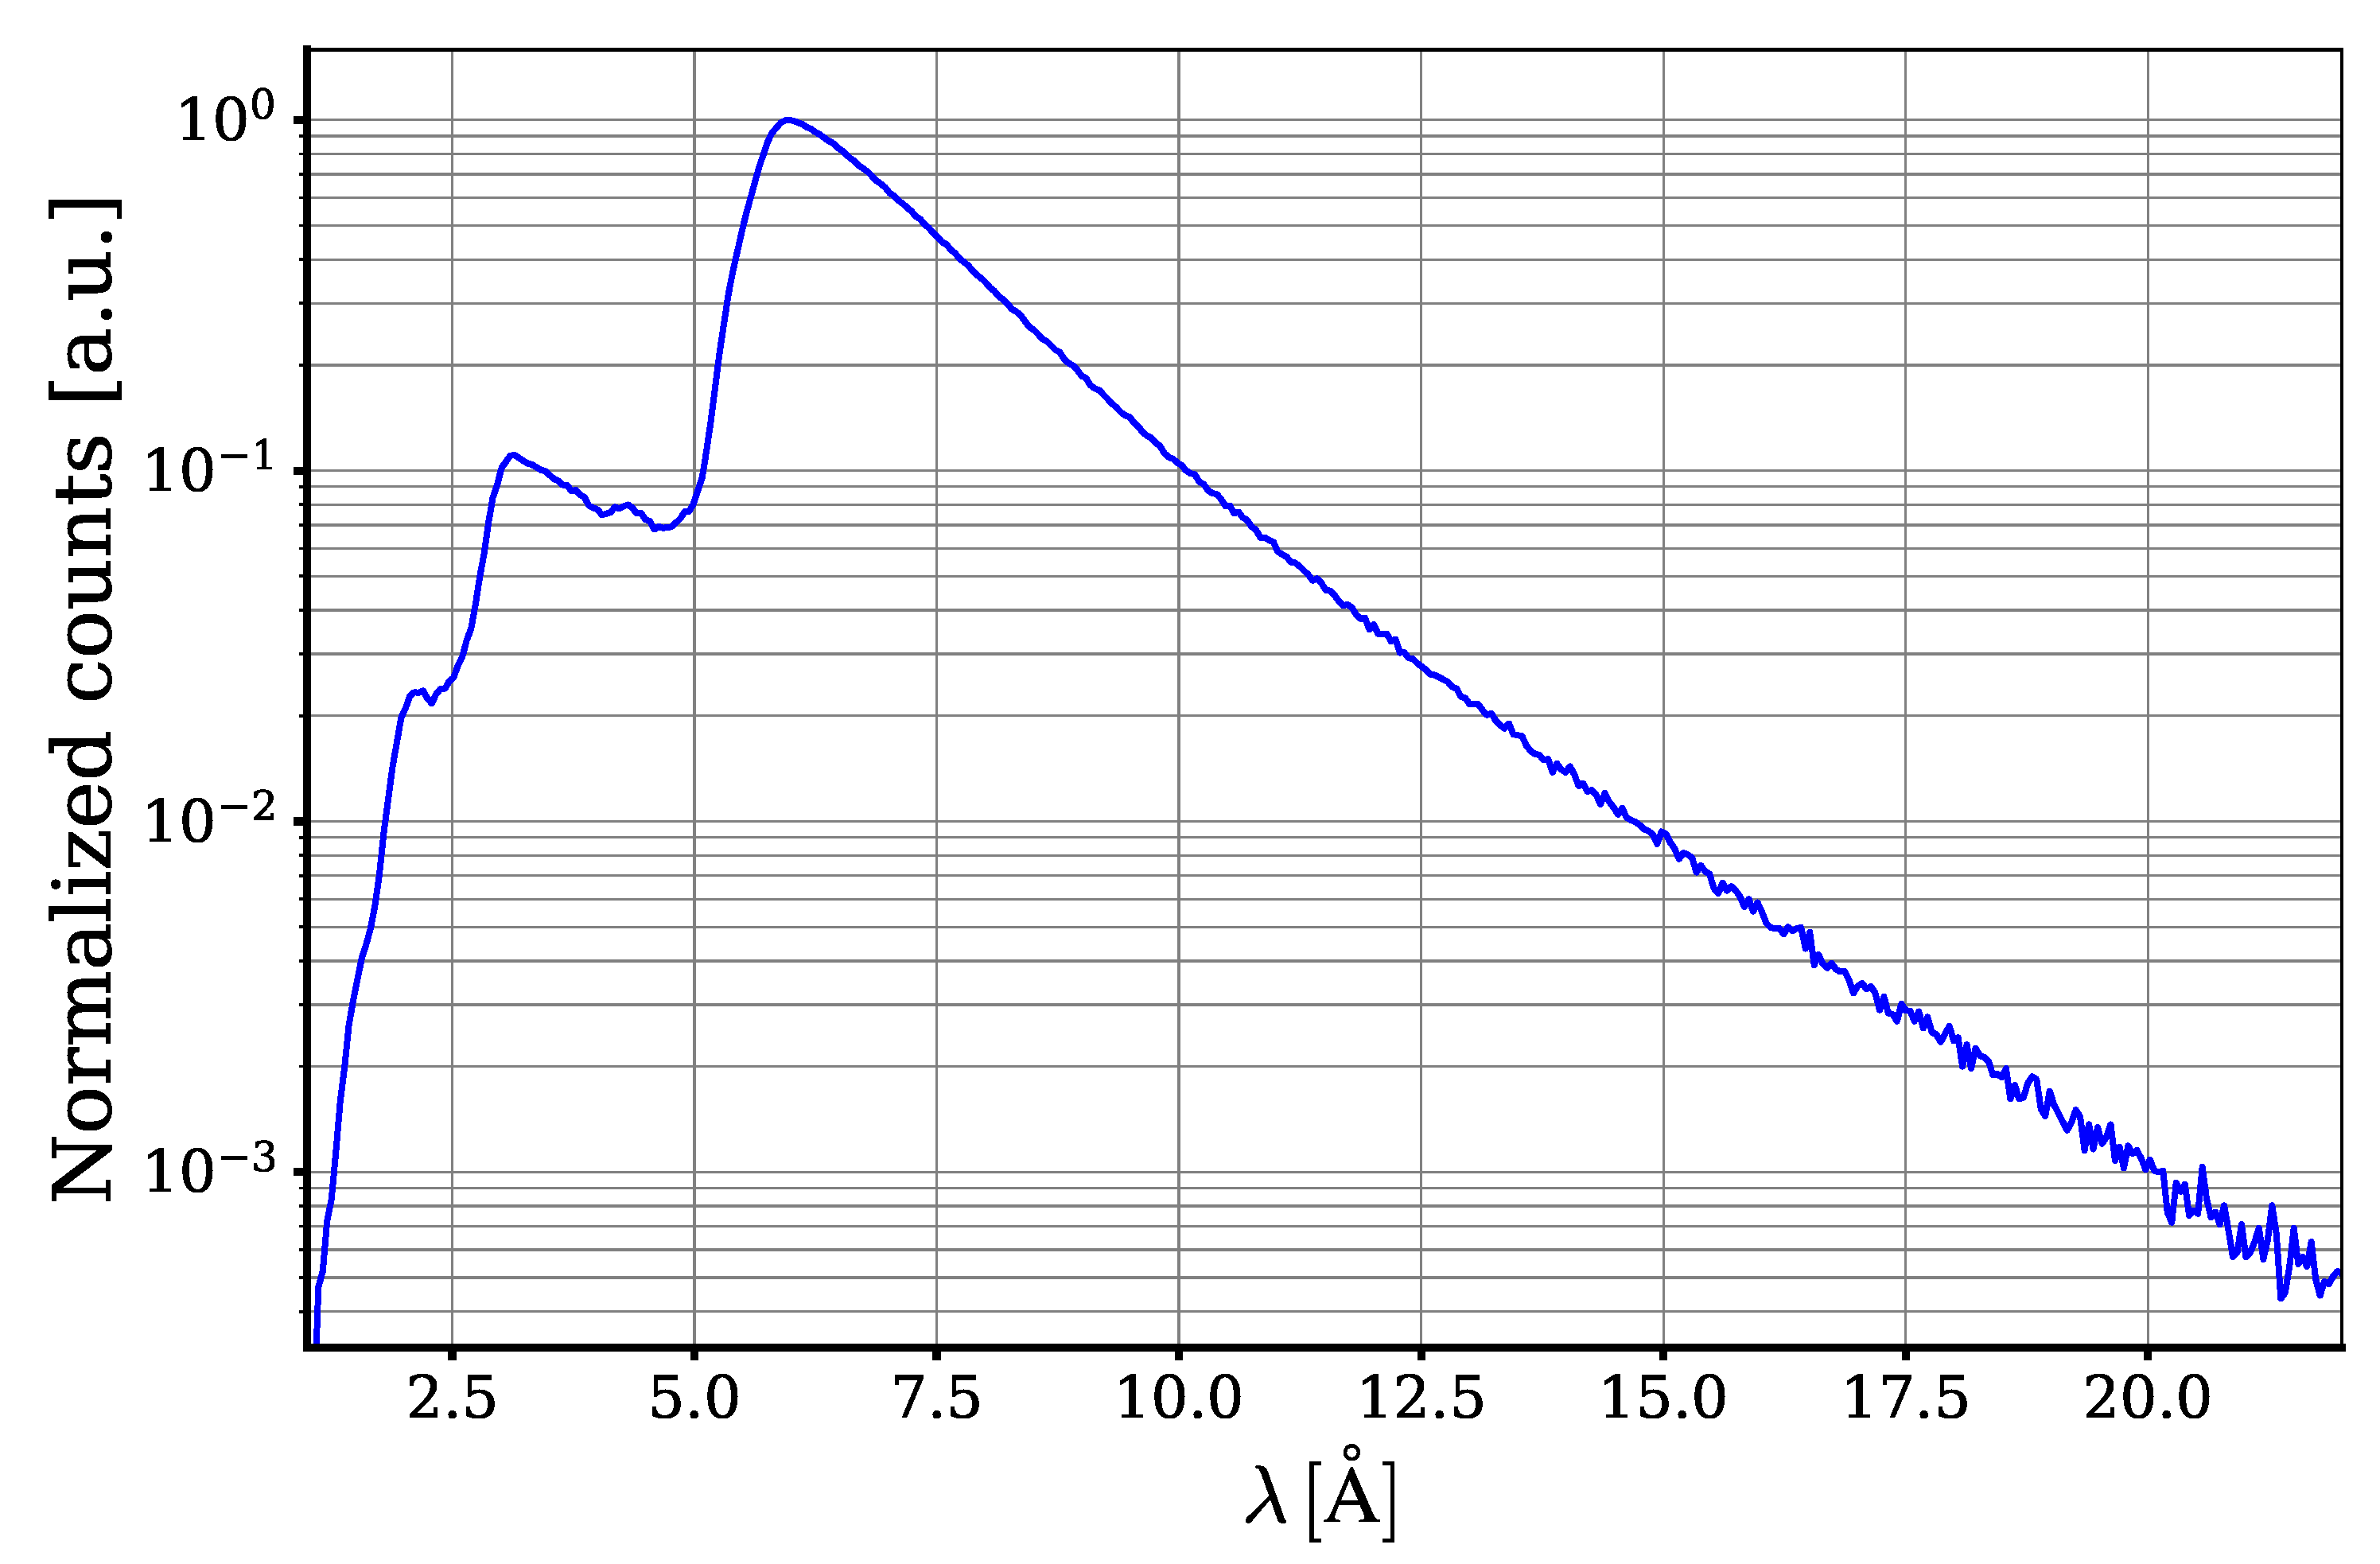
Figure 4.
Total cross sections of interaction of neutrons () with different intercated graphite samples, per atom in arbitrary units. The normalization per atom uses the mass density and chemical composition presented in Table 1. The results are presented in two figures to improve visibility.
Figure 4.
Total cross sections of interaction of neutrons () with different intercated graphite samples, per atom in arbitrary units. The normalization per atom uses the mass density and chemical composition presented in Table 1. The results are presented in two figures to improve visibility.
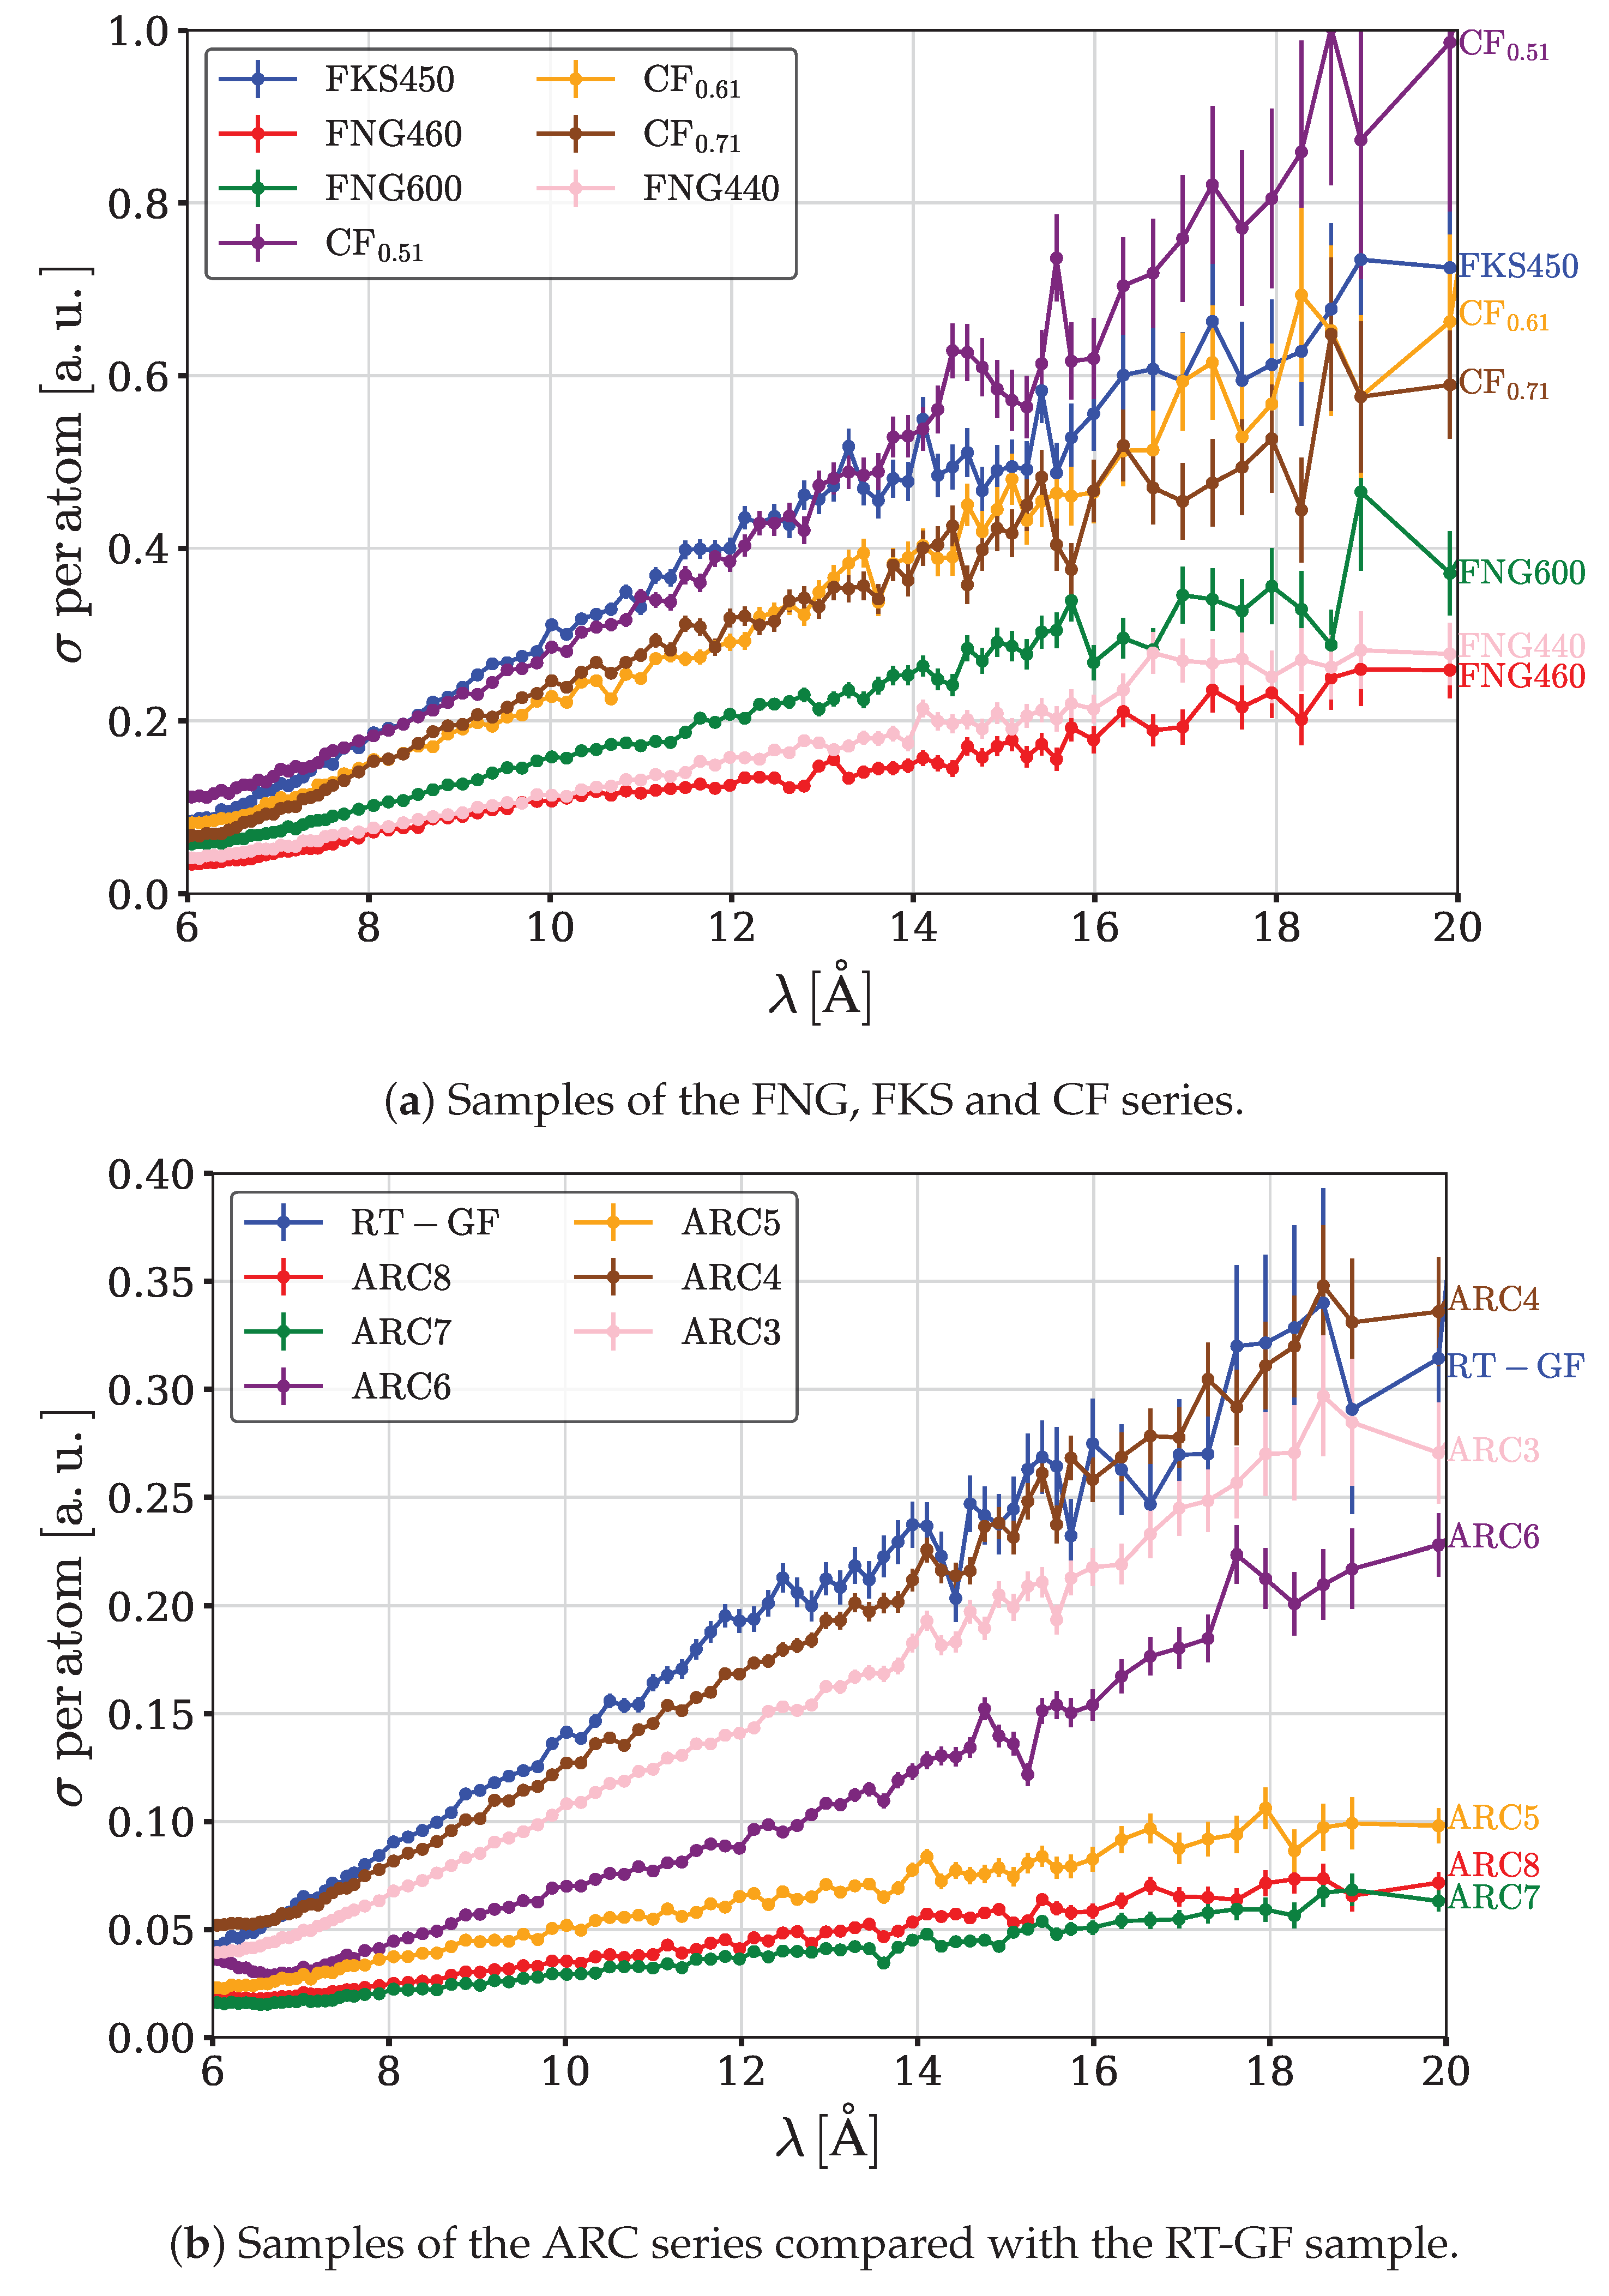

Table 1.
Parameters of the prepared samples. The density of the samples and the sample thickness are measured with the accuracy of a few per cent.
Table 1.
Parameters of the prepared samples. The density of the samples and the sample thickness are measured with the accuracy of a few per cent.
| Sample Name | Density, | Thickness, cm | F/C Ratio | Fraction, % | Interlayer Distance, Å | Grain Size, m |
|---|---|---|---|---|---|---|
| ARC3 | 0.85 | 1.2 | 1.01 | 0 | 6.2 | 1-45 |
| ARC4 | 0.83 | 1.2 | 0.87 | 0 | 6.2 | 1-45 |
| ARC5 | 0.84 | 0.8 | 0.63 | 0 | 6.2 | 1-45 |
| ARC6 | 0.81 | 1.2 | 0.37 | 0 | 6.2 | 1-45 |
| ARC7 | 0.85 | 1.2 | 0.18 | 0 | – | 1-45 |
| ARC8 | 0.87 | 0.8 | 0.01 | 0 | – | 1-45 |
| 0.35 | 1.2 | 0.51 | 51 | 8.9 | 7.5 | |
| 0.42 | 0.8 | 0.61 | 61 | 8.9 | 7.5 | |
| 0.38 | 0.8 | 0.71 | 45 | 8.0 | 7.5 | |
| FKS450 | 0.83 | 0.8 | 0.57 | 74 | 9.0 | 44 |
| FNG440 | 0.35 | 1.2 | 0.52 | 94 | 9.2 | 200–400 |
| FNG460 | 0.84 | 1.2 | 0.55 | 96 | 9.2 | 200–400 |
| FNG600 | 0.76 | 0.8 | 0.60 | 67 | 9.2 | 200–400 |
| RT-GF | 0.43 | 0.8 | 0.71 | 0 | 6.0 | 7.5 |
Disclaimer/Publisher’s Note: The statements, opinions and data contained in all publications are solely those of the individual author(s) and contributor(s) and not of MDPI and/or the editor(s). MDPI and/or the editor(s) disclaim responsibility for any injury to people or property resulting from any ideas, methods, instructions or products referred to in the content. |
© 2024 by the authors. Licensee MDPI, Basel, Switzerland. This article is an open access article distributed under the terms and conditions of the Creative Commons Attribution (CC BY) license (http://creativecommons.org/licenses/by/4.0/).
Copyright: This open access article is published under a Creative Commons CC BY 4.0 license, which permit the free download, distribution, and reuse, provided that the author and preprint are cited in any reuse.