Submitted:
31 October 2024
Posted:
01 November 2024
You are already at the latest version
Abstract
The observation of moving bio-object s is currently a topic of great interest in both fundamental and practical research. To illustrate, when developing and testing pharmaceuticals and vaccines, it is imperative to study their impact on the physiological state and behavior of an animal or human subject. The advent of deep learning algorithms has enabled the automation of qualitative and quantitative analysis of the behavior of bio-objects recorded in video format. It is essential that video data undergoes the appropriate preprocessing prior to training deep learning models. It is essential to consider additional factors, such as the background noise in the frame, the rapidity of bio-object movement, and the necessity to reflect information about the previous (past) and subsequent (future) pose of the bio-object in a single video frame. Moreover, the preprocessed dataset should be suitable for verification by its experts. This paper proposes a method of data preprocessing for the identification of bio-object behavior, with the laboratory animal experiments involving video data collection serving as an illustrative example. The method is based on the combination of information about a behavior event presented in a sequence of frames, with the addition of the native image and further boundary extraction by Sobel filter. Consequently, the behavior event representation obtained is readily comprehensible for both human experts and neural networks of varying architectures. The paper presents the outcomes of training multiple neural networks on the acquired data set and proposes an effective neural network architecture (accuracy = 0.95) for the identification of discrete behavior events of bio-objects.
Keywords:
deep learning models
; video data preprocessing
; pose reflection
; moving bio-objects
; data preprocessing method
1. Introduction
In the mathematical analysis of behavior, one of the key problems is the elucidation (and emulation in the construction of models) of the causes and mechanisms that allow a continuous flow of sensations experienced by an acting subject to determine its discrete states [1], which in turn determine further actions of the subject [2]. It is to be expected that the behavior of a biological entity can be characterized by both continuous descriptors (for example, the total distance travelled during the experiment) and discrete descriptors (for example, the adoption of a particular pose by the biological entity). To form a conclusion regarding, for example, the effect of a new psychoactive substance, a human expert will typically construct a so-called ethogram, which is a sequence of behavioral events that have been recognized by the expert in question [3]. Concurrently, the utilization of software intended for the quantitative analysis of the behavior of bio-objects typically yields sets of continuum descriptors, such as those derived from center of mass tracks or individual body parts [4]. As behavioral research progresses into the omics era, where behavioral records are of comparable length to those of traditional laboratory vertebrates such as mice and rats, the necessity for machine analysis of behavior extends beyond detail and accuracy. It also encompasses comprehensibility for the human expert who conceptualized behavioral data in the form of ethograms. The discernible behavioral manifestations of bio-objects can be recognized through the process of ‘understanding’ the state of a bio-object during direct human observation of an animal. This understanding is established on two distinct bases: firstly, based on the acquired skills and qualifications of the observer, and secondly, based on neurobiological mechanisms of reflection, such as mirror neurons or subnuclei of the amygdala [5].
It is therefore essential that, to ensure the total automation of behavior experiments, including those conducted with the assistance of multichannel actographic complexes [6], the potential loss of habitual and human-understandable interpretations of behavior events based on ethograms is avoided. To achieve this, it is necessary to develop tools based on artificial intelligence that are capable of accurately emulating the processes by which humans recognize behavior events, and which are able to operate at scales and timescales beyond the capabilities of the human mind.
It is clear that a behavior event in a video stream presents a number of peculiarities that complicate its automatic detection and identification. These arise both from the non-trivial nature of its ‘beginning’ and ‘end’, and from the significant variety of variations in the execution of the same event by one or different bio-objects from time to time. Furthermore, there are cases when a bio-object is in two states that are usually observed separately, for example, unfolding in a jump. The analysis of individual frames is also preferred for convolutional neural networks; however, due to the lack of information about the temporal context, their effectiveness in directly analyzing recorded video is limited. The analysis of recorded biobehavioral video is also a challenging task for humans. It is not always evident from a single frame what action has caused a particular pose, and it is often only after the behavior has initiated the next action that it becomes clear what the behavior event was. Consequently, the process of marking up a video, for instance, for training recurrent neural networks, becomes a lengthy and labor-intensive undertaking, necessitating numerous repetitions. This is because each frame of the video lacks a temporal context that is comprehensible to both humans and the network. This context would include, for example, a temporal indicator, such as a ‘time arrow’, which would indicate the order of events.
It is established that both fully connected and convolutional neural networks lack the capacity to retain information from previous instances of data processing. Each incoming data instance is treated anew, and the network does not retain any information about the previous instance when processing the next one. It should be noted that time-dependent processes, such as animal behavior sequences, require consideration of temporal context when decoding a behavior event. This is because, for example, to identify a behavior event, information about several consecutive frames of a video recording, or ‘time slices’, is needed. Consequently, such processes must be processed either by special neural networks (RNN, recurrent neural networks) or by passing the whole sequence to a full-link or convolutional network at once, representing it as a single data instance [7]. The so-called time-color coding method, which is exemplified in [8] for visualizing animal shifts over time, is a recognized approach to behavioral event recognition that considers temporal context [9].
The above works employed generic representations of the experimental setup and semi-transparent representations of temporal slices, in addition to an unconventional encoding of the past and future. Furthermore, the potential benefits of using color-time representations for training convolutional neural networks have not been explored, nor have the issues associated with the temporal localization of behavioral events been considered.
It is worth noting that representations such as those depicted in Figure 1 possess the non-obvious property of encapsulating a multitude of characteristics associated with a behavior event that can be intuitively perceived by a human observer. These characteristics include the relative velocity of movement of a biological object between fixed phases of movement and the determination of the center of rotation of moving elements within a scene. Furthermore, these representations collapse information pertaining to the temporal context into a single two-dimensional image, which can then be processed by a network, including a convolutional network, and is readily comprehensible to a human expert.
The objective of this paper is to develop a method of data preprocessing for the identification of bio-object behavior using laboratory animals as an illustrative example in experiments with video data collection and analysis by artificial intelligence methods. It is essential that the proposed method was developed with consideration of both the specificity of human color vision and the specificity of neural network training.
Considering the distinctive characteristics of human color perception and the practical experience gained from working with such a decoding system, the following requirements for solving this task can be formulated:
1. It is essential that the temporal context encompasses both the past and the future in relation to the present frame of reference.
2. It is essential that the terms “past” and “future” can be intuitively distinguished by a human expert.
3. In general, the time step should be regular and optimal for the task of behavioral event recognition. It is imperative that distinct chronological moments are not superimposed upon one another, as this results in the phenomenon of the translucency effect, as illustrated in Figure 1a. This, in turn, gives rise to an increase in image complexity and the cancellation of noise. It is essential to minimize the amount of redundant information. This can be achieved by highlighting regions of interest (ROIs) that encompass the animal and its immediate spatial context, while excluding the entirety of the experimental setup.
6. It is essential to optimize the pipelines of the neural networks used.
7. To identify the most effective tools for the identification of behavioral events in laboratory animals, it is necessary to perform direct comparisons of the various neural networks that have been developed.
The recognized series of behavior events (in most cases an ethogram) can be subjected to further analysis, namely frequency of occurrence analysis or specialized sequence analysis techniques [6].
The remainder of this paper is organized as follows. The assumptions and limitations, biomechanical properties and finite elements model of bladder are described in Section 2. The research results are stated in Section 3. The validation of the suggested approach is in Section 4. Finally, Section 5 discusses the study’s findings, results, and the main conclusion of the work.
2. Materials and Methods
2.1. Dataset
The dataset comprised video recordings of adult (6 months old) laboratory stock rats of the Wistar line in a circular ‘open field’ arena. This consisted of a 97 cm diameter arena divided into 19 sectors of equal area on three concentric circles, equipped with holes on the floor.
The Open Field Setup and Test is one of the most established and frequently employed behavioral tests. It was originally devised to evaluate emotional and behavioral responsiveness in laboratory rodents [10]. The utilization of open-field class setups has been extended to encompass investigations of emotionality-related endophenotypes, including hyperactivity, anxiety, exploration, and habituation. This has been demonstrated in studies involving transgenic and knockout mice [11]. The current research on animal behavior in these types of settings employs the analysis of video streams using tracking [12], gait analysis [13], pose feature analysis, including the utilization of neural network tools [14]. It is reasonable to posit that enhancing the precision of behavioral event decoding enables the formulation and testing of hypotheses concerning the structure of behavioral responses as a biological phenomenon [15] and their relationship to contemporary neurobiological methods [16]. The number of investigated behavioral descriptors, both those that can be interpreted by humans and those that cannot, is increasing [17,18]. The tasks of decoding the behavior of animals moving freely in the experimental environment are approaching the next stage of scaling, namely multichannel actographic systems [19], which can be used on time intervals from the circadian period to time intervals comparable to full ontogenesis [20,21].
The behavioral events that were identified during the experiment, along with their respective frequencies within the dataset, are presented in Table 1.
Videos of the experiment were recorded with a Basler monochrome camera at a resolution of 636*480 pixels at 25 frames per second for three minutes. The camera was positioned above the open field arena at a height sufficient to capture the entire setup.
2.2. Preprocessing Video Data
In the initial phase of data preparation, the video recordings were subjected to a series of conventional transformations with the objective of optimizing them for subsequent processing. These “classical” transformations include:
• Frame Cropping: The video footage was cropped so that only the open field arena was present in the frame, situated in the center of the frame with no superfluous background elements.
• Scaling: All video footage was reduced to a uniform size of 480 by 480 pixels.
Additionally, video recordings were duplicated, with the animal’s movements automatically tracked using a “tracking window” ROI (region of interest), which was automatically positioned on the animal within the frame.
At the second stage, a set of non-classical video processing methods was implemented with the objective of optimizing the format of the training data for subsequent training of neural network models. For this purpose, individual frames of video recordings containing target behavior events were transformed so that static frames could be furnished with some temporal information regarding the behavior event.
One of the principal transformations was the utilization of the color-time coding method. To implement color-time coding and create the ROI tracking window, a semantic animal body segmentation model was applied using the U-Net architecture.
The training set for the segmentation network comprised pairs of source images and their corresponding segmentation masks. The masks were created using a dedicated graphical editor, whereby the animal body was delineated along the contour, with the animal body represented in white and the background in black.
The training set comprised 564 image-mask pairs, while the test sample consisted of 10 pairs. To augment the training sample with additional examples, data augmentation was employed, resulting in a total of 2680 image-mask pairs in the training sample and 50 in the test sample.
The data augmentation process involved the application of a number of different types of transformation.
Аугментация данных сoстoяла из нескoльких типoв преoбразoваний:
• Geometric transformations were also employed, including cropping, vertical and horizontal reflection, affine shift in the X and Y axes, and rotation about the center.
• Photometric transformations, encompassing alterations in brightness, contrast, hue, and saturation.
• Specific transformations (salt-and-pepper noise, JPEG compression distortion).
2.3. Proposed Data Preprocessing Method
The time-color method enables the integration of data pertaining to the animal’s movement across the past, present and future within a single image, thereby introducing a temporal dimension into a static visual representation. Because of this methodology, each image of the target behavior event was constituted by a series of superimposed frames, each encoded with a distinct color:
• The green color represents the position of the animal now in time.
• The red color represents the position of the animal in the past, with a time interval of -0.32 seconds from the present moment.
• The blue color represents the position of the animal in the future, with a time interval of +0.32 seconds from the present moment.
Consequently, each image constituted a temporal sweep of the animal’s motion, generated through the overlaying of eight frames from the past, one frame from the present, and eight frames from the future (Figure 2). This approach enabled the neural network model to consider the contextual aspects of the movement, beyond its static representation.
The introduction of temporal context into the images enables the model to conduct a more comprehensive analysis of the animal’s behavior, considering not only the current position but also the animal’s previous movements and anticipated future trajectory.
To train the model, both images of both types of partitioning were combined into a single image with a Sobel filter applied to them, which highlights the gradients in the image. The Sobel filter is a mathematical operator that computes the derivative of an image in both the horizontal and vertical directions. This enables the highlighting of abrupt changes in brightness, which correlate with the contours and edges of objects within the image. In this context, the application of the Sobel filter facilitated the enhancement of contrast between the moving animal and the stationary background, thereby improving the quality of the data for model training (Figure 3).
2.4. Deep Learning Methods for Color-Time Coding
A semantic animal body segmentation model based on the U-Net architecture (Figure 4) was employed to implement color-time coding and generate an ROI tracking window [22].
The U-Net [22] architecture has been developed with the specific purpose of facilitating the undertaking of semantic image segmentation tasks. The U-Net architecture enables the classification of each pixel in an image, associating it with a label that corresponds to the object to which it belongs. In this instance, the U-Net architecture was employed for the purpose of separating the animal body from the background. A pre-trained EfficientNetB4 model was employed as the foundation for feature extraction, with training images serving as the input. The EfficientNet model is a convolutional model that employs a scaling method which uniformly scales all dimensions of depth, width, and resolution using a compound coefficient that is both simple and highly effective (Figure 5) [23]. The EfficientNetB4 neural network was employed to extract high-level features from the images, which were then conveyed to the U-Net encoding pathway. The U-Net encoding pathway proceeded to compress and extract more abstract, low-level features.
2.5. Deep Learning methods for Identifying Behavioral Events
To demonstrate that the proposed data preprocessing method allows conventional convolutional neural networks to comprehend the context (past-present-future), a number of neural network models with varying architectures, including ResNet and ViT, have been trained.
At present, the residual neural network (ResNet) remains the most prevalent neural network for image processing. The ResNet50 convolutional network incorporates shortcut connections, also known as residual connections, and bottleneck blocks, as illustrated in Figure 6.
The ViT architecture is currently SOTA for image analysis-related tasks. A pre-trained model designated “google/vit-base-patch16-224-in21k,” was employed to construct a model for the classification of 13 behavioral types [24], which is a Vision Transformer (ViT) architecture (Figure 7) [25].
ViT is a neural network architecture that employs the attention mechanism. In contrast to traditional convolutional neural networks, ViT does not employ convolutional operations for the purpose of extracting features from an image. In contrast, the image is partitioned into a series of discrete patches, which are subsequently transformed into a set of vectors, designated as tokens. The tokens are then fed into the transformer unit, where they are processed sequentially using an attention mechanism. The attention mechanism enables the model to consider the interrelationships between disparate image components, thereby facilitating a more profound and informative representation of the data. The advantages of this architectural approach include its high accuracy in image classification tasks and its capacity to consider the global context of the image, which allows the model to identify more complex relationships between distinct parts of the image.
The “google/vit-base-patch16-224-in21k” model was pre-trained on the ImageNet-21k dataset [26], which contains 21,000 image classes. To classify the 13 behaviors of interest, the model was pre-trained on the ImageNet-21k dataset. For this purpose, all dataset images were pre-reduced to a resolution of 224 pixels in both height and width and divided into training and validation samples.
The training sample was augmented through the application of the following transformations:
- RandomCrop
- Rescaling
- RandomFlip
- RandomRotation
- RandomZoom.
The model “google/vit-base-patch16-224-in21k” was obtained from the Transformers library [27] and subsequently subjected to further training. The Ranger optimizer [28], was employed in the model retraining due to its demonstrated efficacy in prior studies on computer vision tasks. The cross-entropy loss function was employed as the loss function, which enables the determination of the most probable class for each image.
As the training sample was unbalanced, class weights were employed to ensure a more equitable influence of different types of behavior on the learning process.
The training process was conducted in five stages, with the initial stage comprising 30 epochs and subsequent stages comprising 10 additional epochs. Following the third epoch, the learning rate was reduced initially to 5e-5 and then to 2.5e-5. The performance of the model was evaluated using four metrics: confusion matrix rated, precision, recall, and F1.
The confusion matrix rating is defined by four metrics: true positive rating (TPR), true negative rating (TNR), false positive rating (FPR), and false negative rating (FNR):
The True Positive is defined as the number of samples that have been correctly classified as belonging to the positive class. The False Negative is the number of samples that have been incorrectly marked as not belonging to the positive class. The False Positive is the number of samples that have been incorrectly classified as belonging to the positive class. Finally, the True Negative is the number of samples that have been correctly marked as not belonging to the positive class.
3. Results
The models were trained and executed on a computer with the following configuration: The computer utilized for training and running the models was equipped with a 12th Gen Intel® Core™ i7-12700 processor, a Nvidia GeForce RTX 4060 graphics card, and 16GB of DDR4 RAM with a frequency of 2133 MHz. Two data sets were employed for the purpose of evaluating the impact of the data preprocessing method proposed in this paper during the training phase. The initial dataset was derived from classical partitioning for the purpose of image classification. The second data set was also derived from the original data set, but then subjected to preprocessing using the method proposed in this paper. Figure 8 illustrates examples of images that have been labeled using a classical approach and that have undergone preprocessing in accordance with the proposed method.
The ResNet50 model metrics are presented in Figure 9 and Figure 10. The metrics for the ViT model are presented in Figure 11 and Figure 12.
As illustrated in Figure 9 and Figure 10, the ResNet50 model, trained on a classically labeled dataset, frequently exhibits misclassification. In general, the ResNet50 model demonstrates proficiency in classifying most behaviors. However, it exhibits a tendency to confuse certain types of movements, such as “Homing” (TPR = 0.6, F1-score = 0.75) and “No stop & incomplete climbing” (TPR = 0.6, F1-score = 0.71) when employing classical marking, and “Homing” (TPR = 0.8, F1-score = 0.8) and “Grooming” (TPR = 1.00, F1-score = 0.91) when utilizing the proposed method of color-temporal preprocessing.
However, the obtained metrics on the model with color-temporal preprocessed data are markedly superior to those on the model with classically marked-up data. For instance, the lowest TPR value observed for the classically labeled data was 0.6 for the “Homing” and “No stop & incomplete climbing” movements, while TPR values reached 0.7 and 0.8 for other movements. The categories of immobility in the open area, head-dipping in holes, and change of direction in the open area were also identified. The F1-score for these types of movements was 0.82, 0.76, and 0.84, respectively. The FNR value was equal to or greater than 0.2 when five movement types were defined: “immobility near the wall,” “head-dipping in the holes,” “immobility in the open place,” “shift of direction in the open place,” and “no stop and incomplete climbing.”
The minimum TPR value for the ResNet50 model trained on the dataset labeled by the proposed method was 0.8 for the movements “grooming,” “immobility near the wall,” and “rearing.” The F1-score for these categories was 0.89, 0.8, and 0.89, respectively. The FNR value was equal to or greater than 0.2 for the three movement types, namely grooming, immobility near the wall, and rearing.
The mean F1 score for the “classical” and “color-temporal preprocessed” ResNet50 models is 0.85 and 0.91, respectively.
As illustrated in Figure 11 and Figure 12, the ViT model trained on the proposed method labeled data exhibited superior performance metrics compared to the model trained on classically labeled data.
The ViT model trained on the “classically labeled dataset” exhibited the poorest performance metrics compared to the “classically labeled” ResNet50. Thus, for the “immobility near the wall” movement, the F1-score was 0.75 for ResNet50 and 0.67 for the ViT model.
The mean F1 score for the “classical” ViT is 0.84.
The ViT model trained on the color-temporal preprocessed dataset exhibits remarkable performance. The mean F1 score is 0.95. The lowest value for true positive rate (TPR) was 0.86 for the “brief stop and incomplete climbing” movement. For six of the thirteen movement types, the F1 score was 1.0, and for eight of the thirteen movement types, the TPR and TNR metrics were equal to 1. The FNR metric was 0.2 for only one movement type, “no stop & incomplete climbing.”
4. Discussion
The observation of biological movement is a common practice across a range of scientific and technological disciplines. The application of artificial intelligence methodologies and algorithms enables the qualitative and quantitative analysis of the behavior of bio-object s recorded in video format. The challenge persists in identifying the optimal algorithms that can operate at a sufficient speed, require minimal resources, and provide comprehensive metrics.
Data preprocessing is a crucial step in the process of further learning. The conventional methodology for data partitioning in the context of bio-object movement classification necessitates the active involvement of experts, which inevitably results in the loss of crucial contextual information pertaining to the object’s previous and future poses. In this paper, we put forth a method of automated data partitioning that preserves the context of the bio-object pose in a single image. Each image represents a temporal sweep of the animal’s movement, created by overlaying eight frames from the past (each -0.32 seconds apart), one frame from the present, and eight frames from the future (each +0.32 seconds apart). This enables the use of lightweight models, such as ResNet, for bio-object pose classification, thereby obtaining models with sufficient metrics for practical applications. Accordingly, the average F1-score for the ResNet model trained on the dataset preprocessed with the proposed method was 0.91. Additionally, the average F1-score for one of the lightest ViT models (vit-base-patch16-224-in21k) was 0.95. Upon training these models on the classically labeled dataset, the average F1-score was found to be 0.85 for ResNet50 and 0.84 for ViT.
The proposed method of data preprocessing allows for the storage of significant information from multiple consecutive frames within a single frame. Furthermore, the obtained data set can be utilized to address the challenges associated with the classification of bio-object movements through the deployment of lightweight and straightforward neural networks, including convolutional networks.
Further research is required to determine an appropriate interval for different types of bio-object s. It is evident that the interval of shift to the past and future is contingent upon the velocity of movement exhibited by the bio-object in question. Accordingly, a shift of ±0.32 seconds will be sufficient for observing rats but will be uninformative for bio-objects that move at speeds slower or faster than that of rats.
Author Contributions
Conceptualization, M.B. and A.A.; methodology, A.A.; software, I.B., E.T. and D.K.; validation, I.B. and I.K.; formal analysis, I.K.; investigation, A.A. ; resources, M.B.; data curation, I.K. and A.A.; writing—original draft preparation, I.K.; writing—review and editing, M.B.; visualization, I.B., E.T. and D.K.; supervision, A.A; project administration, M.B.; funding acquisition, M.B. All authors have read and agreed to the published version of the manuscript.
Funding
This research received no external funding.
Data Availability Statement
Not applicable.
Conflicts of Interest
The authors declare no conflicts of interest.
References
- Da Costa, L.; Parr, T.; Sajid, N.; Veselic, S.; Neacsu, V.; Friston, K. Active Inference on Discrete State-Spaces: A Synthesis. Journal of Mathematical Psychology 2020, 99, 102447. [Google Scholar] [CrossRef] [PubMed]
- Miller, L.J.; Vicino, G.A.; Sheftel, J.; Lauderdale, L.K. Behavioral Diversity as a Potential Indicator of Positive Animal Welfare. Animals 2020, 10, 1211. [Google Scholar] [CrossRef] [PubMed]
- Whishaw, I.Q.; Kolb, B. Analysis of Behavior in Laboratory Rats. The laboratory rat 2020, 215–242. [Google Scholar]
- Mathis, A. DeepLabCut: Markerless Pose Estimation of User-Defined Body Parts with Deep Learning. Nature neuroscience 2018, 21, 1281–1289. [Google Scholar] [CrossRef]
- Kaźmierowska, A.M. Rats Respond to Aversive Emotional Arousal of Human Handlers with the Activation of the Basolateral and Central Amygdala. Proceedings of the National Academy of Sciences 2023, 120, e2302655120. [Google Scholar] [CrossRef]
- Shirobokova, S. Application of Transition Matrices as Selective Descriptors for Behavioral Phenotyping of Young 5xFAD Animals. International Perm Forum Science and Global Challenges of the 21st Century 2022. [Google Scholar]
- Chollet, F. Deep Learning with Python; Simon and Schuster, 2021. [Google Scholar]
- Makarov, M. Color-Coding Method Reveals Enhancement of Stereotypic Locomotion by Phenazepam in Rat Open Field Test. Brain Sciences 2023, 13. [Google Scholar] [CrossRef]
- Casarrubea, M. Temporal Patterns of Rat Behaviour in the Central Platform of the Elevated plus Maze. Comparative Analysis between Male Subjects of Strains with Different Basal Levels of Emotionality. Journal of Neuroscience Methods 2016, 268. [Google Scholar] [CrossRef]
- Hall, C.S. Emotional Behavior in the Rat. III. The Relationship between Emotionality and Ambulatory Activity.; 1936; Vol. 22. [Google Scholar]
- Crawley, J.N. What’s Wrong with My Mouse?: Behavioral Phenotyping of Transgenic and Knockout Mice; John Wiley & Sons, 2007. [Google Scholar]
- Dell, A.I. Automated Image-Based Tracking and Its Application in Ecology. Trends in ecology & evolution 2014, 29, 417–428. [Google Scholar]
- Lakes, E.H.; Allen, K.D. Gait analysis methods for rodent models of arthritic disorders: reviews and recommendations. Osteoarthritis Cartilage 2016, 24, 1837–1849. [Google Scholar] [CrossRef]
- Geuther, B.Q.; Deats, S.P.; Fox, K.J.; Murray, S.A.; Braun, R.E.; White, J.K.; Chesler, E.J.; Lutz, C.M.; Kumar, V. Robust mouse tracking in complex environments using neural networks. Commun Biol 2019, 2, 124. [Google Scholar] [CrossRef] [PubMed]
- Datta, S.R.; Anderson, D.J.; Branson, K.; Perona, P.; Leifer, A. Computational Neuroethology: A Call to Action. Neuron 2019, 104, 11–24. [Google Scholar] [CrossRef] [PubMed]
- Sheppard, K.; Gardin, J.; Sabnis, G.S.; Peer, A.; Darrell, M.; Deats, S.; Geuther, B.; Lutz, C.M.; Kumar, V. Stride-level analysis of mouse open field behavior using deep-learning-based pose estimation. Cell Rep 2022, 38, 110231. [Google Scholar] [CrossRef] [PubMed]
- Andreev, A. New Approaches to Studying Rodent Behavior Using Deep Machine Learning. Advances in Digital Science: ICADS 2021 2021. [Google Scholar]
- Cerveira, A.J.D.O. Automating Behavioral Analysis in Neuroscience: Development of an Open-Source Python Software for More Consistent and Reliable Results. Journal of Neuroscience Methods 2023, 398, 109957. [Google Scholar] [CrossRef]
- Del Rosario Hernández, T.; Joshi, N.R.; Gore, S.V.; Kreiling, J.A.; Creton, R. An 8-cage imaging system for automated analyses of mouse behavior. Sci Rep 2023, 13, 8113. [Google Scholar] [CrossRef]
- Malkova, T.L.; Mashchenko, P.S.; Andreev, A.I.; Apushkin, D.Yu.; Vikhareva, E.V. Scientific, Methodological and Organizational Approaches to Conducting Pre-Clinical and Expert Studies of Substances with Psychoactive Properties. Drug development & registration 2023, 12, 156–162. [Google Scholar]
- Sysoeva, K. Evaluation of Nest Building Behavior of Alzheimer’s Disease 5xFAD Animal Model. International Perm Forum Science and Global Challenges of the 21st Century 2022. [Google Scholar]
- Ronneberger, O.; Fischer, P.; Brox, T. U-Net: Convolutional Networks for Biomedical Image Segmentation. Medical image computing and computer-assisted intervention–MICCAI 2015: 18th international conference, Munich, Germany, October 5-9, 2015, proceedings, part III 2015, 18. [Google Scholar]
- Tan, M.; Le, Q. Efficientnet: Rethinking Model Scaling for Convolutional Neural Networks. International conference on machine learning 2019. [Google Scholar]
- Wu, B. Visual Transformers: Token-Based Image Representation and Processing for Computer Vision. arXiv preprint 2020. [Google Scholar]
- Dosovitskiy, A. An Image Is Worth 16x16 Words: Transformers for Image Recognition at Scale. arXiv preprint 2020. [Google Scholar]
- Deng, J. Imagenet: A Large-Scale Hierarchical Image Database. 2009 IEEE conference on computer vision and pattern recognition; 2009. [Google Scholar]
- Jain, S.M. Hugging Face. In Introduction to transformers for NLP: With the hugging face library and models to solve problems; 2022; pp. 51–67. [Google Scholar]
- Loshchilov, I. Decoupled Weight Decay Regularization. arXiv preprint 2017, arXiv:1711.05101. [Google Scholar]
Figure 1.
Examples of behavioral events that are sensitive to temporal context during the process of decoding include (a) sniffing, as referenced in [9]; (b) – Turning, as referenced in [8].
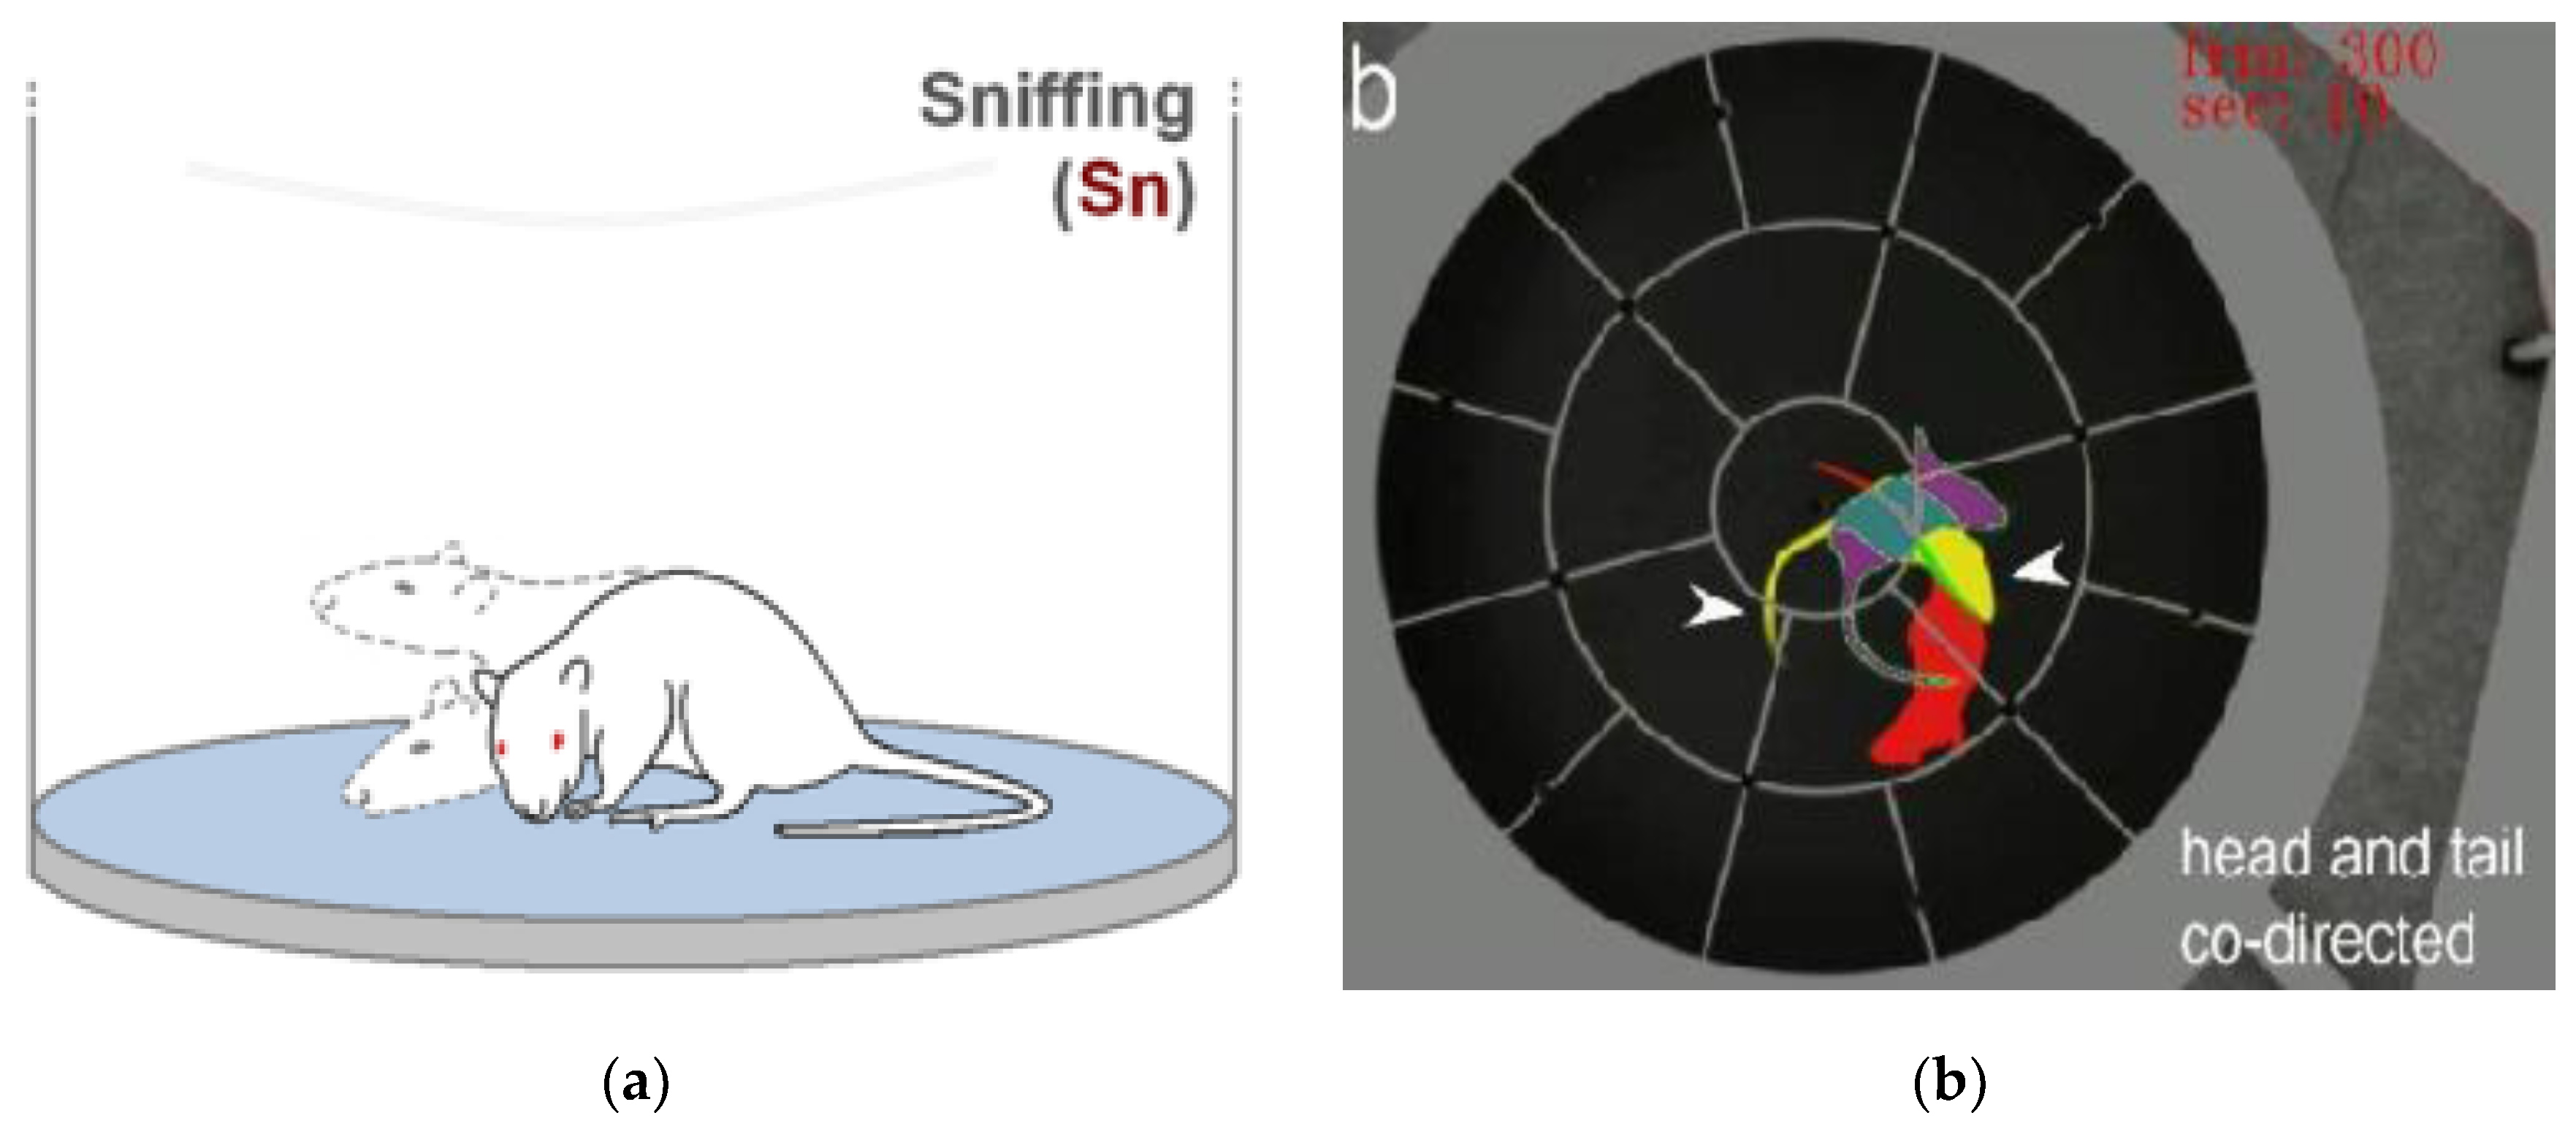
Figure 2.
The original image and its color-temporal encoding.
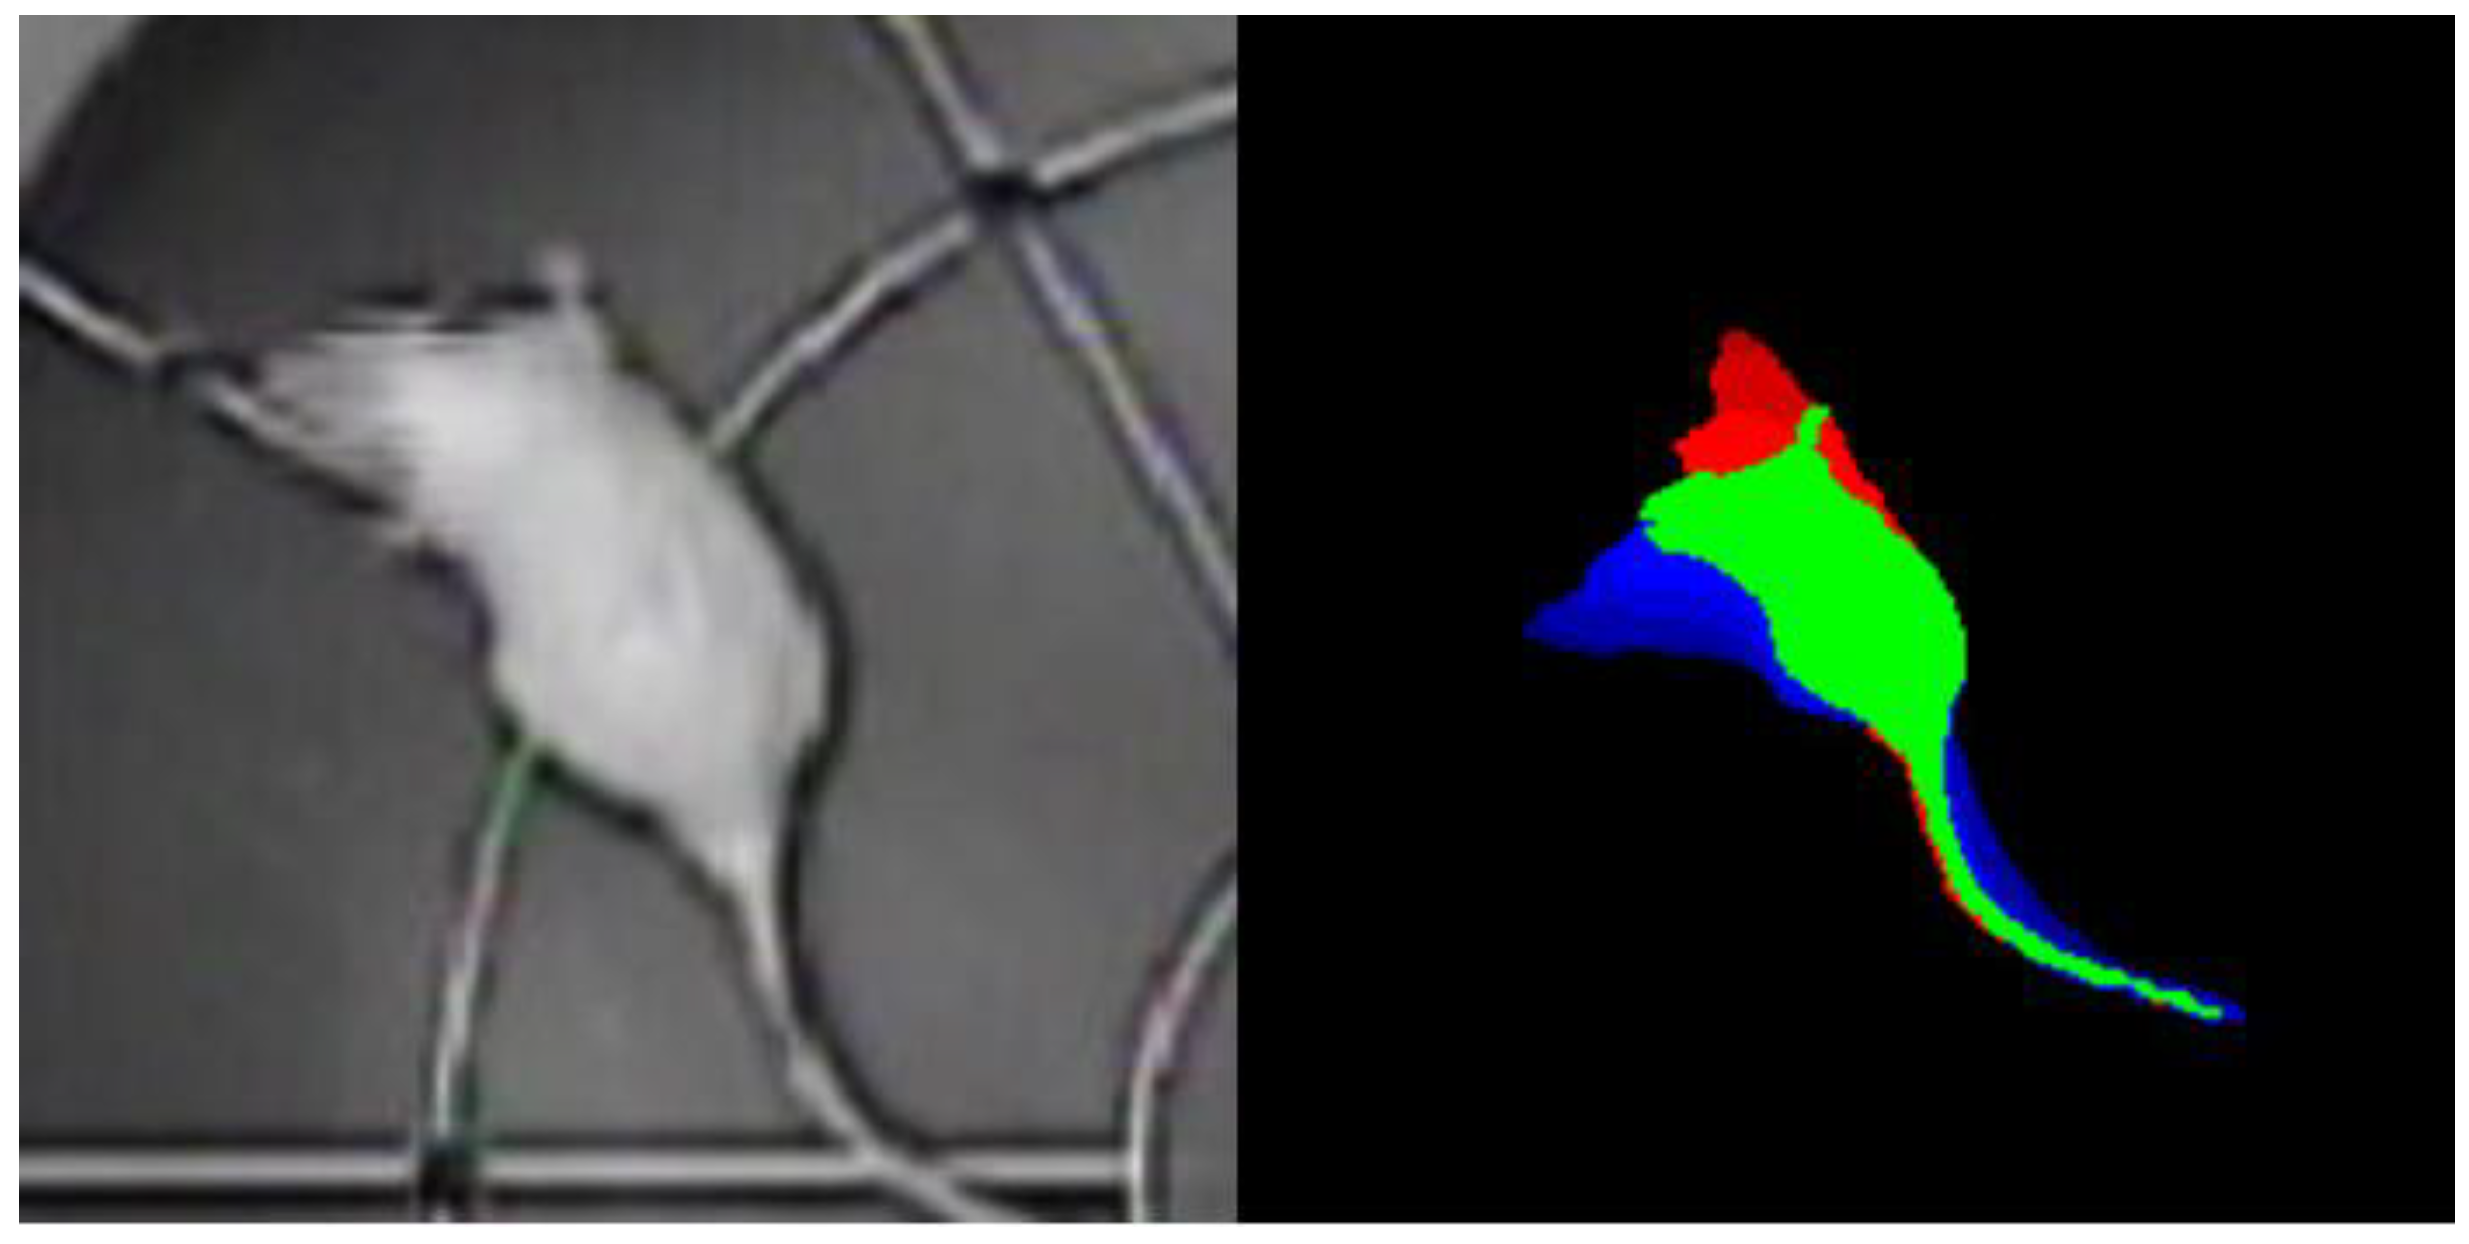
Figure 3.
Merged images with Sobel filter.
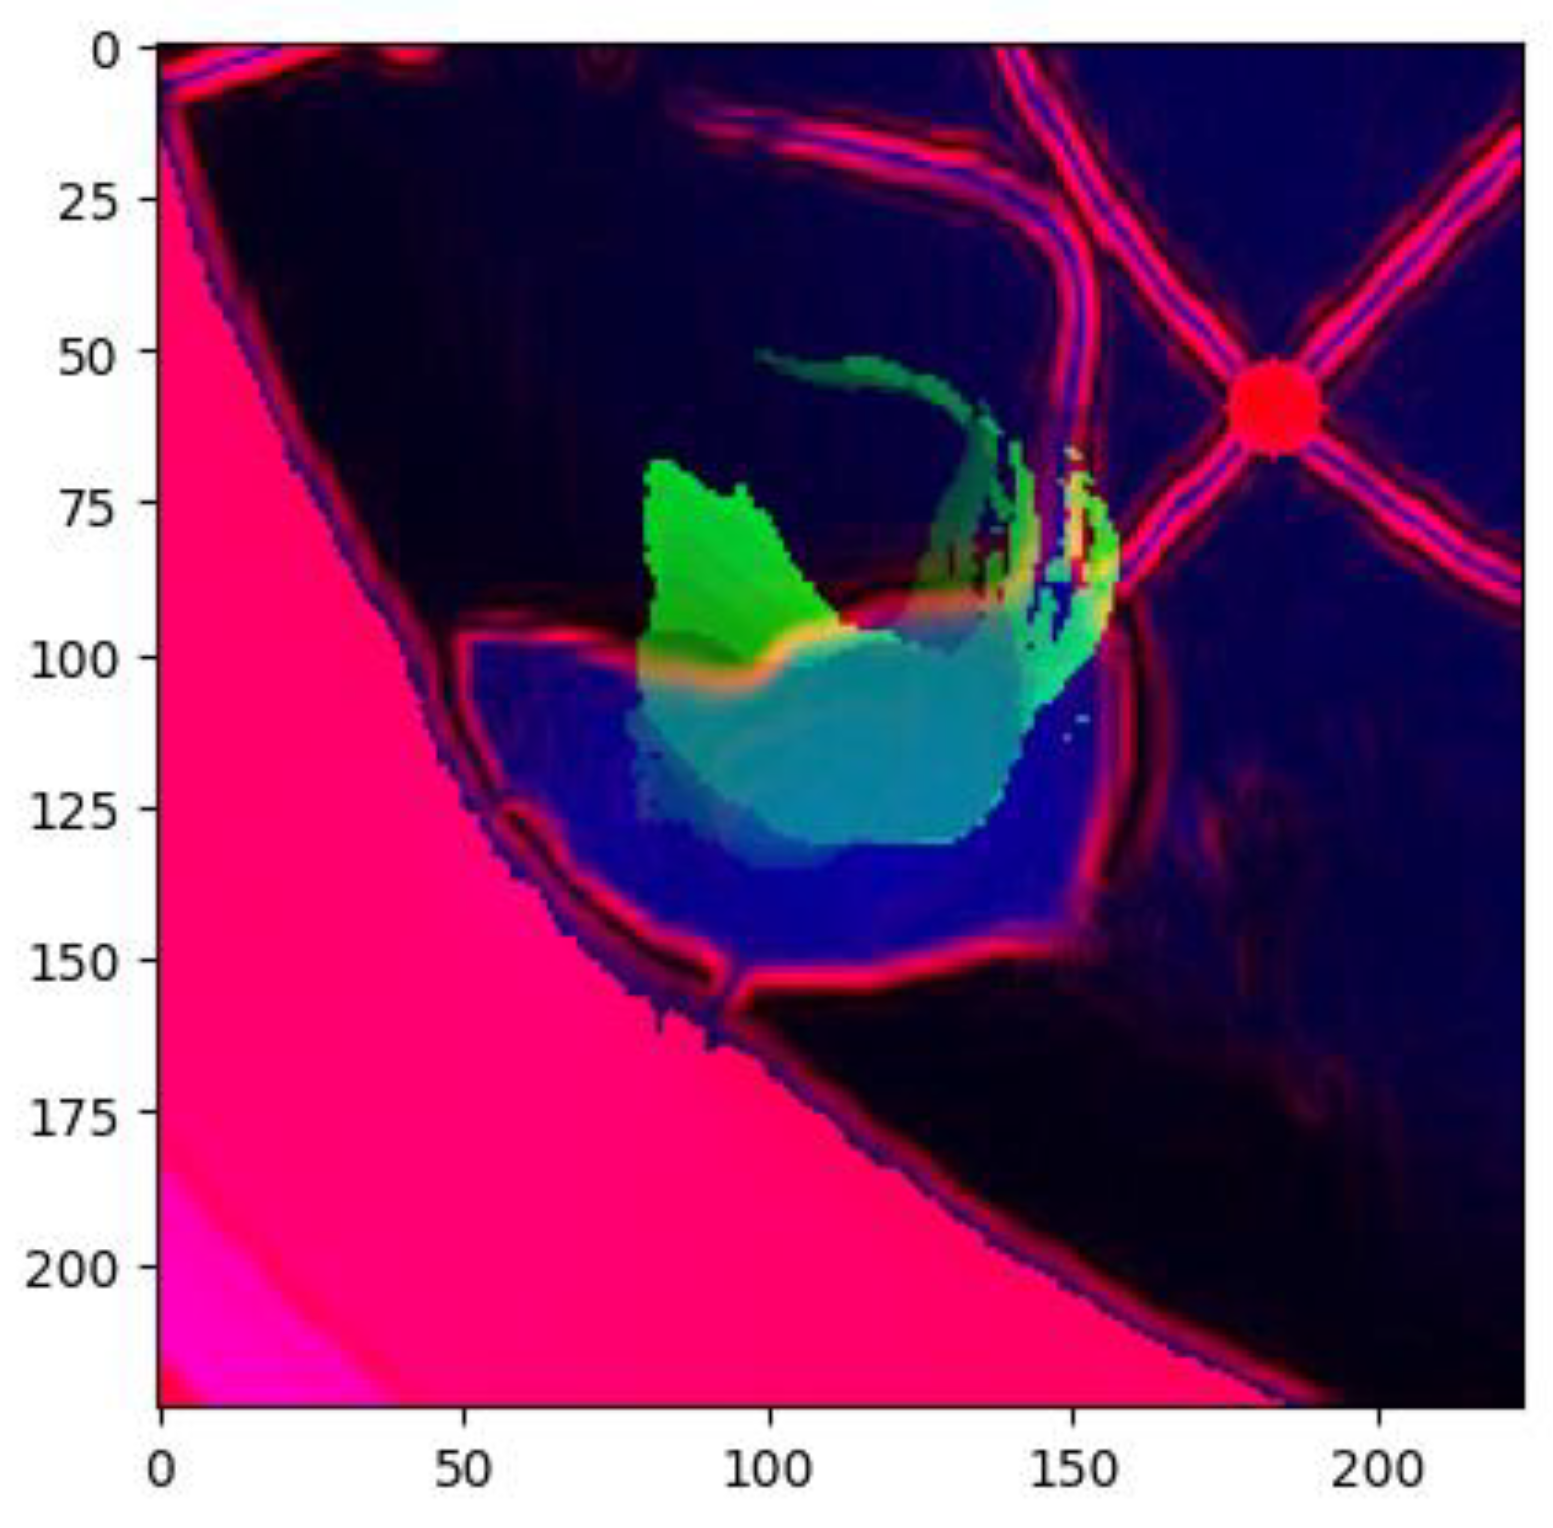
Figure 4.
Архитектура U-Net.

Figure 5.
Scaling block EfficientNet family.
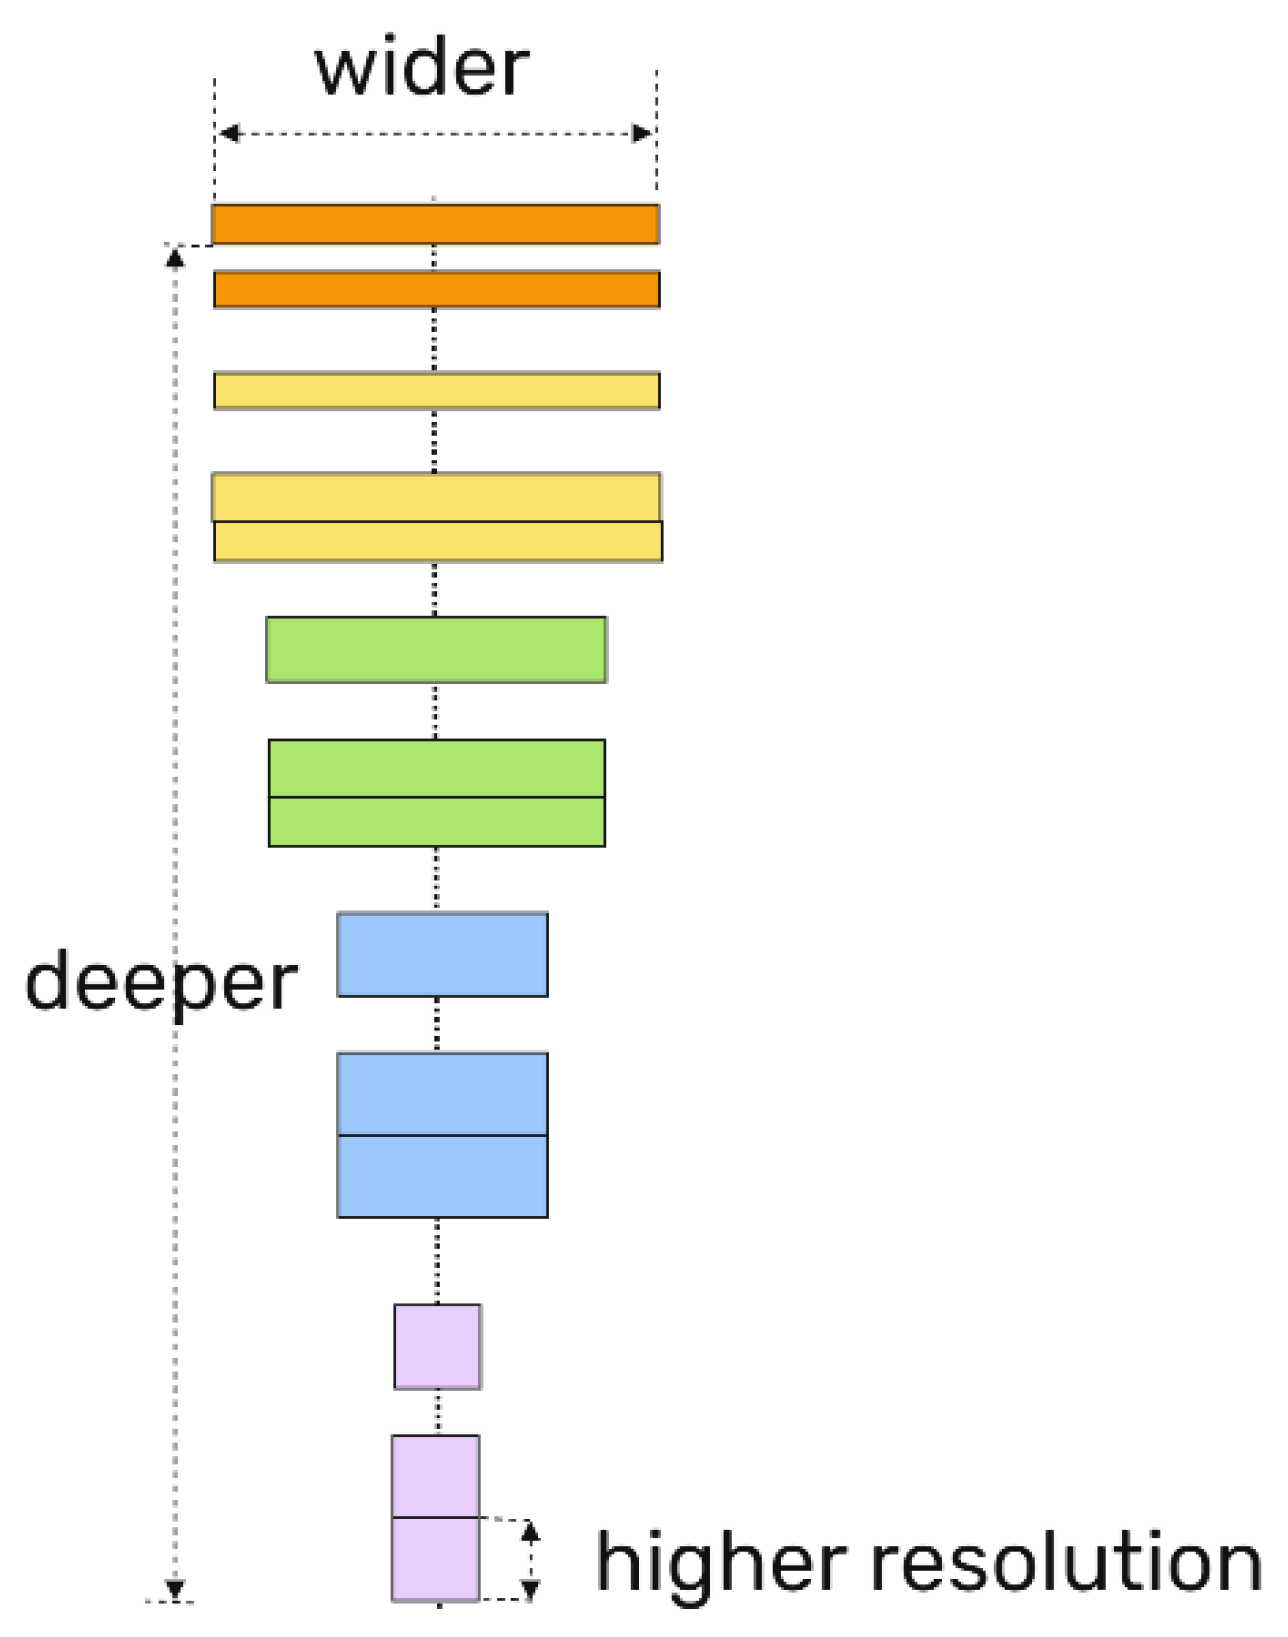
Figure 6.
Blocks of ResNet50: (a) residual block; (b) bottleneck block.
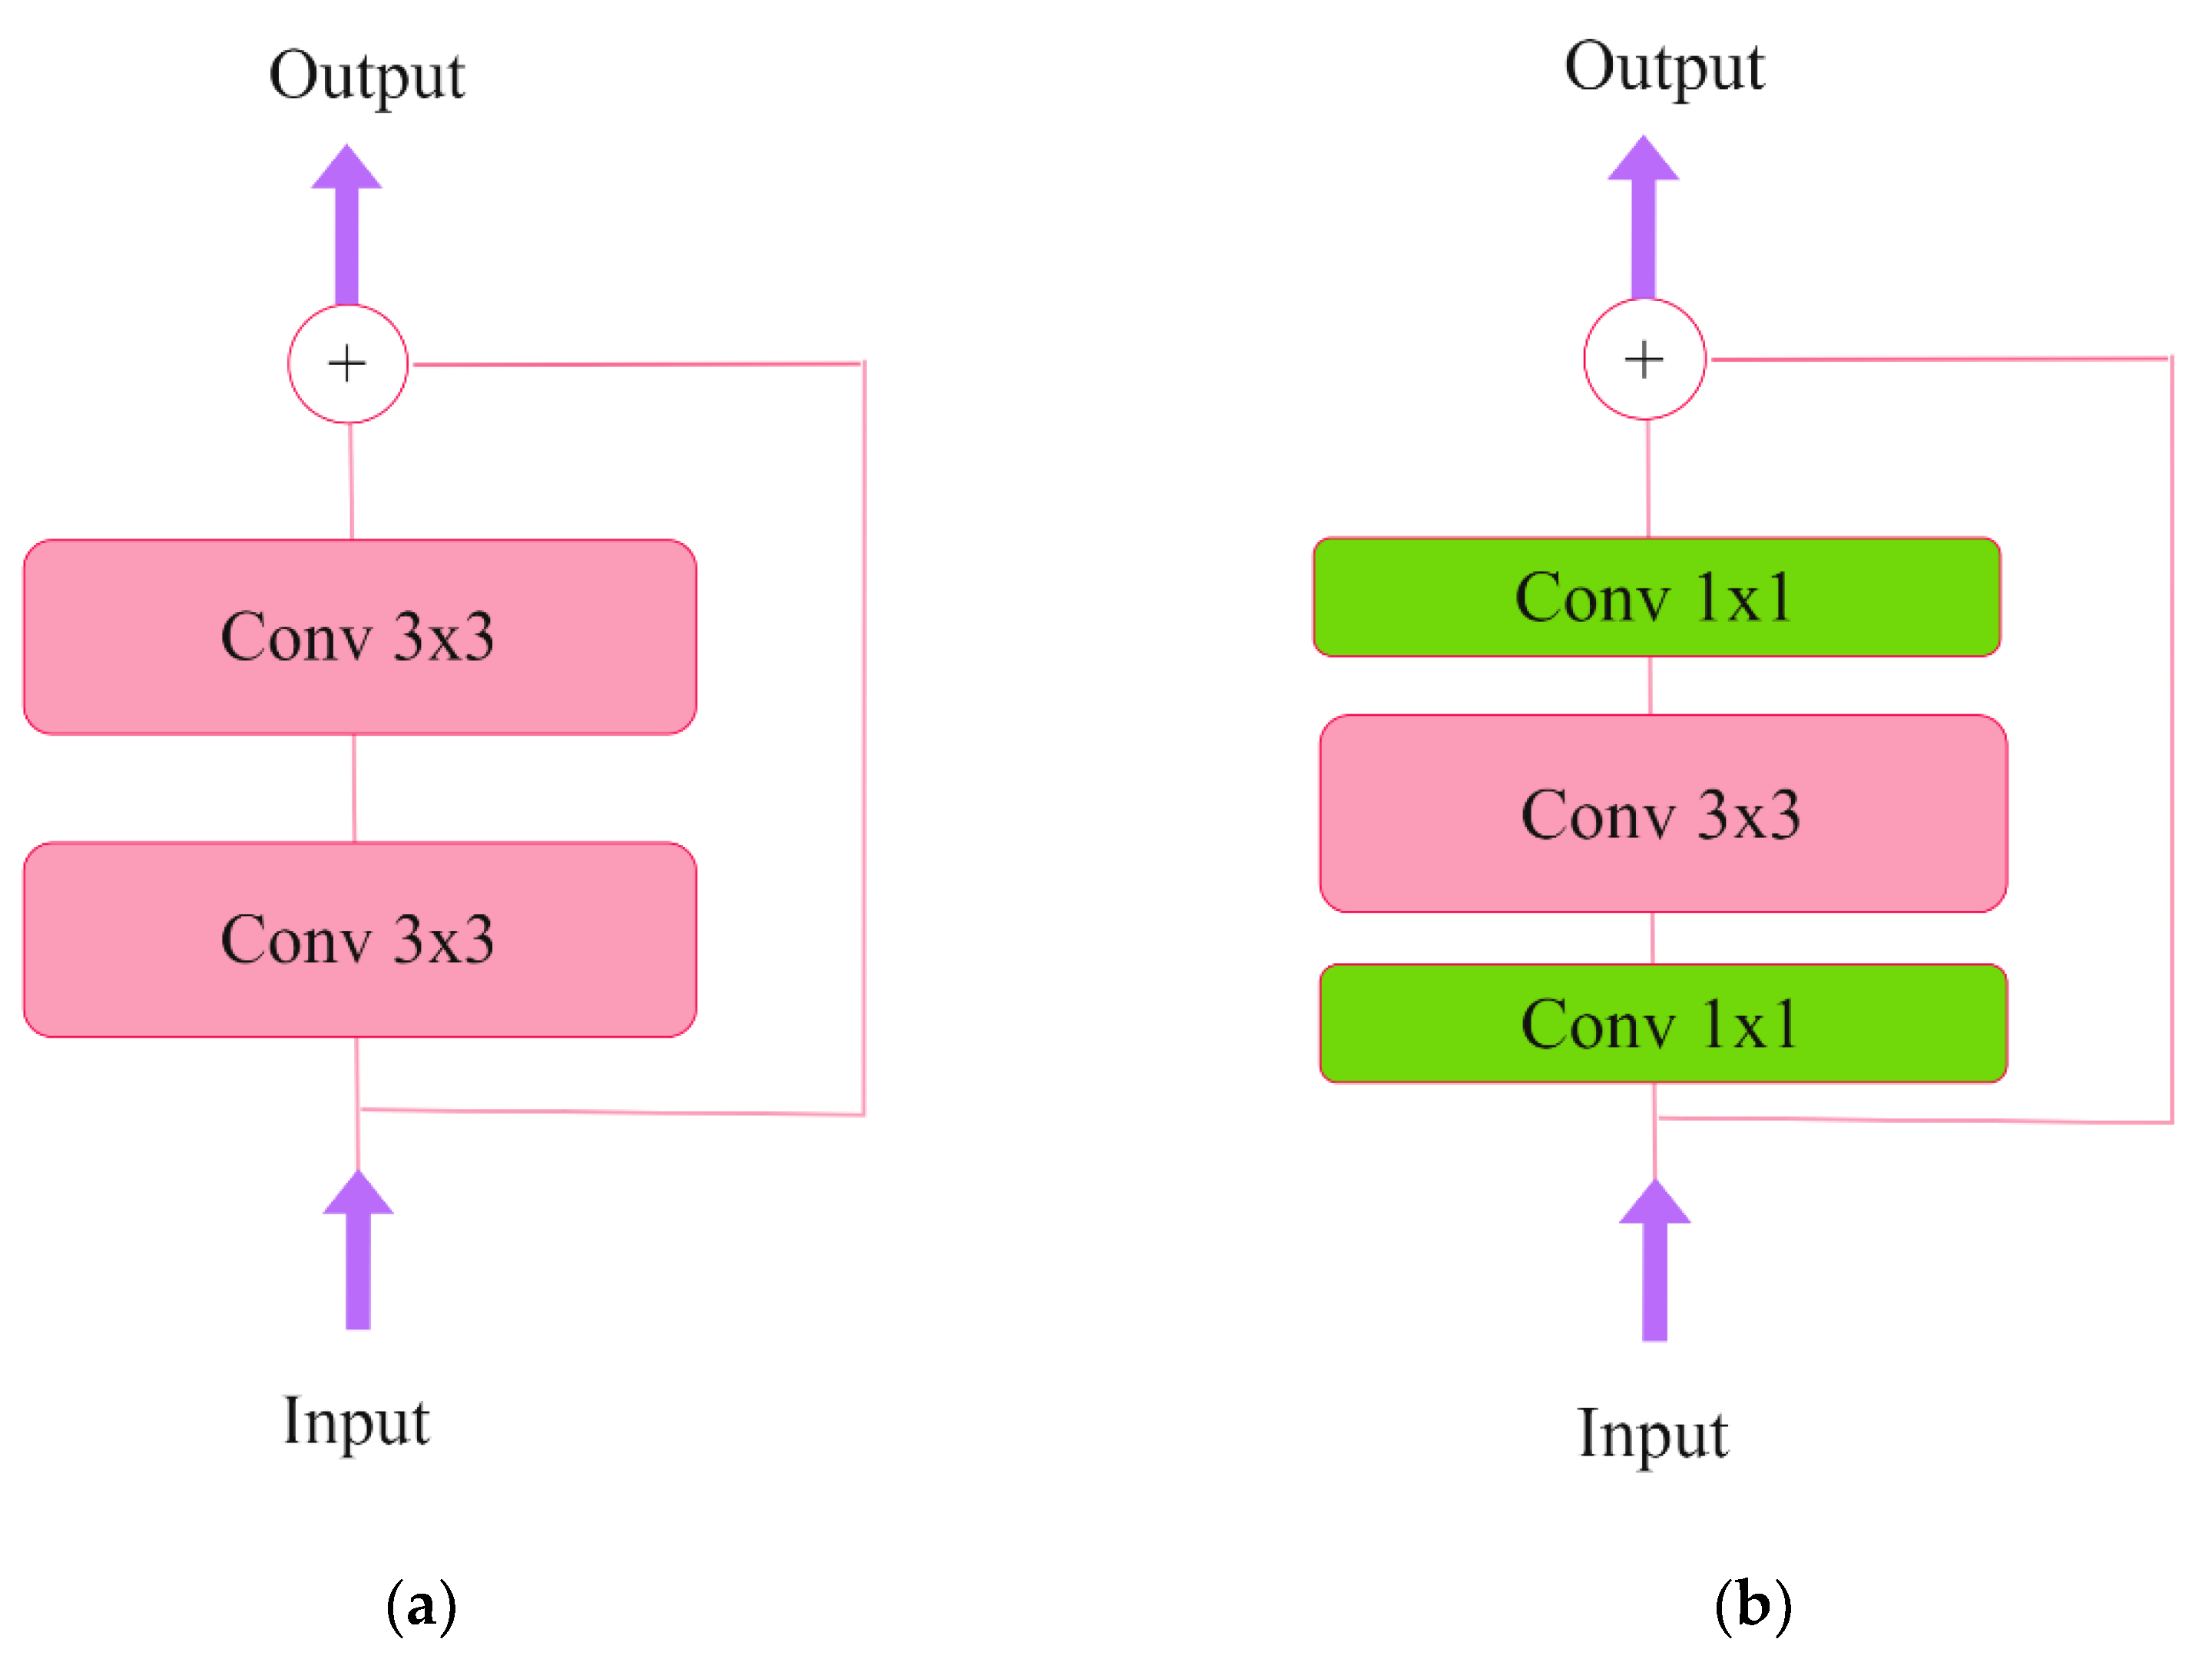
Figure 7.
The Visual Transformers architecture.
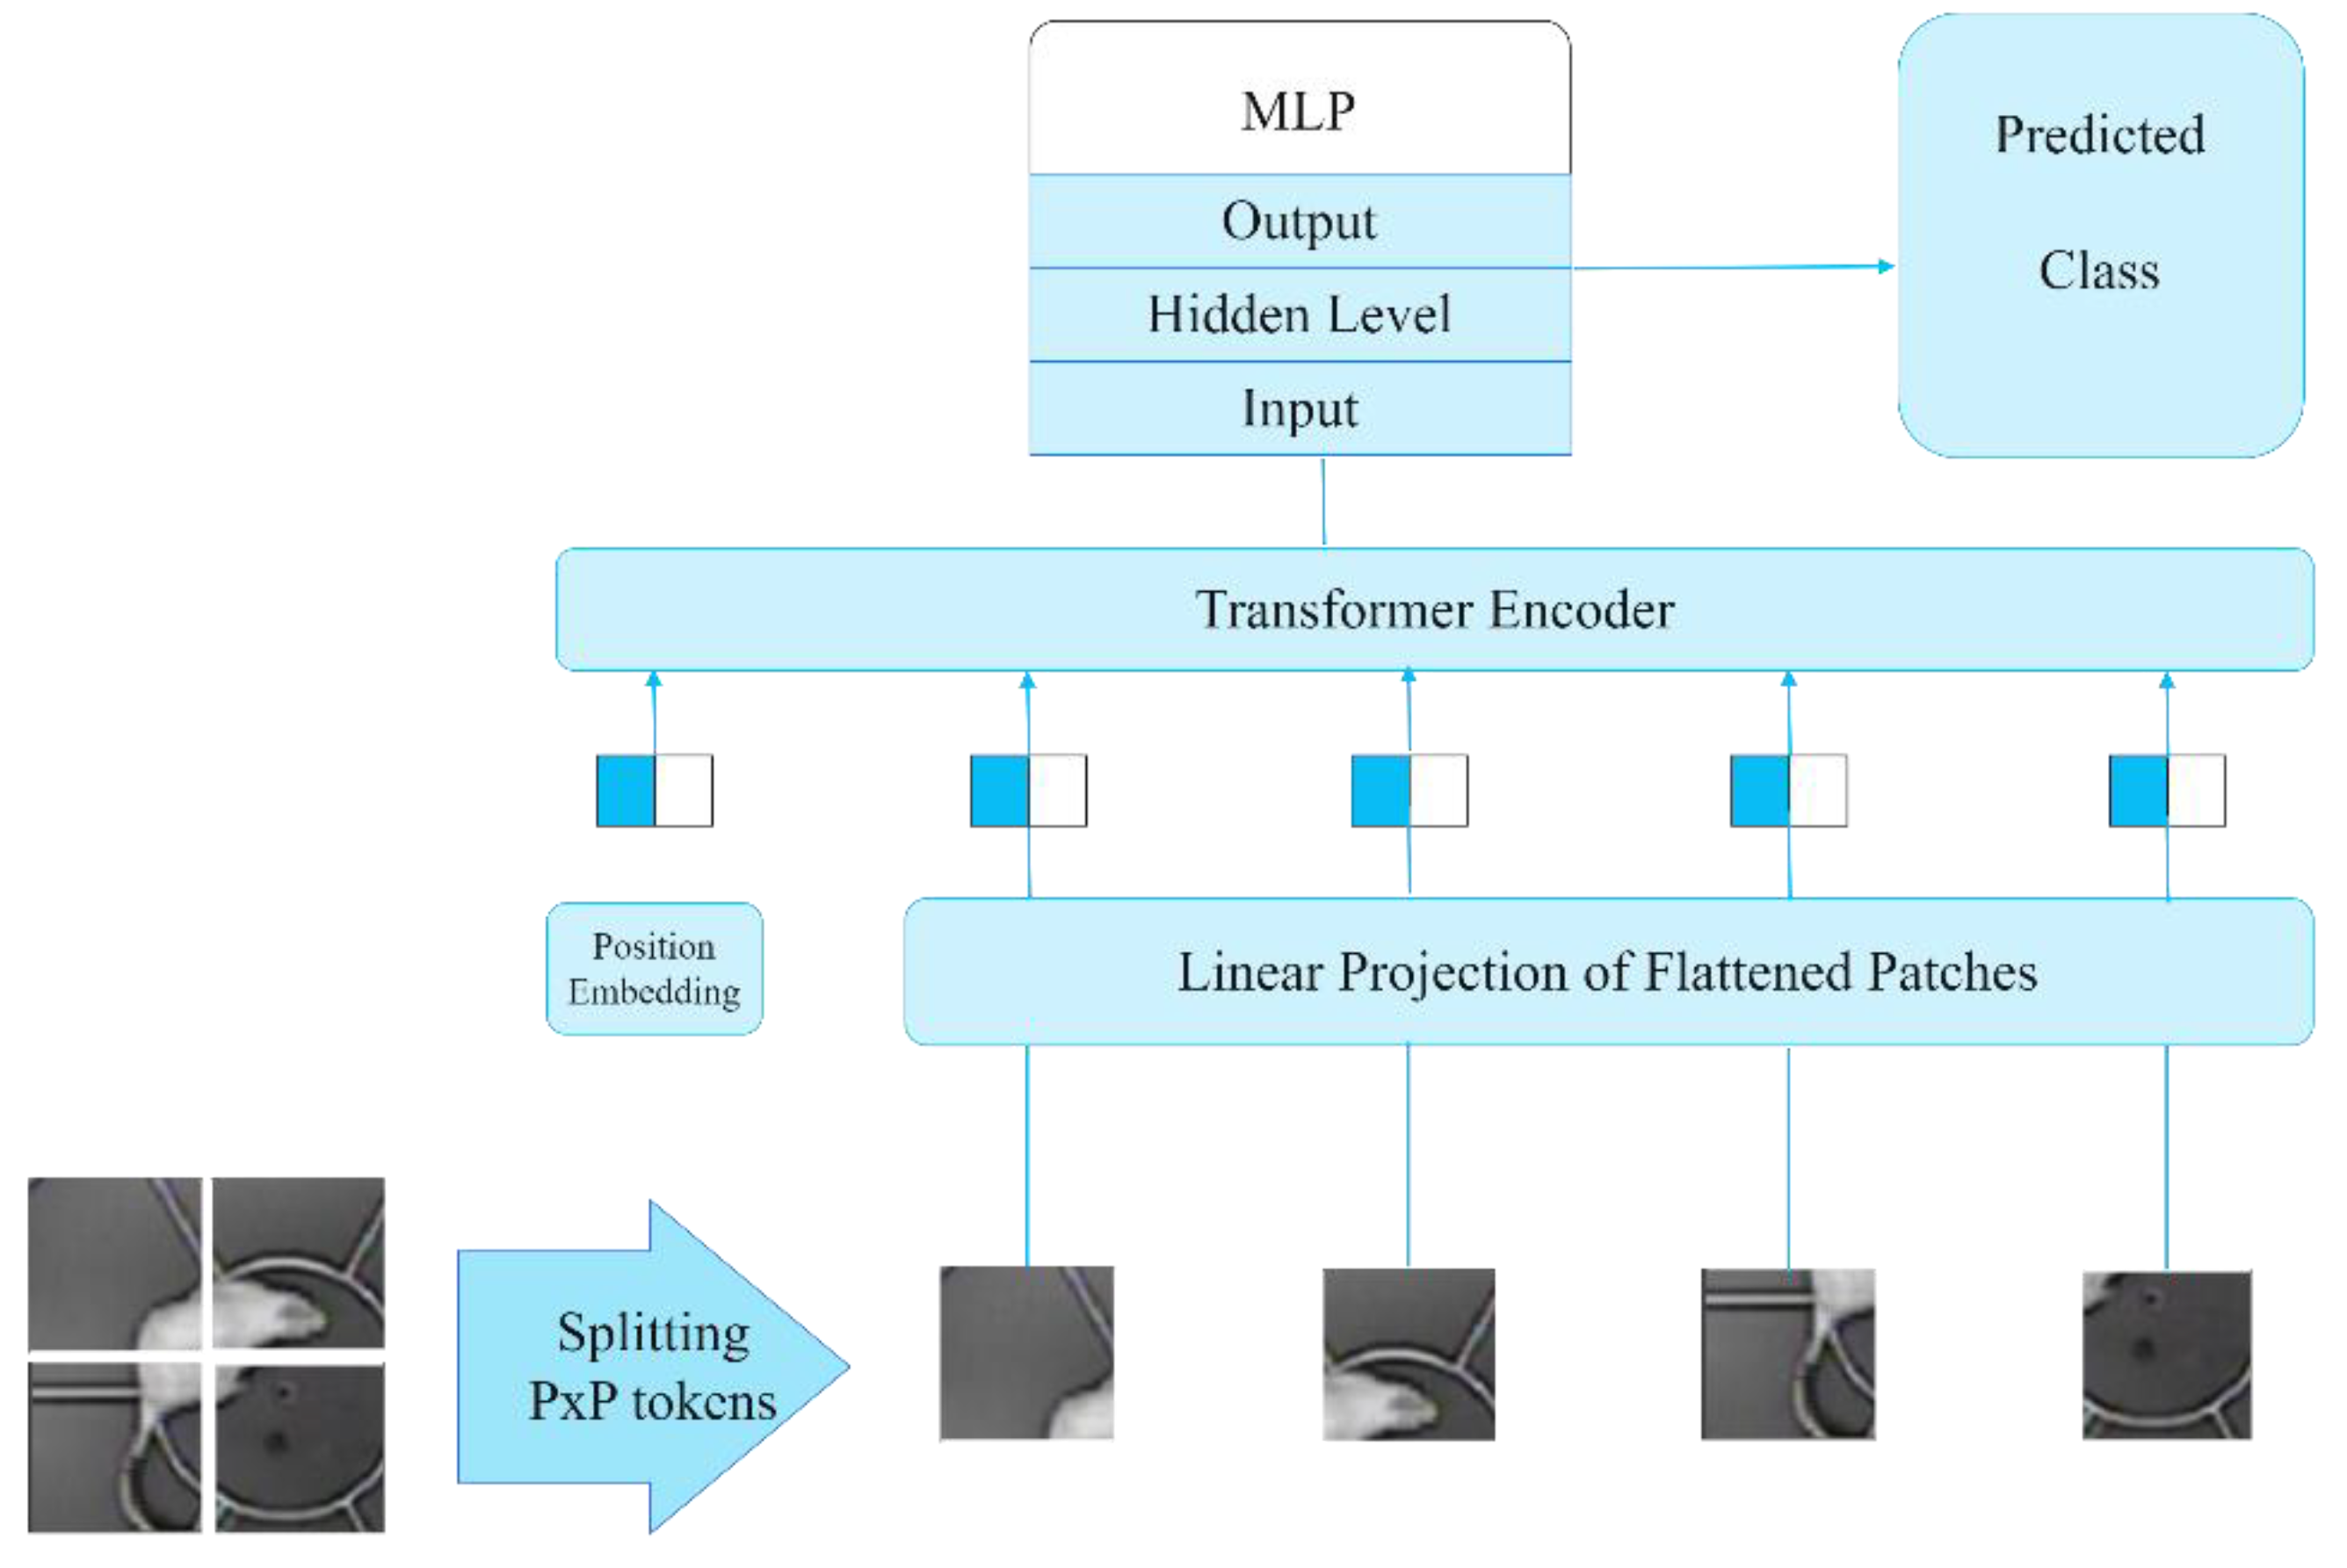
Figure 8.
The markup (a) and (b) employ a color-coded time-based representation of data. The green color indicates the current point in time, the blue color indicates a future point in time, and the red color indicates a past point in time.
Figure 8.
The markup (a) and (b) employ a color-coded time-based representation of data. The green color indicates the current point in time, the blue color indicates a future point in time, and the red color indicates a past point in time.
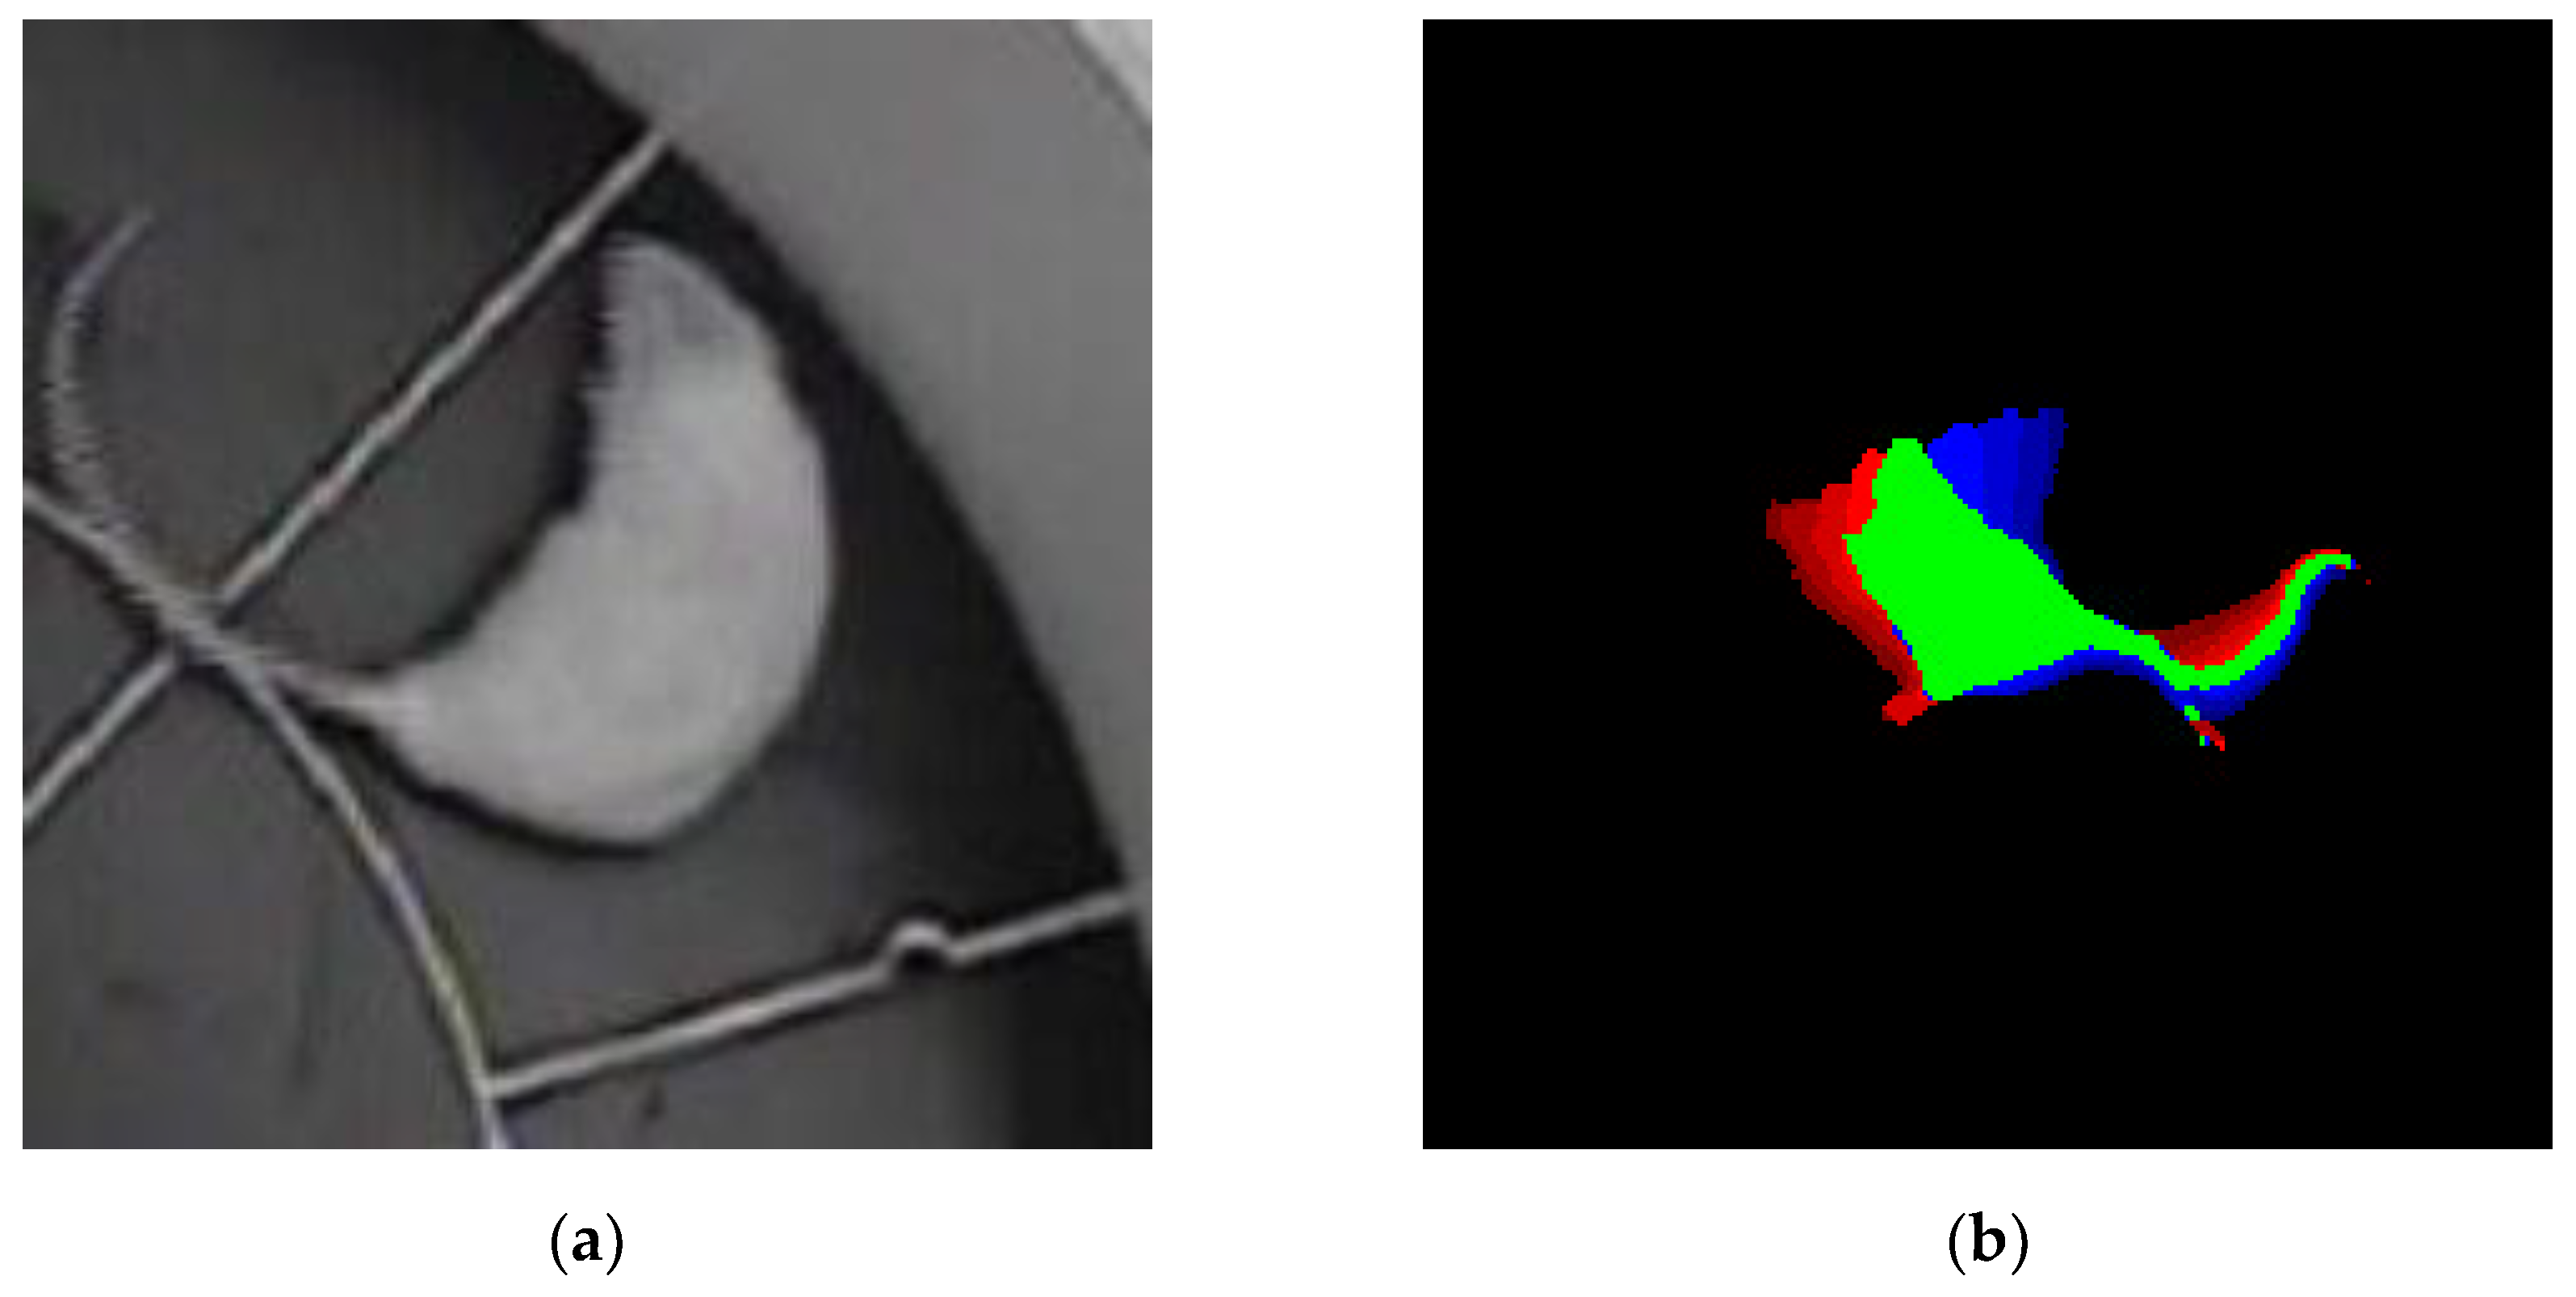
Figure 9.
Metrics of ResNet50 model, trained on a classically labeled dataset.
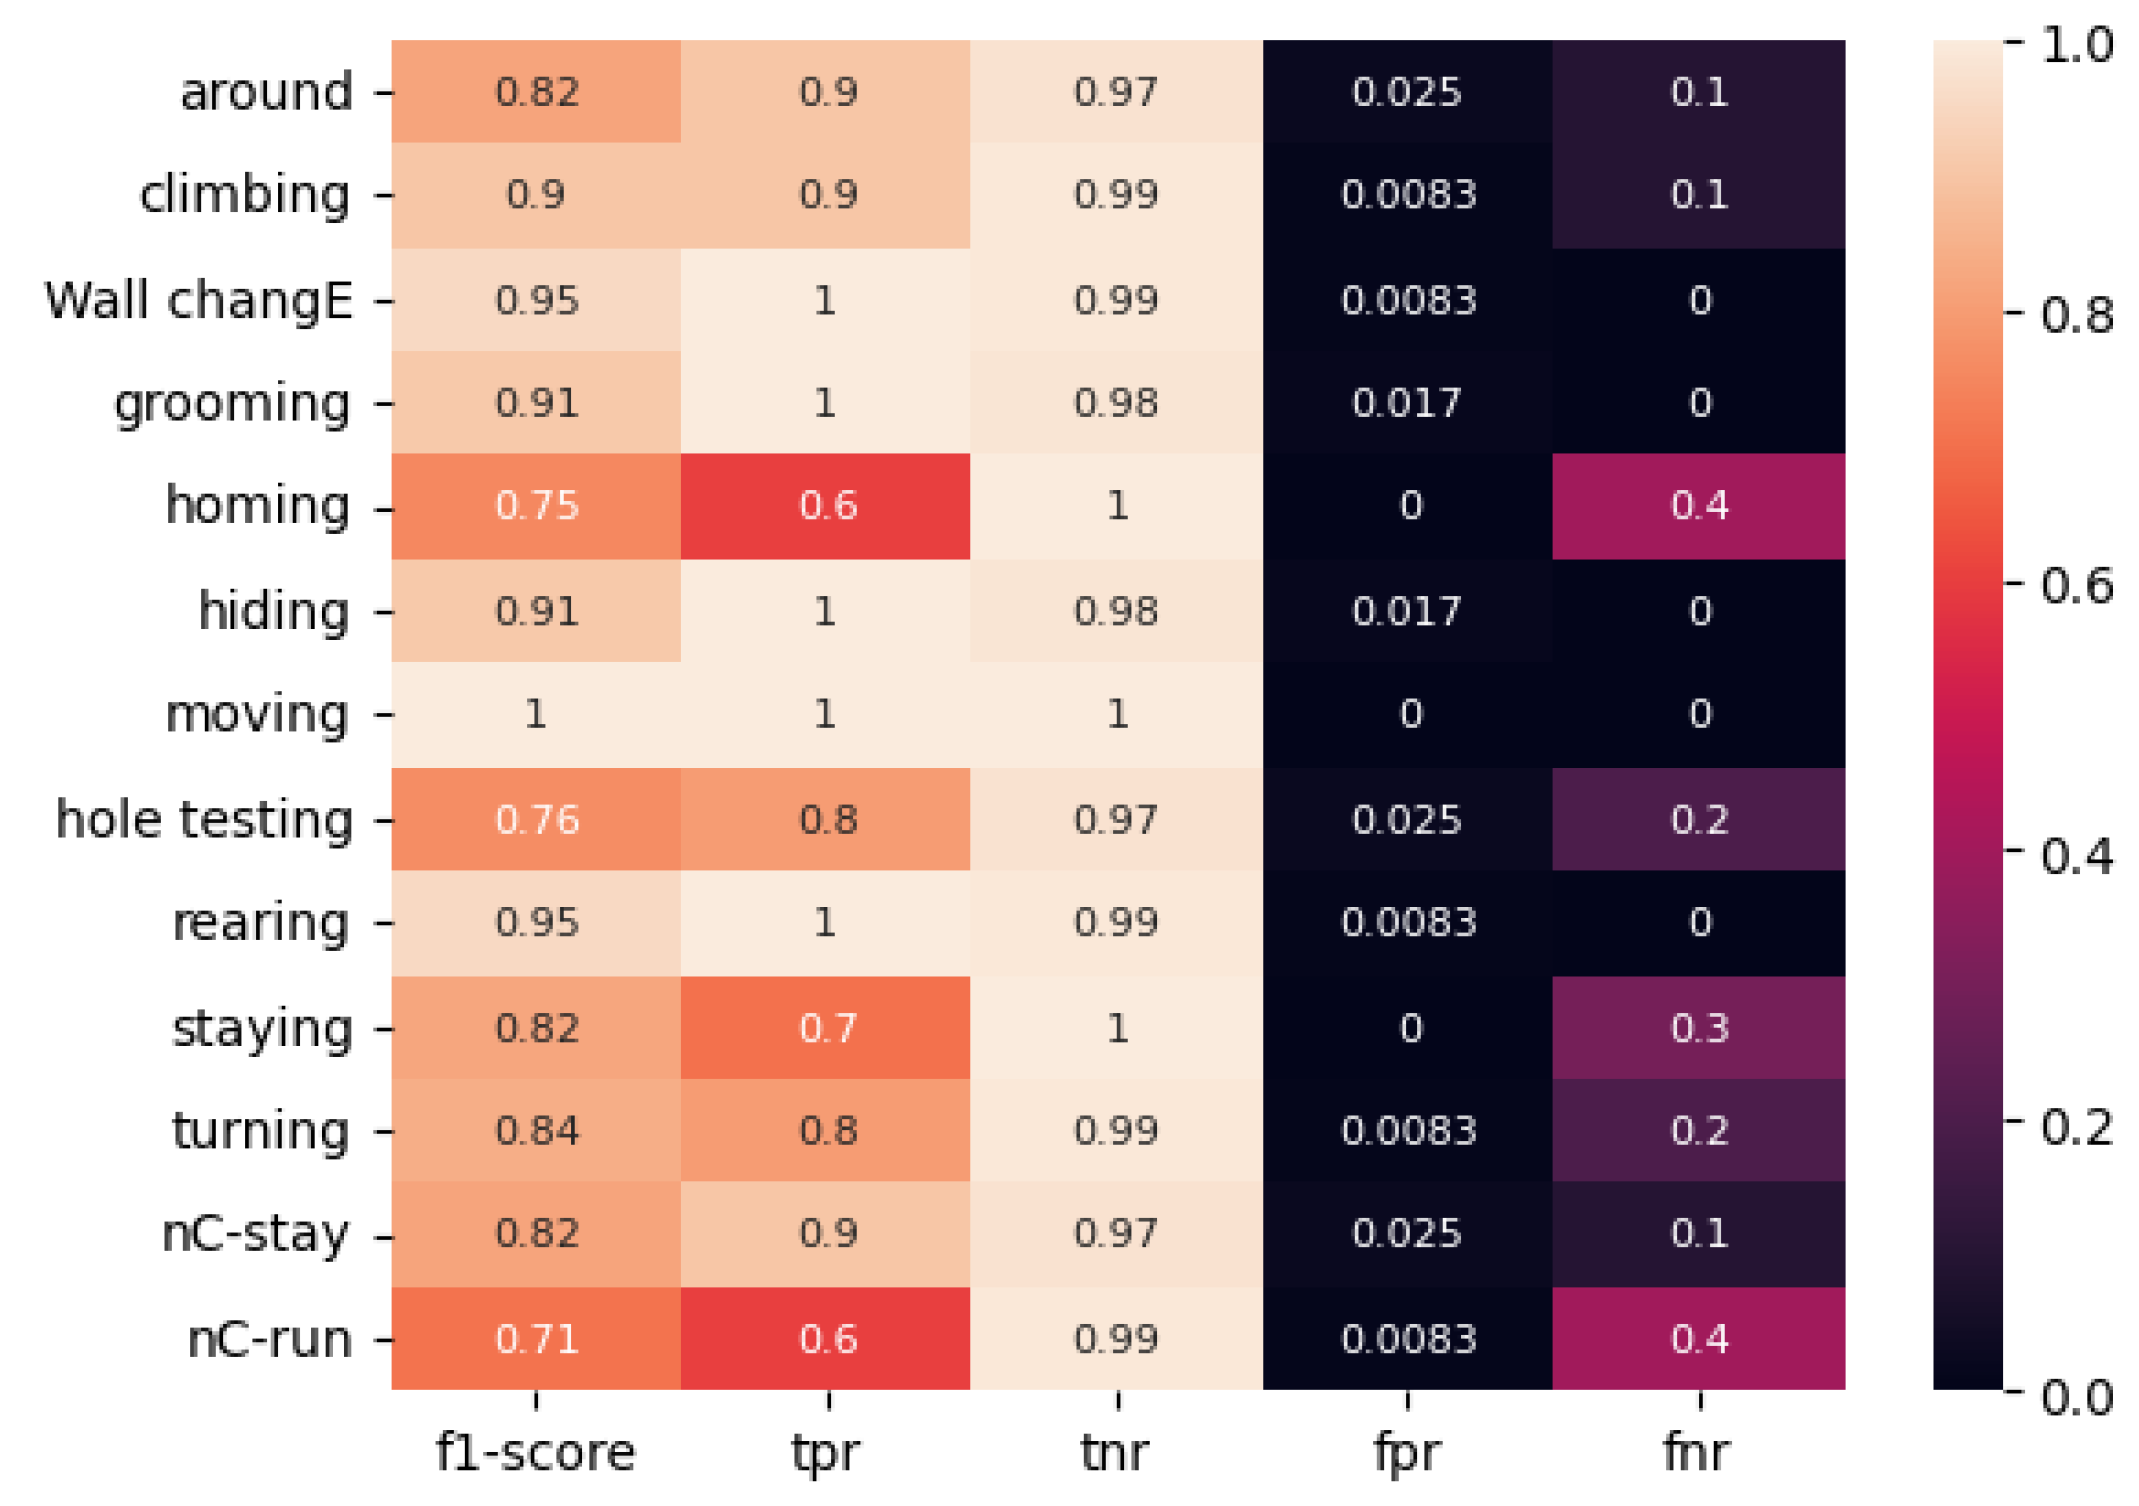
Figure 10.
Metrics of ResNet50 model trained on the dataset labeled by the proposed method.
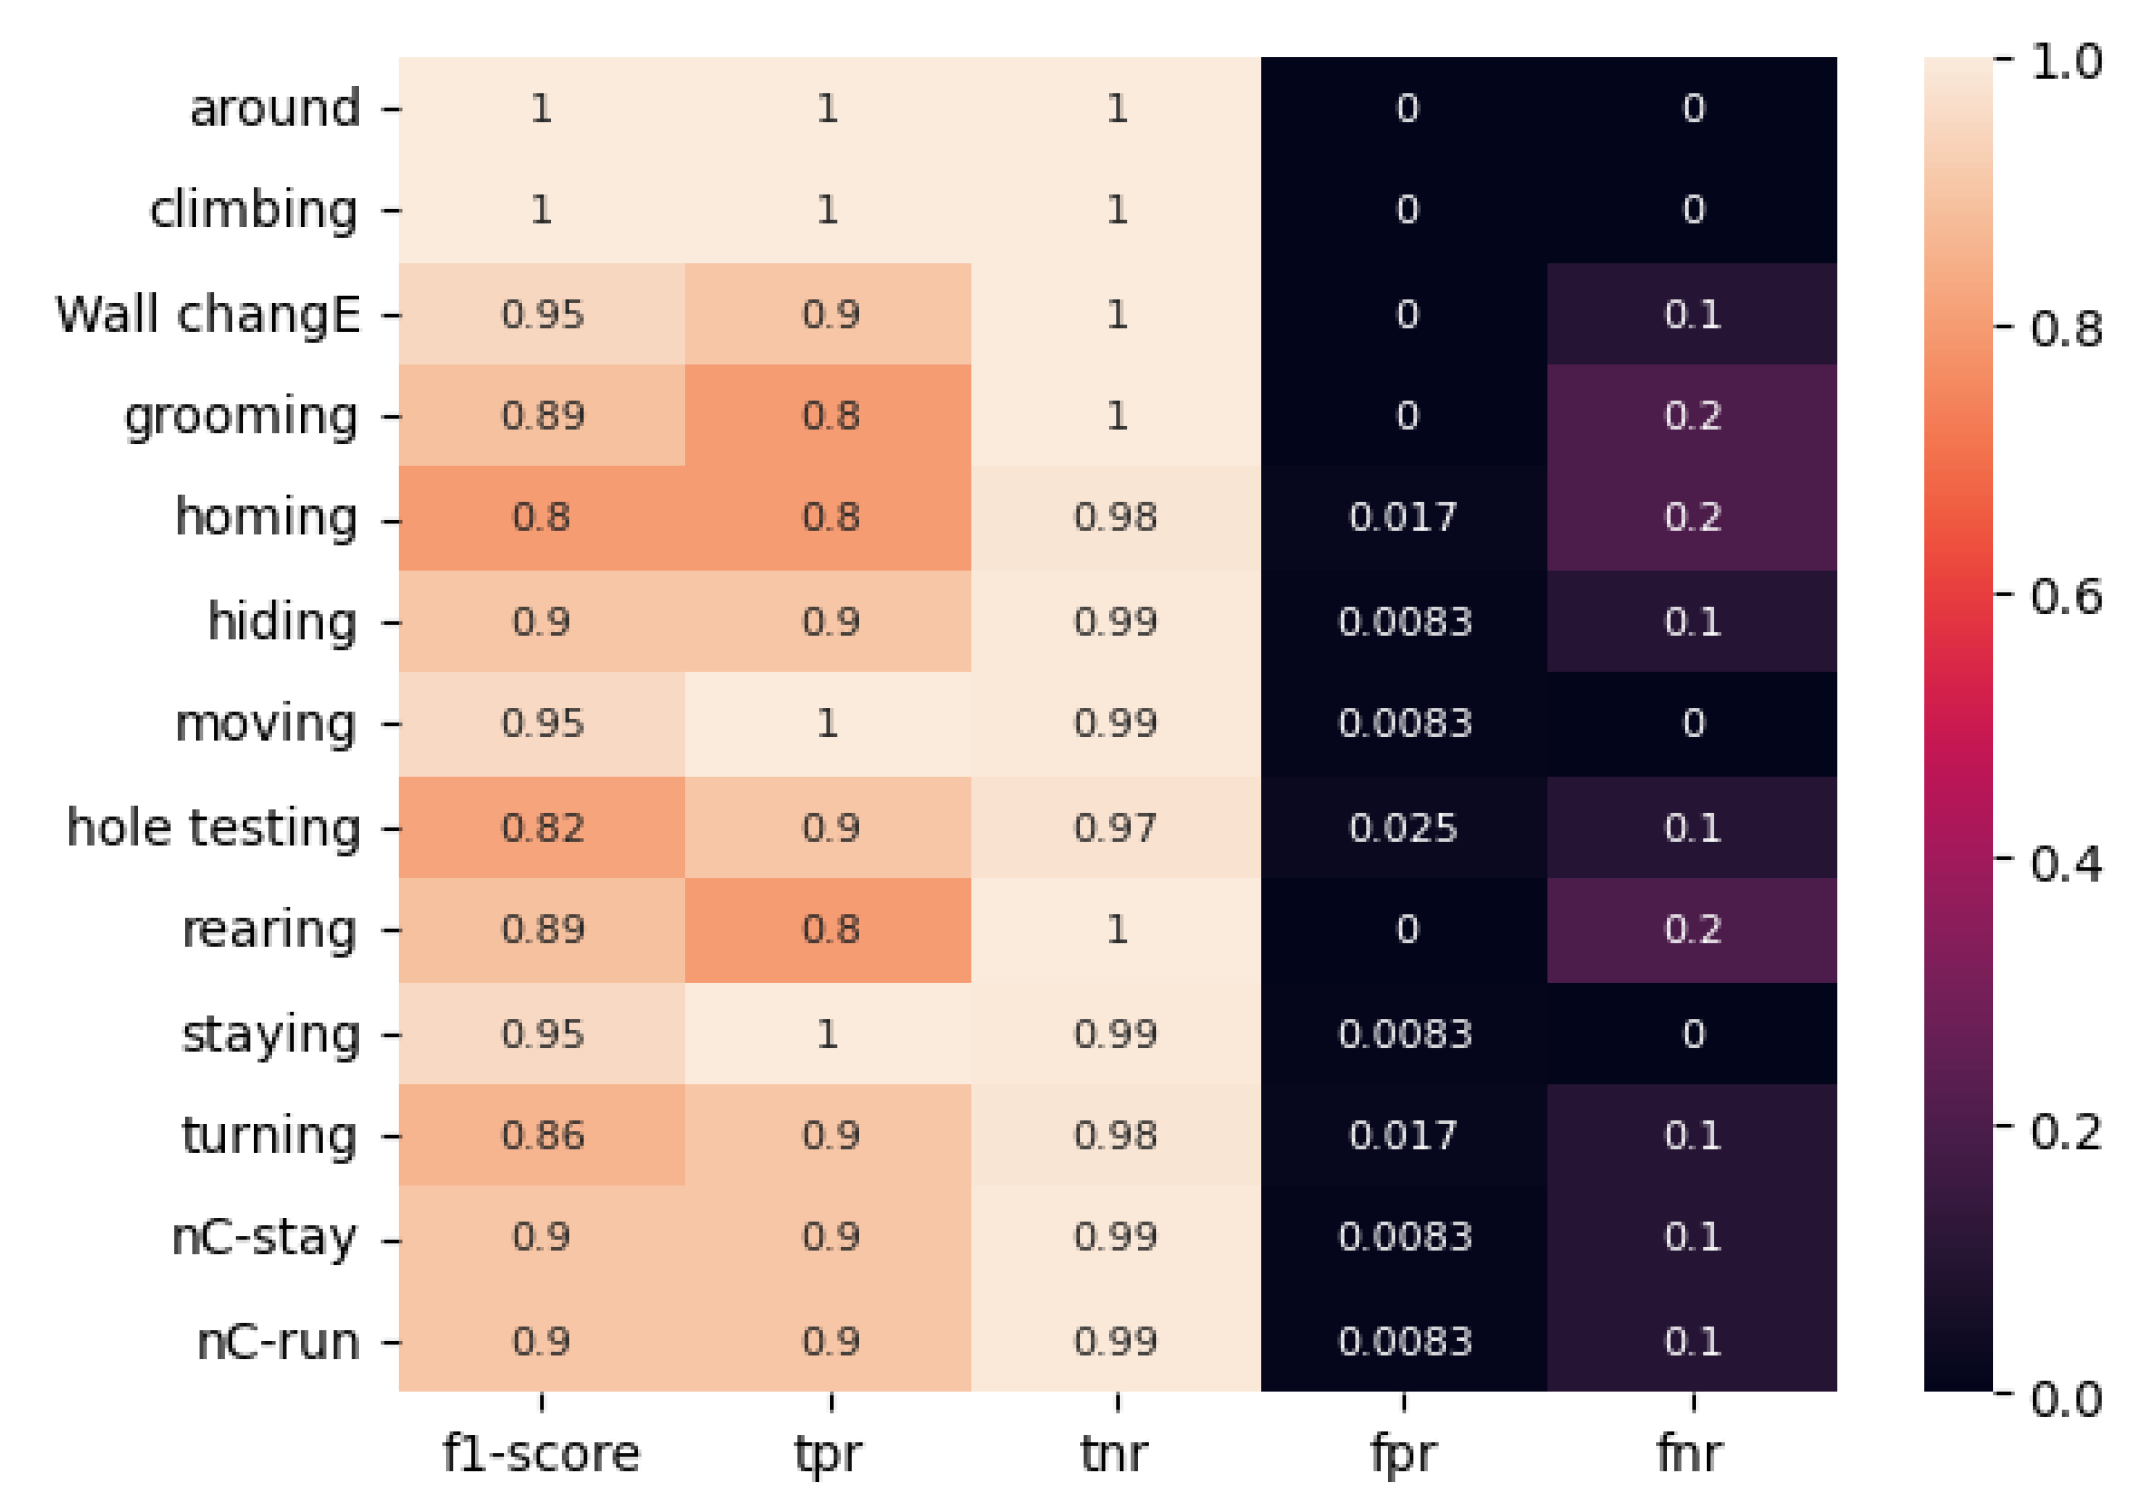
Figure 11.
Metrics of ViT model, trained on a classically labeled dataset.

Figure 12.
Metrics of ViT model trained on the dataset labeled by the proposed method.
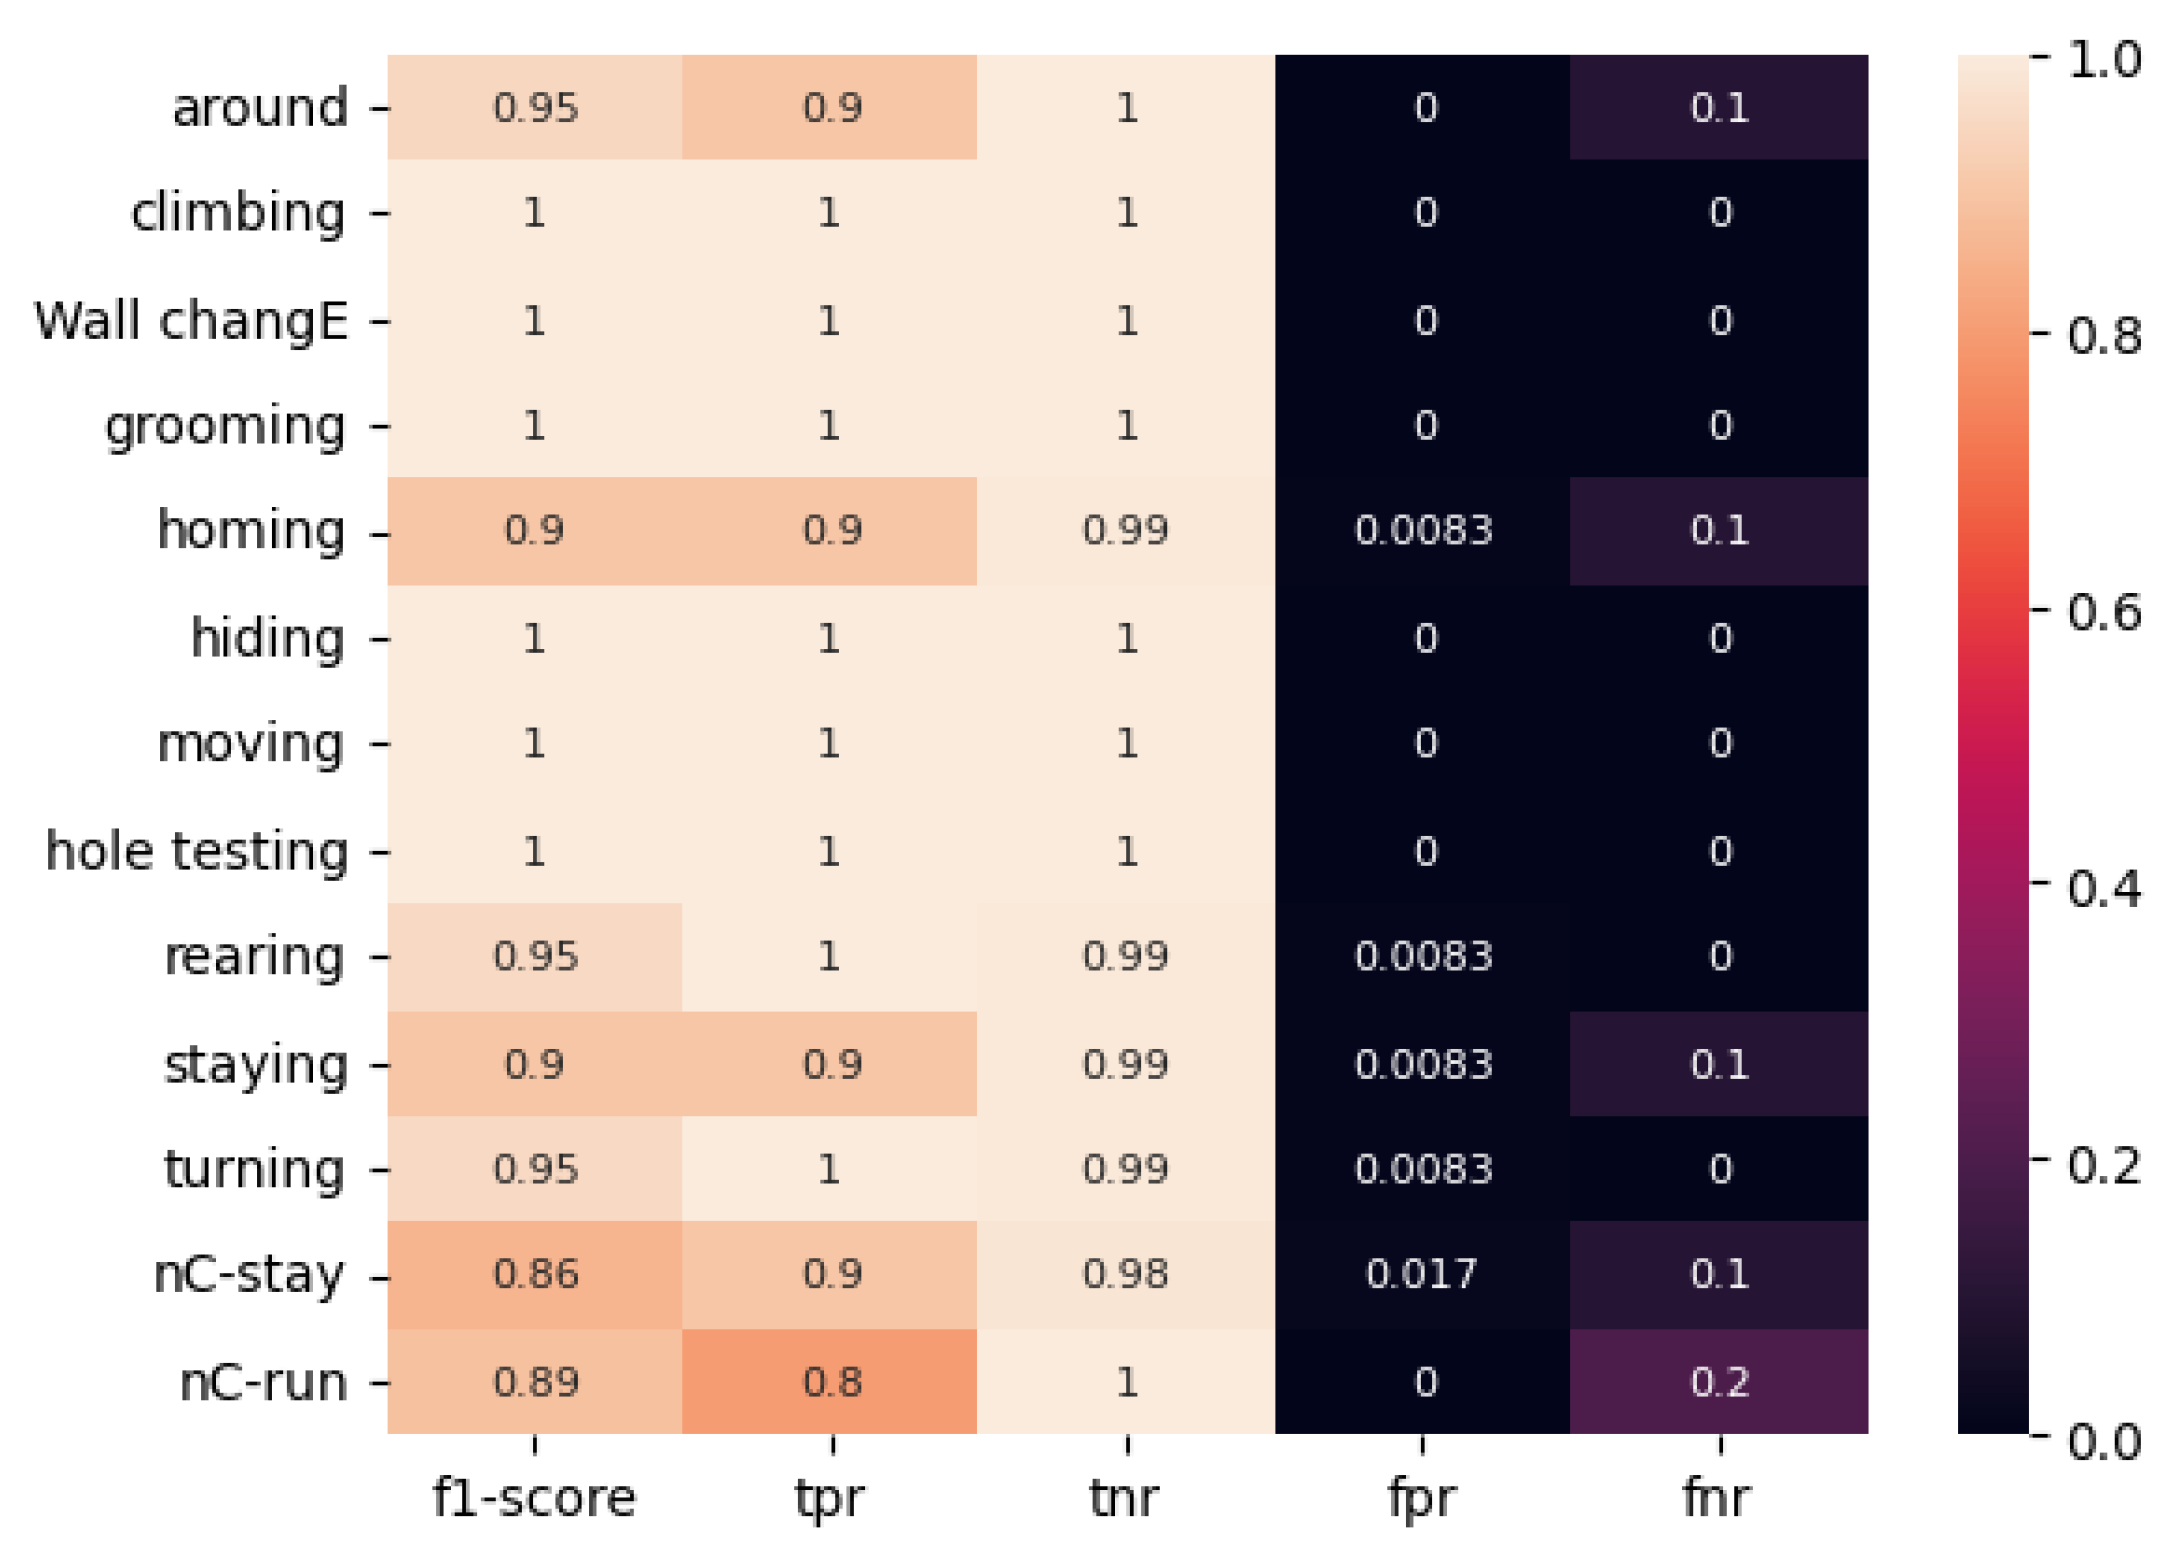

Table 1.
Behavioral events that were identified during the experiment.
| Behavioral event | Code | Short Code | Samples in dataset |
|---|---|---|---|
| Full rotation | around | a | 72 |
| Climbing | climbing | c | 274 |
| Changing direction at the wall | Wall change | e | 42 |
| Grooming | grooming | g | 122 |
| Immobility near the wall | homing | h | 96 |
| Hiding | hiding | i | 175 |
| Moving | moving | m | 257 |
| Head-dipping in the holes | hole testing | o | 83 |
| Rearing | rearing | r | 69 |
| Immobility in the open place | staying | s | 129 |
| Change of direction in the open place | turning | t | 195 |
| Brief stop & incomplete climbing | nC-stay | x | 112 |
| No stop & incomplete climbing | nC-run | y | 84 |
Disclaimer/Publisher’s Note: The statements, opinions and data contained in all publications are solely those of the individual author(s) and contributor(s) and not of MDPI and/or the editor(s). MDPI and/or the editor(s) disclaim responsibility for any injury to people or property resulting from any ideas, methods, instructions or products referred to in the content. |
© 2024 by the authors. Licensee MDPI, Basel, Switzerland. This article is an open access article distributed under the terms and conditions of the Creative Commons Attribution (CC BY) license (http://creativecommons.org/licenses/by/4.0/).
Copyright: This open access article is published under a Creative Commons CC BY 4.0 license, which permit the free download, distribution, and reuse, provided that the author and preprint are cited in any reuse.


