Submitted:
29 October 2024
Posted:
31 October 2024
You are already at the latest version
Abstract
Stock price prediction is challenging due to global economic instability, high volatility and complexity of financial markets. Hence, this study compared several machine learning algorithms for stock market prediction and further examine the influence of sentiment analysis indicator in predicting stock price. Our results are in two-fold. Firstly, we present a lexicon-based sentiment analysis approach for identifying sentiment features and thus, evidence the correlation between the sentiment indicator and stock price movement. Secondly, we propose the use of GRUVader, an optimal gated recurrent unit networks for stock market prediction. Our findings suggest stand-alone models struggle when compared with AI-enhanced models. Thus, our paper made further recommendations on latter systems.
Keywords:
ARIMA
; GRU
; machine learning
; sentiment analysis
; time series analysis
1. Introduction
The general public are increasingly interested in stock market prediction, more specifically, the traders, investors and decision makers [1]. This is due to their interest in making informed and strategic decisions on their financial stock business, investments and intentions to invest. The stock market influences the economic growth of every nation, enabling buying and selling of investments, which supports businesses and boosts the economy [2]. Therefore, an accurate stock market prediction is vital to understand the market and mitigate investment loss. Recent advancement in technology and machine learning (ML) techniques has improved stock market prediction [1]. However, due to the unpredictive nature of stock market, influence of external factors, high complexity and volatility (short-term fluctuations and long-term trends), having a more stable and accurate prediction of stock market is challenging. Traditional models like autoregressive integrated moving average (ARIMA) have shown effectiveness in short-term forecasting [3]. ARIMA is useful to capture trends and seasonality [4], however, limited in capturing complex and non-linear relationships. Furthermore, theories like the efficient market hypothesis (EMF) and random walk theory suggest that historical data is insufficient in predicting stock prices as the price changes randomly and are influenced by external factors such as financial news [5]. Improvements in AI have led to application of neutral network-based prediction models, such as recurrent neural network (RNN) and convolutional neural networks (CNN), which are effective with time series data but face challenges with unstructured (text) data [6,7]. Recent studies emphasize the importance of incorporating textual data, as investor sentiment or external events (for example, Brexit, COVID-19) significantly impact stock price movements [8].
Previous studies [9,10,11] have explored various ML models on stock prediction incorporating the text data sentiment. However, these models were proposed with low performance for predicting stock price. Further to this, our literature synthesis (presented in section 2), indicates that only few methodologies are robust to exogenous variables from sources such as the financial news, company news, market sentiment, public opinion, and investors sentiment. In addition, literature review findings suggests that despite the extensive studies on the application of ML algorithms in this context, optimal stock prediction models are limited. For example, ref [11] used a regression model to predict stock movement based on sentiment indicator but did not clarify which stock were analysed, no information was provided on exogenous features towards the behavior of the target variable. Additionally, there was no comparison conducted against other models, nor optimality was achieved.
To this end, our study aims to develop a stock price prediction model and determine the influence of public sentiment. To achieve this, the study formulates the problem as a regression task and utilise dataset collected by Yukhymenko [11]. By doing so, we present our results from the experimental comparison of ML techniques, including ARIMA in two-folds. First is the results of experiment conducted to compare the ML algorithms using the stock price dataset. Second is the results of experiment conducted that incorporates public sentiment. The latter experiment helps to provide information on the behavior of exogenous features towards stock price. Based on the comprehensive experimentation, we propose GRUVader, as the best-performing stock prediction model. The results of this study not only offer insights into the comparative effectiveness of different ML techniques but also provide valuable guidance for selecting optimal models based on specific data characteristics. Specially, the findings are identified the model with superior accuracy, providing useful insights for stock market stakeholders regarding the key drivers of stock prices. The remainder of this paper is organized into four primary sections. Section 2 focuses on the literature review, Section 3 outlines the methodology, the following sections presents the results, and the final section provides conclusions and recommendations for future research
2. Related Works
Stock price movement can be modelled in several ways. There are two popular concepts to this. The first is to model as a classification task where the direction of movement of stock prices can be predicted as “up” or “down”. Secondly, is to predict the stock prices by formulating the problem as a regression task. The former approach is good for decision making processes, especially when beneficiaries are only interested in stock movement indicator. A popular ML algorithm for this approach is logistic regression [12]. Whilst the latter approach is more beneficial as it provides an understanding of financial gains or losses in the form of estimate and therefore, it is more popular. Predicting stock price provides valuable insights into financial market trends, guides investment decisions, and supports the development of effective financial strategies. Studies like [13,14,15,16,17,18] highlighted the reliance of investors and portfolio managers on stock price predictions for marking informed investment decisions. Accurate stock price prediction allows investors to adopt their portfolios proactively, capitalize on emerging opportunities, and strategically manage risks, ultimately resulting in more robust investments outcome. Conventional statistical learning algorithms such as linear regression has been used to model stock price movement [19]. Further to this, other techniques like the moving average [20], and exponential smoothing [21] have also been applied. Moreover, the time series models such as generalised autoregressive conditional heteroskedasticity [22,23] and ARIMA [24] have been used extensively. However, these models have been criticized for their limitation to model complex patterns within the stock price dataset [25].
More recently, advancement in technology led to the development and application of ML algorithms for stock price prediction. These ML algorithms ranging from the traditional ML algorithms (K-nearest neighbour [26], support vector regressor [27], decision tree [28], random forest [29], XGboost [30]) to the deep learning algorithms (RNN [31], LSTM [32], BiLSTM [33], GRU [34], BiGRU [35], GAN [36]) have been used to model stock price movement. In a comparative experimental study, authors in [37] showed that feed-forward neural networks yield better results when compared to ARIMA and ARIMAX. Furthermore, long short-term memory (LSTM) network introduced by [38], is a type of RNN designed to handle both long-term and short-term dependencies effectively. Several studies demonstrated the effectiveness of the LSTM in stock prediction. For example, authors in [39] showed attention-based LSTM outperform conventional LSTMs in predicting stock market movements. Study [40] showed LSTM can be used to enhance predictive performance by leveraging both past and future sequence in time series. Similarly, authors in [41] combined Bi-LSTM with CNN, showing a 9% improvement in prediction performance compared to single pipeline models. Whilst authors in [42] proposed a simple GAN model with LSTM as a generator and CNN as the discriminator, incorporating 13 technical indicators, and demonstrated that genrative adversarial network (GAN) outperformed other models like LSTM, artificial neural network (ANN), support vector machine (SVM), and ARIMA in stock price prediction. Ref [43] used GAN with a LSTM generator and a multiple perceptron (MLP) discriminator, outperforming traditional model based on RMSE and MAE. Authors in [44] proposed gated recurrent unit (GRU) with LSTM and dropout layer to model stock price based on historical data from S&P 500. Their results demonstrated better performance compared to RNN, CNN, and other ensembled techniques. Further to this, study [45] indicated that integrating news data with stock data and feeding into GRU model led to enhanced prediction results, surpassing LSTM models in accuracy. Authors in [46] combined GRU and LASSO dimensionality reduction, achieving improved accuracy for stock price prediction using data from the Shanghai Composite Index.
More recently, authors in [47,48] emphasized on the influence of financial news and investors words on the stock price movement. They further stated stock price prediction is more challenging due to these constraints and as such researchers considered modelling stock price movement by integrating sentiment indicators and financial stock price dataset. The sentiment indicator can be achieved by performing sentiment analysis of the financial news or stakeholders/investors words. Sentiment analysis is the process of classifying emotions or opinion expressing natural language into categories such as positive, negative and neutral [49,50,51]. Authors in [40,47,48] assert that sentiment analysis of financial news or stakeholders/investors comments is crucial for forecasting stock trends. The importance of sentiment analysis for stock prediction has been emphasized in previous studies. For example, authors in [52] incorporated investor sentiment to predict the CS1300 index using LSTM. The LSTM model outperform the traditional time-series models for financial data. Moreover, authors in [53,54] demonstrated how incorporating lexicon-based sentimental analysis of financial news with historical stock data can effectively predict market trends for indices like DIJA and S&P 500. Similarly, [55] found that combining sentiment analysis with stock data for modelling stock, particularly CNN, produces the good results. More specifically, study [11] used GAN to model stock price however, their study failed to provide detail on the influence of sentiment indicator utilized. To conclude, it is worth stating that majority of these studies ignored the use of hyper parameter tunning. In addition, most existing studies did not provide explicit or comprehensive detail of the sentiment score implemented. As such it is difficult to assess the reliability and efficiency of the models.
3. Methodology
This paper proposes the use of GRUvader for stock price prediction. By doing so, we compare GRUvader to traditional time series model namely, ARIMA and state-of-the-art ML models. The selection of the ML algorithms is based on their performances shown in the stock market prediction literature, as reviewed in previous section. In subsequent sections, this study presents detail of the datasets, and our approach.
3.1. Dataset
This study used two datasets to model stock market prediction. First, is the stock price dataset and the second is the text data. Below, we provide an overview of the datasets.
3.1.1. Stock Price Dataset
The stock price dataset was collected by Yukhymenko [11]. The dataset has been used extensively in the literature [9,56] for modelling stock price. The dataset contains daily information for 25 companies from September 30, 2021, to September 29, 2022. The dataset includes 6300 observations over eight features namely, date, open, high, low, close, adjusted close, volume and stock name. The data were collected only on weekdays (Monday to Friday), and no missing values were found. The companies represented in the dataset are Tesla (TSLA), Microsoft (MSFT), Amazon (AMZN), Google (GOOG), and Apple (AAPL), Netflix (NFLX), Taiwan Semiconductor Manufacturing Company Limited (TSM), Coca Cola (KO), Ford (F), Procter & Gamble Company (PG), Costco (COST), Disney (DIS), Verizon (VZ), Salesforce (CRM), Intel (INTC), Boeing (BA), Blackstone (BX), Northrop Grumman Corporation (NOC), PayPal (PYPL), Enphase Energy (ENPH), NIO In (NIO), ZS, and XPeng Inc (ZPEV). Each company contribute approximately 252 records. Figure 1 below presents a view of the dataset.
3.1.2. Text Dataset
The text data used in this study are tweets, collected from Twitter (currently known as X) by Yukhymenk [11] which contains four attributes namely, date, tweet, stock name and company name as shown in Figure 2 below. The dataset contains 80,792 observations and for the purpose of this study, only tweets with more than 10 likes were selected.
3.2. Our Approach
This paper deployed GRUvader as a hybrid approach for stock price prediction. GRUvader combines the power of deep learning algorithm and lexicon based sentiment analysis for prediction. This paper explains the two components as follows.
The gated recurrent unit (GRU) is a type of RNN designed as a simple alternative to LSTM networks. GRU utilizes a gating mechanism that enables it to selectively update its hidden state at each time step, effectively learning both short and long-term dependencies in sequential data. This makes GRU effective for applications such as language translation, speech recognition, and timeseries forecasting. GRU comprises of two gates namely, reset gate and update gate to control the flow of information. The reset gate is used to determine how much of the previous hidden state should be forgotten. Whilst the update gate is used to control how much new information should be added to the hidden state. These gates allow GRUs to selectively retain or discard information, enabling effective learning of temporal pattern while using fewer parameters than LSTMs resulting in a simpler and computationally efficient model. Thus, the GRU can be mathematically represented as follows.
where:
Reset Gate (rt) = (Wr .[ht-1, xt] + br)
Update Gate (ut) = σ(Wu .[ht-1, xt] + bu)
Candidate Activations (ht) = tanh(Wh.[rt* ht-1, xt] + bh)
Output (ht) =(1-ut)*ht-1+ut*h^t
xt is the input vectors at time t.
ht is the new hidden state at time t.
ht-1 is the previous hidden state.
Wr, Wu, and Wh are the weights matrices for the reset gate, update gate and candidate activation respectively.
br, bu, and bh are the bias vectors for the reset gate, update gate and candidate activation respectively.
σ is the sigmoid activation function.
Tanh is the hyperbolic tangent activation function.
3.2.1. Sentiment Analysis
In this context, sentiment analysis is the process of classifying public or investors’ emotions and opinion expressed in text into categories such as positive, negative and neutral. There are two popular approaches to sentiment analysis namely, ML approach and lexicon-based approach [49,50,51]. The study utilises the lexicon-based approach as supervised ML approach requires large, labelled dataset for training purposes. Unfortunately, this is not readily available. Based on this background, we employ VADER lexicon to analyse the sentiment of the text data. This will help measure the exogenous features related to stock. VADER (Valence aware dictionary and sentiment reasoner) is specially designed for social media content and uses a lexicon and rule-based approach to analyse polarity and intensity of emotions. VADER lexicon comprises of 7,517 words and phrases, each of which are assigned sentiment scores ranging from -4 to +4. VADER algorithm breaks down text into tokens and based on the labels in the lexicon, it assigns an overall sentiment score (normalised compound score) at a range of -1 to +1.
3.2.2. Experimental Setup
The GRU was implemented in Python using keras library. In the GRU architecture, we used two GRU layers. The first layer is a GRU with 50 units, and the second layer is a dropout layer (20%) to prevent overfitting and an output layer to predict the adjusted closing price. Further to this, we performed hyperparameter tuning on the number of units, dropout rate, and learning rate using a random search approach to minimize validation loss. The optimal model configuration was selected based on performance with validation set, and training was enhanced using callback like EarlyStopping and ReduceLROnPlateau to improve effectively and avoid overfitting. The Adam Optimizer was chosen for training due to its adaptive learning rates and computational efficiency. Adam combines features of Adagrad and RmSProp, making it suitable for optimizing non-stationary objectives with sparse gradients, which helps achieve faster convergences and more stable parameters updates compared to traditional optimizers. Thus, we summarize our experimentation as follows and present the workflow in Figure 3.
- Firstly, we experimented with GRU without the applying sentiment indicator and compared results against other ML algorithms (LSTM, Bi-LSTM, Bi-GRU, and GAN) including the traditional time series model ARIMA.
- The tweets were pre-processed, and we performed sentiment analysis using VADER. Furthermore, we compared VADER results against AFINN and TextBlob results to determine the best performing lexicon for this purpose.
- Moreover, we calculate the correlation between Adjusted close price and sentiment score to identify which stock exhibits the best correlation using the sentiment score and the price movement. This measures the behaviour of exogenous features towards adjusted close price.
- Lastly, we experimented with the hybrid of GRU and the sentiment indicator and thus, compared results against other ML algorithms (LSTM, Bi-LSTM, Bi-GRU, and GAN) integrated with the sentiment scores including the traditional time series model ARIMA.
3.3. Evaluation Metrics I
For evaluation of the sentiment analysis lexicons, we selected 2000 tweets randomly and labelled them manually as positive, negative, or neutral to create a reference dataset. In cases of disagreement, the tweets were discussed within the team to agree on the label. Thus, the 2000 labelled tweets were used to validate the performance of the lexicons. The confusion matrix was used to evaluate the performance of the lexicons by comparing the actual values against the predicted results. This was useful to calculate statistical metrics namely, true positive (TP), true negative (TN), false positive (FP), and false negative (FN). These metrics are described as follows.
- True Positive (TP): The number of instances where the model correctly predicts a positive outcome.
- False Positive (FP): The number of instance where the model incorrectly predicts a positive outcome when it should be negative.
- True Negative (TN): The number of instance where the model correctly predicts a negative outcome.
- False Negative (FN): The number of instance where the model incorrectly predicts a negative outcome when it should be positive.
The statistical metrics are used to calculate the classification metrics namely, accuracy, precision, recall, and F1-score which are described as follows.
Accuracy: Measures how often the model correctly predicts the outcome.
Recall: Measures the actual positive instances which is correctly predicted by the model.
Precision: Measures the positive prediction that are actually correct.
F1-score: Represents the harmonic means of precision and recall, providing a balance between two metrics.
3.4. Evaluation Metrics II
For evaluation of the regression models, we employed the r-squared, mean square error and the mean absolute error. These metrics can be described as follows.
Mean Absolute Error (MAE): The MAE measures the average of absolute differences between predicted and actual values, providing an intuitive of prediction errors.
Mean Square Error (MSE): The MSE measures the average squared difference between predicted and actual, penalizing large errors more than MAE.
Adjusted R-Square: The adjusted R2 values based on the number of predictors, ensuring it accounts model complexity.
4. Results
This section presents our experimental results in two-fold. First is the result of the lexicon based sentiment analysis and seconded by the stock market prediction results.
4.1. Sentiment Analysis Result
To choose the best NLP model for tweets sentiment analysis, 2000 tweets were randomly selected and manually labelled as positive, negative, or neutral. Thess manually labelled sentiments were than compared with the predictions from three models; AFINN, Text-Blob, and VADER. The models were evaluated based on the accuracy, precision, recall and F1 Score. The Table 1. show below.
4.2. Correlation
Figure 5 shows the correlation coefficient of various stocks. The results indicate META and TSLA have the highest correlation coefficient which are moderate. Others are as follows, TSLA (0.44), META (0.44), BA (0.33), PG (0.21), BA (0.33), NIO (0.29), AMD (0.30), AAPL (0.15), and PYPL (0.28). The correlation coefficient shows that, in general, the sentiment indicator provides a moderate to low impact on the price movement. However, it is worth stating that the analysis is based on daily tweets sentiment scores, but aggregating scores on a weekly or monthly basis may yield a stronger correlation. The volume of tweets as shown in Table 2 may also affect the correlation coefficient. We selected only sentiment indicator variable to assess whether the stock price has any impact with public sentiment. I
Table 2 indicates that the sentiment scores do not only depend on the volume of the tweets but also on the strength of the sentiment. For instance, even with a small volume of tweets (399), BA has a moderate correlation coefficient.
Figure 6 compares the risk and expected return of different stocks without taking sentimental into account. In this scenario, TSLA offers high returns but carries high risk, indicating significant volatility. On the other hand, stocks like PG and AAPL show lower risk and lower expected returns.
Figure 7 examines the effect of sentiment on risk and expected return. The correlation analysis reveals that TSLA and META have moderate correlations with sentiment scores, while AMD, BA, NIO, PG, and PYPL show weaker correlations. Figure 7 indicates that TSLA, AMD, NIO returns increases when sentimental is considered and change in risk is observed across other stocks as well. PG shows an increase in risk, which highlights the impact of sentiment on stock prediction. So, we need to consider TSLA, AMD, META, NIO, PG stocks which exhibits positive relation with sentiment. In our analysis using ML models to better understand the impact of sentimental scores.
4.4. Model Performance
This section presents the results of our experiment on stock prediction using various machine learning models, both without and with the incorporation of sentimental analysis. We evaluate the performance of the models using metrics such as Adjusted- R2, MAE, MSE, and Accuracy. Table 3 and Table 4 summarizes the evaluation results.
The initial analysis focused on predicting stock price using historical stock dataset without incorporating sentiment indicator. Across all the stocks, the traditional ARIMA model underperformed compared to neural network models. For example, TSLA achieved an Adjusted-R2 of -2.5265 and a MAE of 40.45, indicating poor predictive capability. Neural networks models have superior performance. For LSTM with hyperparameter tuning improved the Adjusted-R2 to 0.2829 and reduced the MAE to 7.826. The GRU model with hyperparameter tuning further enhanced the results, with Adjusted-R2 0.39294 and a MAE of 7.122. The best performance was observed with GAN(LSTM+CNN) which achieved an adjusted-R2 of 0.53 and MAE of 6.72, indicating a strong fit and accurate prediction. Similarly, the trends were observed for NIO, AMD, and META. The GAN models and GRU with hyperparameter tuning consistently performing with higher Adjusted- R2 and lower MAE and MSE.
In the seconded experiment, we incorporated the sentiment scores as continous values rather than categoical as such, this forms a new merged dataset which is the finial Merged dataset used for fitting the models. For all the stocks, GRU model with hyper parameter tuning showed an improvement. For example, TSLA with Adjusted-R2 increases from 0.39294 to 0.40526, and MAE decreased from 7.122 to 6.939. The accuracy also improved from 97.53% to 97.60%. We examined the improvement across the models in general and we observed there is a slight positive impact on several model predictive performance, especially the TSLA. However, the GAN models perform very poor. The Adjusted -R2 dropped to negative values, and the MAE and MSE increased significantly, suggesting that GAN models may not effectively predict the trends with sentiment features.
For NIO, the inclusion of sentiment analysis led to notable improvements. The GRU model with hyperparameter tuning showed Adusted-R2 of 0.50236 (up from 0.3959 without sentiment) and MAE decreased from 0.853 to 0.739. The accuracy improved to 96.14% highlights the beneficial effect of sentiment analysis on predicting NIO stock price.
For AMD, the GRU hyperparameter tuning showed enhanced performance with sentiment analysis. The Adjusted-R2 increases from 0.89676 to 0.91619 and the MAE reduced from 3.146 to 2.705. The accuracy improved.
For META, the GRU hyperparameter tuning also perform good with sentimental analysis. The Adjusted-R2 improved from 0.80416 to 0.81954 and MAE decreased from 4.546 to 4.307. The accuracy increased to 97.30% suggests that incorporating sentimental score enhances the model ability to predict stock price.
The results showed by incorporating sentiment analysis can enhance the predictive performance of certain models for stock prediction. The GRUVader model consistently outperform other models across multiple stocks. The improvement in Adjusted-R2 and reduced MSE and MAE indicates the sentiment analysis provides additional valuable information, enabling the models to capture market dynamics more effectively. This is particularly evident for stocks like TSLA, META, NIO and AMD where public sentiment appears to have strong correlation with stock price movement. In addition, we have compared our result to existing results in the literature and we observed (as shown in Table 5) that GRUvader yields improved results.
Furthermore, we produced residual plots to show the residuals (errors) of the models predictions compared to the actual values. The plots shown in figure 8 are residual plots generated for each stock (TSLA, META, NIO, and AMD) after applying the hyperparameter tuning with sentiment analysis to investigate the model performances. From Figure 8 we assess the performance of our GRUVader using the indicators below.
- QQ (Quantile-Quantile plots): the residuals should follow normal distribution, and thus the residuals should align closely with the reference line in QQ plot.
- Histograms: To visualize the distribution of residuals, a bell shaped histogram suggests the residuals are normally distributed.
- Observation plot: To check the randomness in the residuals, residuals should scatter randomly without following any patterns. The randomness indicates that model has effectively capture the trends.
5. Conclusion
This paper aims to develop stock price prediction model with improved performance. In addition, we examine the influence of exogenous features in the form of public sentiment. By doing so, several ML algorithms, including ARIMAX, LSTM, GRU, Bi-LSTM, Bi-GRU, and GAN, were used to predict stock price using both historic stock data and sentiment score derived from tweets. Our results justify that incorporating sentiment analysis significantly improves the performance of stock model prediction, particularly with GRUvader. Across various stocks, including TSLA, NIO, META, AMD and PG, sentiment enhanced models yielded better accuracy and lower error rate compared to the model without sentiment scores.
To conclude, this study highlights the importance of exogenous features, such as tweets, in financial prediction and shows that sentiment indicators can play a crucial role in predicting stock price movement. Theoretically, this research provides evidence that sentiment analysis can enhance traditional stock prediction model. Further work should consider integrating stock specific language models and deep learning algorithms to examine the ability of the hybrid approach to handle long-term dependencies and complex patterns. Additionally, incorporating other forms of text data, such as news articles or financial reports, could further improve prediction accuracy. The study also emphasizes the need to extend this methodology to other sectors and explore its potential for identifying market trends during volatile condition.
Author Contributions
Conceptualization, A.M. and B.O.; methodology, A.M., B.O., S.T.I., and O.S.; software, A.M.; validation, A.M. and B.O.; formal analysis, A.M.; investigation, A.M. and B.O.; resources, A.M. and B.O.; data curation, A.M.; writing—original draft preparation, A.M. and B.O.; writing—review and editing, A.M., B.O., S.T.I., and O.S.; supervision, B.O.; project administration, B.O., S.T.I., and O.S.; All authors have read and agreed to the published version of the manuscript.
Funding
This research received no external funding.
Institutional Review Board Statement
Not applicable.
Conflicts of Interest
The authors declare no conflicts of interest.
References
- Oyewola, D.O.; Akinwunmi, S.A.; Omotehinwa, T.O. Deep LSTM and LSTM-Attention Q-learning based reinforcement learning in oil and gas sector prediction. Knowledge-Based Syst. 2023, 284. [CrossRef]
- Masoud, N. M. The impact of stock market performance upon economic growth. International Journal of Economics and Financial Issues, 2013, 3(4), 788-798.
- Ziegel, E.R.; Brockwell, P.; Davis, R. Time Series: Theory and Methods. Technometrics 1992, 34, 371. [CrossRef]
- Khan, S., & Alghulaiakh, H. ARIMA model for accurate time series stocks forecasting. International Journal of Advanced Computer Science and Applications, 2020, 11(7).
- Fama, E.F. The Behavior of Stock-Market Prices. J. Bus. 1965, 38, 34. [CrossRef]
- Pang, X.; Zhou, Y.; Wang, P.; Lin, W.; Chang, V. An innovative neural network approach for stock market prediction. J. Supercomput. 2018, 76, 2098–2118. [CrossRef]
- Bing, Y.; Hao, J.K.; Zhang, S.C. Stock Market Prediction Using Artificial Neural Networks. Adv. Eng. Forum 2012, 6-7, 1055–1060. [CrossRef]
- Li, J., Bu, H. and Wu, J., Sentiment-aware stock market prediction: A deep learning method. In 2017 international conference on service systems and service management 2017, pp. 1-6. IEEE. [CrossRef]
- Mujhid, A., Charisma, R.A. and Girsang, A.S. Comparative Algorithms for Stock Price Prediction Based on Market Sentiment Analysis. In 2023 6th International Seminar on Research of Information Technology and Intelligent Systems (ISRITI), 2023, pp. 530-535. IEEE. [CrossRef]
- Al-Amri, R.M., Hadi, A.A., Mousa, A.H., Hasan, H.F. and Kadhim, M.S. The development of a deep learning model for predicting stock prices. Journal of Advanced Research in Applied Sciences and Engineering Technology, 2023, 31(3), pp.208-219. [CrossRef]
- Yukhymenko, H. and Lazarenko, I., Forecasting the stock prices using generative adversarial networks and sentiment analysis of social networks. Modeling the development of the economic systems, 2022, p.10.
- Gong, J., & Sun, S. A new approach of stock price prediction based on logistic regression model. In 2009 International Conference on New Trends in Information and Service Science, 2009, pp. 1366-1371. IEEE. [CrossRef]
- Sharma, S.; Kaushik, B. Quantitative Analysis of Stock Market Prediction for Accurate Investment Decisions in Future. J. Artif. Intell. 2017, 11, 48–54. [CrossRef]
- Solares, E.; De-León-Gómez, V.; Salas, F.G.; Díaz, R. A comprehensive decision support system for stock investment decisions. Expert Syst. Appl. 2022, 210. [CrossRef]
- Maji, G.; Mondal, D.; Dey, N.; Debnath, N.C.; Sen, S. Stock prediction and mutual fund portfolio management using curve fitting techniques. J. Ambient. Intell. Humaniz. Comput. 2021, 12, 9521–9534. [CrossRef]
- Thethi, J.K., Pandit, A., Patel, H. and Shirsath, V., Stock market prediction and portfolio management using ml techniques. Int. J. Eng. Res. Technol, 2021, 9(10.17577).
- Wu, C.; Luo, P.; Li, Y.; Chen, K. Stock Price Forecasting: Hybrid Model of Artificial Intelligent Methods. Eng. Econ. 2015, 26, 40-48. [CrossRef]
- Mittal, S. and Nagpal, C.K. Predicting a reliable stock for mid and long term investment. Journal of King Saud University-Computer and Information Sciences, 2022, 34(10), pp.8440-8448. [CrossRef]
- Emioma, C.C.; Edeki, S.O. Stock price prediction using machine learning on least-squares linear regression basis. J. Physics: Conf. Ser. 2021, 1734, 012058. [CrossRef]
- Lauren, S., & Harlili, S. D. Stock trend prediction using simple moving average supported by news classification. In 2014 International Conference of Advanced Informatics: Concept, Theory and Application (ICAICTA) 2014, pp. 135-139). IEEE. [CrossRef]
- Funde, Y.; Damani, A. Comparison of ARIMA and Exponential Smoothing Models in Prediction of Stock Prices. J. Predict. Mark. 2023, 17, 21–38. [CrossRef]
- Aue, A.; Horváth, L.; Pellatt, D.F. Functional Generalized Autoregressive Conditional Heteroskedasticity. J. Time Ser. Anal. 2016, 38, 3–21. [CrossRef]
- Jeribi, A.; Ghorbel, A. Forecasting developed and BRICS stock markets with cryptocurrencies and gold: generalized orthogonal generalized autoregressive conditional heteroskedasticity and generalized autoregressive score analysis. Int. J. Emerg. Mark. 2021, 17, 2290–2320. [CrossRef]
- Ariyo, A. A., Adewumi, A. O., & Ayo, C. K. Stock price prediction using the ARIMA model. In 2014 UKSim-AMSS 16th international conference on computer modelling and simulation. 2014, pp. 106-112. IEEE. [CrossRef]
- Khashei, M.; Bijari, M. An artificial neural network (p,d,q) model for timeseries forecasting. Expert Syst. Appl. 2010, 37, 479–489. [CrossRef]
- Tanuwijaya, J.; Hansun, S. LQ45 Stock Index Prediction using k-Nearest Neighbors Regression. Int. J. Recent Technol. Eng. 2019, 8, 2388–2391. [CrossRef]
- Henrique, B.M.; Sobreiro, V.A.; Kimura, H. Stock price prediction using support vector regression on daily and up to the minute prices. J. Finance Data Sci. 2018, 4, 183–201. [CrossRef]
- Hindrayani, K. M., Fahrudin, T. M., Aji, R. P., & Safitri, E. M. Indonesian stock price prediction including covid19 era using decision tree regression. In 2020 3rd International Seminar on Research of Information Technology and Intelligent Systems (ISRITI) 2020, pp. 344-347. IEEE. [CrossRef]
- Polamuri, S.R.; Srinivasi, K.; Mohan, A.K. Stock Market Prices Prediction using Random Forest and Extra Tree Regression. Int. J. Recent Technol. Eng. 2019, 8, 1224–1228. [CrossRef]
- Almaafi, A.; Bajaba, S.; Alnori, F. Stock price prediction using ARIMA versus XGBoost models: the case of the largest telecommunication company in the Middle East. Int. J. Inf. Technol. 2023, 15, 1813–1818. [CrossRef]
- Zhu, Y. Stock price prediction using the RNN model. In Journal of Physics: Conference Series 2020, Vol. 1650, No. 3, p. 032103. IOP Publishing. [CrossRef]
- Ghosh, A., Bose, S., Maji, G., Debnath, N., & Sen, S. Stock price prediction using LSTM on Indian share market. In Proceedings of 32nd international conference on 2019, Vol. 63, pp. 101-110.
- Wang, S. A Stock Price Prediction Method Based on BiLSTM and Improved Transformer. IEEE Access 2023, 11, 104211–104223. [CrossRef]
- Qi, C.; Ren, J.; Su, J. GRU Neural Network Based on CEEMDAN–Wavelet for Stock Price Prediction. Appl. Sci. 2023, 13, 7104. [CrossRef]
- Duan, Y.; Liu, Y.; Wang, Y.; Ren, S.; Wang, Y. Improved BIGRU Model and Its Application in Stock Price Forecasting. Electronics 2023, 12, 2718. [CrossRef]
- Diqi, M.; Hiswati, M.E.; Nur, A.S. StockGAN: robust stock price prediction using GAN algorithm. Int. J. Inf. Technol. 2022, 14, 2309–2315. [CrossRef]
- Suhartono, Saputri, P.D., Amalia, F.F., Prastyo, D.D., Ulama, B.S.S. Model Selection in Feedforward Neural Networks for Forecasting Inflow and Outflow in Indonesia. In: Mohamed, A., Berry, M., Yap, B. (eds) Soft Computing in Data Science. SCDS 2017. Communications in Computer and Information Science, 2017, vol 788. Springer, Singapore. [CrossRef]
- Hochreiter, S., Long Short-term Memory. Neural Computation MIT-Press. 1997.
- Xu, Y. and Keselj, V. Stock prediction using deep learning and sentiment analysis. In 2019 IEEE international conference on big data (big data) 2019, pp. 5573-5580. IEEE. [CrossRef]
- Jiawei, X. and Murata, T., Stock market trend prediction with sentiment analysis based on LSTM neural network. In International multiconference of engineers and computer scientists 2019, pp. 475-9.
- Eapen, J.; Bein, D.; Verma, A. Novel Deep Learning Model with CNN and Bi-Directional LSTM for Improved Stock Market Index Prediction. In Proceedings of the 2019 IEEE 9th Annual Computing and Communication Workshop and Conference (CCWC), Las Vegas, NV, USA, 7–9 January 2019; Institute of Electrical and Electronics Engineers (IEEE): New York, NY, USA, 2019; pp. 0264–0270. [CrossRef]
- Zhou, X.; Pan, Z.; Hu, G.; Tang, S.; Zhao, C. Stock Market Prediction on High-Frequency Data Using Generative Adversarial Nets. Math. Probl. Eng. 2018, 2018, 1–11. [CrossRef]
- Zhang, K.; Zhong, G.; Dong, J.; Wang, S.; Wang, Y. Stock Market Prediction Based on Generative Adversarial Network. Procedia Comput. Sci. 2019, 147, 400–406. [CrossRef]
- M. A. Hossain, R. Karim, R. Thulasiram, N. D. B. Bruce and Y. Wang, "Hybrid Deep Learning Model for Stock Price Prediction," 2018 IEEE Symposium Series on Computational Intelligence (SSCI), Bangalore, India, 2018, pp. 1837-1844. [CrossRef]
- Shahi, T.B.; Shrestha, A.; Neupane, A.; Guo, W. Stock Price Forecasting with Deep Learning: A Comparative Study. Mathematics 2020, 8, 1441. [CrossRef]
- Gao, Y.; Wang, R.; Zhou, E. Stock Prediction Based on Optimized LSTM and GRU Models. Sci. Program. 2021, 2021, 1–8. [CrossRef]
- Mohan, S., Mullapudi, S., Sammeta, S., Vijayvergia, P. and Anastasiu, D.C., Stock price prediction using news sentiment analysis. In 2019 IEEE fifth international conference on big data computing service and applications (BigDataService), 2019, pp. 205-208. IEEE. [CrossRef]
- Xu, Y. and Keselj, V., Stock prediction using deep learning and sentiment analysis. In 2019 IEEE international conference on big data (big data) 2019, pp. 5573-5580. IEEE.
- Ogunleye, B. O. Statistical learning approaches to sentiment analysis in the Nigerian banking context. Sheffield Hallam University (United Kingdom) 2021.
- Ogunleye, B., Brunsdon, T., Maswera, T., Hirsch, L., & Gaudoin, J. Using Opinionated-Objective Terms to Improve Lexicon-Based Sentiment Analysis. In International conference on soft computing for problem-solving 2023, pp. 1-23. Singapore: Springer Nature Singapore. [CrossRef]
- Ogunleye, B.; Sharma, H.; Shobayo, O. Sentiment Informed Sentence BERT-Ensemble Algorithm for Depression Detection. Big Data Cogn. Comput. 2024, 8, 112. [CrossRef]
- Li, J., Bu, H. and Wu, J. Sentiment-aware stock market prediction: A deep learning method. In 2017 international conference on service systems and service management. 2017, pp. 1-6. IEEE.
- Porshnev, A., Redkin, I. and Shevchenko, A., 2013, December. Machine learning in prediction of stock market indicators based on historical data and data from twitter sentiment analysis. In 2013 IEEE 13th international conference on data mining workshops. 2013, pp. 440-444. IEEE. [CrossRef]
- Li, X.; Xie, H.; Chen, L.; Wang, J.; Deng, X. News impact on stock price return via sentiment analysis. Knowledge-Based Syst. 2014, 69, 14–23. [CrossRef]
- Sohangir, S.; Wang, D.; Pomeranets, A.; Khoshgoftaar, T.M. Big Data: Deep Learning for financial sentiment analysis. J. Big Data 2018, 5, 3. [CrossRef]
- Liashenko, O., Kravets, T. and Plushchov, V., Stock Price Forecasting using Sentiment Analysis of Stock Tweets. In 2024 14th International Conference on Advanced Computer Information Technologies (ACIT) 2024, pp. 351-354. IEEE. [CrossRef]
Figure 1.
Stock dataset.
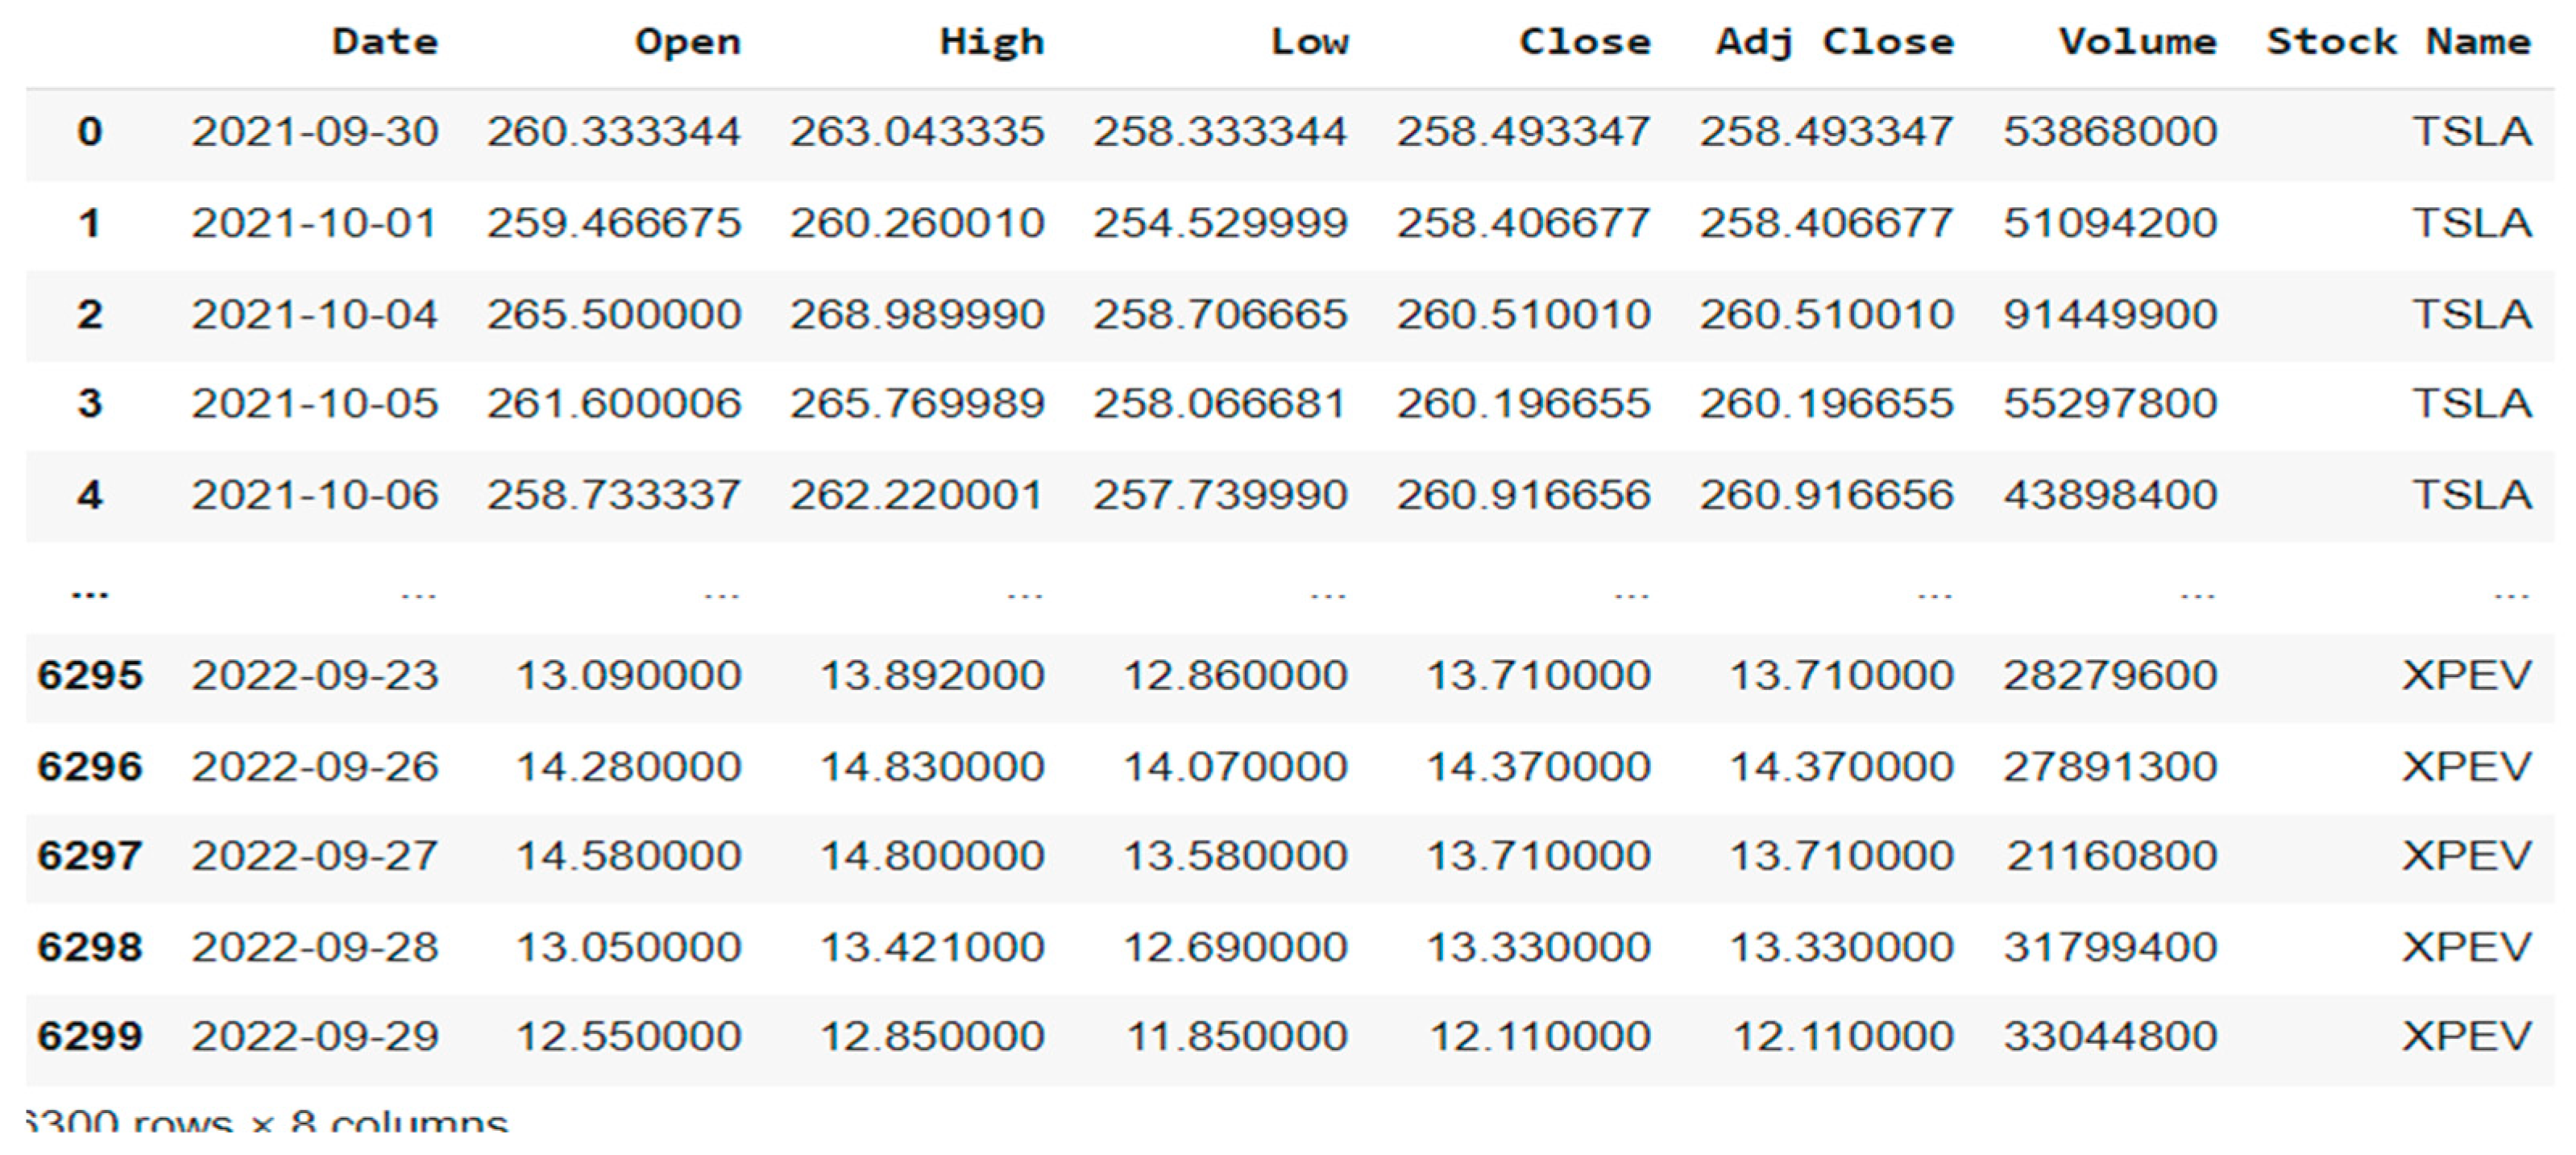
Figure 2.
Text dataset.
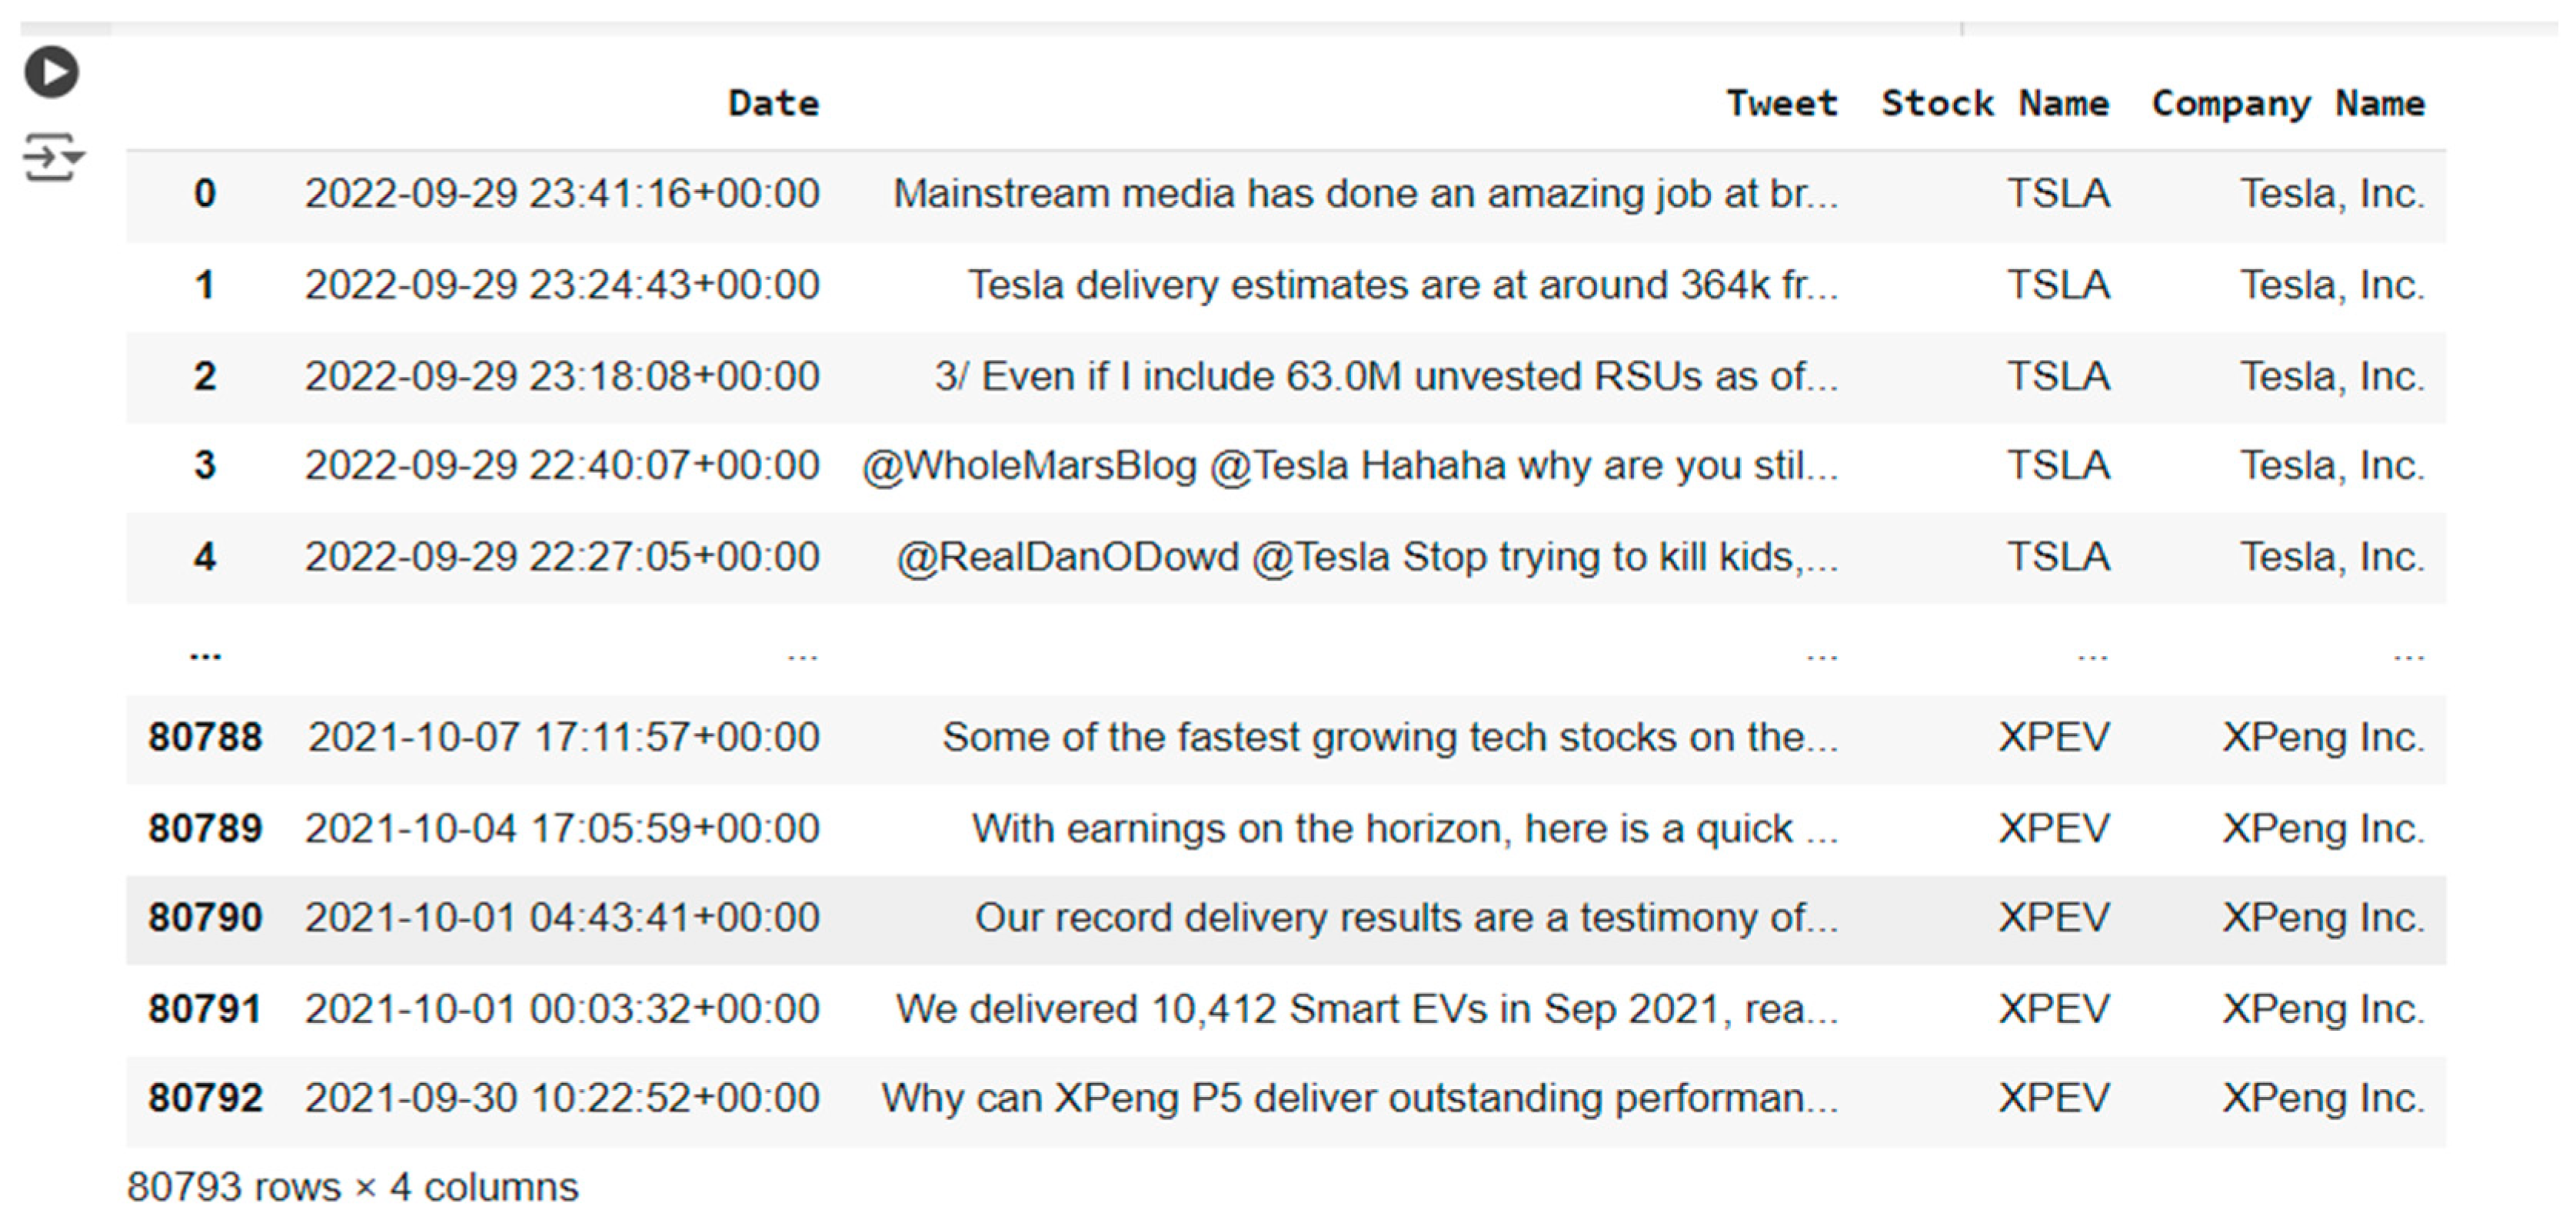
Figure 3.
An illustration of our experiment.
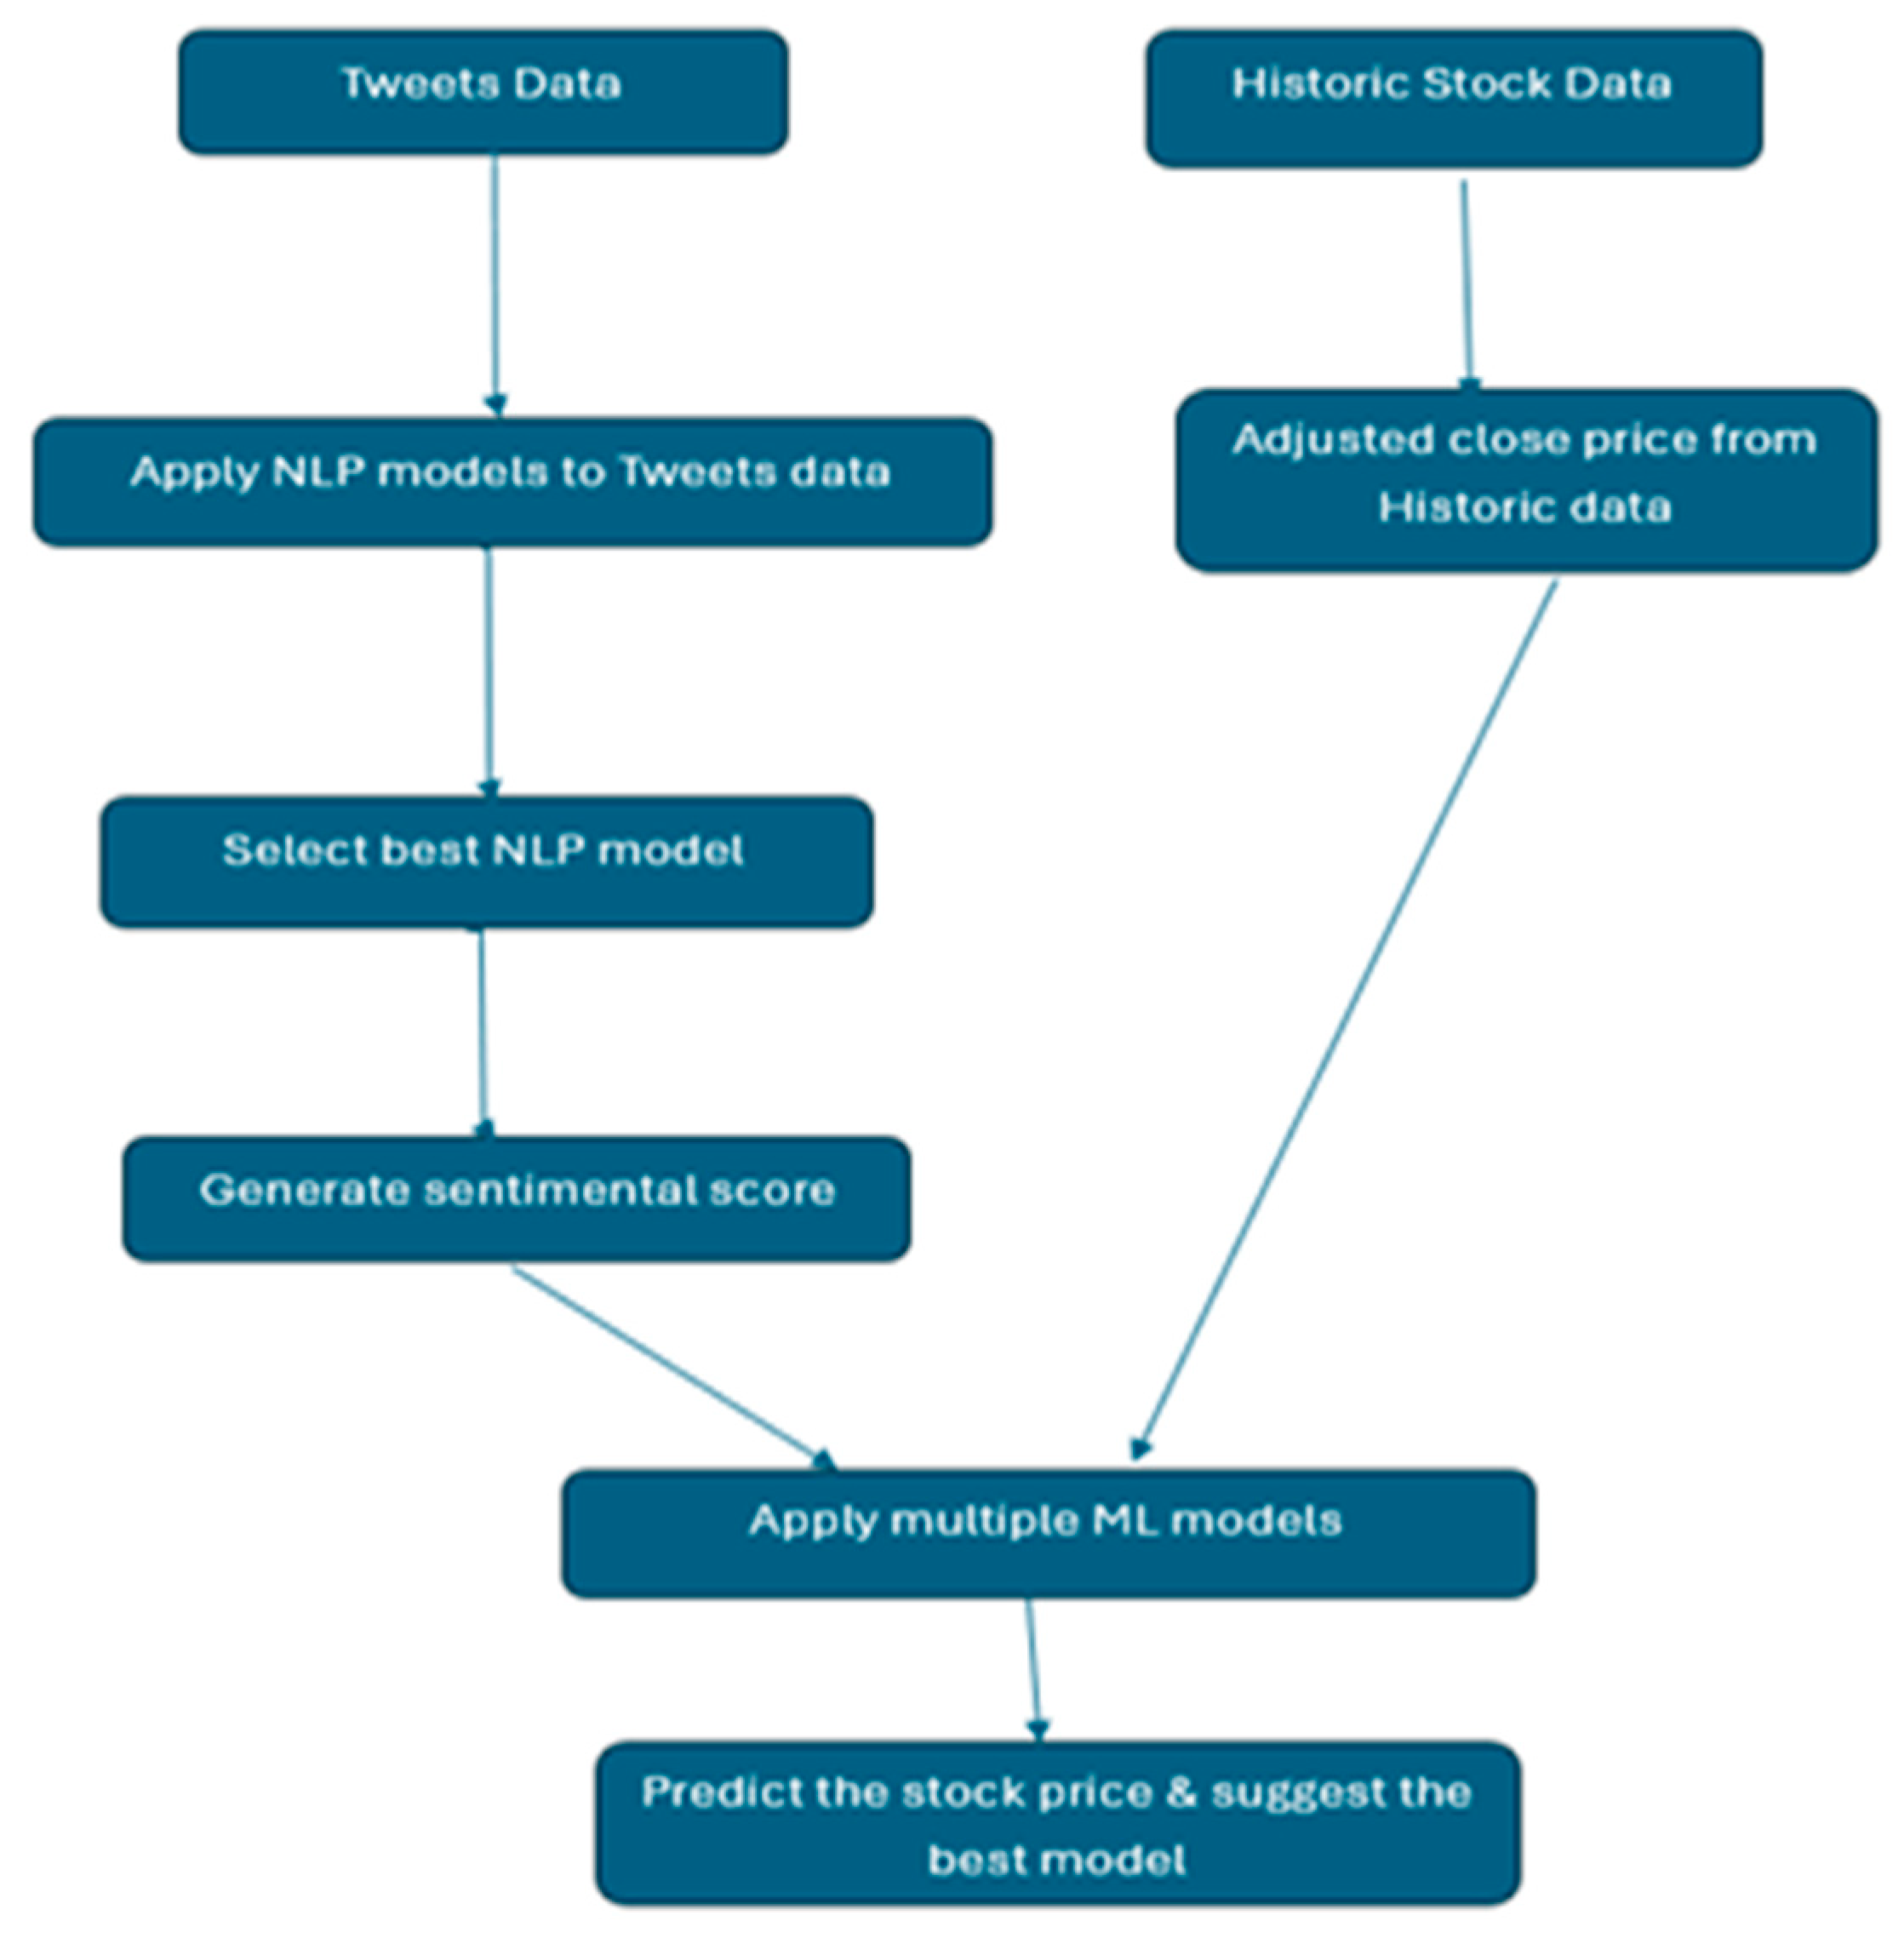
Figure 5.
correlation coefficient of stocks.
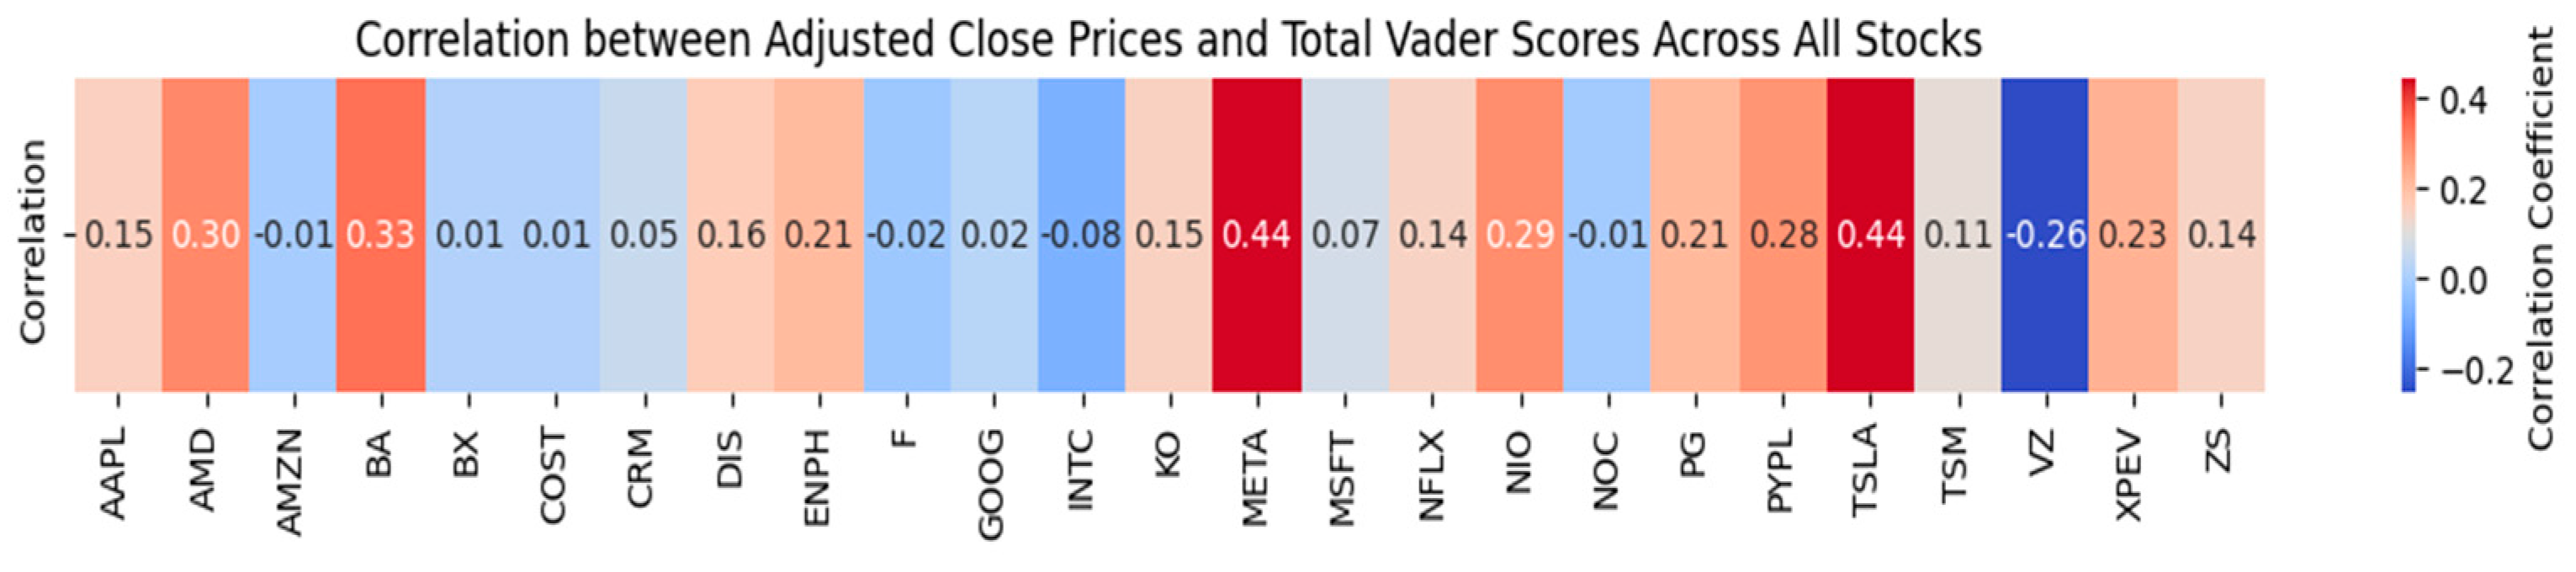
Figure 6.
Risk vs Expected Return without Sentiment indicator.
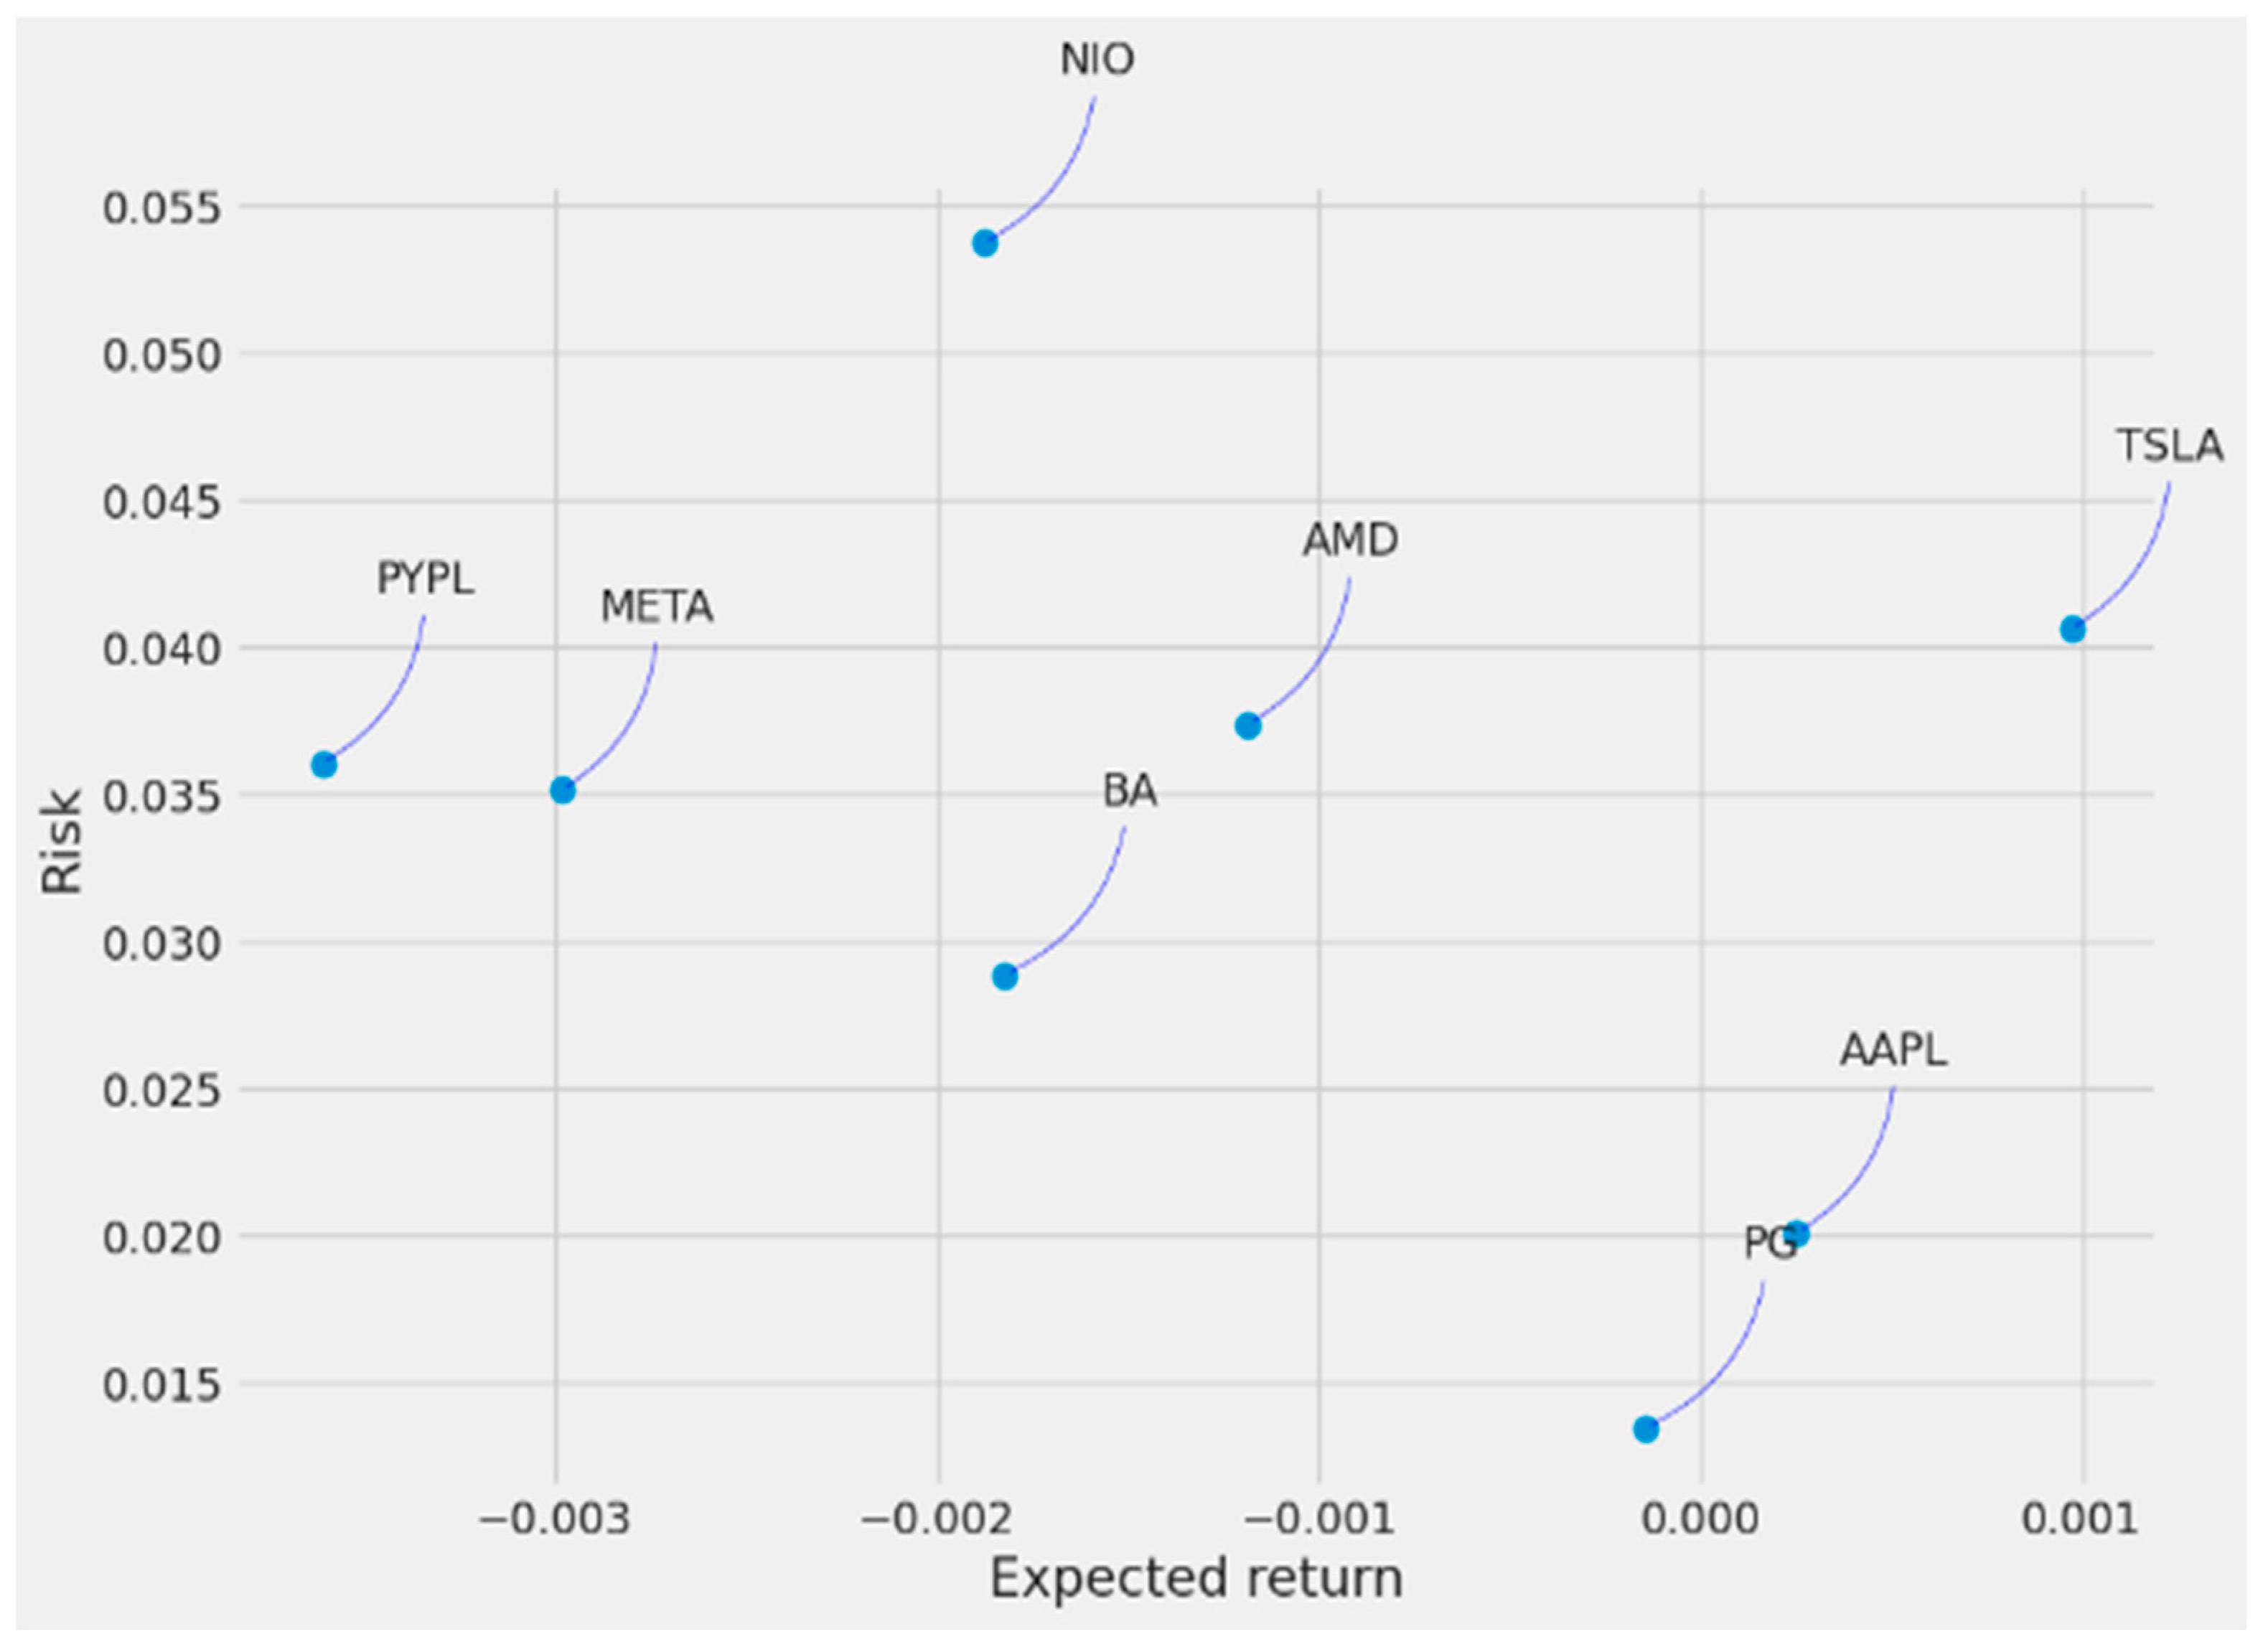
Figure 7.
Risk vs Expected Return with Sentiment indicator.
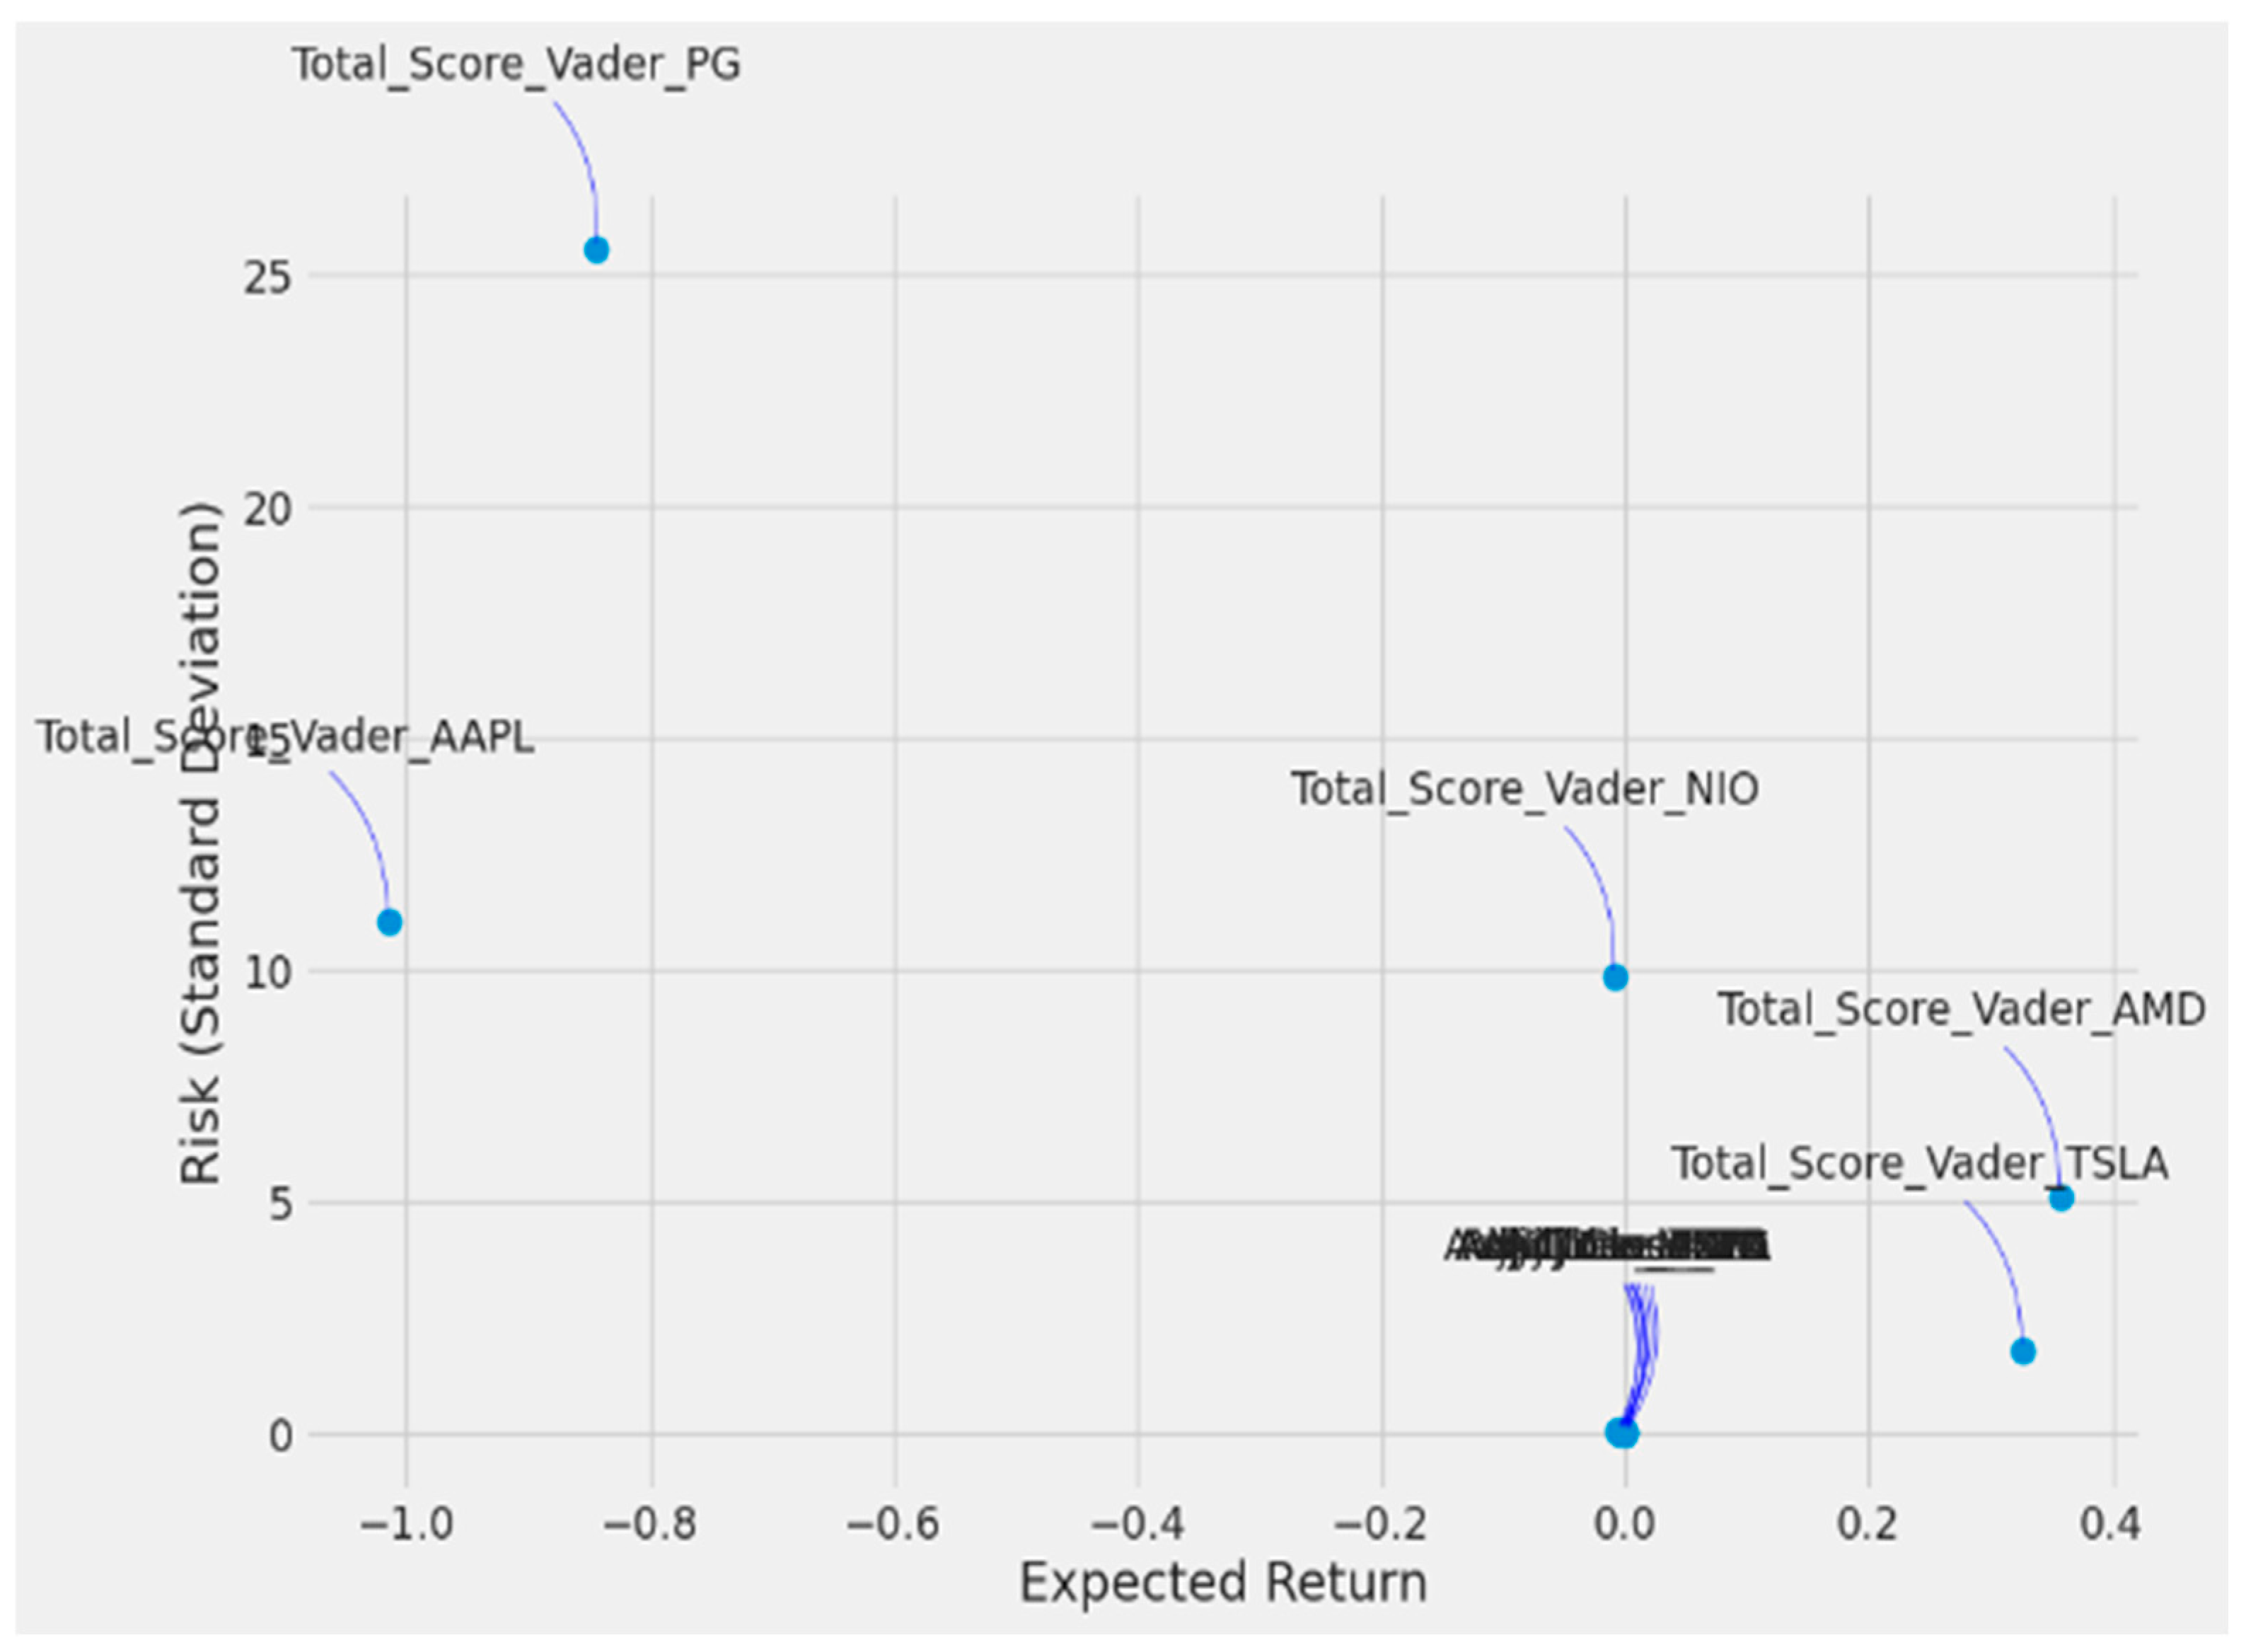
Figure 8.
Residual plots for stocks.
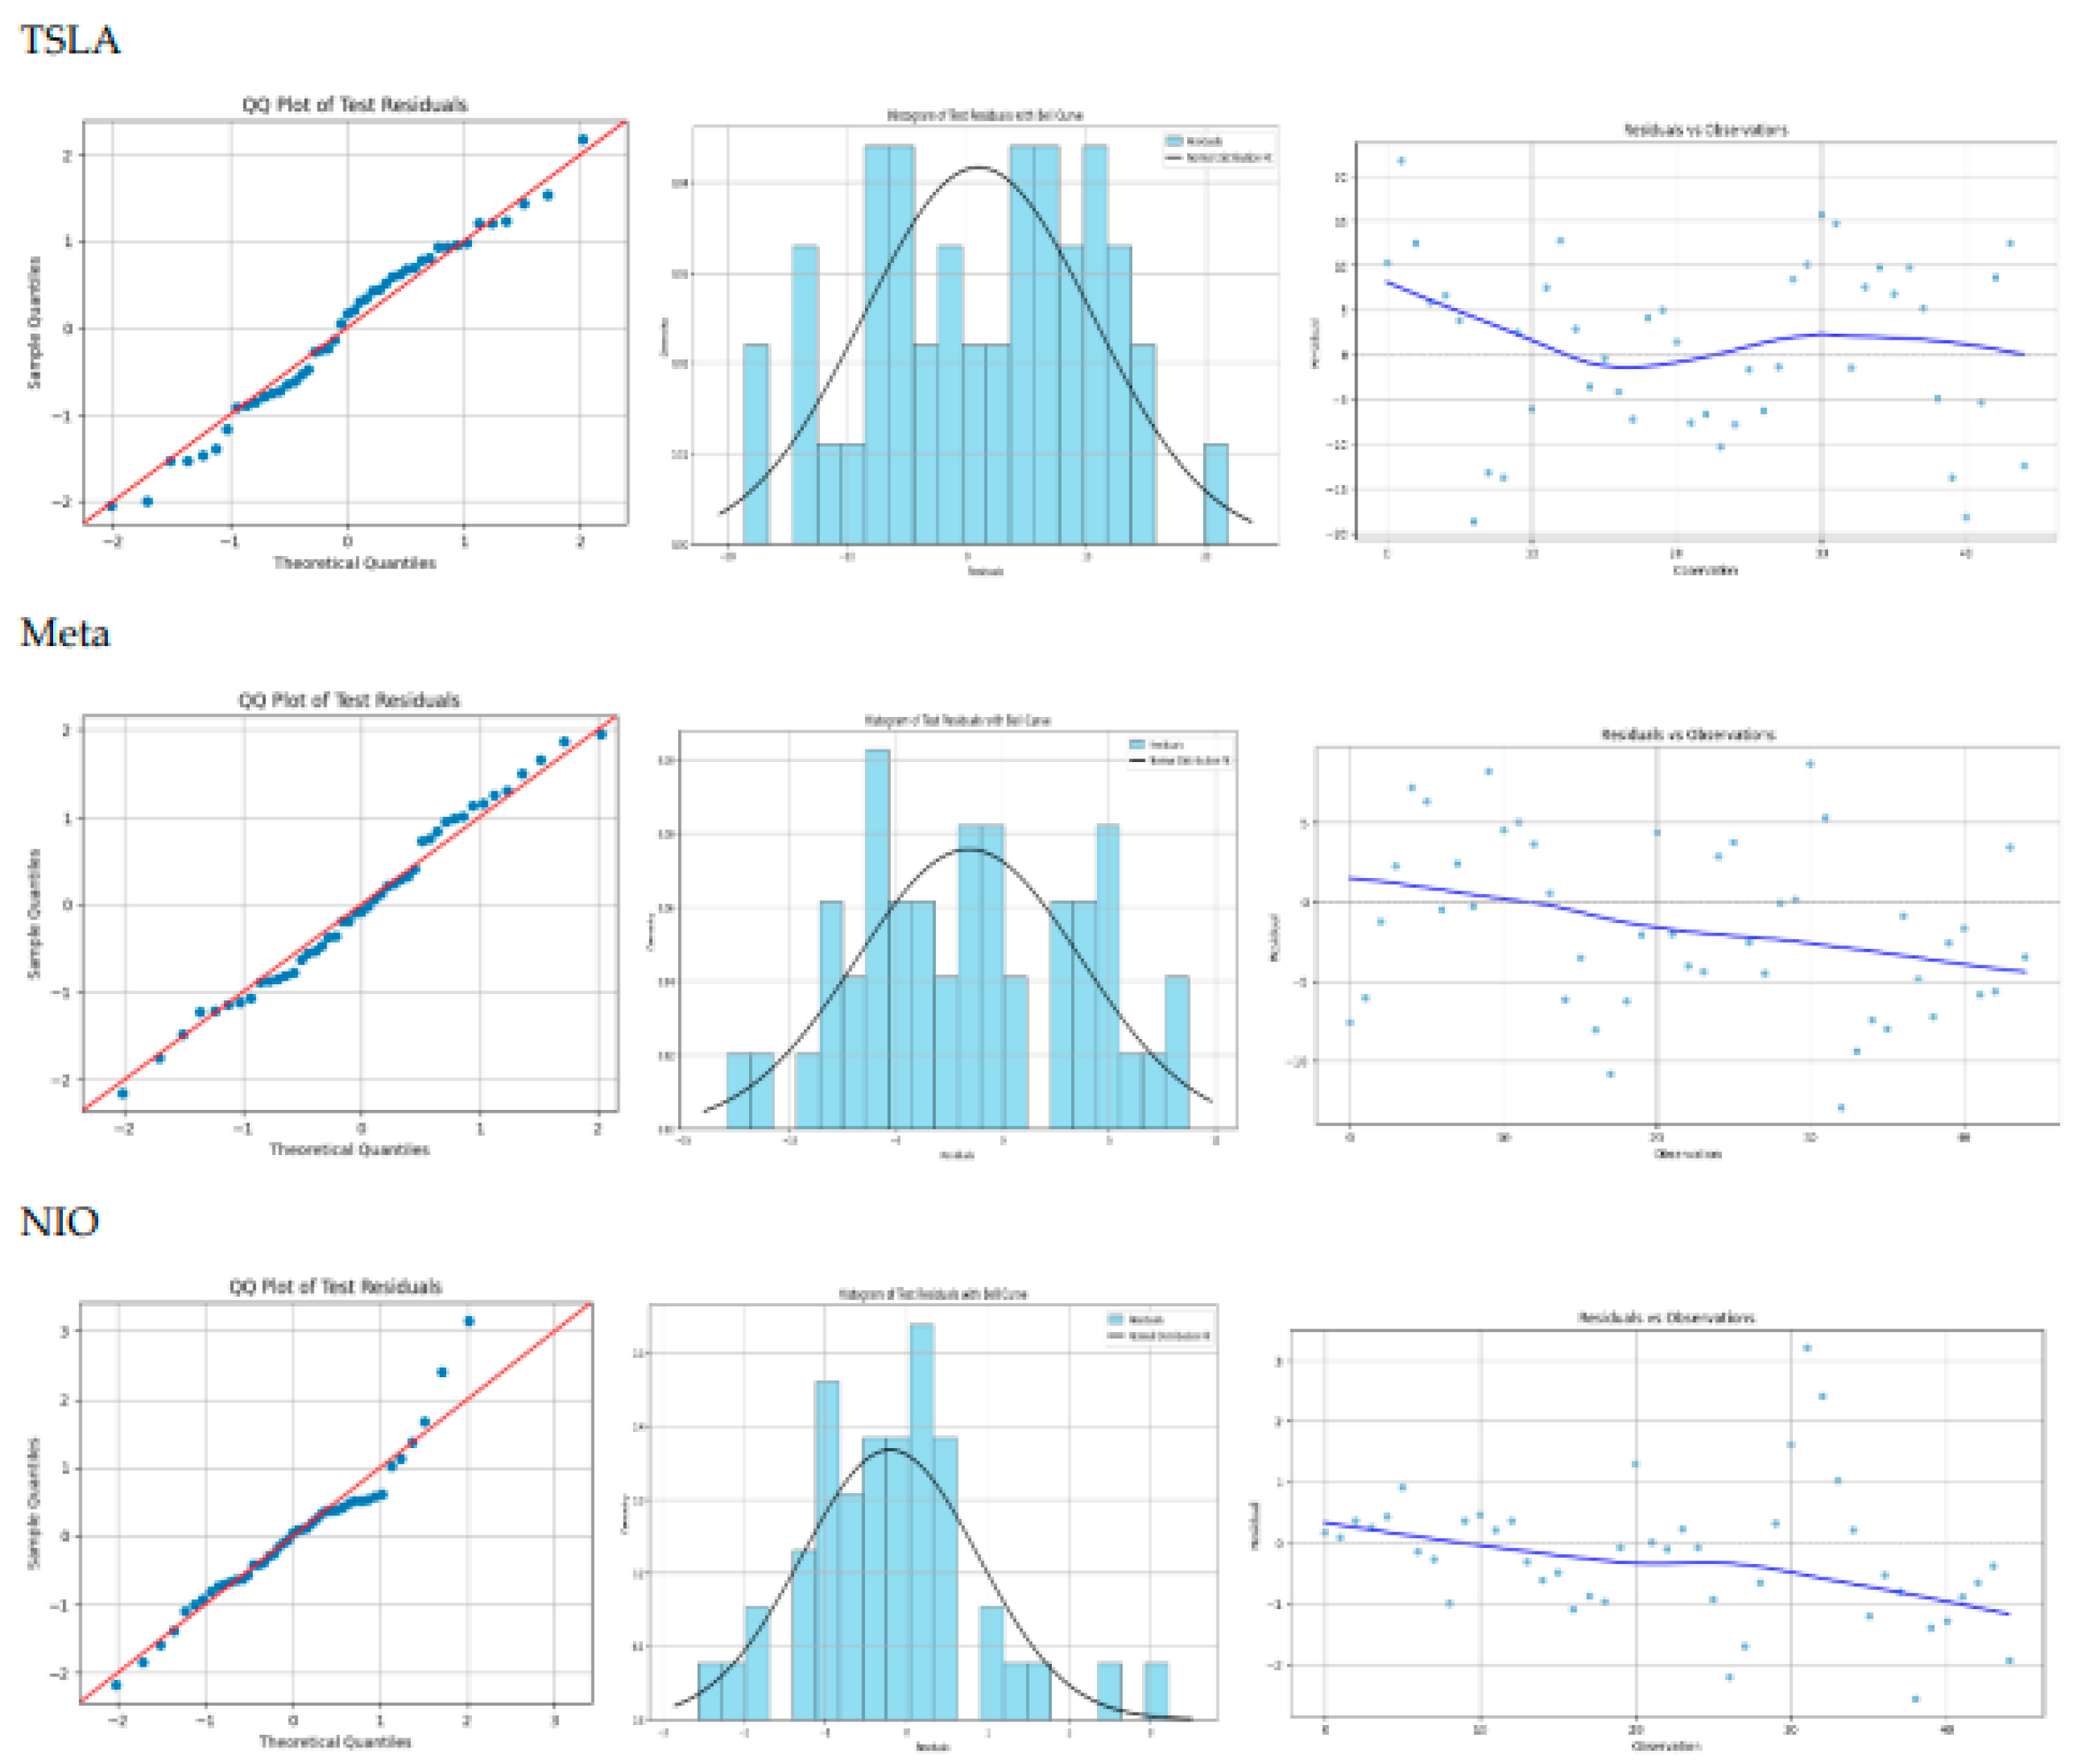
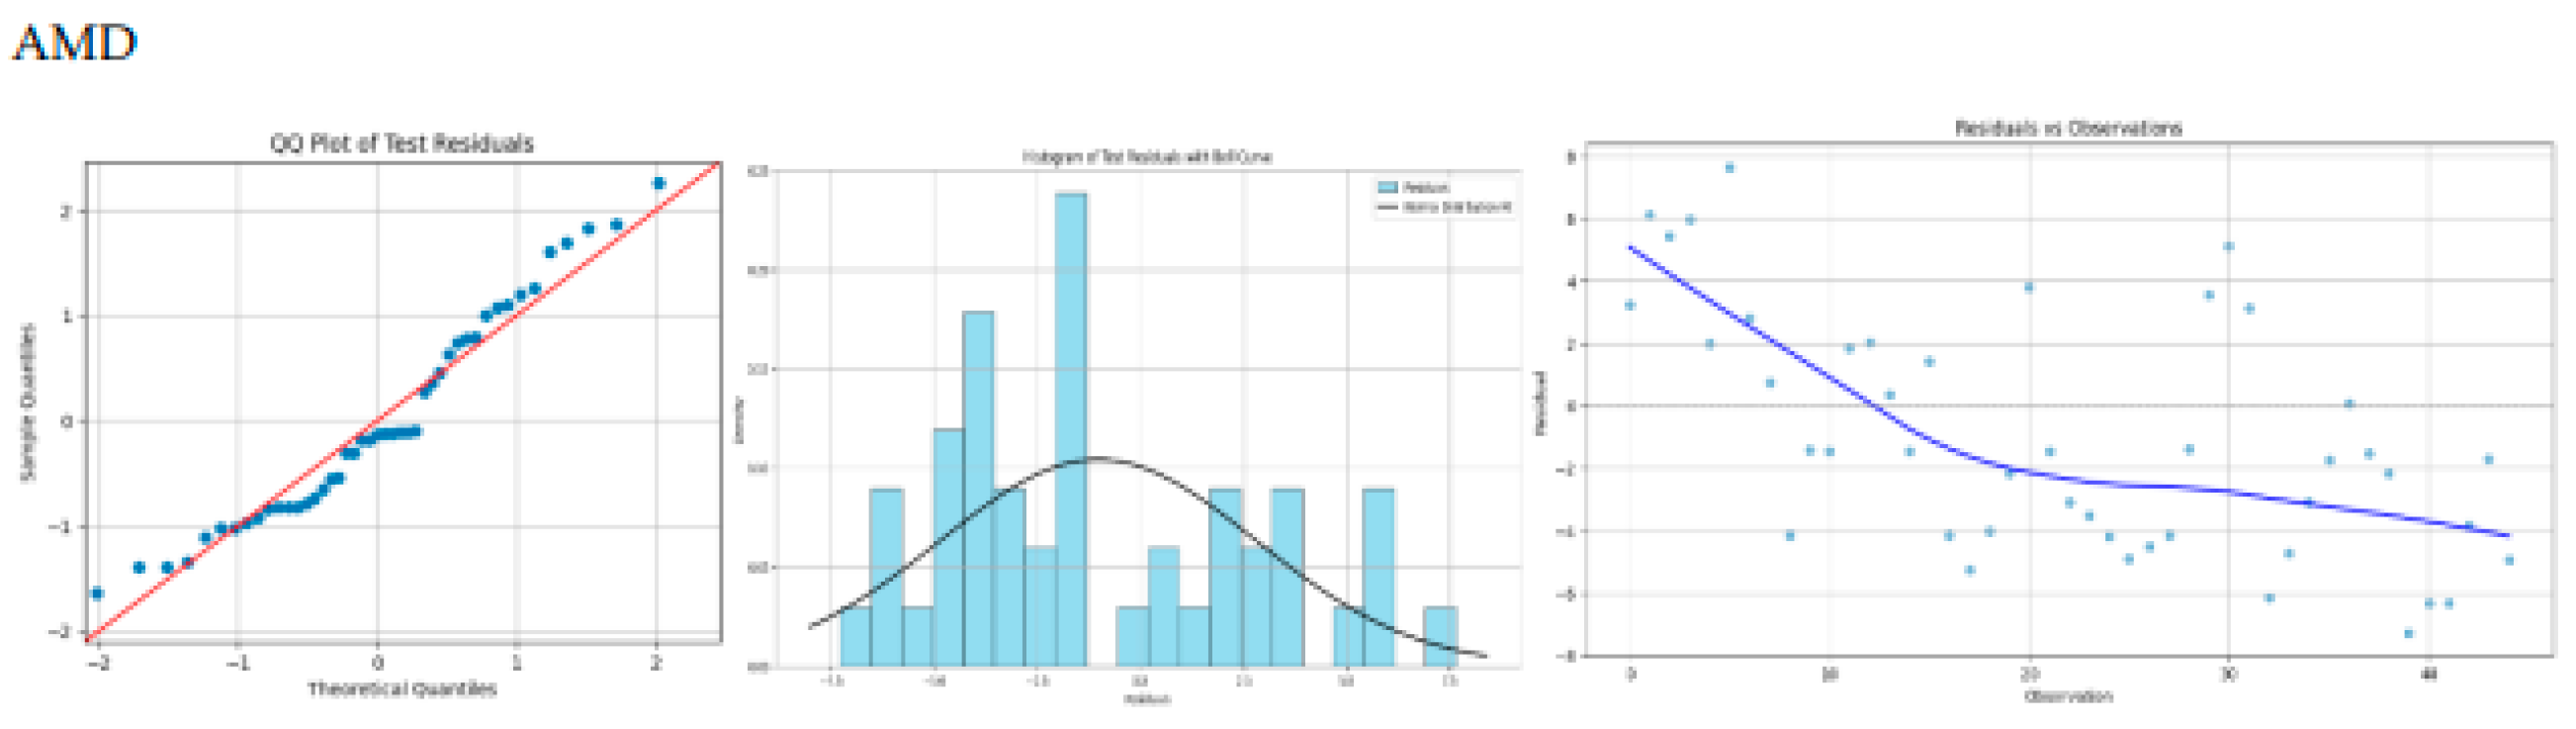

Table 1.
Evaluation results I.
| Lexicon | Accuracy | Precision | Recall | F1-score |
|---|---|---|---|---|
| AFINN | 49.1 | 59.8 | 49.1 | 52.3 |
| Text-Blob | 46.9 | 57.1 | 46.9 | 49.7 |
| VADER | 54.1 | 61.0 | 54.1 | 56.4 |
Table 2.
Tweets and correlation coefficient.
| Stock Name | Volume of Tweets | Correlation Coefficient |
|---|---|---|
| TSLA | 37422 | 0.44 |
| AAPL | 5056 | 0.15 |
| BA | 399 | 0.33 |
| META | 2751 | 0.44 |
| NIO | 3021 | 0.29 |
| PG | 4089 | 0.21 |
| AMD | 2227 | 0.30 |
Table 3.
Evaluation results II.
| Stock-Name | Model | Adjusted-R2 | MAE | MSE | Accuracy |
|---|---|---|---|---|---|
| TSLA(Tesla) | ARIMA | -2.5265 | 40.45 | 1798.23 | 86.22% |
| LSTM (1_Layer) | -0.0985 | 10.06 | 140.37 | 96.54% | |
| LSTM (2_Layer) | -0.1821 | 10.53 | 151.06 | 96.39% | |
| Bi-LSTM (1_Layer) | 0.01488 | 9.549 | 125.88 | 96.72% | |
| LSTM (Hyper-parameter Tuning) | 0.28429 | 7.826 | 91.457 | 97.29% | |
| GRU (1_Layer) | 0.10162 | 4.022 | 114.8 | 96.87% | |
| GRU (2_Layer) | -0.10 | 0.10 | 140.69 | 96.54% | |
| Bi-GRU (1_Layer) | -0.0291 | 9.65 | 131.51 | 96.66% | |
| GRU (Hyper parameter Tuning) | 0.39294 | 7.122 | 77.573 | 97.53% | |
| GAN (LSTM+CNN) | 0.53 | 6.72 | 78.98 | 97.65% | |
| GAN (GRU+CNN) | 0.46 | 7.24 | 89.2 | 97.47% | |
| NIO | ARIMA | -0.8549 | 1.401 | 3.5025 | 93.03% |
| LSTM (1_Layer) | -1.01012 | 1.697 | 4.1326 | 90.85% | |
| LSTM (2_Layer) | -0.1187 | 1.124 | 2.291 | 93.55% | |
| Bi-LSTM (1_Layer) | 0.1482 | 1.066 | 1.7512 | 94.50% | |
| LSTM(Hyper-parameter-Tuning) | 0.40529 | 0.858 | 1.2227 | 95.60% | |
| GRU(1_Layer) | -0.945 | 1.656 | 3.9987 | 91.05% | |
| GRU(2_Layer) | 0.19727 | 1.02 | 1.6503 | 94.69% | |
| Bi-GRU(1_Layer) | -1.30027 | 1.921 | 4.7291 | 89.78% | |
| GRU(Hyper-parameter-Tuning) | 0.39259 | 0.853 | 1.2488 | 95.54% | |
| GAN(LSTM+CNN) | 0.62 | 0.66 | 0.723 | 96.63% | |
| GAN(GRU+CNN) | 0.58 | 0.7 | 0.79 | 96.40% | |
| AMD | ARIMA | 0.2494 | 8.052 | 89.218 | 90.55% |
| LSTM(1_Layer) | 0.37021 | 7.375 | 82.593 | 90.54% | |
| LSTM(2_Layer) | 0.7565 | 4.986 | 31.933 | 93.95% | |
| Bi-LSTM(1_Layer) | 0.49771 | 6.623 | 65.872 | 91.53% | |
| LSTM(Hyper-parameter-tuning) | 0.87602 | 3.554 | 16.26 | 95.78% | |
| GRU(1_Layer) | 0.29259 | 7.838 | 92.772 | 89.97% | |
| GRU(2_Layer) | 0.84033 | 4.076 | 20.94 | 95.11% | |
| Bi-GRU(1_Layer) | 0.15529 | 9.138 | 110.78 | 88.56% | |
| GRU(Hyper-parameter-Tuning) | 0.89676 | 3.176 | 13.539 | 96.23% | |
| GAN(LSTM+CNN) | 0.91 | 2.65 | 10.77 | 97.91% | |
| GAN(GRU+CNN) | 0.91 | 2.6 | 10.2 | 96.96% | |
| META | ARIMA | 0.4917 | 6.83 | 76.34 | 95.79% |
| LSTM(1_Layer) | 0.14344 | 9.25 | 129.71 | 93.92% | |
| LSTM(2_Layer) | 0.21076 | 9.232 | 119.51 | 94.25% | |
| Bi-LSTM(1_Layer) | 0.32916 | 8.45 | 101.58 | 94.72% | |
| LSTM(Hyper-parameter-tuning) | 0.78322 | 4.897 | 32.826 | 96.92% | |
| GRU(1_Layer) | 0.15871 | 9.177 | 127.4 | 94.18% | |
| GRU(2_Layer) | 0.75607 | 5.223 | 36.937 | 96.73% | |
| Bi-GRU(1_Layer) | -3.5099 | 25.21 | 682.93 | 83.88% | |
| GRU(Hyper-parameter-Tuning) | 0.80461 | 4.546 | 29.588 | 97.14% | |
| GAN(LSTM+CNN) | 0.78 | 4.6 | 33.45 | 97.08% | |
| GAN(GRU+CNN) | 0.78 | 4.6 | 33.16 | 97.09% |
Table 4.
Evaluation results III.
| Stock-Name | Model | Adjusted-R2 | MAE | MSE | Accuracy |
|---|---|---|---|---|---|
| TSLA(Tesla) | ARIMA +Vader | -7.1901 | 34.53 | 1357.36 | 88.00% |
| LSTM(1_Layer)+Vader | 0.06255 | 9.494 | 117.01 | 96.74% | |
| LSTM(2_Layer)+Vader | -0.0926 | 10.03 | 136.37 | 96.54% | |
| Bi-LSTM(1_Layer)+Vader | 0.06767 | 9.39 | 116.37 | 96.79% | |
| LSTM(Hyper-parameter-tuning)+Vader | 0.02835 | 9.409 | 121.28 | 96.76% | |
| GRU(1_Layer)+Vader | 0.11166 | 9.504 | 110.88 | 96.74% | |
| GRU(2_Layer)+Vader | 0.09464 | 9.083 | 113 | 96.87% | |
| Bi-GRU(1_Layer)+Vader | 0.02433 | 9.404 | 121.78 | 96.77% | |
| GRU(Hyper-parameter-Tuning)+Vader | 0.40526 | 6.936 | 74.233 | 97.60% | |
| GAN(LSTM+CNN)+Vader | -1.33 | 15.83 | 385.86 | 94.48% | |
| GAN(GRU+CNN)+Vader | -0.55 | 13.41 | 256.73 | 95.42% | |
| NIO | ARIMA +Vader | -6.126 | 3.064 | 13.176 | 84.37% |
| LSTM(1_Layer)+Vader | 0.1065 | 1.135 | 2.222 | 93.92% | |
| LSTM(2_Layer)+Vader | -0.1098 | 1.218 | 2.229 | 93.66% | |
| Bi-LSTM(1_Layer)+Vader | 0.09755 | 1.091 | 1.8122 | 94.36% | |
| LSTM(Hyper-parameter-tuning)+Vader | 0.16472 | 0.966 | 1.677 | 95.09% | |
| GRU(1_Layer)+Vader | 0.15614 | 0.956 | 1.695 | 95.03% | |
| GRU(2_Layer)+Vader | 0.07149 | 1.071 | 1.865 | 94.37% | |
| Bi-GRU(1_Layer)+Vader | 0.01789 | 1.149 | 1.972 | 93.99 | |
| GRU(Hyper-parameter-Tuning)+Vader | 0.50236 | 0.739 | 0.999 | 96.14% | |
| GAN(LSTM+CNN)+Vader | -10.06 | 4.3 | 20.88 | 78.29% | |
| GAN(GRU+CNN)+Vader | 0.20 | 0.98 | 1.51 | 94.87% | |
| AMD | ARIMA +Vader | -0.0148 | 9.873 | 118.12 | 88.88% |
| LSTM(1_Layer)+Vader | 0.39875 | 7.354 | 77.016 | 90.95% | |
| LSTM(2_Layer)+Vader | 0.73123 | 5.185 | 34.428 | 93.70% | |
| Bi-LSTM(1_Layer)+Vader | 0.84459 | 3.965 | 19.907 | 95.21% | |
| LSTM(Hyper-parameter-tuning)+Vader | 0.86337 | 3.571 | 17.502 | 95.73% | |
| GRU(1_Layer)+Vader | 0.17302 | 8.242 | 105.93 | 89.65% | |
| GRU(2_Layer)+Vader | 0.43306 | 7.151 | 72.621 | 96.95% | |
| Bi-GRU(1_Layer)+Vader | -0.0587 | 10.36 | 135.62 | 87.04% | |
| GRU(Hyper-parameter-Tuning)+Vader | 0.91619 | 2.705 | 10.735 | 96.86% | |
| GAN(LSTM+CNN)+Vader | 0.78 | 4.47 | 26.47 | 94.63% | |
| GAN(GRU+CNN)+Vader | 0.14 | 8.7 | 102.67 | 89.11% | |
| META | ARIMA +Vader | 0.40448 | 7.848 | 87.594 | 95.02% |
| LSTM(1_Layer)+Vader | 0.02308 | 10.21 | 144.49 | 93.64% | |
| LSTM(2_Layer)+Vader | 0.23747 | 8.621 | 112.78 | 94.55% | |
| Bi-LSTM(1_Layer)+Vader | 0.31798 | 8.205 | 100.87 | 94.70% | |
| LSTM(Hyper-parameter-tuning)+Vader | 0.77602 | 4.918 | 33.127 | 96.91% | |
| GRU(1_Layer)+Vader | -3.0561 | 21.96 | 599.92 | 85.67% | |
| GRU(2_Layer)+Vader | 0.71285 | 5.622 | 42.471 | 96.45% | |
| Bi-GRU(1_Layer)+Vader | 0.69751 | 5.741 | 44.727 | 96.38% | |
| GRU(Hyper-parameter-Tuning)+Vader | 0.81954 | 4.307 | 26.691 | 97.30% | |
| GAN(LSTM+CNN)+Vader | -2.62 | 21.7 | 544.1 | 86.07% | |
| GAN(GRU+CNN)+Vader | -8.47 | 37.07 | 1421.9 | 77.14% |
Table 5.
Comparison to previous results.
| Paper | Model | MSE | RMSE | MAE | Adj-R2 | Accuracy | Stock name |
|---|---|---|---|---|---|---|---|
| 9 | Bi-LSTM | - | - | 0.07121 | - | - | - |
| 10 | Bi-LSTM | 0.0355 | 0.188206 | - | - | 94% | - |
| 11 | GAN | - | - | - | - | - | - |
| Our Study | GRUVader | 0.124 | 0.0498 | 0.00248 | 0.40526 | 97.60% | TSLA |
| 0.34 | 0.0583 | 0.0034 | 0.91619 | 96.86% | AMD | ||
| 0.24 | 0.0490 | 0.0024 | 0.81954 | 97.30% | META | ||
| 0.10 | 0.0316 | 0.0010 | 0.50236 | 96.14% | NIO |
Disclaimer/Publisher’s Note: The statements, opinions and data contained in all publications are solely those of the individual author(s) and contributor(s) and not of MDPI and/or the editor(s). MDPI and/or the editor(s) disclaim responsibility for any injury to people or property resulting from any ideas, methods, instructions or products referred to in the content. |
© 2024 by the authors. Licensee MDPI, Basel, Switzerland. This article is an open access article distributed under the terms and conditions of the Creative Commons Attribution (CC BY) license (http://creativecommons.org/licenses/by/4.0/).
Copyright: This open access article is published under a Creative Commons CC BY 4.0 license, which permit the free download, distribution, and reuse, provided that the author and preprint are cited in any reuse.


