

Submitted:
24 October 2024
Posted:
25 October 2024
You are already at the latest version
Abstract
Background: The aim of this study was to determine the effect of Sparstolonin B (SsnB) on cell proliferation and apoptosis in human breast cancer (MCF-7) and human ovarian epithelial cancer (OVCAR-3) cell lines in the presence and absence of estradiol hemihydrate (ES). Phosphoinositol-3 kinase (PI3K), phosphorylated protein kinase B alpha (p-AKT), phosphorylated mTOR (mechanistic target of rapamycin) signaling proteins and sphingomyelin/ceramide metabolites were also measured within the scope of the study.
Methods: The anti-proliferative effects of SsnB therapy were evaluated over a range of times and concentrations. Cell proliferation was determined by measurement of Proliferating Cell Nuclear Antigen (PCNA). PCNA was quantified by ELISA and cell distribution was assessed by immunofluorescence microscopy. MTT analysis was used to test the vitality of the cells, while LC-MS/MS was used to analyze the amounts of ceramides (CERs), sphingosine-1-phosphate (S1P), and sphingomyelins (SMs). TUNEL labeling was used to assess apoptosis, while immunofluorescence staining and enzyme-linked immunosorbent assay (ELISA) were used to measure the levels of PI3K, p-AKT, and p-mTOR proteins.
Results: Sparstolonin B administration significantly decreased cell viability in MCF-7 and OVCAR-3 cells both in the presence and absence of ES, while it did not cause toxicity in healthy human fibroblasts. In comparison to controls, cancer cells treated with SsnB showed a significant drop in the levels of S1P, PI3K, p-AKT, and p-mTOR. In cancer cells cultured with SsnB, a significant increase in intracellular concentrations of C16-C24 CERs and apoptosis was observed.
Conclusions: SsnB downregulated the levels of S1P, PI3K, p-AKT, and p-mTOR while reducing cell proliferation and promoting ceramide buildup and apoptosis.
Keywords:
Sparstolonin B
; ceramide
; apoptosis
; PI3K
; AKT
; mTOR
1. Introduction
As of 2022, breast cancer remains the most frequently diagnosed cancer among women worldwide, with 2.3 million new cases reported. It accounted for over 670,000 deaths globally in that year. Breast cancer is the most common cancer in women across 157 out of 185 countries, highlighting its global prevalence. Incidence rates are generally higher in countries with high Human Development Index (HDI) scores, where 1 in 12 women are expected to be diagnosed in their lifetime [1]. In 2022, there were approximately 324,603 new cases of ovarian cancer reported globally. This cancer type accounts for an age-standardized incidence rate (ASR) of 6.7 per 100,000 women [1]. Despite advancements in treatment, ovarian cancer remains challenging to manage, particularly in lower-income regions where access to specialized care is limited. Ovarian cancer ranks among the more serious cancers for women, given its high mortality rate, and the number of cases is expected to increase, especially in low- and middle-income countries due to limited access to screening and treatment options.
Recent research highlights that polyphenols, such as curcumin, resveratrol, quercetin, and epigallocatechin gallate (EGCG), are increasingly being explored in combination with chemotherapy for treating breast [2,3] and ovarian cancers [4,5]. These natural compounds offer synergistic benefits by enhancing the efficacy of chemotherapeutic agents like paclitaxel, cisplatin, and 5-fluorouracil [2,3,4,5]. Polyphenols can reduce drug resistance, promote apoptosis, and inhibit cancer cell proliferation. Additionally, they help alleviate the toxic side effects of chemotherapy, improving patient outcomes and quality of life [2,3,4,5]. Research supports that combining these bioactive compounds with standard chemotherapy offers promising results, especially for difficult-to-treat cancers like triple-negative breast cancer and recurrent ovarian cancer [2,3,4,5].
A novel bioactive substance called SsnB was isolated from Sparganium stoloniferum and is classified as a polyphenol [6]. Its structure shares similarities with isocoumarins and xanthones, which are known classes of polyphenolic compounds [7]. This chemical composition contributes to its anti-inflammatory and anti-angiogenic properties, which are being explored for cancer treatment and other inflammatory conditions [8]. SsnB acts by inhibiting toll-like receptor signaling, reducing inflammatory cytokine expression, and disrupting cell cycle progression, making it a promising candidate for therapeutic applications [9]. SsnB has been shown to block the PI3K/Akt pathway by inhibiting ROS status in prostate cancer cells [10]. While the effects of SsnB on several cancer types, including neuroblastoma, have been studied [6], specific research on breast or ovarian cancer is limited. Given its mechanism of action—targeting inflammatory pathways and regulating cell survival—there is potential for SsnB to be relevant in breast and ovarian cancer treatments, but further investigations are needed.
Human breast (MCF-7) and ovarian cancer cell lines (OVCAR-3) used in this study are estrogen receptor positive cells [11]. Estrogen-dependent cell proliferation occurs via the phosphoinositol-3 kinase (PI3K)/serine threonine protein kinase (AKT)/Mechanistic Target of Rapamycin (mTOR) pathway [12]. As a result of the binding of estrogen to its receptor, PI3K is activated and activates AKT. The active AKT phosphorylates a protein called mTOR, which ensures cell proliferation and survival [12]. The PI3K/AKT/mTOR signaling pathway stimulates proliferation and tumor growth in both ovarian and breast cancer cells [13,14].
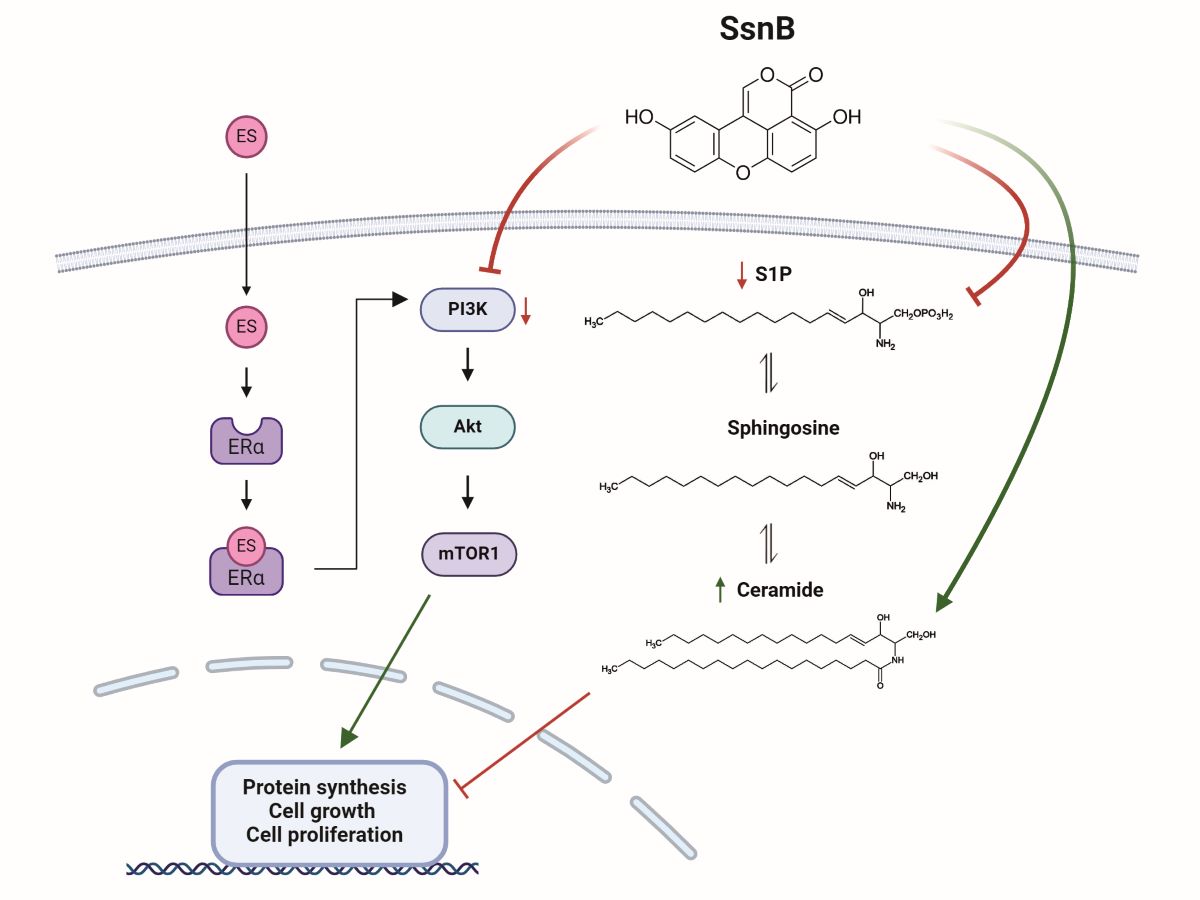
SsnB has been shown to block the PI3K/AKT pathway by inhibiting the formation of reactive oxygen metabolites (ROS) [10]. Ceramide is also known to inhibit the PI3K/AKT pathway [15]. Based on this information, we hypothesized that SsnB could suppress estrogen-dependent cell proliferation in breast and ovarian cancer cells, and that this effect could develop through the inhibition of PI3K/AKT/mTOR signaling pathway. The effect of SsnB on ceramide levels in estrogen receptor-positive breast and ovarian cancer cells were also investigated.
2. Results
2.1. Cell Viability Analysis
2.1.1. Estrogen Proliferation analysis
Cell viability analysis following 16, 24 and 48 hours of ES (1-100 nM) treatment was performed in MCF-7, OVCAR-3 and non-cancerous BJ fibroblasts (Figure 1). Cell viability was significantly reduced in MCF-7 cells at 16 and 24 hours at all administered ES doses compared to the control groups. In MCF-7 cells, 10 and 100 nM ES at 48 hours significantly increased cell proliferation compared to all other groups. All ES doses administered to MCF-7 cells for 48 hours significantly increased viability compared to 16- and 24-hour applications. (Figure 1A).
All ES doses administered to OVCAR-3 cells for 16 hours significantly decreased viability compared to 24- and 48-hour applications. Treatment of OVCAR-3 cells with 10 and 100 nM ES for 48 hours significantly increased cell viability compared to the control group. In OVCAR-3 cells, 100 nM ES treatment for 24 hours significantly increased cell proliferation compared to control and DMSO groups (Figure 1B). In BJ cells, ES 100 nM application at all hours significantly reduced cell proliferation compared to all groups. In addition, 100 nM ES treatment in BJ cells significantly reduced cell viability at 48 hours compared to 16 hour treated group (Figure 1C).
Figure 1D shows light microscope images (10X magnification) of ES applied MCF-7, OVCAR-3 and BJ cells at 48 hours. While no change was observed in the control and DMSO (1μl/ml) groups, a significant proliferation was observed in MCF-7 and OVCAR-3 cells treated with 10 and 100 nM ES, compared to the control group. It was observed that 100 nM ES application for 48 hours caused deterioration in morphology, shrinkage, clustering and toxicity in BJ cells (Figure 1D).
2.1.2. Anti Proliferative Effects of Sparstolonin B
Cell viability analysis following 16, 24 and 48 hours of SsnB (3,125-50 µM) treatment was performed in MCF-7, OVCAR-3 and non-cancerous BJ fibroblasts (Figure 2). SsnB applied at 3.125-12.5 µM doses did not cause a significant reduction in MCF-7 cell viability throughout all time periods. Treatment with 25 and 50 µM SsnB caused a significant decline in cell viability throughout all test periods compared to all other groups. In addition, 25 µM SsnB treatment applied for 24 and 48 hours significantly decreased cell viability compared to 16 hour treatment within the same dose group. Treatment with 50 µM SsnB for 16 and 48 hours significantly reduced cell viability compared to 25 µM within the same time periods (Figure 2A).
In OVCAR-3 cells, all SsnB doses applied throughout all tested time periods significantly reduced cell viability compared to the control and DMSO groups. 16 and 48 hours SsnB treatment at 50 µM significantly decreased cell viability when compared to 3.125-25 µM doses within the same time periods. In Ovcar-3 cells, 25 and 50 µM SsnB treatment applied for 24 hours significantly reduced cell viability compared to 3.125-6.25 µM groups within the same time periods (Figure 2B). In BJ cells, 12.5 µM and 25 µM SsnB treatment applied for 48 hours and 50 µM SsnB treatment applied for all time points significantly reduced cell viability compared to all other groups (Figure 2C). In MCF-7 and OVCAR-3 cells, 48 hours of 10 nM ES administration significantly increased cell proliferation compared to all other groups. SSnB administration of 25 μM alone significantly reduced viability in both MCF-7 and OVCAR-3 cells compared to the control, DMSO, and ES 10 nM groups. 24 hours of 25 μM SsnB treatment, which was started following 24 hours of 10 nM ES administration, similarly reduced cell viability (figures 2D and 2E).
Figure 2F shows the morphological changes of SsnB and ES administration in MCF-7 and OVCAR-3 cell groups. While no change was observed in cells after 24 h of DMSO (1 μL/mL) treatment. Significant proliferation was observed in MCF-7 and OVCAR-3 cells compared to the control as a result of 10 nM ES application. SsnB application significantly decreased cell proliferation and caused significant changes in cell morphology in MCF-7 and OVCAR-3 cells compared to the control and ES groups. Incubation with SsnB started 24 h after ES treatment and was continued for 24 h. SsnB treatment alone and ES+SsnB application was observed to cause deterioration in morphology, loss of adherence, shrinkage, clustering and toxicity in MCF-7 and OVCAR-3 cells.
2.2. Proliferating Cell Nuclear Antigen Levels
Figure 3A shows PCNA immunofluorescence staining in MCF-7 and OVCAR-3 cells. Quantitation of PCNA fluorescence staining showed that PCNA protein was significantly increased in MCF-7 (Figure 3B) and OVCAR-3 (Figure 3C) cells treated with 10 nM ES compared to control, DMSO and SsnB groups. SsnB (25 µM) treatment alone or SsnB (25 µM) treatment following 24 hour ES (10 nM) incubation significantly decreased PCNA immunostaining compared to 10 nM ES groups. In addition, PCNA immunostaining was significantly reduced in the SsnB treatment group as compared to ES +SsnB. ELISA analysis of PCNA protein levels in MCF-7 (Figure 3D) and OVCAR-3 (Figure 3E) cells confirmed the immunofluorescence staining and showed that the amount of PCNA protein was significantly increased in cancer cells incubated with 10 nM ES for 48 h compared to all other experimental groups. Treatment with 25 µM SsnB for 24 h significantly decreased cell proliferation compared to all other groups. In addition, PCNA ELISA measurements in OVCAR-3 cells also confirmed significantly reduced levels in the SsnB treatment group as compared to ES + SsnB (Figure 3E).
2.3. Apoptotic Cells (TUNEL)
Figure 3F shows TUNEL immunofluorescence staining in MCF-7 and OVCAR-3 cells. There was no discernible difference in the quantity of apoptotic cells between control, DMSO, and ES groups. A significant increase in the number of apoptotic cells was observed in the SsnB group compared to all other groups. Combination of ES + SsnB treatment in MCF-7 cells also increased the degree of apoptosis compared to control, DMSO and ES 10 nM groups however had no effect on the apoptotic cell number in OVCAR-3 cells (figures 3G and 3H).
2.4. PI3K, p-AKT and p-mTOR Levels in MCF-7 and OVCAR-3 Cells
Figures 4A and 5A show PI3K, p-AKT, and p-mTOR immunofluorescence staining in MCF-7 and OVCAR-3 cells, respectively. Quantitation of PI3K fluorescence staining and PI3K ELISA measurements showed a significant increase in both MCF-7 (Figure 4B and 4E, respectively) and OVCAR-3 (Figure 5B and 5E, respectively) cells in the 10 nM ES groups compared to all other groups. SsnB (25 µM) treatment alone decreased PI3K immunostaining and protein levels in both MCF-7 (Figure 4B and 4E, respectively) and OVCAR-3 (Figure 5B and 5E, respectively) cells compared to all other groups. The increase in PI3K levels following 10 nM ES administration was attenuated following SSnB treatment in the ES+ SSnB group and this decrease was significant in both MCF-7 and OVCAR-3 cells compared to ES 10 nM.
Quantitation of p-AKT fluorescence staining and p-AKT ELISA measurements showed a significant increase in both MCF-7 (Figure 4C and 4F, respectively) and OVCAR-3 (Figure 5C and 5F, respectively) cells in the 10 nM ES groups compared to all other groups. SsnB (25 µM) treatment alone decreased p-AKT immunostaining and protein levels in both MCF-7 (Figure 4C and 4F, respectively) and OVCAR-3 (Figure 5C and 5F, respectively) cells compared to all other groups. The increase in p-AKT levels following 10 nM ES administration was attenuated following SSnB treatment in the ES+ SSnB group and this decrease was significant in both MCF-7 and OVCAR-3 cells compared to ES 10 nM.
Quantitation of p-mTOR fluorescence staining and p-mTOR ELISA measurements showed a significant increase in both MCF-7 (Figure 4D and 4G, respectively) and OVCAR-3 (Figure 5D and 5G, respectively) cells in the 10 nM ES groups compared to all other groups. SsnB (25 µM) treatment alone decreased p-mTOR immunostaining and protein levels in both MCF-7 (Figure 4D and 4G, respectively) and OVCAR-3 (Figure 5D and 5G, respectively) cells compared to all other groups. The increase in p-mTOR levels following 10 nM ES administration was attenuated following SSnB treatment in the ES+ SSnB group and this decrease was significant in both MCF-7 and OVCAR-3 cells compared to ES 10 nM.
2.5. Sphingolipid Levels
Sphingolipid levels measured in MCF-7 and OVCAR-3 cancer cells are shown in Table 1. A significant increase in S1P levels was detected in MCF-7 and OVCAR-3 cells treated with 10 nM ES for 48 hours compared to all other groups. Incubation with 25 µM SsnB for 24 hours significantly decreased S1P levels in both MCF-7 cells and OVCAR-3 cells compared to all other groups. The increase in S1P levels following 10 nM ES administration was attenuated following SSnB treatment in the ES+ SSnB group and this decrease was significant in both MCF-7 and OVCAR-3 cells compared to ES 10 nM. Incubation with 25 µM SsnB for 24 hours significantly increased C18-C24 ceramide levels in both MCF-7 cells and OVCAR-3 cells compared to all other groups. C18-24 levels were also increased following SSnB treatment in the ES + SSnB group and this increase was significant in both MCF-7 and OVCAR-3 cells compared to control, DMSO and ES 10 nM groups.
3. Discussion
The results of this study showed that the treatment of MCF-7 and OVCAR-3 cancer cells with 10 nM estradiol hemihydrate for 48 h significantly increased proliferation. Several studies have reported the proliferative effect of estradiol, specifically at a concentration of 10 nM, on MCF-7 breast cancer cells [16,17]. Estradiol binds to estrogen receptors (primarily ERα in MCF-7 cells), leading to increased transcription of genes involved in cell proliferation [18]. This concentration of estradiol has been linked to the upregulation of genes that promote cell cycle progression and downregulation of inhibitory miRNAs like miR-21, which affects tumor suppressor pathways [19]. In one study, treatment with 10 nM estradiol enhanced cell growth and demonstrated receptor-specific effects, highlighting the importance of ERα and ERβ in proliferation and gene regulation [20]. The interaction of estradiol with co-factors like AP-1 transcription factors further underlined its role in cell proliferation through complex regulatory mechanisms [21]. These findings confirm that estradiol at physiologically relevant concentrations plays a significant role in promoting the growth of hormone-responsive breast cancer cells like MCF-7, reinforcing its importance in breast cancer research and therapeutic targeting strategies.
Studies also suggest that estradiol influences proliferation in ovarian cancer cell lines like OVCAR-3. Research shows that estradiol, in the nanomolar range, affects various aspects of cancer cell behavior, including growth and receptor expression [22]. In experiments with OVCAR-3 cells, researchers often use estradiol to investigate estrogen receptor-mediated mechanisms. These studies sometimes compare effects across multiple concentrations, such as 1 nM, 10 nM, and 100 nM, reflecting dose-dependent responses related to estrogen sensitivity and signaling pathways [23].
Incubation of MCF-7 and OVCAR-3 cells with 25 µM SsnB for 24 h significantly reduced cell proliferation both in the presence and absence of ES. Studies have shown that SsnB can significantly reduce the proliferation of cancer and endothelial cells [24]. SsnB has been reported to inhibit cancer-related processes such as cell migration, invasion, and angiogenesis by interfering with the cell cycle, particularly by halting cells at the G1 or G2/M checkpoints [24]. SsnB concentrations ranging from 10 µM to 100 µM have shown strong antiproliferative effects in various cell types, including neuroblastoma [6] and prostate cancer models [10]. To the best of our knowledge, this study shows for the first time that SSnB inhibits estrogen-dependent proliferation in MCF-7 and OVCAR-3 cancer cells. This compound also disrupts vascular endothelial cell function, which could be critical for tumors that rely on angiogenesis for growth and metastasis [24].
MCF-7 and OVCAR-3 cells treated with cytotoxic concentrations of SsnB for 24 hours showed a significant increase in intracellular levels of C18-C24 ceramides in comparison to controls. This work is the first to assess how SsnB affects the amounts of endogenous sphingolipids in breast and ovarian cancer cells. It appears that current research has not directly linked SsnB to increased ceramide levels. Most studies on sparstolonin B focus on its anti-inflammatory, anti-proliferative, and anti-angiogenic effects, primarily through modulating Toll-like receptor (TLR) pathways [9] and suppressing NF-κB and STAT1 signaling [25]. The impact of SsnB on lipid metabolism or ceramide levels specifically has not been well documented in the studies reviewed. Sparstolonin B is a selective TLR antagonist with potent anti-inflammatory properties [9]. In mouse macrophages stimulated by a TLR4, TLR1/TLR2 or a TLR2/TLR6 ligand, SsnB substantially suppressed inflammatory cytokine expression [9]. Toll-like receptor 4 promotes survival and invasiveness of breast cancer cells and ovarian cancer cells through induction of cell proliferation and apoptosis resistance [26,27].
The relationship between TLR signaling and ceramide synthesis in cancer cells is complex. Some research indicates potential crosstalk between TLR signaling and sphingolipid metabolism, including ceramide production, which plays a role in cancer therapy [28]. However, direct examples of TLR antagonists increasing ceramide synthesis are not well-established. TLRs control the inflammatory responses in cancer cells, and increased TLR expression has been associated to oncogenesis and the advancement of cancer in cancer cell lines [29]. The relationship between TLR and cancer is still debatable, though. TLRs have the apparent ability to slow the advancement of cancer [30,31], but they have also been shown to accelerate it [32]. These compounds are appealing as therapeutic targets because of the increased expression of TLRs within a tumor. The TLR2/TLR4 agonist (Bacillus Calmette and Guérin) is the most effective TLR ligand in cancer therapy; it has been used to treat bladder cancer for more than thirty years [33]. Proinflammatory chemokine, and immunosuppressive cytokines are produced irregularly and uninhibitedly by TLR-4 during tumor progression; this suggests that finding TLR-4 antagonists could be a great way to treat cancer. TLR-4 antagonists, however, carry the potential to jeopardize host immunity. Therefore, the question of whether to target TLR-4 agonists or antagonists for the treatment of cancer remains unresolved in science. To completely understand the roles of TLR-4 agonists and antagonists in different malignancies, more research must be done [34]. Our findings suggest that manipulating TLR signaling holds therapeutic promise, with the potential to exploit ceramide’s role in inducing cancer cell death and overcoming drug resistance mechanisms.
We found that giving cancer cells a 24-hour therapy with 25 µM SsnB significantly lowered their S1P levels. To the best of our knowledge, our work is the first to document decreased S1P levels in SsnB-treated cancer cells. Ceramide and S1P are examples of functional sphingolipid metabolites that play critical roles in the operation of multiple biological pathways that are essential to the pathophysiology of cancer. The current understanding of biologically active sphingolipid production acknowledges their critical roles in the progression and development of cancer. Ceramide is an essential part of the metabolism of sphingolipids and functions as a tumor-suppressive chemical in many malignant cells, inducing anti-proliferative and apoptotic responses [35]. Conversely, S1P triggers processes that turn it into a lipid that promotes cancer [36].
We have seen that PI3K, p-AKT, and p-mTOR proteins were significantly suppressed in cancer cells treated with SsnB compared to the control groups. Our results support previous studies that have shown that SsnB blocks the PI3K/Akt pathway in prostate cancer cells [10]. The PI3K/AKT/mTOR pathway is a critical intracellular signaling pathway that regulates cell growth, survival, metabolism, and proliferation [37]. It is often hyperactivated in cancers, including breast [38] and ovarian cancers [39], contributing to tumor progression, metastasis, and therapy resistance. External signals like insulin, growth factors (e.g., EGF, VEGF), or hormones bind to receptor tyrosine kinases (RTKs) such as HER2 or the insulin receptor. This activates PI3K, a lipid kinase that converts PIP2 to PIP3 on the plasma membrane [40]. PIP3 recruits AKT to the membrane, where it is phosphorylated and activated. Phosphorylated AKT promotes cell survival by inhibiting pro-apoptotic factors and stimulating anti-apoptotic proteins. AKT indirectly activates mTOR, a major regulator of cell growth [40]. In breast cancer PI3K/AKT/mTOR is frequently activated due to mutations in genes like PIK3CA and amplification of receptor tyrosine kinases like HER2 [38]. These alterations drive tumor growth and metastasis. Up to 40% of breast cancers with mutations in PIK3CA are estrogen receptor (ER)-positive, contributing to resistance against hormonal therapies. As a result, PI3K/AKT/mTOR inhibitors are being tested to improve treatment outcomes for breast cancer patients, especially those with endocrine resistance [40]. In ovarian cancer this pathway is similarly implicated in disease progression, chemoresistance, and epithelial-to-mesenchymal transition (EMT), which allows cancer cells to become more invasive. Targeting PI3K/AKT/mTOR can reduce stem cell-like properties in ovarian cancer cells, which are often associated with relapses and resistance to standard treatments [39]. Drugs like BEZ235, an mTOR/PI3K dual inhibitor, are being investigated to enhance chemotherapy responses by reversing EMT and decreasing markers associated with cancer stem cells [41].
As was previously mentioned, ceramide production stimulation and apoptosis induction are key mechanisms by which SsnB exerts its anticancer effects. A substantial increase in apoptosis was observed in cancer cells treated with 25 µM SsnB for a full day, as revealed by TUNEL analysis. Our results corroborate earlier research suggesting that SsnB elevated apoptosis in pancreatic cancer. [42] and in prostate cancer cells [10],
In conclusion, the application of SsnB dramatically decreased the viability of the cancer cells, inhibited the levels of proliferating cell nuclear antigen, S1P, PI3K, p-AKT, and p-mTOR protein, and increased the amounts of ceramide and apoptotic cells (graphical abstract). Cancer cells treated with SsnB exhibit reduced proliferation, which may facilitate apoptosis. This is due in part to increased ceramide concentrations, decreased S1P, decreased p-AKT, and reduced p-mTOR levels.
4. Materials and Methods
4.1. Cell Culture
Estrogen-positive non-metastatic human breast cancer (MCF-7) and non-cancer human fibroblast (BJ) cell lines were obtained from ATCC (Manassas, VA, USA) while human ovarian epithelial cancer (OVCAR-3) cell lines were purchased from İ-Cell (Fengxian Dist, Shanghai, China). MCF-7 cells were grown in Dulbecco’s Modified Eagle’s Medium (DMEM)–F12 (Biowest, Nuaillé, France) while OVCAR-3 and BJ cells were maintained in RPMI-1640 medium (Capricorn; Cat.#RPMI-A, Ebsdorfergrund, Germany), containing 10% fetal bovine serum (FBS) (Gibco, Life Technologies, Grand Island, NY, USA), along with %1 penicillin and streptomycin (Gibco), antifungal amphotericin B (%1, Gibco), supplemented with 5% sodium bicarbonate. All cell cultures were kept in an incubator set to 37°C with 5% carbon dioxide and 95% humidity. Once the cells reached 70-80% confluency, they were transferred to new flasks after being detached from the flask surface using trypsin (0.05%)-EDTA (0.02%) solution (Gibco).
4.2. Estradiol and Sparstolonin B Treatment
Cell proliferation was stimulated using estradiol hemihydrate (ESTROFEM, MW: 562.8 g/mol, Novo Nordisk Pharmaceutical Industry, Istanbul, Turkey). A stock concentration of 3.6 mM of estrogen hemihydrate was prepared by dissolving 2 mg of tablet in 1 ml DMSO. This stock was further diluted with cell culture medium to create a 1 mM intermediate stock solution. The final estrogen concentrations tested in the MTT assay were 1, 10, and 100 nM. The MTT assay results helped define the optimal dose and period of estrogen treatment for MCF-7, OVCAR-3 and BJ cells. Sparstolonin B (purity ≥99.0% and MW: 268.32 g/mol) was purchased from Sigma-Aldrich (St. Louis, MO, USA). To prepare a 10 mM stock solution, 5 mg of Sparstolonin B was dissolved in 1864 µL of DMSO. This stock was then diluted with cell culture medium to form a 1 mM intermediate solution. The final concentrations of Sparstolonin B used in the MTT assay ranged from 3.125 to 50 µM. Results from MTT assay were used to establish the final dose and period of Sparstolonin B treatment in MCF-7, OVCAR-3 and BJ cells.
4.3. Cell Viability
MTT assay (3-(4,5-dimethylthiazol-2-yl)-2,5-diphenyltetrazolium bromide) was performed to analyze cell viability. MTT (Gold Biotechnology Inc., St. Louis, MO, USA) was dissolved in PBS solution (5 mg/mL) and filtered via a 0.22 µm pore size filter. MCF-7, OVCAR-3 and BJ cells were seeded in sterile 96-well plates at a density of 5 × 10³ cells per 100 µL of medium. Cells were cultured overnight to allow attachment before being treated with cell culture medium containing either 1 µL/mL DMSO, 1-10-100 nM ES, and 3.125-50 µM SsnB. After incubation periods of 16, 24, and 48 hours, the MTT protocol was initiated. The incubation medium was removed and 90 µL of fresh medium along with 10 µL of MTT were added to each well. Following 2-hour incubation at 37°C, the purple formazan crystals formed were dissolved by the addition of 100 µL DMSO. Absorbance was measured at 570 and 690 nm using a MicroQuant plate reader (Bio-Tek Instruments Inc. Vermont, USA). The absorbance from the control group was considered as 100% cell viability and cell viability (%) was calculated using the formula [Cell viability (%) = (Abs sample / Abs control) × 100].
Five different experimental groups were created according to MTT cell viability results. 1-Control (only medium); 2-DMSO (cells incubated with 1 µL/mL DMSO for 24 h); 3-ES (cells treated with 10 nM ES for 48 h); 4-SsnB (cells incubated with 25 µM SsnB for 24 h); 5-ES+SsnB (incubation with 25 µM SsnB started 24 hours after 10 nM ES treatment and was continued for 24 hours).
4.4. Immunostaining
Approximately 100,000 cells per well (MCF-7 or OVCAR-3) were plated on 8-well chamber slides (Merck Millipore, Cork, Ireland). For cell adhesion, the chamber slides were incubated for the entire night at 37°C and 5% CO2. After the cells achieved 70% confluency, the culture medium was switched out for the treatment medium, and the incubation process lasted for 24 hours. After the incubation period, the medium was removed, and cells underwent two washes using 0.01 M cold PBS. Freshly made 250μL of 4% paraformaldehyde (Sigma-Aldrich, St. Louis, MO, USA), was added and cells were fixed for ten minutes at room temperature. After aspirating the fixing solution, the cells underwent two PBS washes. To initiate the permeabilization process, 300 μL of PBS containing 0.2% Triton X-100 (SigmaAldrich, St. Louis, MO, USA) was added, and incubated at room temperature for 30 minutes. The cells were then washed five times with cold PBS and blocked with 5% normal goat serum (NGS from Vector Laboratories, CA, USA). After removing the blocking solution, the cells were treated overnight at 4°C with primary antibodies against PI3K (#BT-AP07136, BT Bioassay Technology Laboratories, Jiaxing, Zhejiang, China), phospho-Akt (#649001, BioLegend Enabling Legendary Discovery), phospho-mTOR (BT-AP07085, BT Bioassay Technology Laboratories, Jiaxing, Zhejiang, China), and PCNA (Cat.#bs-0754R, Bioss Antibodies Inc., Woburn, MA, USA). Each antibody was diluted 1:200 in 200 µl PBS. After 24 hours, wells were washed five times with PBS at room temperature and incubated with 200 µL of Alexa Fluor-488 conjugated goat anti-rabbit secondary antibody [Cat. #ab150077 Abcam, Cambridge, UK] (1:1000 dilution) for 45 min in a dark room. Cells were washed in PBS 3 times for 5 min and a drop of DAPI (Vector Laboratories Inc., Burlingame, CA, USA) was added for nuclear staining. Finally, the slides were covered with a coverslip without air bubbles and photographs were taken under a microscope. Slides were viewed using a fluorescence microscope (Olympus IX81, Tokyo, Japan) at ×10 magnification. Alexa Fluor dye was imaged at 488 nm excitation and 505–525 nm emission, while DAPI was imaged at 350 nm excitation and 440–460 nm emission. The fluorescence intensity in MCF-7 and OVCAR-3 cells was analyzed using NIH ImageJ 1.53e software. The corrected total cell fluorescence (CTCF) for individual cells in each group was calculated using the formula: CTCF = Integrated Density - (Area of selected cell × Background mean fluorescence).
4.5. ELISA Measurements
To measure levels of PCNA, a non-competitive sandwich ELISA kit (Cat. #ELK5141, ELK Biotechnology, Denver, CO, USA) was used. Following treatment regimens for MCF-7 and OVCAR-3 cells, 107 cells/mL were suspended in PBS and underwent ultrasonication. Cell lysates were centrifuged at 1500 g for 10 min at 2–8°C. The PCNA levels in the supernatants were evaluated in compliance with the kit’s instructions. Using a standard curve, the PCNA intensity in the samples was determined at 450 nm and expressed as ng/mg of protein.
Levels of PI3K, phospho-Akt (ser473), and phospho-mTOR were assessed by sandwich ELISA kits (cat. #E0896Hu, cat. #E4531Hu, cat. #E4485Hu, respectively. BT Lab, Bioassay Technology Laboratory; Shanghai, China). MCF-7 and OVCAR-3 cells were treated according to the study groups, and the collected cells (107 cells/mL) were suspended in PBS, then subjected to ultrasonication and centrifugation at 1500g for 10 minutes at 2–8°C. Measurements of PI3K, phospho-Akt, and phospho-mTOR were conducted in the supernatants in accordance with the manufacturer’s instructions. The amount of PI3K, phospho-Akt (ser473), and phospho-mTOR in the samples were determined at 450 nm using a standard curve and reported as ng/mg of protein.
4.6. Protein Levels
Protein levels were determined at 595 nm via a modified Bradford assay and the Pierce Bradford Plus Protein Assay Reagent (Thermo Fisher Scientific Cat.# 23238, Thermo Fisher, Waltham, MA USA). Bovine serum albumin was used as the standard.
4.7. Apoptotic Cell Analysis
Apoptotic cells were determined using the One-Step TUNEL Test Kit (Elabscience, Cat#E-CK-A320, Houston, Texas, USA). A catalytic process by terminal deoxynucleotidyl transferase (TdT) can add fluorescein-labeled dUTP to the exposed 3’-OH ends of damaged DNA. Every reagent and sample were prepared following the instructions included in the test kit. Approximately 100,000 cells per well (MCF-7 or OVCAR-3) were plated on 8-well chamber slides (Merck Millipore, Cork, Ireland). After the cells achieved 70% confluency, the culture medium was switched out for the treatment medium, and the incubation process lasted for 24 hours. Following the incubation period, the media was removed, the cells were washed with PBS, and paraformaldehyde fixation was carried out for 20 minutes at room temperature. DNase I was used to break off DNA in the positive control group, exposing 3’-OH ends. After applying 100 μL of DNase I solution (200 U/mL), the cells were incubated for 30 minutes at 37°C. PBS was used to wash the slides (three times, for five minutes each). Cells used as negative controls were incubated for five minutes at room temperature in buffer, and then they were washed three times for five minutes each in PBS. Following the completion of the penetration step, 100 μL of TdT Balancing Buffer was added, and the slides were incubated for 25 minutes at 37°C. Upon the conclusion of the incubation period, 50 μL of Labeling Working Solution was introduced into every slide, followed by a 60-minute humidified incubation at 37°C. TdT enzyme was absent in the working solution used for labeling negative controls. The slides were washed three times with PBS for five minutes each. After separating the chambers and wiping them with a napkin, DAPI was dropped onto the slides, and a spotless coverslip was sealed without any air bubbles. A fully automated Olympus BX61 microscope was used to visualize fluorescence intensity and Image J software (NIH) was used for analysis.
4.8. Sphingolipid Measurements
Two microliters of 5 µg/ml IS stock solution were added to one milliliter of OVCAR-3 and MCF-7 cell lysates (10 mg protein/ml). Following the vortexing of tubes, 100 μl of distilled water was added, and samples were sonicated for 30 seconds before being vortexed for 5 minutes with a 1:1, v/v ratio of chloroform to methanol. After 30 minutes of incubation at room temperature, the resultant mixture was centrifuged for 5 minutes at 2000 x g to extract the supernatants. After adding 125 μl of chloroform and 125 μl of distilled water to the supernatants, they were vortexed and allowed to remain at room temperature for half an hour. Following the incubation period, roughly 500 µl of the uppermost organic layer were moved to a fresh glass tube, and the volatilization procedure was executed with a continuous nitrogen supply (VLM, Bielefeld, Germany). Following the dissolution of the dried residues in 100 μl of methanol:formic acid (99.9:0.1), the samples were moved to insert vials and prepared for LC-MS/MS analysis. The procedures previously outlined for LC-MS/MS measurements were followed [43].
4.9. Statistical Analysis
The statistical programs SigmaPlot for Windows and GraphPad Prism 9.00 (Systat Software, Inc.) were used to analyze the data. P values less than 0.05 were deemed statistically significant. The statistical analysis for every measurement is explained in depth in the figure and table legends. Before comparing the groups using statistical analysis, a normality test was run. We used a nonparametric test when the data were not normally distributed.
Author Contributions
Y.D.: methodology, software, validation, formal analysis, and investigation. H.T.Ç.: methodology, software, validation, formal analysis, and investigation. A.Ö.: methodology, software, validation, formal analysis, and investigation. B.Ç.: methodology, software, validation, formal analysis, and investigation. E.K.: conceptualization and supervision. Z.B.: Conceptualization, supervision, review & editing. M.A.: conceptualization, supervision, project administration, funding acquisition, writing—review and editing.
Funding
This work was supported by grants from Akdeniz University Research Foundation BAPSIS (grant number: TDK-2024-6535).
Data Availability Statement
Data obtained and analyzed in this work are available from the corresponding author on reasonable request.
Conflicts of Interest
The authors declare no conflicts of interest.
Abbreviations
ASR: age-standardized incidence rate; BJ, human fibroblast; CERs, ceramides; CTCF, corrected total cell fluorescence; DMEM, Dulbecco’s modified eagle’s medium; EGCG, epigallocatechin gallate; ELISA, enzyme-linked immunosorbent assay; ES, estradiol hemihydrate; FBS, fetal bovine serum; MCF-7, human breast cancer; OVCAR-3, ovarian epithelial cancer; PCNA, proliferating cell nuclear antigen, PI3K, phosphoinositol-3 kinase; p-mTOR, phosphorylated mechanistic target of rapamycin; ROS, reactive oxygen metabolites; RTKs, receptor tyrosine kinases; S1P, sphingosine-1-phosphate; SMs, sphingomyelins; SsnB, sparstolonin B; TLR, Toll-like receptor.
References
- Bray, F.; Laversanne, M.; Sung, H.; Ferlay, J.; Siegel, R.L.; Soerjomataram, I.; Jemal, A. Global cancer statistics 2022: GLOBOCAN estimates of incidence and mortality worldwide for 36 cancers in 185 countries. CA Cancer J Clin. 2024, 74, 229–263. [Google Scholar] [CrossRef] [PubMed]
- Jakobušić Brala, C.; Karković Marković, A.; Kugić, A.; Torić, J.; Barbarić, M. Combination Chemotherapy with Selected Polyphenols in Preclinical and Clinical Studies-An Update Overview. Molecules. 2023, 28, 3746. [Google Scholar] [CrossRef] [PubMed] [PubMed Central]
- Mecca, M.; Sichetti, M.; Giuseffi, M.; Giglio, E.; Sabato, C.; Sanseverino, F.; Marino, G. Synergic Role of Dietary Bioactive Compounds in Breast Cancer Chemoprevention and Combination Therapies. Nutrients. 2024, 16, 1883. [Google Scholar] [CrossRef] [PubMed] [PubMed Central]
- Sharifi-Rad, J.; Seidel, V.; Izabela, M.; Monserrat-Mequida, M.; Sureda, A.; Ormazabal, V.; Zuniga, F.A.; Mangalpady, S.S.; Pezzani, R.; Ydyrys, A.; Tussupbekova, G.; Martorell, M.; Calina, D.; Cho, W.C. Phenolic compounds as Nrf2 inhibitors: potential applications in cancer therapy. Cell Commun Signal. 2023, 21, 89. [Google Scholar] [CrossRef] [PubMed] [PubMed Central]
- Peng, Z.; Li, H.; Gao, Y.; Sun, L.; Jiang, J.; Xia, B.; Huang, Y.; Zhang, Y.; Xia, Y.; Zhang, Y.; Shen, Y.; Huang, B.; Nie, J.; Chen, X.; Liu, X.; Feng, C.; Li, Z.; Zhang, W.; Tao, K.; Zhang, Q.; Duan, S.; Chen, Y.; Chen, Y.; Wang, W.; Zheng, H.; Lu, Y.; Liu, Y.; Wang, L.; Qi, W.; He, Y.; Tian, Y.; NUWA Platform Research Group; Li, G.; Ma, D.; Gao, Q. Sintilimab combined with bevacizumab in relapsed or persistent ovarian clear cell carcinoma (INOVA): a multicentre, single-arm, phase 2 trial. Lancet Oncol. 2024, 25, 1288–1297. [Google Scholar] [CrossRef] [PubMed]
- Kumar, A.; Fan, D.; Dipette, D.J.; Singh, U.S. Sparstolonin B, a novel plant derived compound, arrests cell cycle and induces apoptosis in N-myc amplified and N-myc nonamplified neuroblastoma cells. PLoS One. 2014, 9, e96343. [Google Scholar] [CrossRef] [PubMed]
- Yepuri, N.; Dhawan, R.; Cooney, M.; Pruekprasert, N.; Meng, Q.; Cooney, R.N. Sparstolonin B: A Unique Anti-Inflammatory Agent. Shock. 2019, 52, 568–576. [Google Scholar] [CrossRef] [PubMed]
- Tuorkey, M.J. Cancer Therapy with Phytochemicals: Present and Future Perspectives. Biomed Environ Sci. 2015, 28, 808–819. [Google Scholar] [CrossRef] [PubMed]
- Liang, Q.; Wu, Q.; Jiang, J.; Duan, J.; Wang, C.; Smith, M.D.; Lu, H.; Wang, Q.; Nagarkatti, P.; Fan, D. Characterization of sparstolonin B, a Chinese herb-derived compound, as a selective Toll-like receptor antagonist with potent anti-inflammatory properties. J Biol Chem. 2011, 286, 26470–26479. [Google Scholar] [CrossRef] [PubMed] [PubMed Central]
- Liu, S.; Hu, J.; Shi, C.; Sun, L.; Yan, W.; Song, Y. Sparstolonin B exerts beneficial effects on prostate cancer by acting on the reactive oxygen species-mediated PI3K/AKT pathway. J Cell Mol Med. 2021, 25, 5511–5524. [Google Scholar] [CrossRef] [PubMed] [PubMed Central]
- Karpeta, A.; Gregoraszczuk, E.Ł. Differences in the mechanisms of action of BDE-47 and its metabolites on OVCAR-3 and MCF-7 cell apoptosis. J Appl Toxicol. 2017, 37, 426–435. [Google Scholar] [CrossRef] [PubMed]
- Zhang, H.P.; Jiang, R.Y.; Zhu, J.Y.; Sun, K.N.; Huang, Y.; Zhou, H.H.; Zheng, Y.B.; Wang, X.J. PI3K/AKT/mTOR signaling pathway: an important driver and therapeutic target in triple-negative breast cancer. Breast Cancer. 2024, 31, 539–551. [Google Scholar] [CrossRef] [PubMed] [PubMed Central]
- Aziz, A.U.R.; Farid, S.; Qin, K.; Wang, H.; Liu, B. PIM Kinases and Their Relevance to the PI3K/AKT/mTOR Pathway in the Regulation of Ovarian Cancer. Biomolecules. 2018, 8, 7. [Google Scholar] [CrossRef] [PubMed] [PubMed Central]
- Raphael, J.; Desautels, D.; Pritchard, K.I.; Petkova, E.; Shah, P.S. Phosphoinositide 3-kinase inhibitors in advanced breast cancer: A systematic review and meta-analysis. Eur J Cancer. 2018, 91, 38–46. [Google Scholar] [CrossRef] [PubMed]
- Schubert, K.M.; Scheid, M.P.; Duronio, V. Ceramide inhibits protein kinase B/Akt by promoting dephosphorylation of serine 473. J Biol Chem. 2000, 275, 13330–13335. [Google Scholar] [CrossRef] [PubMed]
- Tian, J.M.; Ran, B.; Zhang, C.L.; Yan, D.M.; Li, X.H. Estrogen and progesterone promote breast cancer cell proliferation by inducing cyclin G1 expression. Braz J Med Biol Res. 2018, 51, 1–7. [Google Scholar] [CrossRef] [PubMed] [PubMed Central]
- Ma, L.; Liu, Y.; Geng, C.; Qi, X.; Jiang, J. Estrogen receptor β inhibits estradiol-induced proliferation and migration of MCF-7 cells through regulation of mitofusin 2. Int J Oncol. 2016, 42, 1993–2000. [Google Scholar] [CrossRef]
- Yu, X.; Zhang, X.; Dhakal, I.B.; Beggs, M.; Kadlubar, S.; Luo, D. Induction of cell proliferation and survival genes by estradiol-repressed microRNAs in breast cancer cells. BMC Cancer. 2012, 12, 29. [Google Scholar] [CrossRef] [PubMed] [PubMed Central]
- Wickramasinghe, N.S.; Manavalan, T.T.; Dougherty, S.M.; Riggs, K.A.; Li, Y.; Klinge, C.M. Estradiol downregulates miR-21 expression and increases miR-21 target gene expression in MCF-7 breast cancer cells. Nucleic Acids Res. 2009, 37, 2584–2595. [Google Scholar] [CrossRef] [PubMed] [PubMed Central]
- Paterni, I.; Granchi, C.; Katzenellenbogen, J.A.; Minutolo, F. Estrogen receptors alpha (ERα) and beta (ERβ): subtype-selective ligands and clinical potential. Steroids. 2014, 90, 13–29. [Google Scholar] [CrossRef] [PubMed] [PubMed Central]
- Klinge, C.M. Estrogen receptor interaction with co-activators and co-repressors. Steroids. 2000, 65, 227–251. [Google Scholar] [CrossRef] [PubMed]
- Shi, W.F.; Bartlett, J.S. Estrogen plays a critical role in AAV2-mediated gene transfer in ovarian cancer. Acta Pharmacol Sin. 2008, 29, 1440–1450. [Google Scholar] [CrossRef] [PubMed]
- Schüler-Toprak, S.; Moehle, C.; Skrzypczak, M.; Ortmann, O.; Treeck, O. Effect of estrogen receptor β agonists on proliferation and gene expression of ovarian cancer cells. BMC Cancer. 2017, 17, 319. [Google Scholar] [CrossRef] [PubMed] [PubMed Central]
- Bateman, H.R.; Liang, Q.; Fan, D.; Rodriguez, V.; Lessner, S.M. Sparstolonin B inhibits pro-angiogenic functions and blocks cell cycle progression in endothelial cells. PLoS One. 2013, 8, e70500. [Google Scholar] [CrossRef] [PubMed] [PubMed Central]
- Kim, N.; Kim, C.; Ryu, S.H.; Kim, G.O.; Bae, J.S. Anti-Inflammatory Effect of Sparstolonin B through Inhibiting Expression of NF-κB and STAT-1. Int J Mol Sci. 2022, 23, 10213. [Google Scholar] [CrossRef] [PubMed] [PubMed Central]
- Yang, H.; Wang, B.; Wang, T.; Xu, L.; He, C.; Wen, H.; Yan, J.; Su, H.; Zhu, X. Toll-like receptor 4 prompts human breast cancer cells invasiveness via lipopolysaccharide stimulation and is overexpressed in patients with lymph node metastasis. PLoS One. 2014, 9, e109980. [Google Scholar] [CrossRef] [PubMed] [PubMed Central]
- Lupi, L.A.; Cucielo, M.S.; Silveira, H.S.; Gaiotte, L.B.; Cesário, R.C.; Seiva, F.R.F.; de Almeida Chuffa, L.G. The role of Toll-like receptor 4 signaling pathway in ovarian, cervical, and endometrial cancers. Life Sci. 2020, 247, 117435. [Google Scholar] [CrossRef] [PubMed]
- Schilling, J.D.; Machkovech, H.M.; He, L.; Sidhu, R.; Fujiwara, H.; Weber, K.; Ory, D.S.; Schaffer, J.E. Palmitate and lipopolysaccharide trigger synergistic ceramide production in primary macrophages. J Biol Chem. 2013, 288, 2923–2932. [Google Scholar] [CrossRef] [PubMed] [PubMed Central]
- Sato, Y.; Goto, Y.; Narita, N.; Hoon, D.S. Cancer Cells Expressing Toll-like Receptors and the Tumor Microenvironment. Cancer Microenviron. 2009, 2 (Suppl 1), 205–214. [Google Scholar] [CrossRef] [PubMed]
- Onier, N.; Hilpert, S.; Arnould, L.; Saint-Giorgio, V.; Davies, J.G.; Jeannin, J.F.; Jeannin, J.F. Cure of colon cancer metastasis in rats with the new lipid A OM 174. Apoptosis of tumor cells and immunization of rats. Clin Exp Metastasis. 1999, 17, 299–306. [Google Scholar] [CrossRef] [PubMed]
- Garay, R.P.; Viens, P.; Bauer, J.; Normier, G.; Bardou, M.; Jeannin, J.F.; Chiavaroli, C. Cancer relapse under chemotherapy: why TLR2/4 receptor agonists can help. Eur J Pharmacol. 2007, 563, 1–17. [Google Scholar] [CrossRef] [PubMed]
- Zhang, Y.B.; He, F.L.; Fang, M.; Hua, T.F.; Hu, B.D.; Zhang, Z.H.; Cao, Q.; Liu, R.Y. Increased expression of Toll-like receptors 4 and 9 in human lung cancer. Mol Biol Rep. 2009, 36, 1475–1481. [Google Scholar] [CrossRef] [PubMed]
- Yoo, K.H.; Lim, T.J.; Chang, S.G. Monthly intravesical bacillus Calmette-Guérin maintenance therapy for non-muscle-invasive bladder cancer: 10-year experience in a single institute. Exp Ther Med. 2012, 3, 221–225. [Google Scholar] [CrossRef] [PubMed] [PubMed Central]
- Mai, C.W.; Kang, Y.B.; Pichika, M.R. Should a Toll-like receptor 4 (TLR-4) agonist or antagonist be designed to treat cancer? TLR-4: its expression and effects in the ten most common cancers. Onco Targets Ther. 2013, 6, 1573–1587. [Google Scholar] [CrossRef] [PubMed] [PubMed Central]
- Li, F.; Zhang, N. Ceramide: Therapeutic Potential in Combination Therapy for Cancer Treatment. Curr Drug Metab. 2015, 17, 37–51. [Google Scholar] [CrossRef] [PubMed]
- Ogretmen, B. Sphingolipid metabolism in cancer signalling and therapy. Nat Rev Cancer. 2018, 18, 33–50. [Google Scholar] [CrossRef] [PubMed] [PubMed Central]
- Yu, J.S.; Cui, W. Proliferation, survival and metabolism: the role of PI3K/AKT/mTOR signalling in pluripotency and cell fate determination. Development. 2016, 143, 3050–3060. [Google Scholar] [CrossRef] [PubMed]
- Sharma, V.R.; Gupta, G.K.; Sharma, A.K.; Batra, N.; Sharma, D.K.; Joshi, A.; Sharma, A.K. PI3K/Akt/mTOR Intracellular Pathway and Breast Cancer: Factors, Mechanism and Regulation. Curr Pharm Des. 2017, 23, 1633–1638. [Google Scholar] [CrossRef] [PubMed]
- Mabuchi, S.; Kuroda, H.; Takahashi, R.; Sasano, T. The PI3K/AKT/mTOR pathway as a therapeutic target in ovarian cancer. Gynecol Oncol. 2015, 137, 173–179. [Google Scholar] [CrossRef] [PubMed]
- Yu, L.; Wei, J.; Liu, P. Attacking the PI3K/Akt/mTOR signaling pathway for targeted therapeutic treatment in human cancer. Semin Cancer Biol. 2022, 85, 69–94. [Google Scholar] [CrossRef] [PubMed]
- Afify, S.M.; Oo, A.K.K.; Hassan, G.; Seno, A.; Seno, M. How can we turn the PI3K/AKT/mTOR pathway down? Insights into inhibition and treatment of cancer. Expert Rev Anticancer Ther. 2021, 21, 605–619. [Google Scholar] [CrossRef] [PubMed]
- Lyu, Y.; Duan, B.; Liu, Z.; Yang, F.; Chen, C.; Jiang, X.; Liu, X. Sparstolonin B inhibits pancreatic adenocarcinoma through the NF-κB signaling pathway. Exp Cell Res. 2022, 417, 113214. [Google Scholar] [CrossRef] [PubMed]
- Aslan, M. Polyunsaturated fatty acid and sphingolipid measurements by tandem mass spectrometry. Mini-Reviews in Organic Chemistry, 2021, 18, 3–10. [Google Scholar] [CrossRef]
Figure 1.
(A) Evaluation of cell viability by MTT analysis for 16-48 hours in MCF-7 cells. Cells treated with estradiol hemihydrate (ES, 1, 10 and 100 nM) and DMSO, dimethyl sulfoxide (1μ/ml). Data are representative of 7-8 separate measurements and values are given as mean ± SD. Statistical analysis was performed by two-way ANOVA and differences between groups were determined by Tukey’s multiple comparison test. *, p<0.05, when compared with the control group at the same time periods. #, p<0.05, when compared with all other groups at the same time period. §, p<0.05, when compared with 16 and 24 hours within the same dose. (B) Evaluation of cell viability by MTT analysis for 16-48 hours in OVCAR-3 cells. Data are representative of 6-8 separate measurements and values are given as mean ± SD. Statistical analysis was performed by two-way ANOVA and differences between groups were determined by Tukey’s multiple comparison test. *, p<0.05, when compared with the control and DMSO group at the same time period. #, p<0.05, when compared with the control group at the same time period. §, p<0.05, when compared with 24 and 48 hours within the same dose. C) Evaluation of cell viability in BJ cells by MTT analysis for 16-48 hours. Data are representative of 6 separate measurements and values are given as mean ± SD. Statistical analysis was performed by two-way ANOVA. Differences between groups were determined by Tukey’s multiple comparison test. *, p<0.05, when compared with all other groups at the same time periods. §, p<0.05, when compared with 16 hours within the same dose. D) Light microscope image (10X magnification) of ES-applied MCF-7, OVCAR-3 and BJ cells after 48 hours. While no change was observed in the control and DMSO (1μl/ml) groups, a significant proliferation was observed in MCF-7 and OVCAR-3 cells compared to the control as a result of 10 and 100 nM ES application. It was observed that 100 nM ES application for 48 hours caused deterioration in morphology, shrinkage, clustering and toxicity in BJ cells.
Figure 1.
(A) Evaluation of cell viability by MTT analysis for 16-48 hours in MCF-7 cells. Cells treated with estradiol hemihydrate (ES, 1, 10 and 100 nM) and DMSO, dimethyl sulfoxide (1μ/ml). Data are representative of 7-8 separate measurements and values are given as mean ± SD. Statistical analysis was performed by two-way ANOVA and differences between groups were determined by Tukey’s multiple comparison test. *, p<0.05, when compared with the control group at the same time periods. #, p<0.05, when compared with all other groups at the same time period. §, p<0.05, when compared with 16 and 24 hours within the same dose. (B) Evaluation of cell viability by MTT analysis for 16-48 hours in OVCAR-3 cells. Data are representative of 6-8 separate measurements and values are given as mean ± SD. Statistical analysis was performed by two-way ANOVA and differences between groups were determined by Tukey’s multiple comparison test. *, p<0.05, when compared with the control and DMSO group at the same time period. #, p<0.05, when compared with the control group at the same time period. §, p<0.05, when compared with 24 and 48 hours within the same dose. C) Evaluation of cell viability in BJ cells by MTT analysis for 16-48 hours. Data are representative of 6 separate measurements and values are given as mean ± SD. Statistical analysis was performed by two-way ANOVA. Differences between groups were determined by Tukey’s multiple comparison test. *, p<0.05, when compared with all other groups at the same time periods. §, p<0.05, when compared with 16 hours within the same dose. D) Light microscope image (10X magnification) of ES-applied MCF-7, OVCAR-3 and BJ cells after 48 hours. While no change was observed in the control and DMSO (1μl/ml) groups, a significant proliferation was observed in MCF-7 and OVCAR-3 cells compared to the control as a result of 10 and 100 nM ES application. It was observed that 100 nM ES application for 48 hours caused deterioration in morphology, shrinkage, clustering and toxicity in BJ cells.
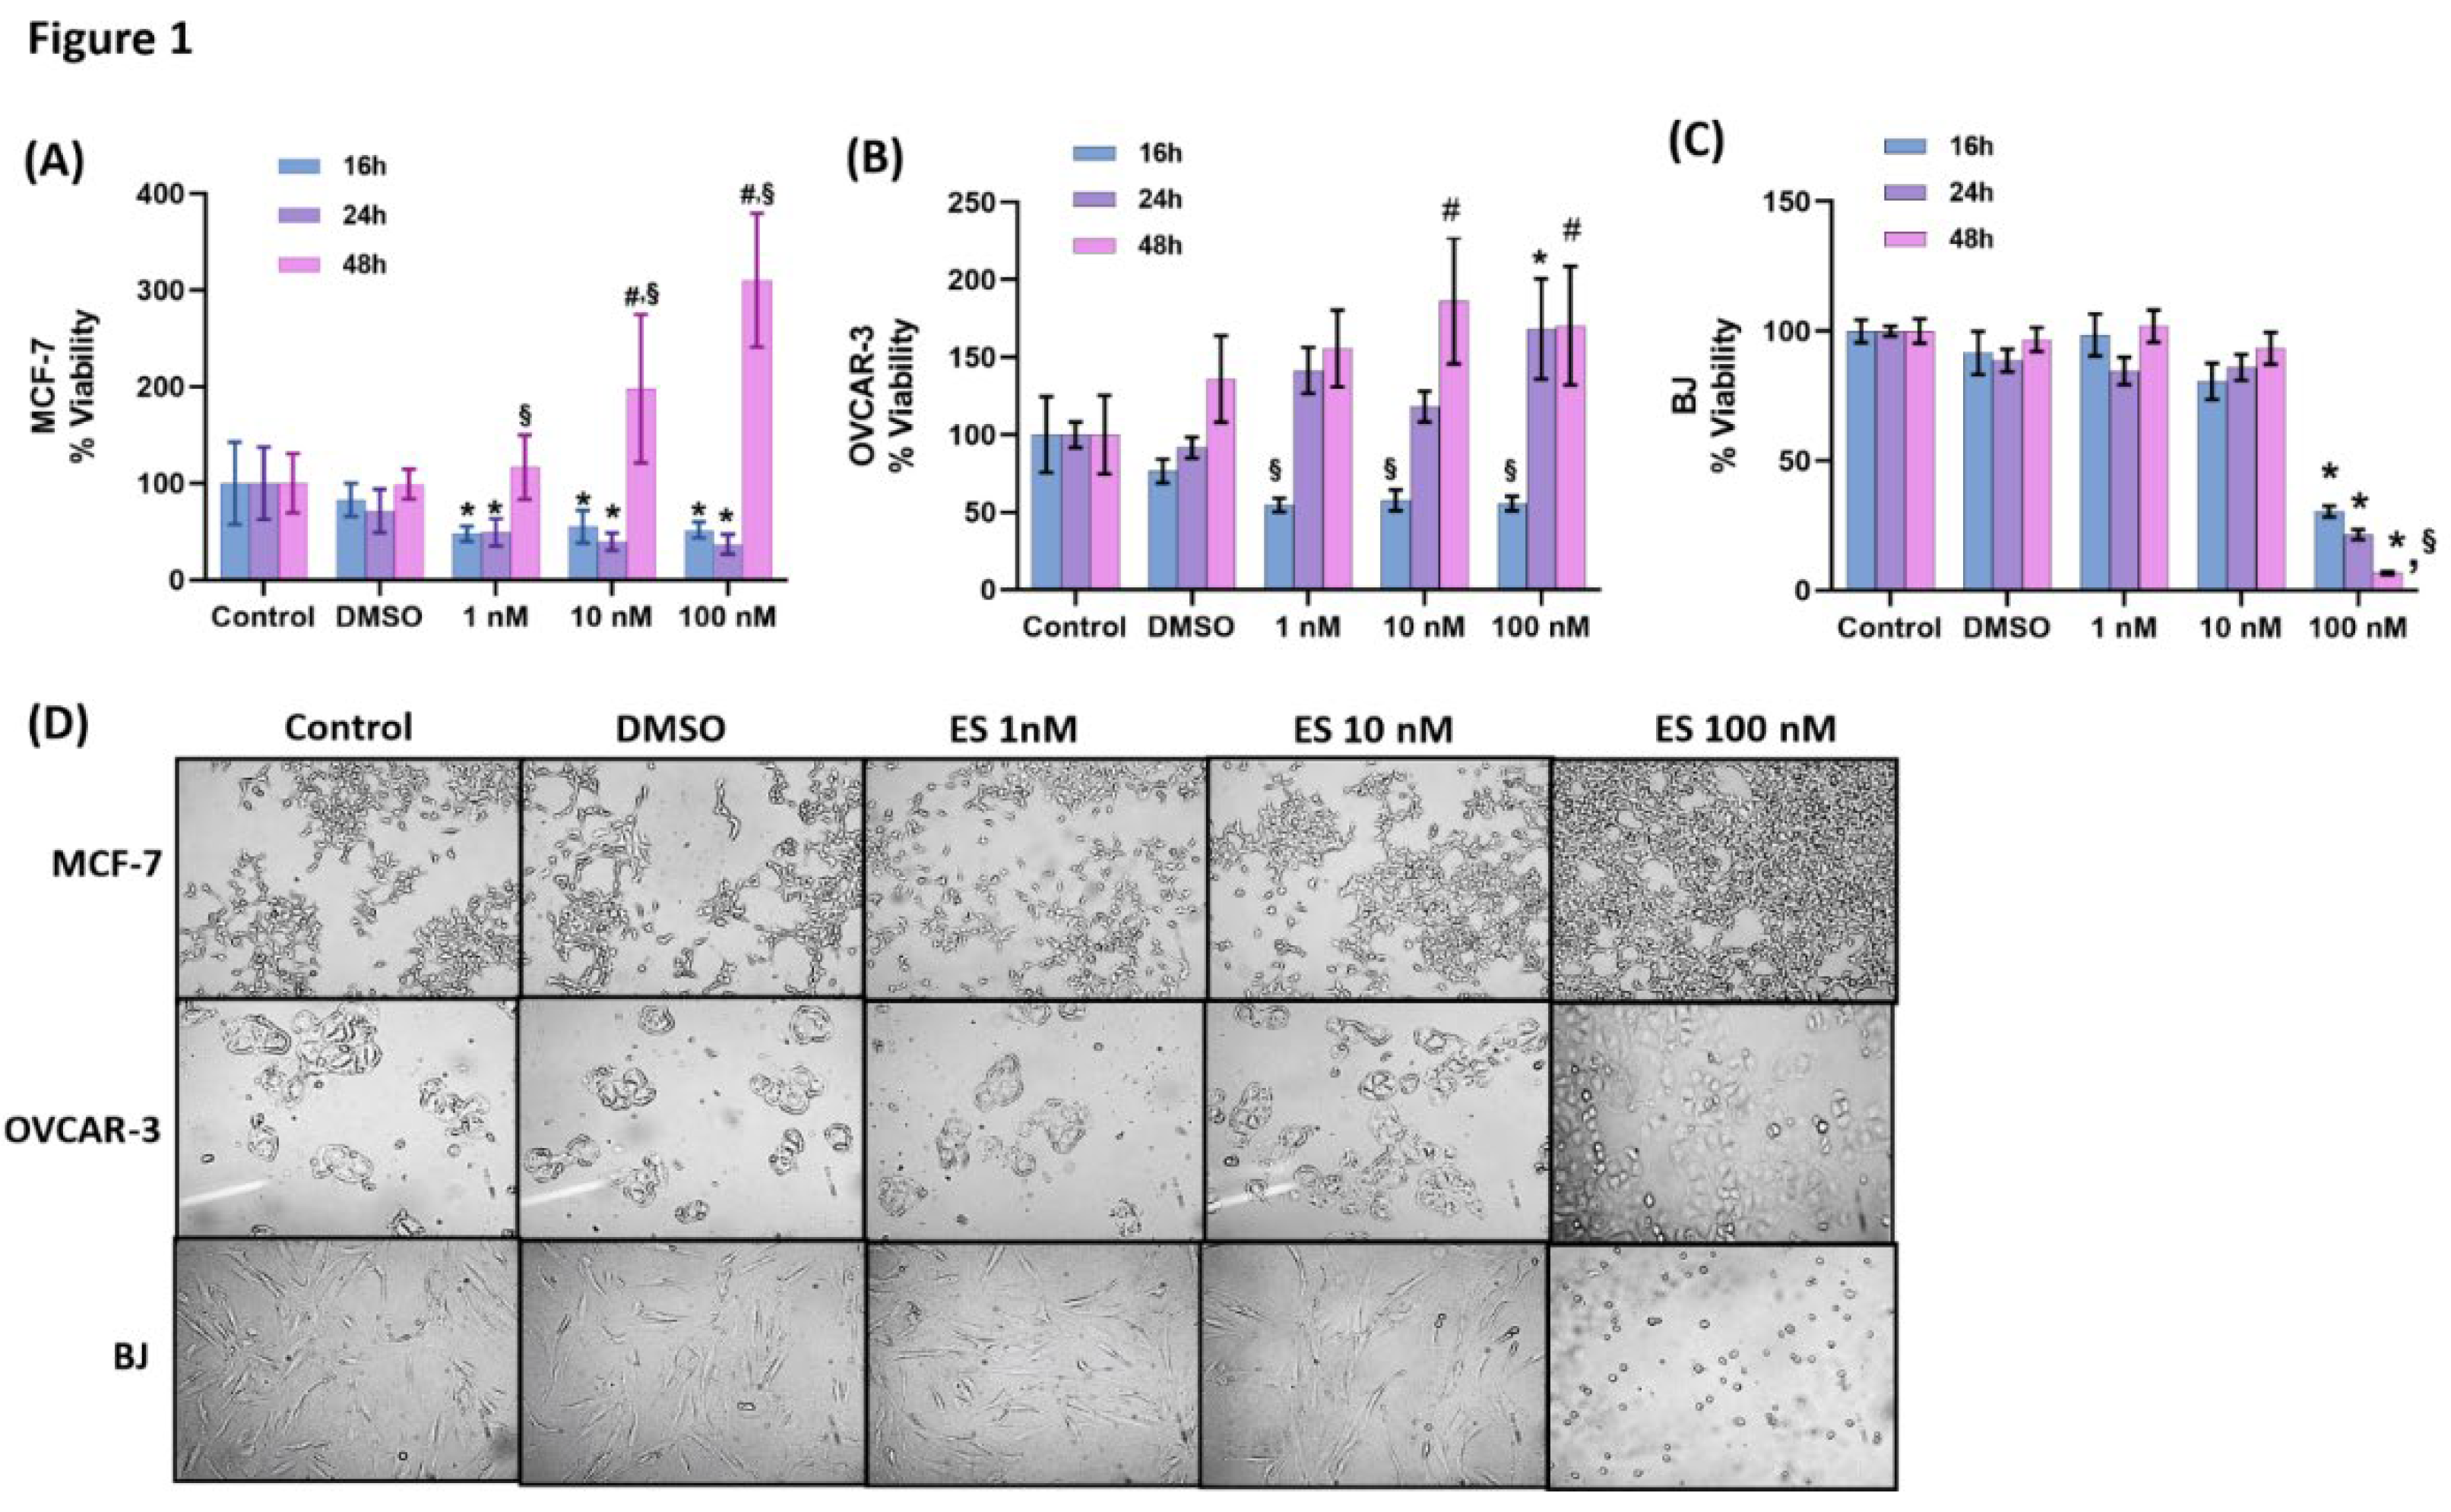
Figure 2.
(A) The effect of sparstolonin B(SsnB) on MCF-7 cell viability. Cell viability analysis was performed for 16-48 hours. Cells treated with DMSO, dimethyl sulfoxide (1μl/ml), cells treated with SsnB. Data are representative of 6-8 separate experiments and values are given as mean ± SD. Statistical analysis was performed by two-way ANOVA and differences between groups were determined by Tukey’s multiple comparison test. *, p<0.05, compared to control, DMSO, 3,125-12,5 µM groups within the same time periods. #, p<0.05, compared to 25 µM group within the same time periods. §, p<0,05 when compared to 24 and 48 hours within the same dose. (B) The effect of SsnB on OVCAR-3 cell viability. Data are representative of 7 separate experiments and values are given as mean ± SD. Statistical analysis was performed by two-way ANOVA and differences between groups were determined by Tukey’s multiple comparison test. *, p<0.001, vs. DMSO and control in all incubation periods. #, p<0.001, compared to 3,125-25 µM groups within the same time periods. ¶, p<0.05 vs. 3,125 and 6,25 µM groups within the same period. (C) Effect of SsnB on BJ cell viability. Data are representative of 7-8 separate experiments and values are given as mean ± SD. Statistical analysis was performed by two-way ANOVA and differences between groups were determined by Tukey’s multiple comparison test. *, p<0.05, vs. all groups in the same time periods. (D) Effect of 24h SsnB treatment on cell viability in MCF-7 cells during 48h ES proliferation. Data are representative of 8 separate experiments and values are given as mean ± SD. Cells treated with DMSO (1μ/ml), estradiol hemihydrate (ES, 10 nM) and SsnB (25 μM). Incubation with SsnB started 24 h after ES treatment and was continued for 24 h. Statistical analysis was performed by one-way ANOVA and differences between groups were determined by Holm-Sidak’s multiple comparison test. *, p<0.0001, when compared to all groups. #, p<0.0001, compared with control, DMSO and ES 10 nM group. (E) Effect of 24h SsnB treatment on cell viability in OVCAR-3 cells during 48h ES proliferation. Data are representative of 8 separate experiments and values are given as mean ± SD. Statistical analysis was performed by one-way ANOVA and differences between groups were determined by Holm-Sidak multiple comparison test. *, p<0.05, compared with all groups. #, p<0.05, compared with control, DMSO and ES 10 nM group. (F) Light microscope image (10X magnification) of MCF-7 and OVCAR-3 cells after 48 hours of ES (10 nM) application. Incubation with SsnB started 24 h after ES treatment and was continued for 24 h. Significant proliferation was observed in MCF-7 and OVCAR-3 cells compared to the control as a result of 10 nM ES application. SsnB application significantly decreased cell proliferation and caused significant changes in cell morphology in MCF-7 and OVCAR-3 cells compared to the control and ES groups. ES+SP application was observed to cause deterioration in morphology, shrinkage, clustering and toxicity in MCF-7 and OVCAR-3 cells.
Figure 2.
(A) The effect of sparstolonin B(SsnB) on MCF-7 cell viability. Cell viability analysis was performed for 16-48 hours. Cells treated with DMSO, dimethyl sulfoxide (1μl/ml), cells treated with SsnB. Data are representative of 6-8 separate experiments and values are given as mean ± SD. Statistical analysis was performed by two-way ANOVA and differences between groups were determined by Tukey’s multiple comparison test. *, p<0.05, compared to control, DMSO, 3,125-12,5 µM groups within the same time periods. #, p<0.05, compared to 25 µM group within the same time periods. §, p<0,05 when compared to 24 and 48 hours within the same dose. (B) The effect of SsnB on OVCAR-3 cell viability. Data are representative of 7 separate experiments and values are given as mean ± SD. Statistical analysis was performed by two-way ANOVA and differences between groups were determined by Tukey’s multiple comparison test. *, p<0.001, vs. DMSO and control in all incubation periods. #, p<0.001, compared to 3,125-25 µM groups within the same time periods. ¶, p<0.05 vs. 3,125 and 6,25 µM groups within the same period. (C) Effect of SsnB on BJ cell viability. Data are representative of 7-8 separate experiments and values are given as mean ± SD. Statistical analysis was performed by two-way ANOVA and differences between groups were determined by Tukey’s multiple comparison test. *, p<0.05, vs. all groups in the same time periods. (D) Effect of 24h SsnB treatment on cell viability in MCF-7 cells during 48h ES proliferation. Data are representative of 8 separate experiments and values are given as mean ± SD. Cells treated with DMSO (1μ/ml), estradiol hemihydrate (ES, 10 nM) and SsnB (25 μM). Incubation with SsnB started 24 h after ES treatment and was continued for 24 h. Statistical analysis was performed by one-way ANOVA and differences between groups were determined by Holm-Sidak’s multiple comparison test. *, p<0.0001, when compared to all groups. #, p<0.0001, compared with control, DMSO and ES 10 nM group. (E) Effect of 24h SsnB treatment on cell viability in OVCAR-3 cells during 48h ES proliferation. Data are representative of 8 separate experiments and values are given as mean ± SD. Statistical analysis was performed by one-way ANOVA and differences between groups were determined by Holm-Sidak multiple comparison test. *, p<0.05, compared with all groups. #, p<0.05, compared with control, DMSO and ES 10 nM group. (F) Light microscope image (10X magnification) of MCF-7 and OVCAR-3 cells after 48 hours of ES (10 nM) application. Incubation with SsnB started 24 h after ES treatment and was continued for 24 h. Significant proliferation was observed in MCF-7 and OVCAR-3 cells compared to the control as a result of 10 nM ES application. SsnB application significantly decreased cell proliferation and caused significant changes in cell morphology in MCF-7 and OVCAR-3 cells compared to the control and ES groups. ES+SP application was observed to cause deterioration in morphology, shrinkage, clustering and toxicity in MCF-7 and OVCAR-3 cells.
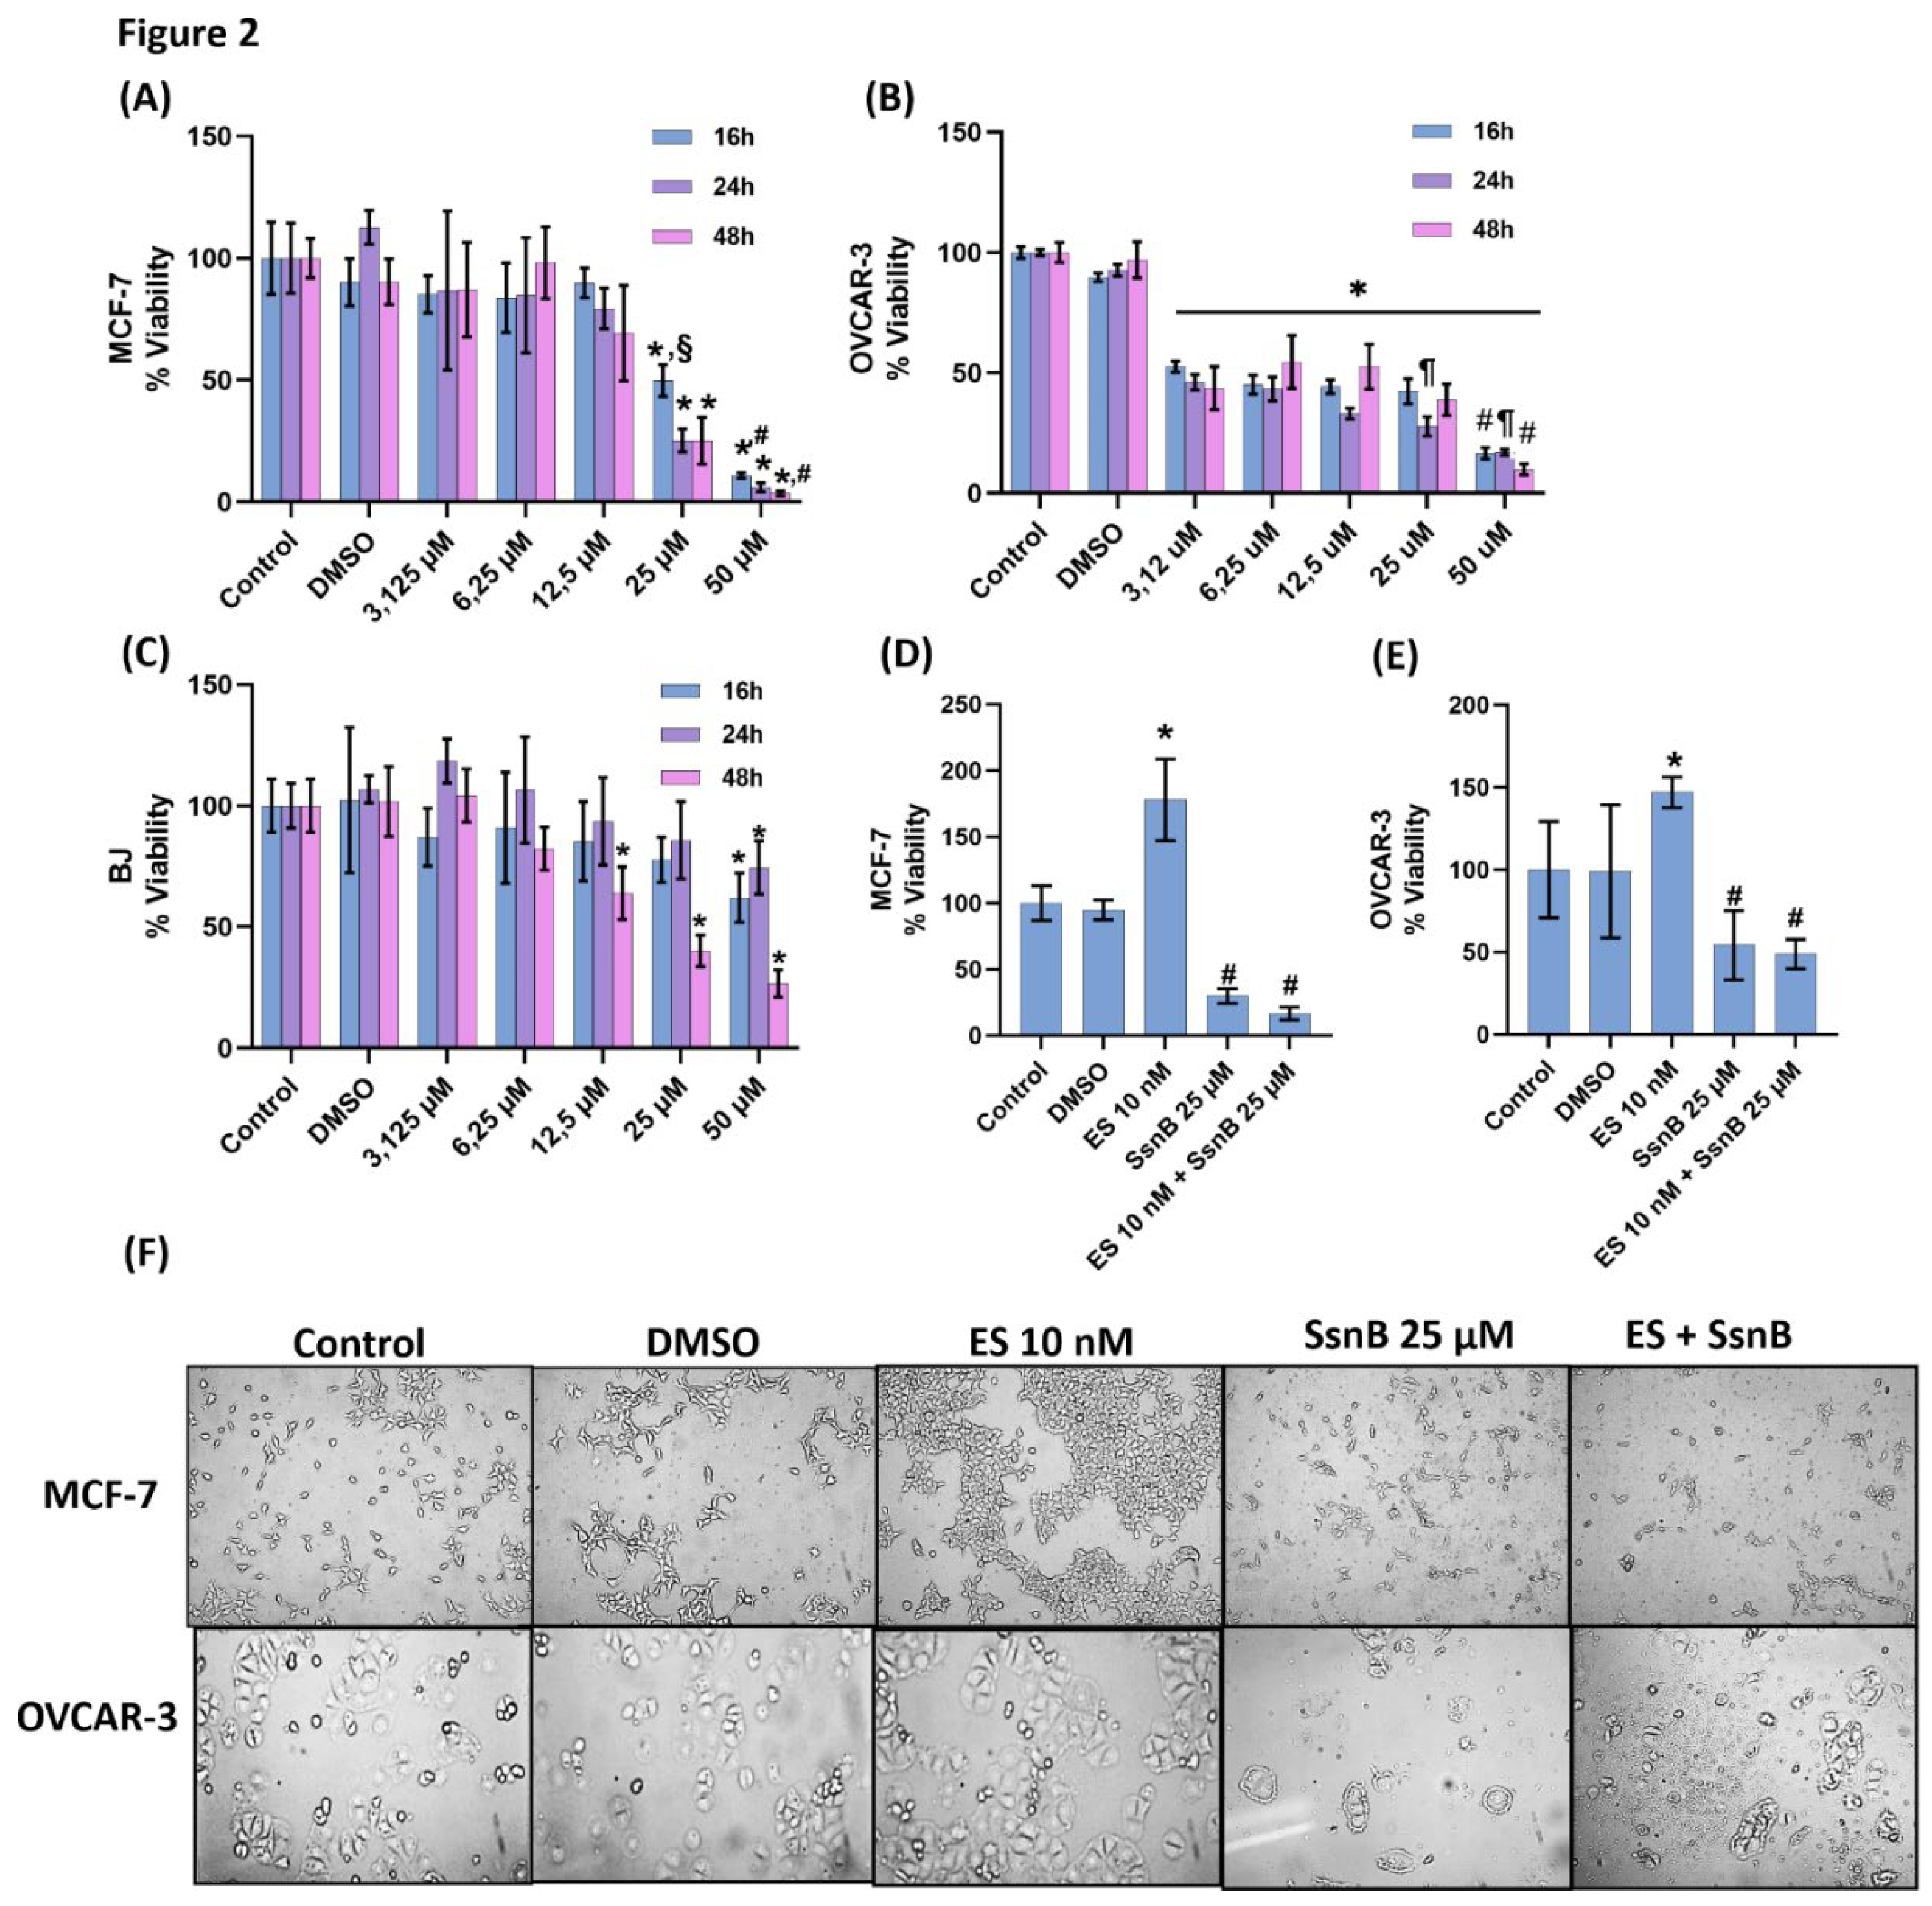
Figure 3.
(A) Representative immunofluorescent staining of proliferating cell nuclear antigen (PCNA) in MCF-7 and OVCAR-3 cells treated with either DMSO (1μ/ml), ES (10 nM) and SsnB (25 μM). 10 X magnification. Incubation with SsnB started 24 h after ES treatment and was continued for 24 h in the ES +SsnB group. (B) Quantitation of PCNA fluorescence staining in MCF-7 cells by ImageJ software. Data shown are representative of 10 separate measurements and values are given as mean ± SD. Statistical analysis was performed by one way ANOVA and differences between groups were determined by Tukey multiple comparisons analysis. *, p < 0.0001, vs. control and DMSO groups. #, p < 0.005, vs. control, DMSO and ES 10 nM groups. ¶, p <0.001 vs. ES +SsnB group. (C) Quantitation of PCNA fluorescence staining in OVCAR-3 cells by ImageJ software. Data shown are representative of 10 separate measurements and values are given as mean ± SD. Statistical analysis was performed by one way ANOVA and differences between groups were determined by Tukey multiple comparisons analysis. *, p < 0.0001, vs. control and DMSO groups. #, p < 0.05, vs. control, DMSO and ES 10 nM groups. ¶, p <0.001 vs. ES +SsnB group. (D) PCNA protein levels in MCF-7 cells. Data shown are representative of 10 separate measurements and values are given as mean ± SD. Statistical analysis was performed by one way ANOVA and differences between groups were determined by Tukey multiple comparisons analysis. *, p < 0.0001, vs. control and DMSO groups. #, p < 0.0001, vs. control, DMSO and ES 10 nM groups. (E) PCNA protein levels in OVCAR-3 cells. Data shown are representative of 10 separate measurements and values are given as mean ± SD. Statistical analysis was performed by one way ANOVA and differences between groups were determined by Tukey multiple comparisons analysis. *, p < 0.0001, vs. control and DMSO groups. #, p < 0.0001, vs. control, DMSO and ES 10 nM groups. ¶, p <0.05 vs. ES +SsnB group. (F) Representative immunofluorescent staining of TUNEL staining in MCF-7 and OVCAR-3 cells. (G) Quantitation of TUNEL staining in MCF-7 cells with the ImageJ program. Values mean ± SD (n=10). Statistical analysis was performed by one way ANOVA and differences between groups were determined by Tukey multiple comparisons analysis. *, p < 0.001, vs. control, DMSO and ES 10 nM groups. #, p < 0.001, vs. ES +SsnB. (H) Quantitation of TUNEL staining in OVCAR-3 cells with ImageJ program. Values are mean ± SD (n=10). One-way ANOVA and Tukey multiple comparisons were used to determine statistical significance. *, p < 0.0001, vs. control, DMSO and ES 10 nM groups. #, p < 0.05, vs. ES +SsnB.
Figure 3.
(A) Representative immunofluorescent staining of proliferating cell nuclear antigen (PCNA) in MCF-7 and OVCAR-3 cells treated with either DMSO (1μ/ml), ES (10 nM) and SsnB (25 μM). 10 X magnification. Incubation with SsnB started 24 h after ES treatment and was continued for 24 h in the ES +SsnB group. (B) Quantitation of PCNA fluorescence staining in MCF-7 cells by ImageJ software. Data shown are representative of 10 separate measurements and values are given as mean ± SD. Statistical analysis was performed by one way ANOVA and differences between groups were determined by Tukey multiple comparisons analysis. *, p < 0.0001, vs. control and DMSO groups. #, p < 0.005, vs. control, DMSO and ES 10 nM groups. ¶, p <0.001 vs. ES +SsnB group. (C) Quantitation of PCNA fluorescence staining in OVCAR-3 cells by ImageJ software. Data shown are representative of 10 separate measurements and values are given as mean ± SD. Statistical analysis was performed by one way ANOVA and differences between groups were determined by Tukey multiple comparisons analysis. *, p < 0.0001, vs. control and DMSO groups. #, p < 0.05, vs. control, DMSO and ES 10 nM groups. ¶, p <0.001 vs. ES +SsnB group. (D) PCNA protein levels in MCF-7 cells. Data shown are representative of 10 separate measurements and values are given as mean ± SD. Statistical analysis was performed by one way ANOVA and differences between groups were determined by Tukey multiple comparisons analysis. *, p < 0.0001, vs. control and DMSO groups. #, p < 0.0001, vs. control, DMSO and ES 10 nM groups. (E) PCNA protein levels in OVCAR-3 cells. Data shown are representative of 10 separate measurements and values are given as mean ± SD. Statistical analysis was performed by one way ANOVA and differences between groups were determined by Tukey multiple comparisons analysis. *, p < 0.0001, vs. control and DMSO groups. #, p < 0.0001, vs. control, DMSO and ES 10 nM groups. ¶, p <0.05 vs. ES +SsnB group. (F) Representative immunofluorescent staining of TUNEL staining in MCF-7 and OVCAR-3 cells. (G) Quantitation of TUNEL staining in MCF-7 cells with the ImageJ program. Values mean ± SD (n=10). Statistical analysis was performed by one way ANOVA and differences between groups were determined by Tukey multiple comparisons analysis. *, p < 0.001, vs. control, DMSO and ES 10 nM groups. #, p < 0.001, vs. ES +SsnB. (H) Quantitation of TUNEL staining in OVCAR-3 cells with ImageJ program. Values are mean ± SD (n=10). One-way ANOVA and Tukey multiple comparisons were used to determine statistical significance. *, p < 0.0001, vs. control, DMSO and ES 10 nM groups. #, p < 0.05, vs. ES +SsnB.
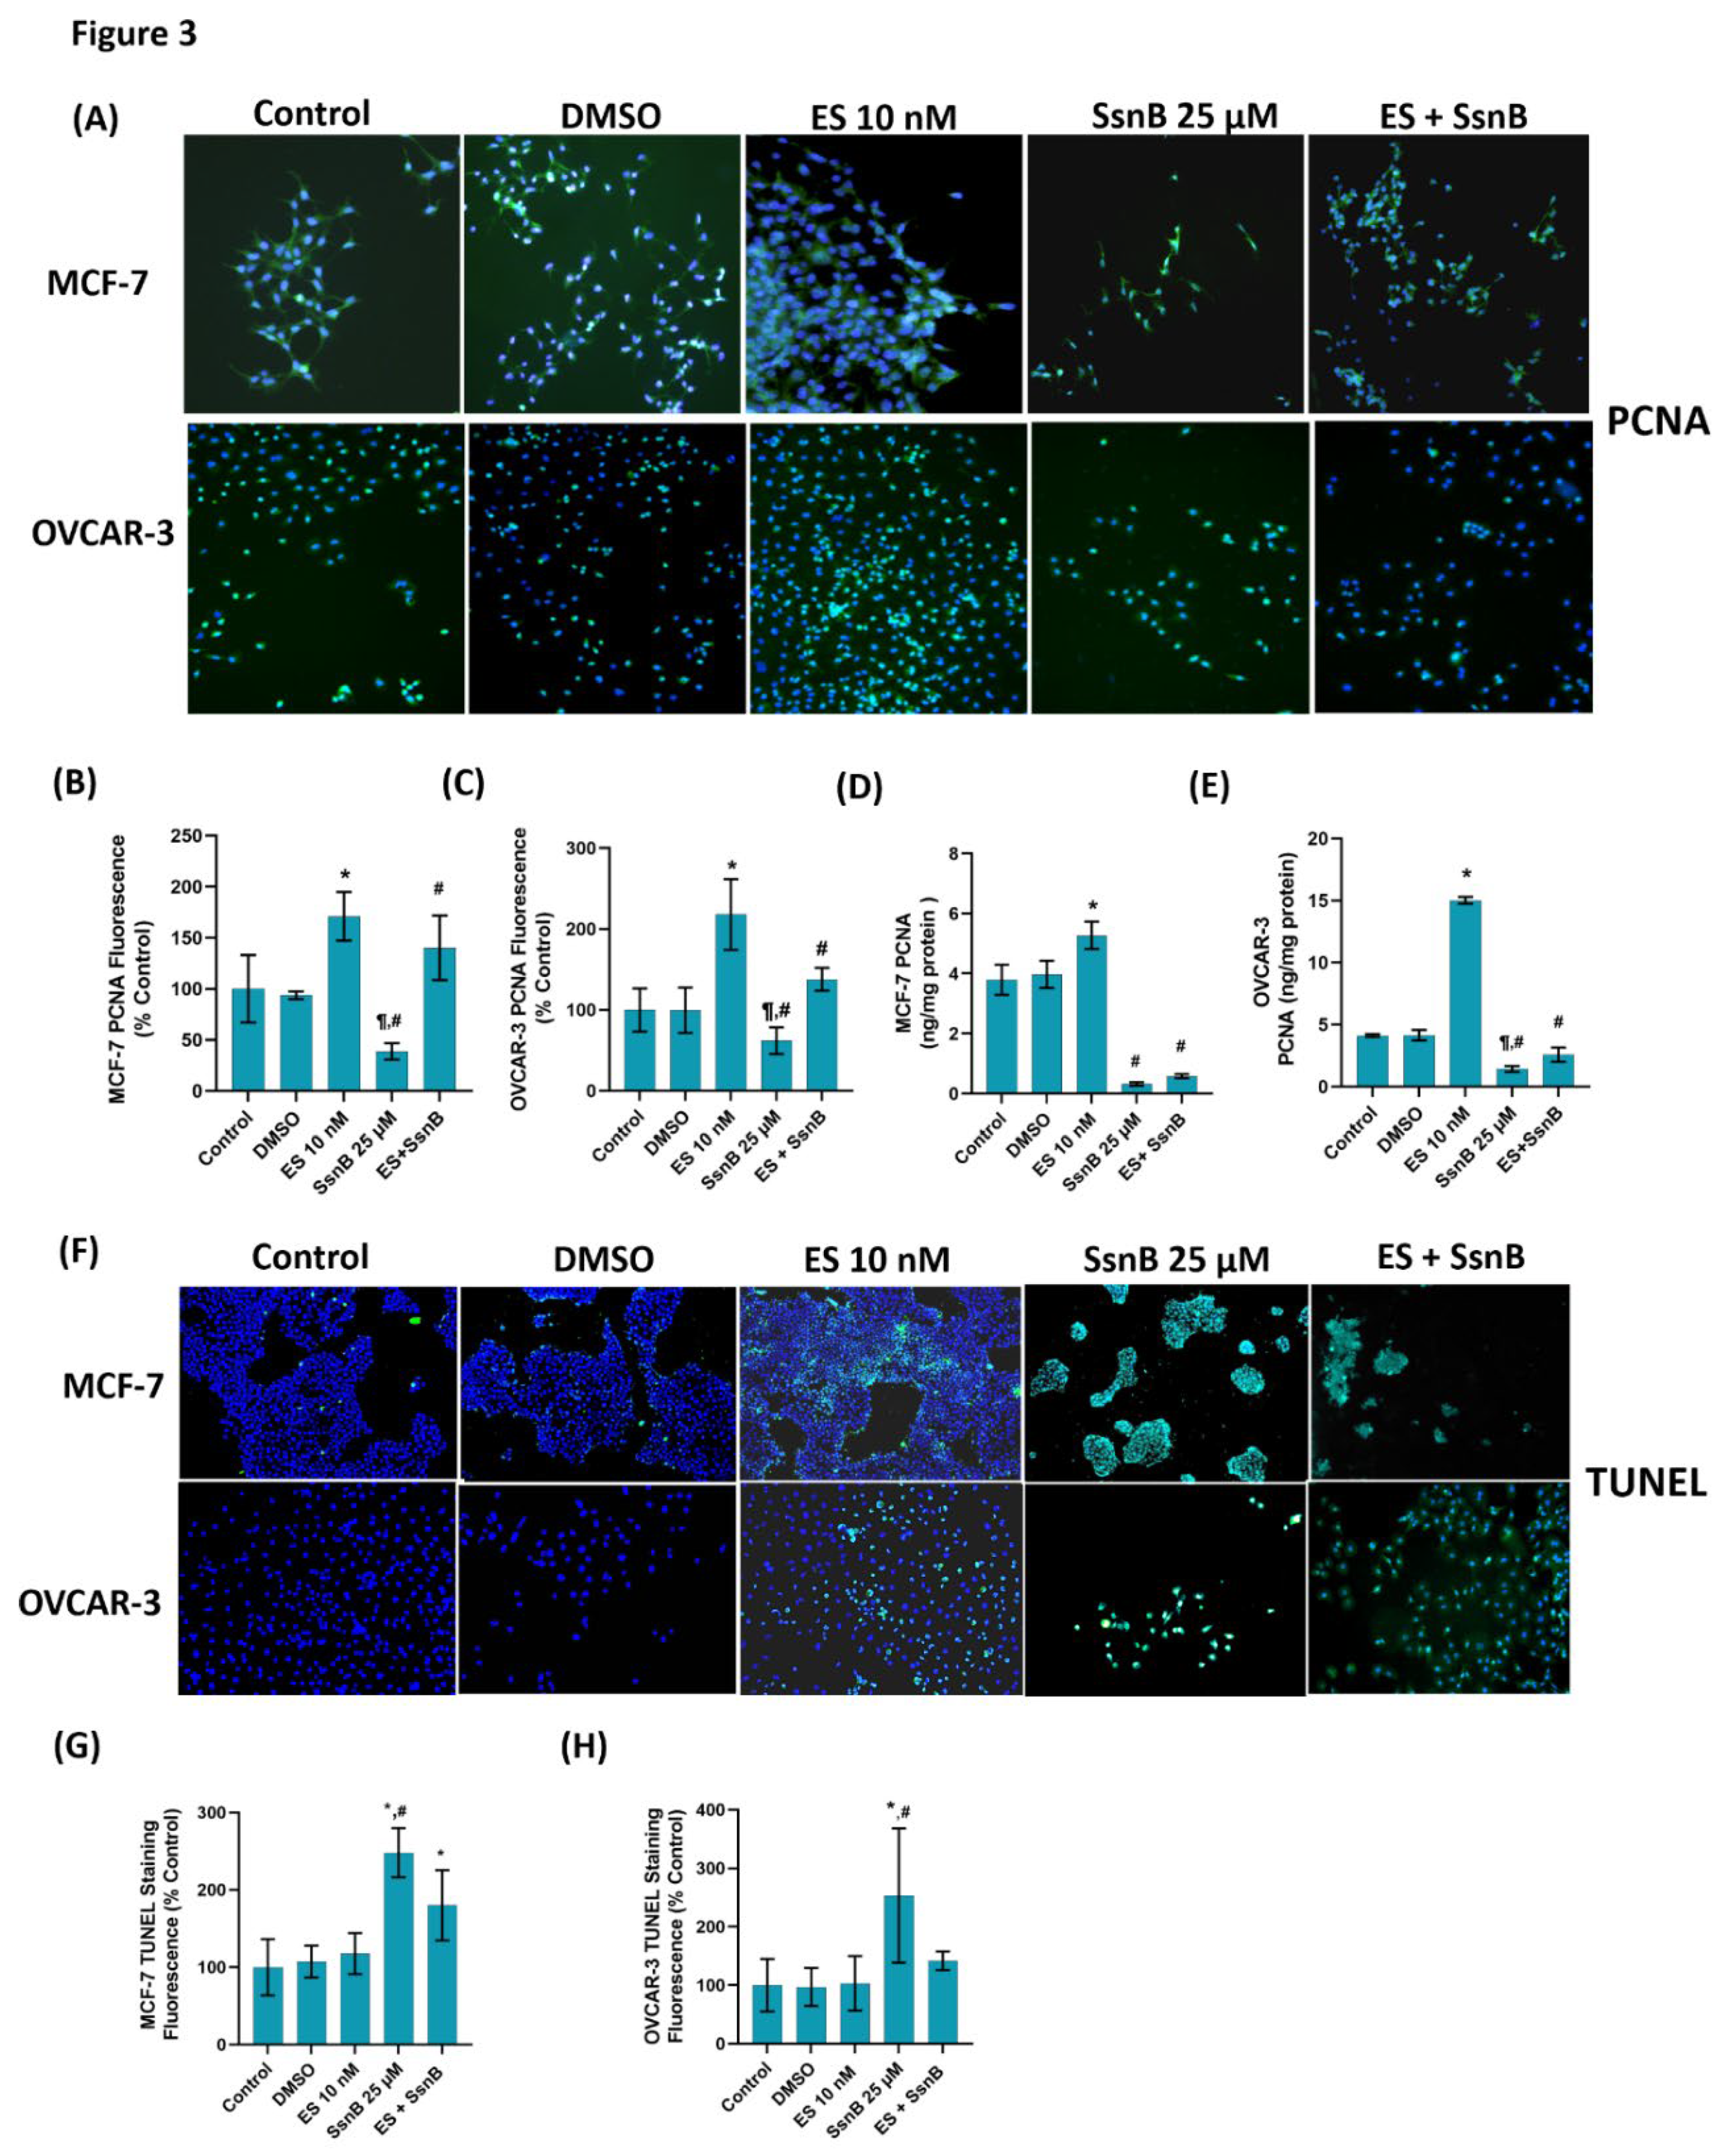
Figure 4.
(A) Representative immunofluorescent staining of phosphatidylinositol 3-kinase (PI3K), phospho (Ser473) protein kinase Akt (p-AKT) and phospho (Ser2448) mammalian target of rapamycin (p-mTOR) in MCF-7 cells treated with either DMSO (1μ/ml), ES (10 nM) and SsnB (25 μM). 10 X magnification. Incubation with SsnB started 24 h after ES treatment and was continued for 24 h in the ES + SsnB group. (B) Quantitation of PI3K fluorescence staining in MCF-7 cells by ImageJ software. Data shown are representative of 9-10 separate measurements and values are given as mean ± SD. Statistical analysis was performed by one way ANOVA and differences between groups were determined by Tukey multiple comparisons analysis. *, p < 0.0001, vs. all groups. #, p < 0.05, vs. all groups. (C) Quantitation of p-AKT fluorescence staining in MCF-7 cells by ImageJ software. Data shown are representative of 9-10 separate measurements and values are given as mean ± SD. Statistical analysis was performed by one way ANOVA and differences between groups were determined by Tukey multiple comparisons analysis. *, p < 0.0001, vs. all groups. **, p< 0.05 vs. all groups. #, p < 0.05, vs. all groups. (D) Quantitation of p-mTOR fluorescence staining in MCF-7 cells by ImageJ software. Data shown are representative of 10 separate measurements and values are given as mean ± SD. Statistical analysis was performed by one way ANOVA and differences between groups were determined by Tukey multiple comparisons analysis. *, p < 0.0001, vs. all groups. #, p < 0.001, vs. all groups. (E) PI3K protein levels in MCF-7 cells. Data shown are representative of 7 separate measurements and values are given as mean ± SD. Statistical analysis was performed by one way ANOVA and differences between groups were determined by Tukey multiple comparisons analysis. *, p < 0.05, vs. all groups. #, p < 0.05, vs. control and DMSO. (F) p-AKT protein levels in MCF-7 cells. Data shown are representative of 7 separate measurements and values are given as mean ± SD. Statistical analysis was performed by one way ANOVA and differences between groups were determined by Tukey multiple comparisons analysis. *, p < 0.05, vs. all groups. #, p <0.001 vs. control, DMSO and ES 10 nM. (G) p-mTOR protein levels in MCF-7 cells. Data shown are representative of 7 separate measurements and values are given as mean ± SD. Statistical analysis was performed by one way ANOVA and differences between groups were determined by Tukey multiple comparisons analysis. *, p < 0.05, vs. all groups.
Figure 4.
(A) Representative immunofluorescent staining of phosphatidylinositol 3-kinase (PI3K), phospho (Ser473) protein kinase Akt (p-AKT) and phospho (Ser2448) mammalian target of rapamycin (p-mTOR) in MCF-7 cells treated with either DMSO (1μ/ml), ES (10 nM) and SsnB (25 μM). 10 X magnification. Incubation with SsnB started 24 h after ES treatment and was continued for 24 h in the ES + SsnB group. (B) Quantitation of PI3K fluorescence staining in MCF-7 cells by ImageJ software. Data shown are representative of 9-10 separate measurements and values are given as mean ± SD. Statistical analysis was performed by one way ANOVA and differences between groups were determined by Tukey multiple comparisons analysis. *, p < 0.0001, vs. all groups. #, p < 0.05, vs. all groups. (C) Quantitation of p-AKT fluorescence staining in MCF-7 cells by ImageJ software. Data shown are representative of 9-10 separate measurements and values are given as mean ± SD. Statistical analysis was performed by one way ANOVA and differences between groups were determined by Tukey multiple comparisons analysis. *, p < 0.0001, vs. all groups. **, p< 0.05 vs. all groups. #, p < 0.05, vs. all groups. (D) Quantitation of p-mTOR fluorescence staining in MCF-7 cells by ImageJ software. Data shown are representative of 10 separate measurements and values are given as mean ± SD. Statistical analysis was performed by one way ANOVA and differences between groups were determined by Tukey multiple comparisons analysis. *, p < 0.0001, vs. all groups. #, p < 0.001, vs. all groups. (E) PI3K protein levels in MCF-7 cells. Data shown are representative of 7 separate measurements and values are given as mean ± SD. Statistical analysis was performed by one way ANOVA and differences between groups were determined by Tukey multiple comparisons analysis. *, p < 0.05, vs. all groups. #, p < 0.05, vs. control and DMSO. (F) p-AKT protein levels in MCF-7 cells. Data shown are representative of 7 separate measurements and values are given as mean ± SD. Statistical analysis was performed by one way ANOVA and differences between groups were determined by Tukey multiple comparisons analysis. *, p < 0.05, vs. all groups. #, p <0.001 vs. control, DMSO and ES 10 nM. (G) p-mTOR protein levels in MCF-7 cells. Data shown are representative of 7 separate measurements and values are given as mean ± SD. Statistical analysis was performed by one way ANOVA and differences between groups were determined by Tukey multiple comparisons analysis. *, p < 0.05, vs. all groups.
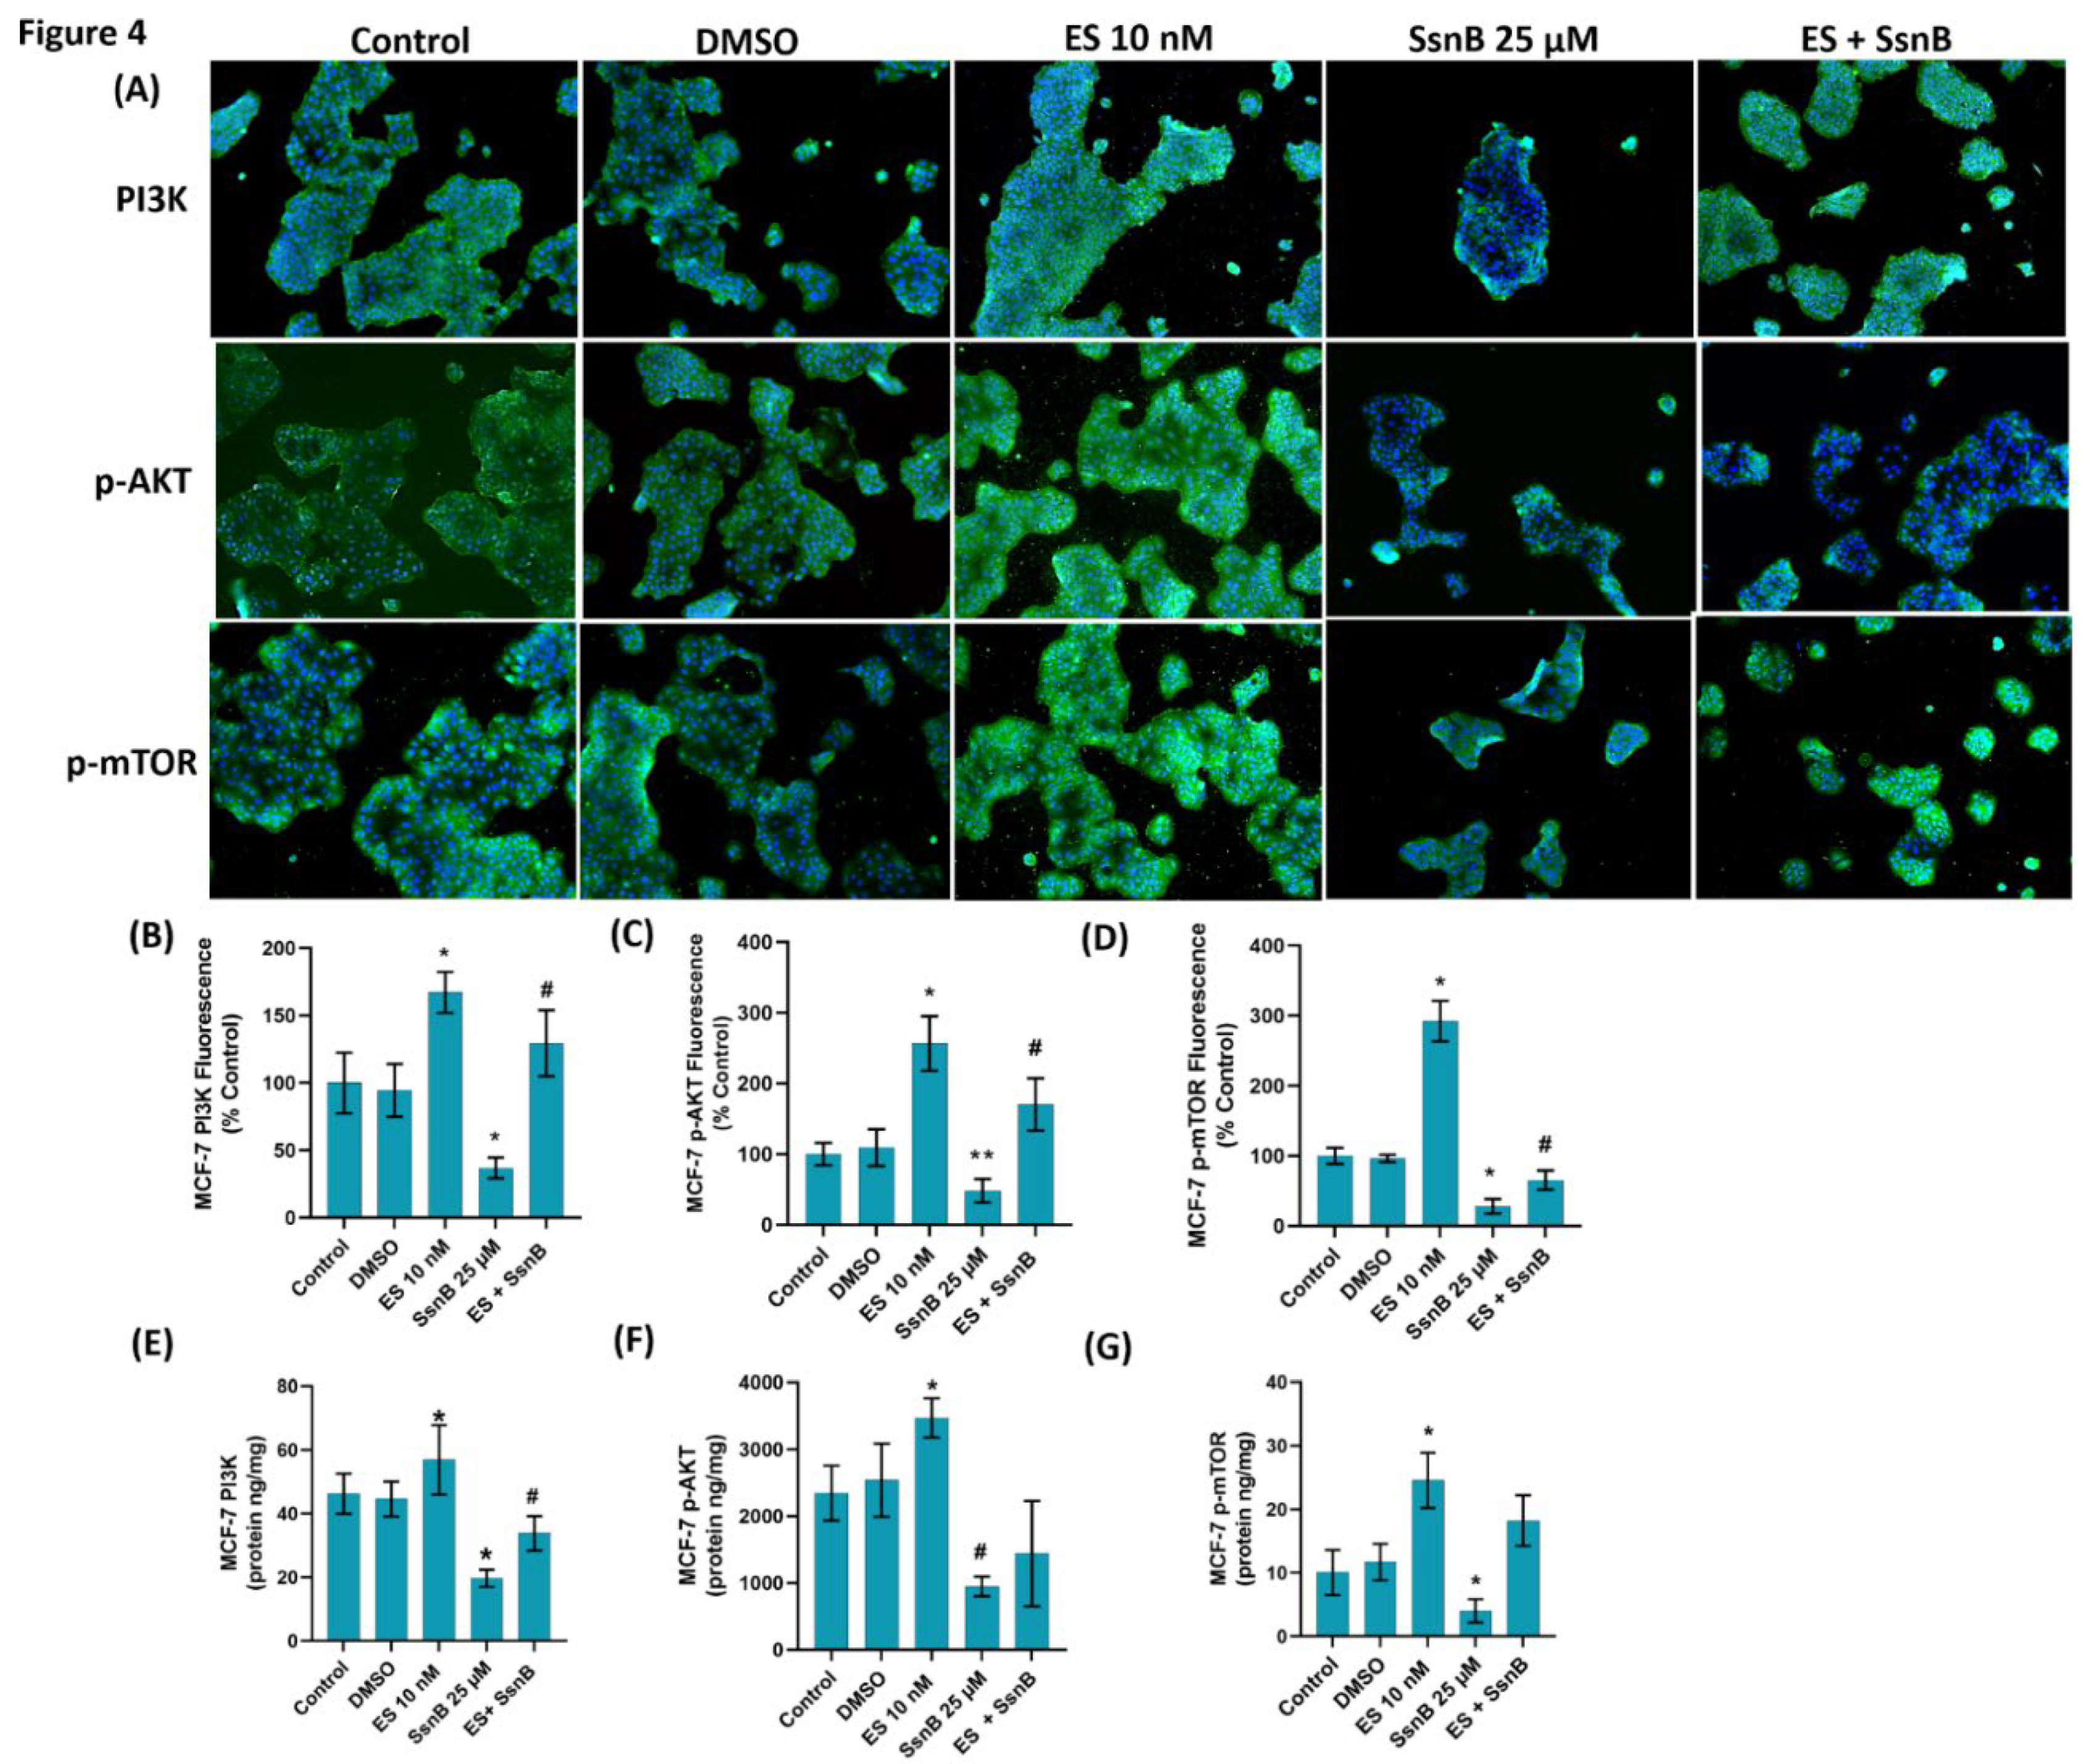
Figure 5.
(A) Representative immunofluorescent staining of phosphatidylinositol 3-kinase (PI3K), phospho (Ser473) protein kinase Akt (p-AKT) and phospho (Ser2448) mammalian target of rapamycin (p-mTOR) in OVCAR-3 cells treated with either DMSO (1μ/ml), ES (10 nM) and SsnB (25 μM). 10 X magnification. Incubation with SsnB started 24 h after ES treatment and was continued for 24 h in the ES + SsnB group. (B) Quantitation of PI3K fluorescence staining in OVCAR-3 cells by ImageJ software. Data shown are representative of 10 separate measurements and values are given as mean ± SD. Statistical analysis was performed by one way ANOVA and differences between groups were determined by Tukey multiple comparisons analysis. *, p < 0.001, vs. all groups.**, p < 0.05, vs. control and DMSO. #, p < 0.05, vs. all groups. (C) Quantitation of p-AKT fluorescence staining in OVCAR-3 cells by ImageJ software. Data shown are representative of 10 separate measurements and values are given as mean ± SD. Statistical analysis was performed by one way ANOVA and differences between groups were determined by Tukey multiple comparisons analysis. *, p < 0.0001, vs. all groups. **, p< 0.05 vs. control and DMSO. #, p < 0.001, vs. all groups. (D) Quantitation of p-mTOR fluorescence staining in OVCAR-3 cells by ImageJ software. Data shown are representative of 10 separate measurements and values are given as mean ± SD. Statistical analysis was performed by one way ANOVA and differences between groups were determined by Tukey multiple comparisons analysis. *, p < 0.0001, vs. all groups.**, p < 0.05, vs. control and DMSO #, p < 0.05, vs. all groups. (E) PI3K protein levels in OVCAR-3 cells. Data shown are representative of 7 separate measurements and values are given as mean ± SD. Statistical analysis was performed by one way ANOVA and differences between groups were determined by Tukey multiple comparisons analysis. *, p < 0.05, vs. all groups. #, p < 0.05, vs. control and DMSO. (F) p-AKT protein levels in OVCAR-3 cells. Data shown are representative of 7 separate measurements and values are given as mean ± SD. Statistical analysis was performed by one way ANOVA and differences between groups were determined by Tukey multiple comparisons analysis. *, p < 0.0001, vs. all groups. **, p<0.05 vs. all groups. #, p <0.001 vs. control and DMSO. (G) p-mTOR protein levels in OVCAR-3 cells. Data shown are representative of 7 separate measurements and values are given as mean ± SD. Statistical analysis was performed by one way ANOVA and differences between groups were determined by Tukey multiple comparisons analysis. *, p < 0.001, vs. all groups. **, p<0.05 vs. all groups. #, p <0.001 vs. control and DMSO.
Figure 5.
(A) Representative immunofluorescent staining of phosphatidylinositol 3-kinase (PI3K), phospho (Ser473) protein kinase Akt (p-AKT) and phospho (Ser2448) mammalian target of rapamycin (p-mTOR) in OVCAR-3 cells treated with either DMSO (1μ/ml), ES (10 nM) and SsnB (25 μM). 10 X magnification. Incubation with SsnB started 24 h after ES treatment and was continued for 24 h in the ES + SsnB group. (B) Quantitation of PI3K fluorescence staining in OVCAR-3 cells by ImageJ software. Data shown are representative of 10 separate measurements and values are given as mean ± SD. Statistical analysis was performed by one way ANOVA and differences between groups were determined by Tukey multiple comparisons analysis. *, p < 0.001, vs. all groups.**, p < 0.05, vs. control and DMSO. #, p < 0.05, vs. all groups. (C) Quantitation of p-AKT fluorescence staining in OVCAR-3 cells by ImageJ software. Data shown are representative of 10 separate measurements and values are given as mean ± SD. Statistical analysis was performed by one way ANOVA and differences between groups were determined by Tukey multiple comparisons analysis. *, p < 0.0001, vs. all groups. **, p< 0.05 vs. control and DMSO. #, p < 0.001, vs. all groups. (D) Quantitation of p-mTOR fluorescence staining in OVCAR-3 cells by ImageJ software. Data shown are representative of 10 separate measurements and values are given as mean ± SD. Statistical analysis was performed by one way ANOVA and differences between groups were determined by Tukey multiple comparisons analysis. *, p < 0.0001, vs. all groups.**, p < 0.05, vs. control and DMSO #, p < 0.05, vs. all groups. (E) PI3K protein levels in OVCAR-3 cells. Data shown are representative of 7 separate measurements and values are given as mean ± SD. Statistical analysis was performed by one way ANOVA and differences between groups were determined by Tukey multiple comparisons analysis. *, p < 0.05, vs. all groups. #, p < 0.05, vs. control and DMSO. (F) p-AKT protein levels in OVCAR-3 cells. Data shown are representative of 7 separate measurements and values are given as mean ± SD. Statistical analysis was performed by one way ANOVA and differences between groups were determined by Tukey multiple comparisons analysis. *, p < 0.0001, vs. all groups. **, p<0.05 vs. all groups. #, p <0.001 vs. control and DMSO. (G) p-mTOR protein levels in OVCAR-3 cells. Data shown are representative of 7 separate measurements and values are given as mean ± SD. Statistical analysis was performed by one way ANOVA and differences between groups were determined by Tukey multiple comparisons analysis. *, p < 0.001, vs. all groups. **, p<0.05 vs. all groups. #, p <0.001 vs. control and DMSO.
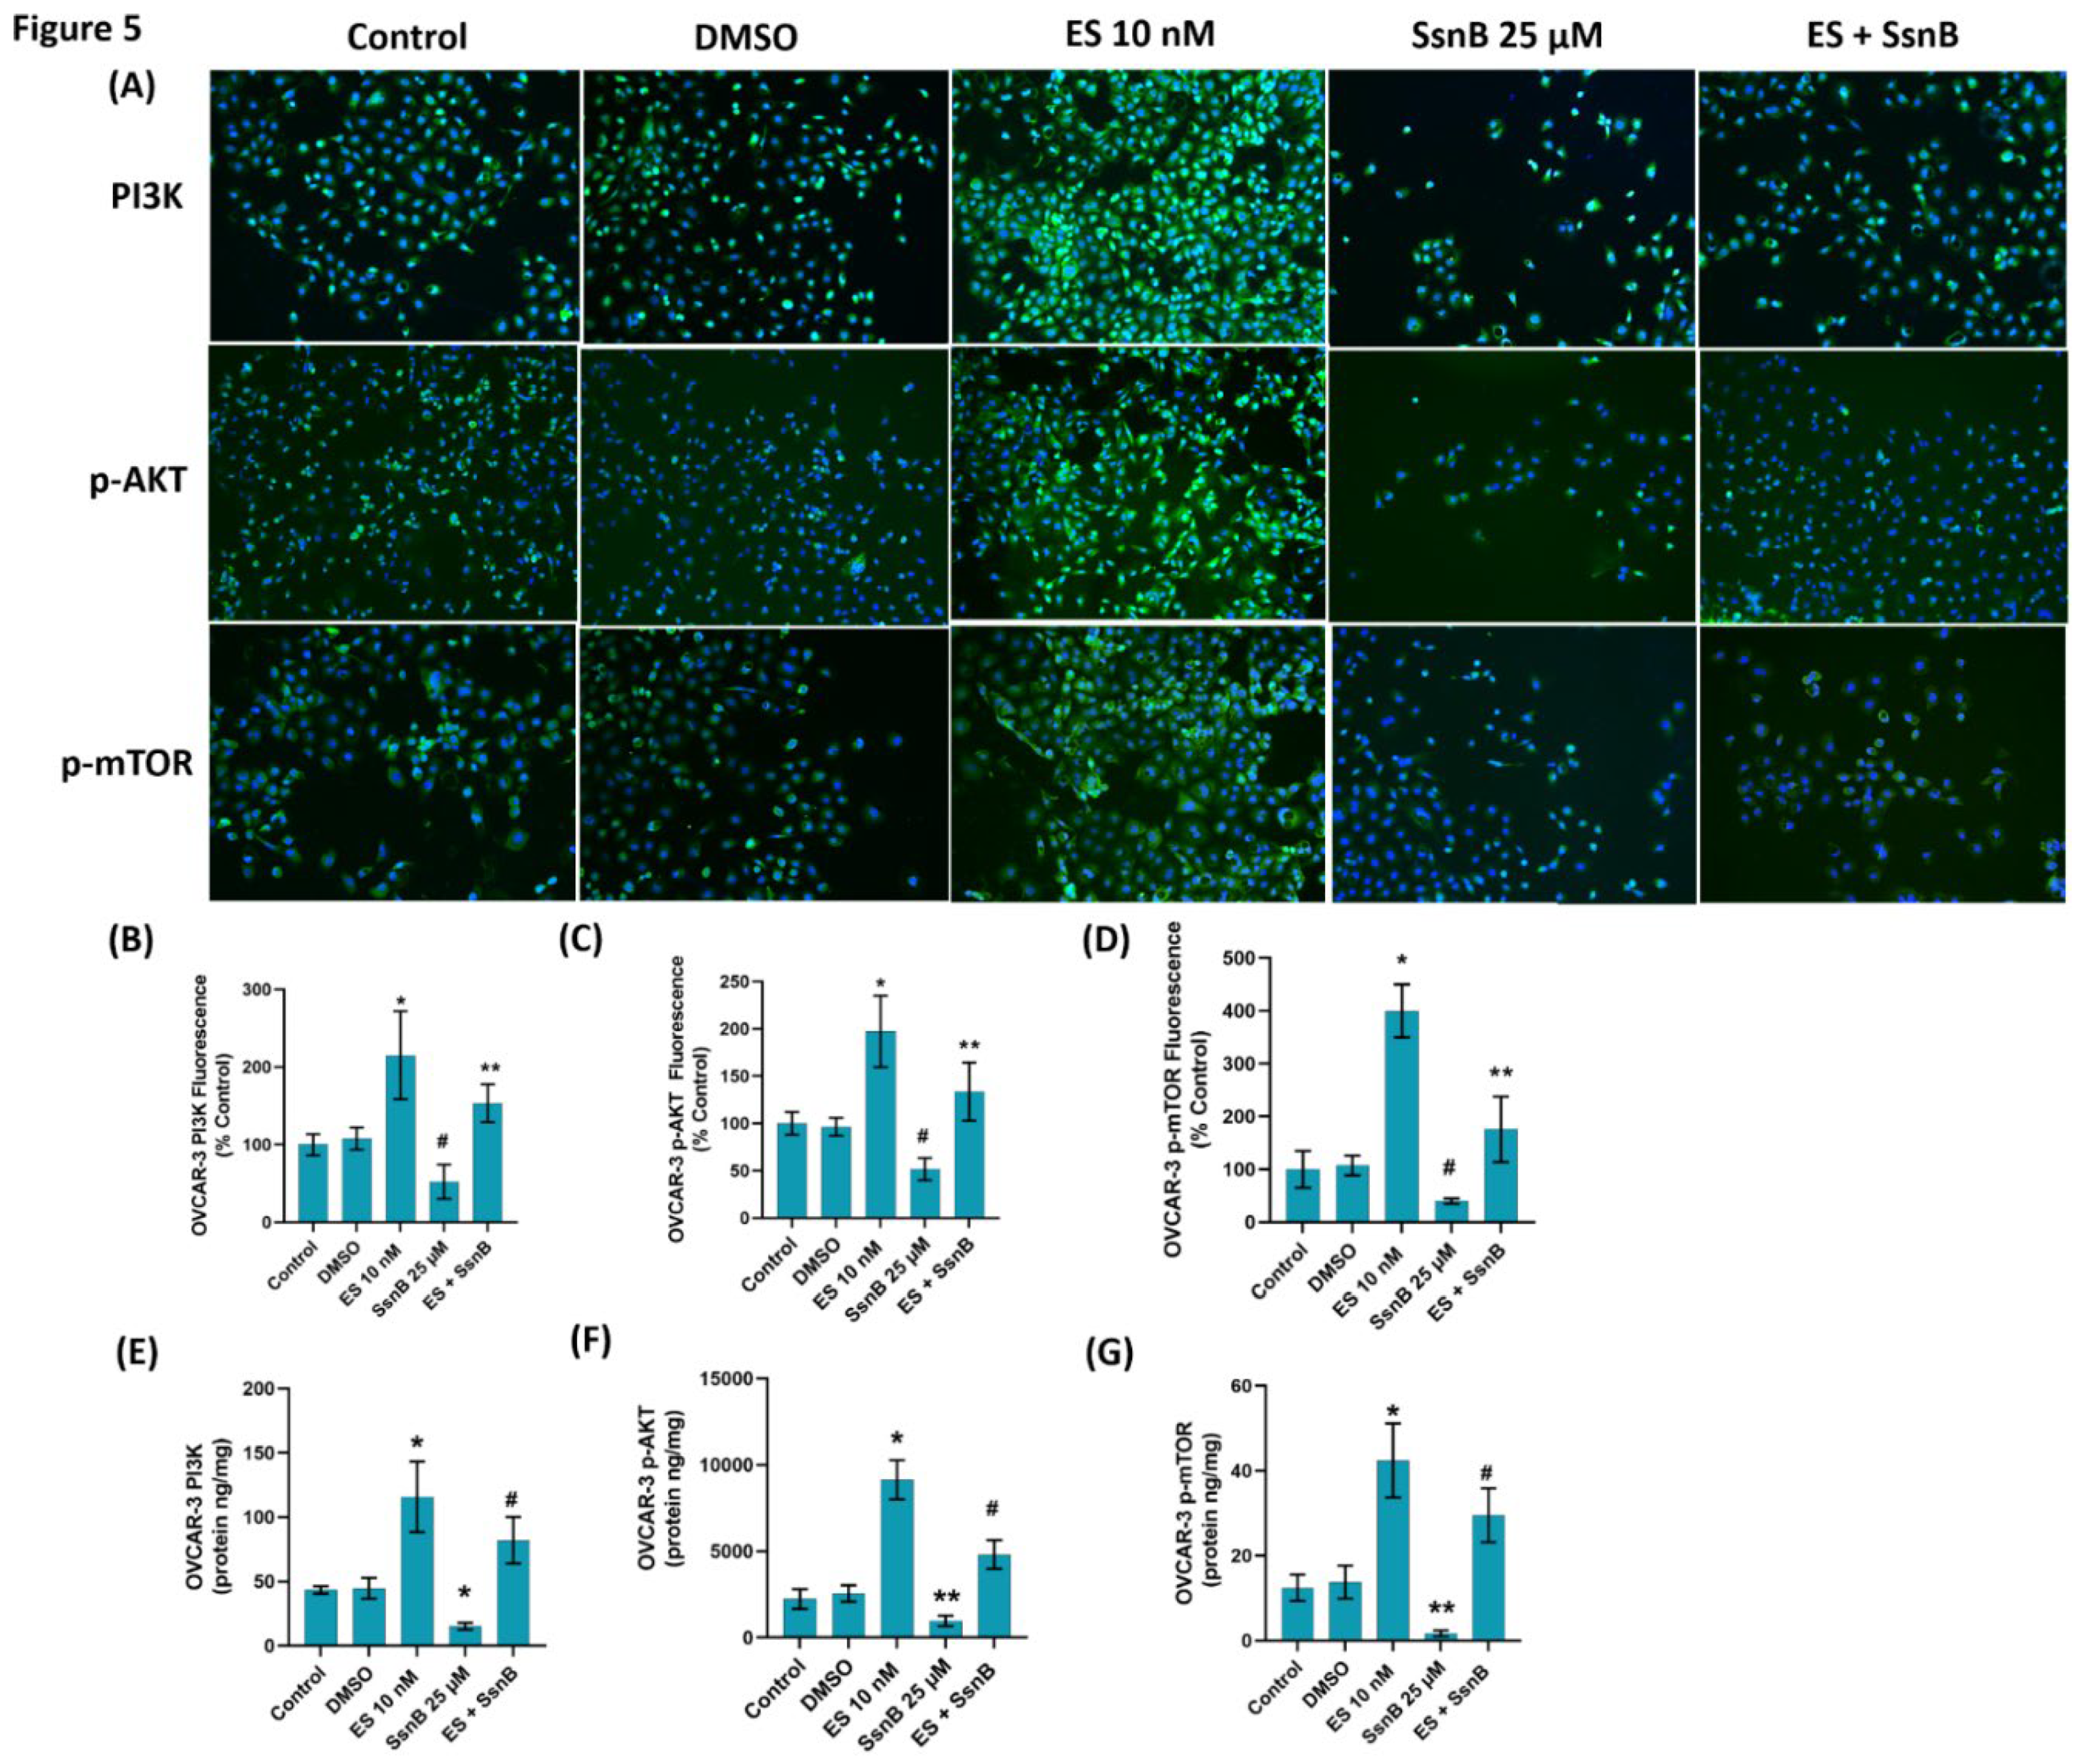

Table 1.
Sphingolipid levels in MCF-7 and OVCAR-3 cells.
| Control (n=6) | DMSO (n=6) | ES 10 nM (n=6) | SsnB 25 µM (n=6) | ES + SsnB (n=6) | |
|---|---|---|---|---|---|
| Sphingolipids (ng/mg protein) | |||||
| 16:0 SM (d18:1/16:0) | |||||
| MCF-7 | 124,99 ± 5,22 | 156,82 ± 27,99 | 165,75 ± 25,34 | 153,98 ± 13,82 | 143,83 ± 30,33 |
| OVCAR-3 | 157,40 ± 8,14 | 170,01 ± 13,15 | 143,50 ± 9,06 | 133,11 ± 28,17 | 158,64 ± 26,93 |
| 18:0 SM (d18:1/18:0) | |||||
| MCF-7 | 67,44 ± 13,12 | 60,60 ± 7,90 | 65,42 ± 24,01 | 61,71 ± 13,20 | 66,73 ± 7,84 |
| OVCAR-3 | 65,09 ± 14,51 | 59,68 ± 2,59 | 66,93 ± 17,35 | 57,40 ± 6,20 | 69,15 ± 22,34 |
| 24:0 SM (d18:1/24:0) | |||||
| MCF-7 | 45,42 ± 5,91 | 38,30 ± 3,54 | 41,46 ± 5,51 | 39,846 ± 6,82 | 36,15 ± 4,46 |
| OVCAR-3 | 44,08 ± 4,77 | 41,5 ± 2,005 | 41,16 ± 3,11 | 47,386 ± 6,37 | 44,83 ± 8,98 |
| C16 Ceramide (d18:1/16:0) | |||||
| MCF7 | 71,37 ± 9,38 | 73,71 ± 3,38 | 71,71 ± 2,11 | 7,02 ± 3,88 | 67,21 ± 7,79 |
| OVCAR-3 | 66,41 ± 7,28 | 69,63 ± 7,90 | 69,85 ± 6,76 | 69,87± 2,26 | 63,51 ± 14,33 |
| C18 Ceramide (d18:1/18:0) | |||||
| MCF-7 | 11,02 ± 0,77 | 10,26 ± 0,54 | 12,33 ± 0,12 | 27,36 ± 1,13** | 22,73 ± 2,01* |
| OVCAR-3 | 4,59 ± 1,08 | 6,11 ± 2,16 | 4,8 ± 0,327 | 11,77 ± 0,67* | 11,90 ± 2,51* |
| C20 Ceramide (d18:1/20:0) | |||||
| MCF-7 | 12,51 ± 1,72 | 14,77 ± 1,42 | 15,61± 1,76 | 31,68 ± 0,57* | 30,54 ± 0,79* |
| OVCAR-3 | 4,08 ± 0,36 | 4,61 ± 0,69 | 5,16± 0,73 | 33,91 ± 2,53** | 27,73 ± 1,52* |
| C22 Ceramide (d18:1/22:0) | |||||
| MCF-7 | 29,83 ± 2,032 | 27,14 ± 3,11 | 24,69± 1,70 | 65,98 ± 3,64* | 54,21 ± 2,76* |
| OVCAR-3 | 17,24 ± 0,98 | 17,44 ± 1,38 | 17,85± 3,77 | 50,99 ± 0,55* | 48,51 ± 1,76* |
| C24 Ceramide (d18:1/24:0) | |||||
| MCF-7 | 39,33 ± 1,09 | 36,41 ± 2,06 | 39,76± 2,75 | 98,55 ± 7,38* | 88,77 ± 2,56* |
| OVCAR-3 | 39,56 ± 3,38 | 37,57 ± 4,61 | 32,80± 5,11 | 97,56 ± 3,30* | 92,05 ± 4,72* |
| S1P | |||||
| MCF-7 | 6,55 ± 0,47 | 5,87 ± 0,21 | 16,81± 0,29≠ | 1,59 ± 0,10$ | 8,91 ± 0,14≠≠ |
| OVCAR-3 | 14,86 ± 0,22 | 14,89 ± 0,20 | 30,23± 0,44≠ | 6,48 ± 0,22$ | 11,43 ± 0,78≠≠ |
All values mean ± SD. SM, sphingomyelin; S1P, sphingosine-1-phosphate; C1P, ceramide-1- phosphate; Sparstolonin B (SP); Dimethyl Sulfoxide (DMSO); Estradiol Hemihidrat (ES). Statistical analysis was by One Way Analysis of Variance and all pairwise multiple comparison procedures were done by Tukey test.*, p<0,01 vs. control, DMSO, ES 10 nM groups. **, p<0,01, vs. control, DMSO, ES 10 nM and ES+ SsnB groups ≠, p<0,001, vs. control, DMSO, SsnB 25 µM and ES + SsnB groups. ≠≠, p<0,001, vs. control, DMSO, ES 10 nM ve SsnB 25 µM groups. $, p<0,001, vs. control, DMSO, ES 10 nM and ES+SsnB groups.
Disclaimer/Publisher’s Note: The statements, opinions and data contained in all publications are solely those of the individual author(s) and contributor(s) and not of MDPI and/or the editor(s). MDPI and/or the editor(s) disclaim responsibility for any injury to people or property resulting from any ideas, methods, instructions or products referred to in the content. |
© 2024 by the authors. Licensee MDPI, Basel, Switzerland. This article is an open access article distributed under the terms and conditions of the Creative Commons Attribution (CC BY) license (http://creativecommons.org/licenses/by/4.0/).
Copyright: This open access article is published under a Creative Commons CC BY 4.0 license, which permit the free download, distribution, and reuse, provided that the author and preprint are cited in any reuse.