

Submitted:
21 October 2024
Posted:
22 October 2024
You are already at the latest version
Abstract
Abstract
Introduction: Despite the determination to succeed in eliminating neglected tropical diseases, these have been increasing within certain endemicities, particularly in depriving region.
Objective: This study aimed to assess the relative burden of neglected tropical diseases in rural and urban slum settings in Eastern Ethiopia.
Methods: A comparative cross-sectional study was conducted from February 25 to April 30, 2024 with a multistage random sampling technique used. A survey tool with the integration of the spectrum was employed. Data were entered using Epi-Data version 3.1 and analyzed using STATA 16. Descriptive statistics and multivariable logistic regression analysis was used to identify the risk factors and the level for statistical significance was declared at p-value < 0.05 with 95 % CI.
Result: The response rate was 93 % and the mean age of house heads was 31.6 (Range; 18. 63) with 5.7 average family size. The overall prevalence of NTDs among study participants was 22.6 % (95% CI; 20.2, 25.2); urban slum it was 15 % (95% CI; 12.2, 18.4) while it was 29.8 % (95% CI; 26, 33.9) in rural. Though there is no statistically significant difference, the relative prevalence of NTDs in rural to urban was two. The multivariable analysis provided that the risk factors associated with NTDs were government employment (AOR: 12.5 (1.17, 132.4)), good income (AOR: 0.13 (.03, 0.57)), Child playing with soil (AOR: 5.8 (1.52, 22.0)); child hand washing at critical times ( AOR: 11.2 (1.7, 74.9)), presence of flies in the child faces (AOR: 20.3 (4.7, 88.6)) and type of drinking water sources (AOR: 0.11 (0.02, 0.73)).
Conclusion: the burden of NTDs was moderate in the study area dominated by STH, Trachoma, and scabies. Socio economic and WASH factors were found to be associated with NTDs. Collaborated efforts among stakeholders are crucial to prevent and control NTDs.
Keywords:
Neglected tropical diseases
; urban
; rural
; burden
; risk factors
; Ethiopia
1. Introduction
1.1. Background
The NTDs are deadly diseases which impact globally more than 1.7 billion people, with 40% of whom live in Africa while many of them are preventable [1] (Zaman et al., 2020). Neglected tropical diseases (NTDs) comprise a diverse group of communicable diseases and have proliferated fast in tropical and subtropical climates[2]. These diseases are termed “neglected” because they disproportionately affect the poor population of women and children, but NTDs have got limited attentions from the global health agenda and are almost ignored by global funding agencies [3]. They have long-term consequences, such as disfiguring, disability, blindness, and cause of malnutrition, cognitive impairment, and stunted growth for children, thus perpetuating the cycle of disease and poverty[4]. Many NTDs also impact individual quality of life, and many of the problems are related to impairments, stigma and poverty [5].
A number of NTDs share not only the geographical distribution, but also a common feature which are skin involvement, intimately associated with rural poverty, inadequate sanitation, limited clean water, and inadequate healthcare delivery and preventive measures; and dwellers live in proximity to pathogens and diseases vectors [6,7]. Globally, 200 million people are infected with schistosomiasis, and 120 million with lymphatic filariasis in 83 countries[8,9]. Onchocerciasis affects nearly 37 million people in 34 countries, and is most abundant in Africa, with small foci in southern and Central America[10], while trachoma affects 84 million people globally. M[11]ore than 4.5 billion people are at risk of infection and nearly 2 billion are infected with STHs[12].
A Chlamydia trachomatis bacterial infection causes trachoma, the most prevalent infectious eye disease cause of blindness in the entire world. Follicles on the tarsal conjunctiva are a result of this bacterial infection, which also manifests as redness, irritation, and sensitivity to light[13]. Hand-to-eye contact, mosquitoes, or flies searching for human eyes are the main methods of transmission for this illness[14,15]. Children less than 9 years of age are affected more seriously from Trachoma [16] and half of the global burden of active trachoma is distributed in five countries including Ethiopia [17]. Scabies infection is also among the leading NTDs that causes superficial burrows, itching especially at night, a generalized rash and secondary infection on the head, face, neck, armpit, elbow, wrist, palms, buttocks and soles[18]. It remains one of the commonest skin diseases seen in developing countries including Ethiopia [19].
Inequalities are multidimensional, and many interrelated layers can be recognized in NTDs. Firstly, the disease prevalence among disadvantaged people across the globe with little public voice contributes to their neglect and inequality in receiving attention. Stigma due to cultural and social factors is a major obstacle to sufficient awareness, timely help-seeking behavior, and proper treatment and this neglect has intensified during the COVID-19 pandemic[20]. These can result in high death tolls due to NTDs if control measures aren't prioritized now (Aborode et al., 2022). Rural and urban populations have disparate socio-demographic and economic characteristics, which have an influence on equity and their health seeking behavior (Begashaw et al., 2016). Moreover, there is a limitation of knowledge of NTDs’ healthcare seeking behavior in these high risk communities [21].
Despite the determination to succeed in eliminating NTDs, these diseases showed re-emergence within certain endemicities, particularly in WASH deprived regions [22]. Measuring the specific burden of NTDs is an important in evaluating health-care interventions and treatments, and understanding the burden of diseases[23] (Eiser and Morse, 2001). To improve the surveillance and control of NTDs, the integrated approach is the new recommendation of the WHO[24]. Furthermore, benchmarking the current status of NTDs in the country is important to monitor and evaluate the progress in the implementation of interventions and their impact [25]. However, in Ethiopia, particularly in the current study area, a limited study was done on the burden of NTDs. Therefore, this study aimed to investigate the relative burden of Neglected Tropical Diseases among children in urban slums and rural settings in Eastern Ethiopia.
2. Materials and Methods
2.1. Study Setting
This study was conducted in the Babile District of Oromia regional state and the Amir Nur District of Harari Regional State. The two districts were randomly selected to represent the rural and urban slum communities. Harari Regional state is one of the regions in Ethiopia found 526 Km away from Addis Ababa to the east. This regional state includes nine districts. Amir Nur district is one of the urban districts in the Harari regional state that includes three urban Kebeles namely 01, 02 and 07 and it has 24, 215 total population. The population of 01, 02 and 07 Kebeles are10, 674, 7,713, and 5,828, respectively. The urban kebele 01 has urban slum Ganda fero village and it includes 1178 households with 685 vulnerable under five children. The other rural study sites were Bisidimo and Ifadin Kebelles in Babile district which is found 540 Km away from Addis Ababa and 23 Km from Harar town to the eastern direction. The number of children aged from 1-15 of age in Bisidimo and Ifadin Kebeles are 3,582 as per the unpublished Babile district Administration Report, 2023.
2.2. Study Design and Period
A community-based comparative cross-sectional study was applied from February 25 to April 30, 2024.
2.3. Study Population
All households with children aged less than 18 years and their house heads living in the selected settings (districts) were the source population. All randomly selected households children in the Babile and Amir Nur districts and their house head who were available during the study period were our study population. Children less than 18 years old who lived in the selected kebeles with their family househead were included in the study. Seriously ill children, and whose age not known during data collection were excluded. For the parasitological investigation study, children taken deworming drugs within the past three months prior to the data collection period were excluded from the study.
2.4. Sample Size Determination and Sampling Techniques
The sample size was determined using a double population proportion formula by considering the following assumptions: 95% confidence level, 80% power of the study, and 10% non-response rate, and population ratio of 1:1 (two comparison groups): The overall helminths infection 36% detected in among rural schoolchildren in Tachgayint woreda, Ethiopia[26], and assuming the 23% prevalence of STH among school-age children in Jimma town[27] the sample size become 490. The calculated sample was doubled, with 2 design effect with 15 % non-compliance assumption, the final sample size was 1, 126.
Based on the purpose of the research we selected Amir Nur Urban slum district from Harar town, Harari region, and Bisidimo rural district from the nearby rural districts of East Harargie Zone, Oromia region. Then, two kebelles were randomly included in the study from the each of selected districts, and equivalent numbers of samples were allocated to both the rural and urban slum districts. Then, the sample size was distributed over the selected kebeles proportion to the target groups. The eligible households with children aged 1 to15 years old from each kebeles were selected by systematic random sampling technique and the kth value was used to determine interval of HH to be included in thestudy. Finally, the lottery method was used to select a child and in houses when more than one eligible child in the selected household. The house head of the child was also take part of the study.
2.5. Data Collection Method
2.5.1. Data Collection Tools
Accordingly, the required data for the study were collected using an integrated tool containing structured questionnaire, clinical checklists and standard laboratory investigations. Data were collected by trained nurses’ and laboratory professionals in collaboration with local healthcare workers (health extension workers). This all-involved household mapping, selection of study households and children, rapid visual and clinical examination of the common NTDs, stool sample collection and laboratory investigations. Head of the selected HH were interviewed about their household socio-demographic characteristics, behavioural, environmental, and other clinical enabling factors including some healthcare-seeking behaviors for the sick child. Examinations were conducted in a systematic way of the skin (with the exception of the genital area), hair, nails and oral cavity and the child’s name/address were recorded and sent to Hiwot fana University Specialized Hospital for further diagnosis and treatment, if the cild recognized with any skin lesion. A potassium hydroxide test was used to confirm some doubtful skin cases where as physical examination and grading of trachoma was carried out by trained nurses using the WHO simplified trachoma grading scheme[28].
At the same time, nurses were taking anthropomethric measurements in order to evaluate nutritional status of the study subjects. The levels of stunting (height for age z-scores), underweight (weight for age z-scores), and wasting (weight for height z-score) were calculated using Antro plus WHO software. Thus, children who were below − 2 standard deviations for height for age, weight for age, and weight for height were defined as stunted, underweight, and wasted, respectively. Wasting indicates recent weight loss, whereas stunting usually results from being chronically underweight[29].
For parasitological examination (STHs) children with gastrointestinal tract (GIT) complaints were requested to give about 2 grams of stool specimens with a clean stool cup. The collected stool samples were then processed and examiner using a sedimentation concentration technique. Finally, the research team (nurses, community healthcare workers and laboratory scientists) could trace, examine and treat all household contacts of children diagnosed with any NTDs [30].
2.5.2. Data Quality Control
The data collection tool was initially prepared in English scientific language and translated to local languages, Amharic Oromifa and Harari. Then, it backed to English language to check its consistency. A pretested was conducted in other similar communities and amendments were carried out in few ambiguous questions. We recrutted data collectors of well trained health professionals (Nurses, Health officers, and Laboratory Scientists and Environmental professionals) and training was given on the pupose and data collection techniques of the study. The data was checked regularly for any missing values, inconsistency, incompleteness and illegibility. Questionnaires found with missing values and inconsistencies were excluded and an imidate feedback was given to avoid similar errors. All laboratory procedures were carried using quality reagents and based on standard operating procedures. Supervisors were assigned to cosely assist the data collectors and take appropriate remidal actions.
2.6. Methods of Data Analysis
Data was collected anonymously and directly on Google Android devices (ASUS Nexus 7) using the Open Data Kit (ODK) application. A unique identifying number was given to all participants in advance, so sensitive personal data of participants were removed before analysis. Data was cleaned and analyzed using STATA 16. Prevalence of NTDs was determined on the basis of combined results from the different clinical and laboratory diagnostic methods. The WHO Anthro Plus Software for assessing growth of the world's children and adolescents was utilized to determine the nutritional status of study participants[31].
For descriptive data, rate (percentage) was used to describe the characteristics of the studied population, including the prevalence of NTDs according to districts, age, gender, etc. Univariate statistical model was used to examine the relationship between the dependant variable and eac predictor variables autonomously. Then, all variables that have p value ≥ 0.25 were included in a logistic multivariate analysis using forward elimination model to identify the independent predictors of NTDs. The level of statistical significance was set as p<0.05 and for each statistically significant factor, an odd ratio (OR) with 95% confidence interval (CI) was computed.
2.7. Ethical Consideration
Ethical approval was obtained from the College of Health and Medical sciences Institutional Health Research Ethics Review Committee (IHRERC). Informed, voluntary, written and signed consent was provided by a parent or guardian for all participants less than 15 years of age. In addition, verbal assent was obtained from children aged 12-15 years. All positive cases have been linked to the nearby health facility for further clinical management. Health education was given for households with any identified NTDs case to halt its transmission among family members and the neighborhoods. All standard safety measures were implemented during the data collection process to protect data collectors and study participants.
3. Results
3.1. Socio Demographic Characteristics of the Households
The response rate was 93 % and the mean age of house heads was 31.6 (Range; 18. 63) with 5.7 average family size. Out of 1, 048 children who participated in the study, approximately half (523) of them were female and the mean age of the study participants was 7.4 (SD; +4) years (Table 1).
3.2. Behavioural Characterstics of the Study Participants
It is a well stablished fact that social and behavioural characterstics of individuals notably contrubting to NTD infections. In line with this, 31.7 % of the study participants are not wearing sheos and 64.7 % of them are also sharing clothes. More than 58 % children had a habit of playing with soil while 47.3 % of the children’s nails were not trimmed during the study. Disgracefully, about 46 % of children practices field defication and one-third of them wash their hands at only once a day (Table 2).
3.3. Environmental Factors
Nearly, 85 % of the study participant have got drinking water from improved water source and 89 % of them obtained greater than or equal to 20 L water per capita per day which is above the recommended volume. According to our study, 77 % of the study participants do not have latrine their compound indicating that field defication is rampant in the study community and faces was observed in 55 % of participants residence compound (Table 3).
3.4. Clinical Characterstics of Children
In this study, 3.6 % of the study participants had recent trauma. About 15 % of children were previously contracted NTD where as 25 % of their family members have been diagnosed with NTDs. Nearly, 68 % of the house heads are aware about NTDs and 53 % have got the information from healthcare workers followed by mass media (23 %) (Table 4).
The nutrional statuses of children were evaluated and 17 % and 49 % of them were wasted and stanted, respectively. Similarly, 32 % of children were suffering from obesity whereas 13.6 % of them were underweight (Figure 1).
3.5. Relative Burden of NTDs Among Urban Slum and Rural Children
Based on the standard clinical examination and laboratory investigations nine types of NTDs were diagnosed. Sole burden of STH infection was 8.7 % followed by eye infection (Trachoma, 4.6 %), skin diseases (3.4 %), mixed infections (3.2 %) and protozoan parasites (2.6 %). The most commonly identified NTDs were H. nana, Trachoma and Scabies while the least detected NTD was Leprosy (Table 5).
The overall prevalence of NTDs among study participants was 22.6 % (95% CI; 20.2, 25.2); in it urban slum was 15 % (95% CI; 12.2, 18.4) while it is 29.8 % (95% CI; 26, 33.9) in rural indicating that the prevalence ratio of NTDs in rural communities to Urban slum is two. The major NtDs identified both in rural and urban slum communities were H. nana (79), Trachoma (62) and Scabies (51). Prevalence of coinfections with two or more NTDs was 3.2 % (Figure 2).
3.6. Univariate and Multivariable Logistic Regression Models for Risk Factors Associated with NTDs
The univariate analysis revealed that most of the socio-demographic, behavioural, environmental and clinical variables have association with NTDs. Multivariable logistic regression was carried out to identify potential risk factors after adjusting for confounding. Therefore, varaiables such as government employement (p = 0.036), monthly income (p = 0.007), child habit of playing with soil (p = 0.010), handwashing at three or more critical times (p = 0.013), presence of flies in child faces (p = 0.000), unimproved drinking water source (p = 0.022) and lack of cleaning drinking water container (p = 0.007) found to be significantly associated with niglected tropical diseases. However, known predictors like household education, child age, child nutritional status, lack of improved latrine, eating raw vegitables and lack of awareness didn’t show association with NTDs in the current study.

Table 6.
Univariate and multivariable logistic regression models for risk factors associated with NTDs among children in selected urban slum and rural households in Eastern Ethiopia, 2024.
Table 6.
Univariate and multivariable logistic regression models for risk factors associated with NTDs among children in selected urban slum and rural households in Eastern Ethiopia, 2024.
| Variable | Responses | NTD (n = 1048) | COR (95 % CI) | P value | AOR (95 % CI) | P value | |
|---|---|---|---|---|---|---|---|
| Positive | Negative | ||||||
| Residence | Urban | 77 | 435 | 1 | 1 | ||
| Rural | 160 | 376 | 2.4 (1.8, 3.3) | 0.000 | 4.3 (0.28. 63.5) | 0.291 | |
| Highest educational level of the house head | Can’t read and write | 144 | 404 | 1 | 1 | ||
| Read and write | 33 | 177 | 0.5 (0.3, 0.79) | 0.0020.8 | 0.55 (0.15 2.0) | 0.363 | |
| Primary school | 26 | 77 | 0.9 (0.6, 1.5) | 0.826 | 0.17 (0.02, 1.4) | 0.104 | |
| Secondary school | 14 | 39 | 1.0 (0.5, 1.9) | 0.983 | 0.34 (0.027, 4.2) | 0.400 | |
| College and above | 20 | 114 | 0.5 (0.29, 0 .8) | 0.007 | 0.58 (0.05 7.1) | 0.669 | |
| Occupation | Farmer | 101 | 149 | 1 | 1 | ||
| Merchant | 26 | 157 | 0.2 (0.15, 0.4) | 0.000 | 0.88 (0.06, 12.6) | 0.923 | |
| Government employed | 28 | 175 | 0.24 (0.15, 0 .4) | 0.000 | 12.5 (1.17, 132.4) | 0.036 | |
| Housewife | 45 | 230 | 0.29 (0.19, 0.4) | 0.000 | 1.41 (0.18, 7.1) | 0.884 | |
| Others | 37 | 100 | 0.5 (0.35, 0 .8) | 0.009 | 0.9 (0.07, 12.3) | 0.945 | |
| Monthly income | Low income | 175 | 402 | 1 | 1 | ||
| Good income | 62 | 409 | 0.35 (0.25, 0.5) | 0.000 | 0.13 (.03, 0.57) | 0.007 | |
| Household size | One to five | 111 | 418 | 1 | 1 | ||
| Greater than five | 126 | 393 | 1.2 (0.9, 1.6) | 0.203 | 2.66 (0.5, 13.9) | 0.245 | |
| Enrergy source for cooking | Wood/Mud | 210 | 590 | 1 | 1 | ||
| Electiricity | 27 | 221 | 0.34(0.22, 0.5) | 0.000 | 0.89 (0.02, 36.3) | 0.949 | |
| Number of children | One to three | 133 | 492 | 1 | 1 | ||
| Greater than three | 104 | 319 | 1.2 (0.9, 1.6) | 0.210 | 1.4 (0.26, 7.7) | 0.681 | |
| Age of the child | 0 to 5 years | 94 | 289 | 1 | 1 | ||
| 6 to 10 years | 102 | 330 | 1.01 (0.67, 1.5) | 0.940 | 1.002 (0.24, 4.1) | 0.997 | |
| 11 to 18 years | 41 | 192 | 0.68 (0.4, 1.1) | 0.159 | 1.04 (0.17, 6.4) | 0.968 | |
| Educational status of the child | Under school | 58 | 147 | 1 | 1 | ||
| Primary or secondary school | 131 | 490 | 0.68 (0.47, 0.97) | 0.034 | 1.3 (0.26, 6.3) | 0.758 | |
| Not attending school | 48 | 174 | 0.7 (0.45, 1.0) | 0.112 | 0.83 (0.17, 4.1) | 0.819 | |
| WHZ | Wasted | 26 | 110 | 1 | 1 | ||
| Normal | 157 | 509 | 0.77 (0.4, 1.4) | 0.416 | 1.6 (0.3, 9.1) | 0.567 | |
| HAZ | Stunted | 108 | 392 | 1 | 1 | ||
| Not stunted | 124 | 405 | 0.87 (0.6 1.3) | 0.472 | 0.46 (0.15, 1.4) | 0.182 | |
| WAZ | Underweight | 30 | 87 | 1 | 1 | ||
| Normal | 98 | 341 | 0.73 (0.38, 1.4) | 0.352 | 0.74 (0.14 3.9) | 0.722 | |
| Overweight | 35 | 105 | 0.86 (0.4. 1.8) | 0.703 | 0.6 (0.08, 4.3) | 0.616 | |
| Obse | 69 | 264 | 0.71 (0.37 1.4) | 0.316 | 0.5 (0.07, 3.7) | 0.520 | |
| Sharing clothes | Yes | 173 | 505 | 1.6 (1.19, 2.2) | 0.003 | 0.62 (0.16, 2.3) | 0.479 |
| No | 64 | 306 | 1 | 1 | |||
| Wearing shoe | Yes | 172 | 544 | 1.3 (0.9, 1.8) | 0.110 | 1.8 (0.55, 5.8) | 0.337 |
| No | 65 | 267 | 1 | 1 | |||
| Child playing with soil | Yes | 178 | 435 | 2.6 (1.9, 3.6) | 0.000 | 5.8 (1.52, 22.0) | 0.010 |
| No | 59 | 376 | 1 | 1 | |||
| Raw vegitable eating habit | Yes | 94 | 433 | 0.57 (0.4, 0.77) | 0.000 | 0.42 (0.13, 1.3) | 0.140 |
| No | 143 | 378 | 1 | 1 | |||
| Child hand washing critical times | One critical time | 95 | 263 | 1 | 0.059 | 1 | |
| Two critical times | 87 | 329 | 1.04 (0.7, 1.5) | 0.831 | 0.35 (0.1, 1.2) | 0.097 | |
| Three or more critical times | 55 | 219 | 2.04 (1.17, 3.6) | 0.012 | 11.2 (1.7, 74.9) | 0.013 | |
| Frequency of washing child face per day | Once | 94 | 304 | 1 | 1 | ||
| Twowice | 85 | 261 | 1.05 (0.7, 1.5 | 0.763 | 1.7 (0.6, 4.86) | 0.285 | |
| Three times | 58 | 246 | 0.76 (0.5, 1.1) | 0.149 | 0.47 (0.09, 2.4) | 0.369 | |
| Hygiene condition of child face | Clean | 94 | 511 | 1 | 1 | ||
| Unclean | 143 | 300 | 2.6 (1.9, 3.5) | 0.000 | 0.74 (0.2, 2.8) | 0.663 | |
| Presence of flies in the child faces | Yes | 162 | 301 | 3.7 (2.7, 4.98) | 0.000 | 20.3 (4.7, 88.6) | 0.000 |
| No | 75 | 510 | 1 | 1 | |||
| Presence of animal dung in the compound | Yes | 146 | 348 | 2.1 (1.6, 2.9) | 0.000 | 1.9 (0.3, 11.2) | 0.488 |
| No | 91 | 463 | 1 | 1 | |||
| Type of drinking water source | Improved | 209 | 679 | 0.42 (0.26, .66) | 0.000 | 0.11 (0.02, 0.73) | 0.022 |
| Unimproved | 28 | 132 | 1 | 1 | |||
| Are all the water containers clean? | Yes | 138 | 437 | 1.2 (0.89, 1.6) | 0.237 | 0.63 (0.2, 1.9) | 0.414 |
| No | 99 | 374 | 1 | 1 | |||
| Vulume of water used per capita per day | < 20 liter | 202 | 736 | 1 | 1 | ||
| ≥ 20 liter per day | 35 | 75 | 1.7 (1.1, 2.6) | 0.016 | 2.04 (0.5, 7.8) | 0.296 | |
| Do you treat your drinking water | Yes | 20 | 122 | 0.52 (0.3, 0.8) | 0.010 | 0.42 (0.03, 5.2) | 0.506 |
| No | 217 | 689 | 1 | 1 | |||
| Water shortage in the previous one month | Yes | 131 | 567 | 0.5 (0.4, 0.7) | 0.000 | 0.59 (0.17, 2.0) | 0.402 |
| No | 106 | 244 | 1 | 1 | |||
| Satisfaction with the current water service | Satisfied | 105 | 213 | 1 | 1 | ||
| Not satisfied | 132 | 598 | 0.45 (0.3, 0.6) | 0.000 | 4.3 (0.84, 22.4) | 0.080 | |
| Presence of feces in the floor of the toilet | Yes | 92 | 195 | 2 (1.4, 2.7) | 0.000 | 0.56 (0.19, 1.6) | 0.293 |
| No | 100 | 417 | 1 | 1 | |||
| Presence of flies in the toilet | Yes | 165 | 416 | 2.9 (1.8, 4.4) | 0.000 | 1.5 (0.19, 12.0) | 0.694 |
| No | 27 | 196 | 1 | 1 | |||
| Presence of faces in the ground of the compound | Yes | 106 | 472 | 1 | 1 | ||
| No | 131 | 339 | 1.7 (1.3, 2.3) | 0.000 | 1.9 (0.59, 6.3) | 0.278 | |
| Do the family use animal dug as fertilizer? | Yes | 89 | 269 | 0.3 (0.22, 0.5) | 0.000 | 0.33 (0.1, 1.1) | 0.077 |
| No | 49 | 51 | 1 | 1 | |||
| Presence of waste water discharge in the compound | Yes | 162 | 411 | 2.1 (1.5, 2.8) | 0.000 | 1.7 (0.52, 5.5) | 0.385 |
| No | 75 | 399 | 1 | 1 | |||
| Often use street vender food | Yes | 90 | 258 | 1.3 (0.97, 1.77) | 0.077 | 1.5 (0.5, 4.7) | 0.454 |
| No | 147 | 553 | 1 | 1 | |||
| Presence of flies in the kitchen | Yes | 192 | 551 | 2 (1.4. 2.9) | 0.000 | 0.44 (0.09, 2.3) | 0.330 |
| No | 45 | 260 | 1 | ||||
| Are you a regular health insurance user? | Yes | 193 | 583 | 1.7 (1.19, 2.4) | 0.003 | 1.7 (0.27, 10.3) | 0.585 |
| No | 44 | 228 | 1 | 1 | |||
| Does the health care cost influnces the choice of health institution? | Yes | 116 | 451 | 1 | 1 | ||
| Some what | 99 | 282 | 1.4 (1.0, 1.8) | 0.047 | 1.8 (0.56, 5.5) | 0.333 | |
| No | 22 | 78 | 1.1 (0.6, 1.8) | 0.726 | 1.7 (0.28, 10.2) | 0.556 | |
| Awerness about NTDs | Yes | 45 | 102 | 1.6 (1.1, 2.4) | 0.013 | 1.6 (0.5, 5.1) | 0.395 |
| No | 192 | 709 | 1 | ||||
| Did the child have any NTD within the previous two months | Yes | 45 | 102 | 0.7 (0.45, 1.2) | 0.241 | 2.8 (0.85, 9.1) | 0.091 |
| No | 192 | 709 | 1 | 1 | |||
4. Discussions
The current integrated and comprehensive study covered considerable epidemiologically relevant NTDs and all the potential risk factors. The study also tried to compare the NTDs burden and distribution among four kebelles of urban and rural areas in which inequalities could be minimized. According to the study, about 39 % of the house heads had never attended formal education which is in line with the national data that underline illitracy remains a major problem that hinders community health in many aspects[32]. In line with this, one–fifth (22 %) of the child are not going to school at their seven-year age. More than three-fourths of the study participants do not have the latrine in their compound indicating that field defication is rampant in the study community. Aproximately, family members of 44 % households are living with livestock at home which could increase the chance of spreading zonotic diseases in inadequate safety conditions and humans may contract diseases like respiratory infections, acute febrile illnesses, and diarrhea[33].
The overall prevalence of NTDs was 22.6 % (95% CI; 20.2, 25.2) with rural to urban prevalence ratio of 2. This finding revealed that NTDs burden is still high, particularly in rural areas in developing countries like Ethiopia[34]. The predominant NTDs diagnosed among children was STH, 105 cases (10 %) and this finding is concordant with other similar studies done elsewhere in developing nations[27,35,36].
In our study, eye infection (Trachoma) was the second most prevalent NTD, 5.9 % which is consistant with some studies [37,38,39]. However, this finding is by far lower than the studied done in many parts of Ethiopia [40,41,42]. Better access to safe water, improved sanitation and health facilities in areas where this study was conducted compared to the previous studies. In addition, some communities in other study areas are repeatedly drought-affected and food-insecure, which is attributed to the high prevalence of trachoma[43]. But, the prevalence was higher compared to the studies done in different corner of the world [44,45,46,47,48,49]. The possible reason for such trachoma burden variation might be due to the endemicity of the disease in the district, lower coverage of water and sanitation facilities, climatic conditions, and living conditions of the study area population. This implies that the finding of the current study confirmed that trachoma is still a disease of public health importance in both urban and rural communities in the study areas.
The sum prevalence of scabies infestations among the study participant was 4.9 % and it is concordant with studies conducted in Africa[50]. This finding is lower than other similar stududies conducted in Indonisia (77 %) and Ghana (71 %)[51], Weldaya (24 %)[52] and Meta Robi (19 %)[53]. High rates of scabies are usually found in communities and milieus where overcrowding and poverty are highly prevalent, perhaps this prevalence discrepancy might be attributed to family size variation, educational status variation, and might also be related to variation in sociodemographic characteristics of the study population, level of awareness, and health-seeking behavior across these populations[54].
The combined protozoan parasites, G. lamblia and E. hystolitica/dispari prevalence in school age children was 3.4 % (95 CI; 12, 34). This finding virtually lower than most protozoan parasitic studies conduted in sub-Saharan Africa and this could be due to the fact that our study population was school age children with gastro intestinal discomfort wheras diarrhic children is the inclusion criteria for others[55,56]. As usual in most studies conducted in NTDs endemic areas prevalnet of mixed infections was common, 3.2 % and it could be due to common requirements between neglected tropical infections[57].
The multivariable analysis showed that poverty were positively associated with common childhood illnesses in the sub-Saharan African countries[58]. Children of households with greater than average income of the study community have 87 % less likely to contract NTDs than those children from household of low monthly income. This finding is consistent with other NTD studies[59] and it is noticeable that the magnitude of communicable diseases varied with socio economic inequality, but often, the odds of infection or disease were twice as high among socioeconomically disadvantaged groups[60]. Children with government emplyeed mother’s/caregiver’s were tewelve times more likely to have NTDs compared to those caregivers of farmer in the study areas. This may happen as the development trend for cash crops over the last decade in Eastern Ethiopia is clearly positive for farmers, with chat being the leading crop, followed by vegitables & coffee[61]. In contrast, govrnement employeers are apparently relaying on their salary in the face of fast currency depreciation that could have a direct relashinp with poverty and NTDs vulnerability[62]. Children who are playing with soil are six times likely to have NTDs than the counterparts which is in agreement with similar studies[63]. Warm and moist environmental conditions such as soil and water bodies favour the long-term existence of eggs and larval stages[64].
Children who are washng their hand at critical times are significantly at lower risk of NTDs Correspondingly, children those household utilized improved water source 89 % lower probality of NTDs compared to those who use unimproved water source whereas, children from households where flies are present in its toilet are 20 times more likely than the counter parts. These all are found to be the very common predictors seen in most communicable diseases studies[65] and it revealed that Key WASH-related behaviours can prevent burden of NTDs[66,67]. Some of the common recognized independent predictors of NTDs like residence, educational level and nutritional status had no statstically significant association. These could be due to the fact that the community sociodemographic, culture and environmental variability which were not considered in these studies.
5. Conlusions
The increased incidence of neglected tropical diseases recognized as public health threats in Ethiopia. Though there is no significant difference in burden and in its type between urban slum and rural communities, NTDs are moderately endemic in the study area. Poverty related and WASH related factors are mainly associated risk factors of NTDs, Improving socioeconomic and environmental situation through collaborative effort is vital. The health sector should increase community awareness and health seeking behaviours about NTDs in order to promot prevention and control of NTDs in the country. Researchers should design and conduct a more comprehensive and analytical studies to figure out the specif NTDs burden and identify its complex risk factors. Therefore, policy makers, officials, program implementers and acadamicians could have better understanding in prevention and controlling stratagies of NTDs.
Acknowledgments
We would like to express our sincere gratitude to the Haramaya University research vice president's office for funding this project. Many thanks are also extended to the local administrations and health offices in the study area for their passion and for providing pertinent information. Finally, we would like to pass ou gratitude4 to data collectors and study participants for taking par in this study.
Abbreviations and Acronyms
| CDLQI | Children's Dermatology Life Quality Index |
| COVID-19 | Coronavirus Disease-19 |
| HCFs | HealthCare Facilities |
| HHCs | Household Contacts |
| HRQoL | Health-Related Quality of Life |
| NTDs | Neglected Tropical Diseases |
| SAFE | Surgery, Antibiotics, Facial Cleanliness, and Environmental Hygiene |
| SDG | Sustainable Development Goals |
| sNTD | Skin Related Neglected Tropical Diseases |
| STHs | Soil-Transmitted Helminthiases |
| WASH | Water, Sanitation and Hygiene |
| WHO | World Health Organization |
References
- S. Zaman et al., "Severely stigmatised skin neglected tropical diseases: a protocol for social science engagement," vol. 114, no. 12, pp. 1013-1020, 2020. [CrossRef]
- A. P. Koffi et al., "Integrated approach in the control and management of skin neglected tropical diseases in three health districts of Côte d’Ivoire," vol. 20, pp. 1-9, 2020. [CrossRef]
- H. J. P. N. T. D. PJ, "Neglected tropical diseases in sub-saharan Africa: review of their prevalence, distribution, and disease burden," vol. 3, p. e412, 2009.
- K. J. E. Worku, "Neglected tropical diseases program in ethiopia, progress and challenges," vol. 55, no. 4, 2017.
- A. T. van ‘t Noordende, M. W. Aycheh, and A. J. P. n. t. d. Schippers, "The impact of leprosy, podoconiosis and lymphatic filariasis on family quality of life: A qualitative study in Northwest Ethiopia," vol. 14, no. 3, p. e0008173, 2020. [CrossRef]
- R. R. J. T. m. Yotsu and i. disease, "Integrated management of skin NTDs—lessons learned from existing practice and field research," vol. 3, no. 4, p. 120, 2018. [CrossRef]
- A. T. Aborode et al., "Neglected Tropical Diseases (NTDs) and COVID-19 pandemic in Africa: Special focus on control strategies," vol. 25, no. 14, pp. 2387-2390, 2022. [CrossRef]
- P. J. Hotez, A. Fenwick, L. Savioli, and D. H. J. T. L. Molyneux, "Rescuing the bottom billion through control of neglected tropical diseases," vol. 373, no. 9674, pp. 1570-1575, 2009. [CrossRef]
- D. G. J. P. N. T. D. Addiss, "Global elimination of lymphatic filariasis: addressing the public health problem," vol. 4, no. 6, p. e741, 2010. [CrossRef]
- M. J. Taylor, A. Hoerauf, and M. J. T. L. Bockarie, "Lymphatic filariasis and onchocerciasis," vol. 376, no. 9747, pp. 1175-1185, 2010. [CrossRef]
- B. Liese, M. Rosenberg, and A. J. T. L. Schratz, "Programmes, partnerships, and governance for elimination and control of neglected tropical diseases," vol. 375, no. 9708, pp. 67-76, 2010. [CrossRef]
- W.-t. J. F. W. H. O. Helminthiases, "Eliminating soil-transmitted helminthiases as a public health problem in children: progress report 2001–2010 and strategic plan 2011–2020," vol. 1, no. 1, pp. 19-29, 2012.
- WHO, "Overview and Burden of Trachoma. Geneva, Switzerland: World Health Organization.," Available at: https://www.who.int/news-room/fact-sheets/detail/trachoma. Accessed December 12, 2023, 2020.
- M. W. Kassaw, A. M. Abebe, K. D. Tegegne, M. A. Getu, and W. T. Bihonegn, "Prevalence and Risk Factors of Active Trachoma among Rural Preschool Children in Wadla District, Northern Ethiopia: A Community Based Cross-Sectional Study," 2019.
- WHO, "GET17 Report Final. Geneva, Switzerland: World Health Organization.," Available at: https://www.scribd.com/document/382302091/GET17Report-Final. Accessed December 12, 2023. , 2013.
- K. Ayelgn, T. Guadu, and A. J. I. J. o. P. Getachew, "Low prevalence of active trachoma and associated factors among children aged 1–9 years in rural communities of Metema District, Northwest Ethiopia: a community based cross-sectional study," vol. 47, no. 1, p. 114, 2021. [CrossRef]
- M. M. Alambo, E. A. Lake, S. Bitew Workie, and A. Y. J. I. P. o. I. D. Wassie, "Prevalence of active trachoma and associated factors in Areka Town, south Ethiopia, 2018," vol. 2020, no. 1, p. 8635191, 2020. [CrossRef]
- J. Sara, Y. Haji, A. J. D. r. Gebretsadik, and practice, "Scabies outbreak investigation and risk factors in East Badewacho District, Southern Ethiopia: unmatched case control study," vol. 2018, no. 1, p. 7276938, 2018. [CrossRef]
- B. Misganaw, S. G. Nigatu, G. N. Gebrie, and A. A. J. P. o. Kibret, "Prevalence and determinants of scabies among school-age children in Central Armachiho district, Northwest, Ethiopia," vol. 17, no. 6, p. e0269918, 2022. [CrossRef]
- T. L. R. H. W. J. T. L. R. H. W. P. Pacific, "To end the neglect of neglected tropical diseases," vol. 18, 2022. [CrossRef]
- L. Ventura-Garcia et al., "Socio-cultural aspects of Chagas disease: a systematic review of qualitative research," vol. 7, no. 9, p. e2410, 2013. [CrossRef]
- K. Ganasegeran, S. A. J. N. T. D. Abdulrahman, and P. i. D. Discovery, "Epidemiology of Neglected Tropical Diseases," pp. 1-36, 2021.
- C. Eiser and R. J. H. t. a. Morse, "Quality-of-life measures in chronic diseases of childhood," vol. 5, no. 4, pp. 1-157, 2001. [CrossRef]
- P. Djossou et al., "Integrated approach in the control of neglected tropical diseases with cutaneous manifestations in four municipalities in Benin: A cross-sectional study," vol. 13, no. 3, pp. 184-191, 2021. [CrossRef]
- A. Deribew et al., "Mortality and disability-adjusted life-years (DALYs) for common neglected tropical diseases in Ethiopia, 1990-2015: evidence from the global burden of disease study 2015," vol. 55, no. Suppl 1, p. 3, 2017.
- T. Eyayu et al., "Prevalence, intensity of infection and associated risk factors of soil-transmitted helminth infections among school children at Tachgayint woreda, Northcentral Ethiopia," vol. 17, no. 4, p. e0266333, 2022. [CrossRef]
- A. Zeynudin, T. Degefa, S. Suleman, A. Abamecha, Z. Hajikelil, and A. J. J. o. T. M. Wieser, "Prevalence and Determinants of Geohelminthiasis among School-Age Children in Jimma City, Ethiopia," vol. 2023, no. 1, p. 8811795, 2023. [CrossRef]
- B. Thylefors, C. R. Dawson, B. R. Jones, S. K. West, and H. R. J. B. o. t. W. H. O. Taylor, "A simple system for the assessment of trachoma and its complications," vol. 65, no. 4, p. 477, 1987.
- World Health Organization, WHO child growth standards: length/height-for-age, weight-for-age, weight-for-length, weight-for-height and body mass index-for-age: methods and development. World Health Organization, 2006.
- L. Keller et al., "Performance of the Kato-Katz method and real time polymerase chain reaction for the diagnosis of soil-transmitted helminthiasis in the framework of a randomised controlled trial: treatment efficacy and day-to-day variation," vol. 13, pp. 1-12, 2020. [CrossRef]
- W. AnthroPlus, "for Personal Computers," 2009.
- D. A. Bitew, D. B. Asmamaw, T. B. Belachew, and W. D. J. H. Negash, "Magnitude and determinants of women's participation in household decision making among married women in Ethiopia, 2022: Based on Ethiopian demographic and health survey data," vol. 9, no. 7, 2023. [CrossRef]
- S. Thumbi et al., "Linking human health and livestock health: a “one-health” platform for integrated analysis of human health, livestock health, and economic welfare in livestock dependent communities," vol. 10, no. 3, p. e0120761, 2015. [CrossRef]
- M. o. H. Ethiopia, "The third national neglected tropical diseases strategic plan 2021-2025," ed: Ministry of Health Ethiopia Addis Ababa, 2021.
- D. J. González Quiroz et al., "Prevalence of soil transmitted helminths in school-aged children, Colombia, 2012-2013," vol. 14, no. 7, p. e0007613, 2020. [CrossRef]
- R. W. Kihoro et al., "Epidemiology of soil-transmitted helminthiasis among school-aged children in pastoralist communities of Kenya: A cross-sectional study," vol. 19, no. 5, p. e0304266, 2024. [CrossRef]
- A. Shimelash et al., "Prevalence of active trachoma and associated factors among school age children in Debre Tabor Town, Northwest Ethiopia, 2019: a community based cross-sectional study," vol. 48, no. 1, p. 61, 2022. [CrossRef]
- J. D. King et al., "Trachoma among children in community surveys from four African countries and implications of using school surveys for evaluating prevalence," vol. 5, no. 4, pp. 280-287, 2013. [CrossRef]
- A. Genet et al., "Prevalence of active trachoma and its associated factors among 1–9 years of age children from model and non-model kebeles in Dangila district, northwest Ethiopia," vol. 17, no. 6, p. e0268441, 2022. [CrossRef]
- D. Getachew et al., "High prevalence of active trachoma and associated factors among school-aged children in Southwest Ethiopia," vol. 17, no. 12, p. e0011846, 2023. [CrossRef]
- Z. A. Asmare et al., "Prevalence and associated factors of active trachoma among 1–9 years of age children in Andabet district, northwest Ethiopia, 2023: A multi-level mixed-effect analysis," vol. 17, no. 8, p. e0011573, 2023. [CrossRef]
- D. Tuke, E. Etu, E. J. T. A. J. o. T. M. Shalemo, and Hygiene, "Active trachoma prevalence and related variables among children in a pastoralist community in southern Ethiopia in 2021: a community-based cross-sectional study," vol. 108, no. 2, p. 252, 2023. [CrossRef]
- Z. A. Anteneh, W. Y. J. T. d. Getu, travel medicine, and vaccines, "Prevalence of active trachoma and associated risk factors among children in Gazegibela district of Wagehemra Zone, Amhara region, Ethiopia: community-based cross-sectional study," vol. 2, pp. 1-7, 2016. [CrossRef]
- H. Mohamed, F. Weldegebreal, J. Mohammed, A. J. E. A. J. o. H. Gemechu, and B. Sciences, "Trachoma and Associated Factors among School Age Children 4-9 Years in Dire Dawa Administration, Eastern Ethiopia," vol. 3, no. 2, pp. 45-54, 2019.
- N. Assefa, A. A. Roba, T. Abdosh, J. Kemal, and E. J. O. R. A. I. J. Demissie, "Prevalence and factors associated with trachoma among primary school children in Harari region, eastern Ethiopia," vol. 7, no. 3, p. OR. 37212, 2017. [CrossRef]
- L. Traoré et al., "Prevalence of trachoma in the Kayes region of Mali eight years after stopping mass drug administration," vol. 12, no. 2, p. e0006289, 2018. [CrossRef]
- M. Wu, Z. L. Hu, D. He, W. R. Xu, and Y. J. B. o. Li, "Trachoma in Yunnan province of southwestern China: findings from trachoma rapid assessment," vol. 18, pp. 1-6, 2018. [CrossRef]
- J. Favacho et al., "Prevalence of trachoma in school children in the Marajó Archipelago, Brazilian Amazon, and the impact of the introduction of educational and preventive measures on the disease over eight years," vol. 12, no. 2, p. e0006282, 2018. [CrossRef]
- A. R. Khokhar, S. Sabar, and N. J. J. T. J. o. t. P. M. A. Lateef, "Active trachoma among children of District Dera Ghazi Khan, Punjab, Pakistan: A cross sectional study," vol. 68, no. 9, pp. 1300-1303, 2018.
- A. Hansmann et al., "Low prevalence of scabies and impetigo in Dakar/Senegal: a cluster-randomised, cross-sectional survey," vol. 4, no. 2, p. e0002942, 2024. [CrossRef]
- S. Schneider, J. Wu, L. Tizek, S. Ziehfreund, A. J. J. o. t. E. A. o. D. Zink, and Venereology, "Prevalence of scabies worldwide—An updated systematic literature review in 2022," vol. 37, no. 9, pp. 1749-1757, 2023. [CrossRef]
- T. Haile, T. Sisay, and T. J. P. A. M. J. Jemere, "Scabies and its associated factors among under 15 years children in Wadila district, Northern Ethiopia, 2019," vol. 37, no. 1, 2020.
- G. Ararsa, E. Merdassa, T. Shibiru, and W. J. P. o. Etafa, "Prevalence of scabies and associated factors among children aged 5–14 years in Meta Robi District, Ethiopia," vol. 18, no. 1, p. e0277912, 2023. [CrossRef]
- R. M. Andrews, J. McCarthy, J. R. Carapetis, and B. J. J. P. C. Currie, "Skin disorders, including pyoderma, scabies, and tinea infections," vol. 56, no. 6, pp. 1421-1440, 2009. [CrossRef]
- K. Hajissa, M. A. Islam, A. M. Sanyang, and Z. J. P. n. t. d. Mohamed, "Prevalence of intestinal protozoan parasites among school children in africa: A systematic review and meta-analysis," vol. 16, no. 2, p. e0009971, 2022. [CrossRef]
- N. Dagne and A. J. J. o. P. R. Alelign, "Prevalence of intestinal protozoan parasites and associated risk factors among school children in merhabete District, Central Ethiopia," vol. 2021, no. 1, p. 9916456, 2021. [CrossRef]
- D. Tegen, D. J. C. J. o. I. D. Damtie, and M. Microbiology, "Prevalence and risk factors associated with intestinal parasitic infection among primary school children in Dera district, northwest Ethiopia," vol. 2021, no. 1, p. 5517564, 2021. [CrossRef]
- D. Chilot, D. G. Belay, K. Shitu, B. Mulat, A. Z. Alem, and D. M. J. B. o. Geberu, "Prevalence and associated factors of common childhood illnesses in sub-Saharan Africa from 2010 to 2020: a cross-sectional study," vol. 12, no. 11, p. e065257, 2022. [CrossRef]
- I. Simionato de Assis et al., "Social determinants, their relationship with leprosy risk and temporal trends in a tri-border region in Latin America," vol. 12, no. 4, p. e0006407, 2018.
- T. A. Houweling et al., "Socioeconomic inequalities in neglected tropical diseases: a systematic review," vol. 10, no. 5, p. e0004546, 2016. [CrossRef]
- R. Klingele, Hararghe Farmers on the Cross-roads Between Subsistence & Cash Economy. United Nations Development Programme, Emergencies Unit for Ethiopia, 1998.
- B. A. Rahimi et al., "Prevalence of soil-transmitted helminths and associated risk factors among primary school children in Kandahar, Afghanistan: A cross-sectional analytical study," vol. 17, no. 9, p. e0011614, 2023.
- I. B. Y. Brahmantya, H. H. P. Iqra, I. G. N. B. R. Mulya, I. A. W. Anjani, I. M. Sudarmaja, and C. J. O. A. M. J. o. M. S. Ryalino, "Risk factors and prevalence of soil-transmitted helminth infections," vol. 8, no. A, pp. 521-524, 2020. [CrossRef]
- F. Samuel, A. Demsew, Y. Alem, and Y. J. B. P. H. Hailesilassie, "Soil transmitted Helminthiasis and associated risk factors among elementary school children in ambo town, western Ethiopia," vol. 17, pp. 1-7, 2017. [CrossRef]
- R. C. Waite, G. Woods, Y. Velleman, and M. C. J. I. h. Freeman, "Collaborating to develop joint water, sanitation and hygiene (WASH) and neglected tropical disease (NTD) sector monitoring: an expert consultation," vol. 9, no. 4, pp. 215-225, 2017. [CrossRef]
- W. J. G. W. H. O. Water, "sanitation and hygiene for accelerating and sustaining pro-gress on neglected tropical diseases," pp. 1-6, 2015.
- Z. Salou Bachirou et al., "WASH and NTDs: Outcomes and lessons learned from the implementation of a formative research study in NTD skin co-endemic communities in Benin," vol. 10, p. 1022314, 2023. [CrossRef]
Figure 1.
Nutrional statuses of children in selected urban slum and rural households in Eastern Ethiopia, 2024.
Figure 1.
Nutrional statuses of children in selected urban slum and rural households in Eastern Ethiopia, 2024.
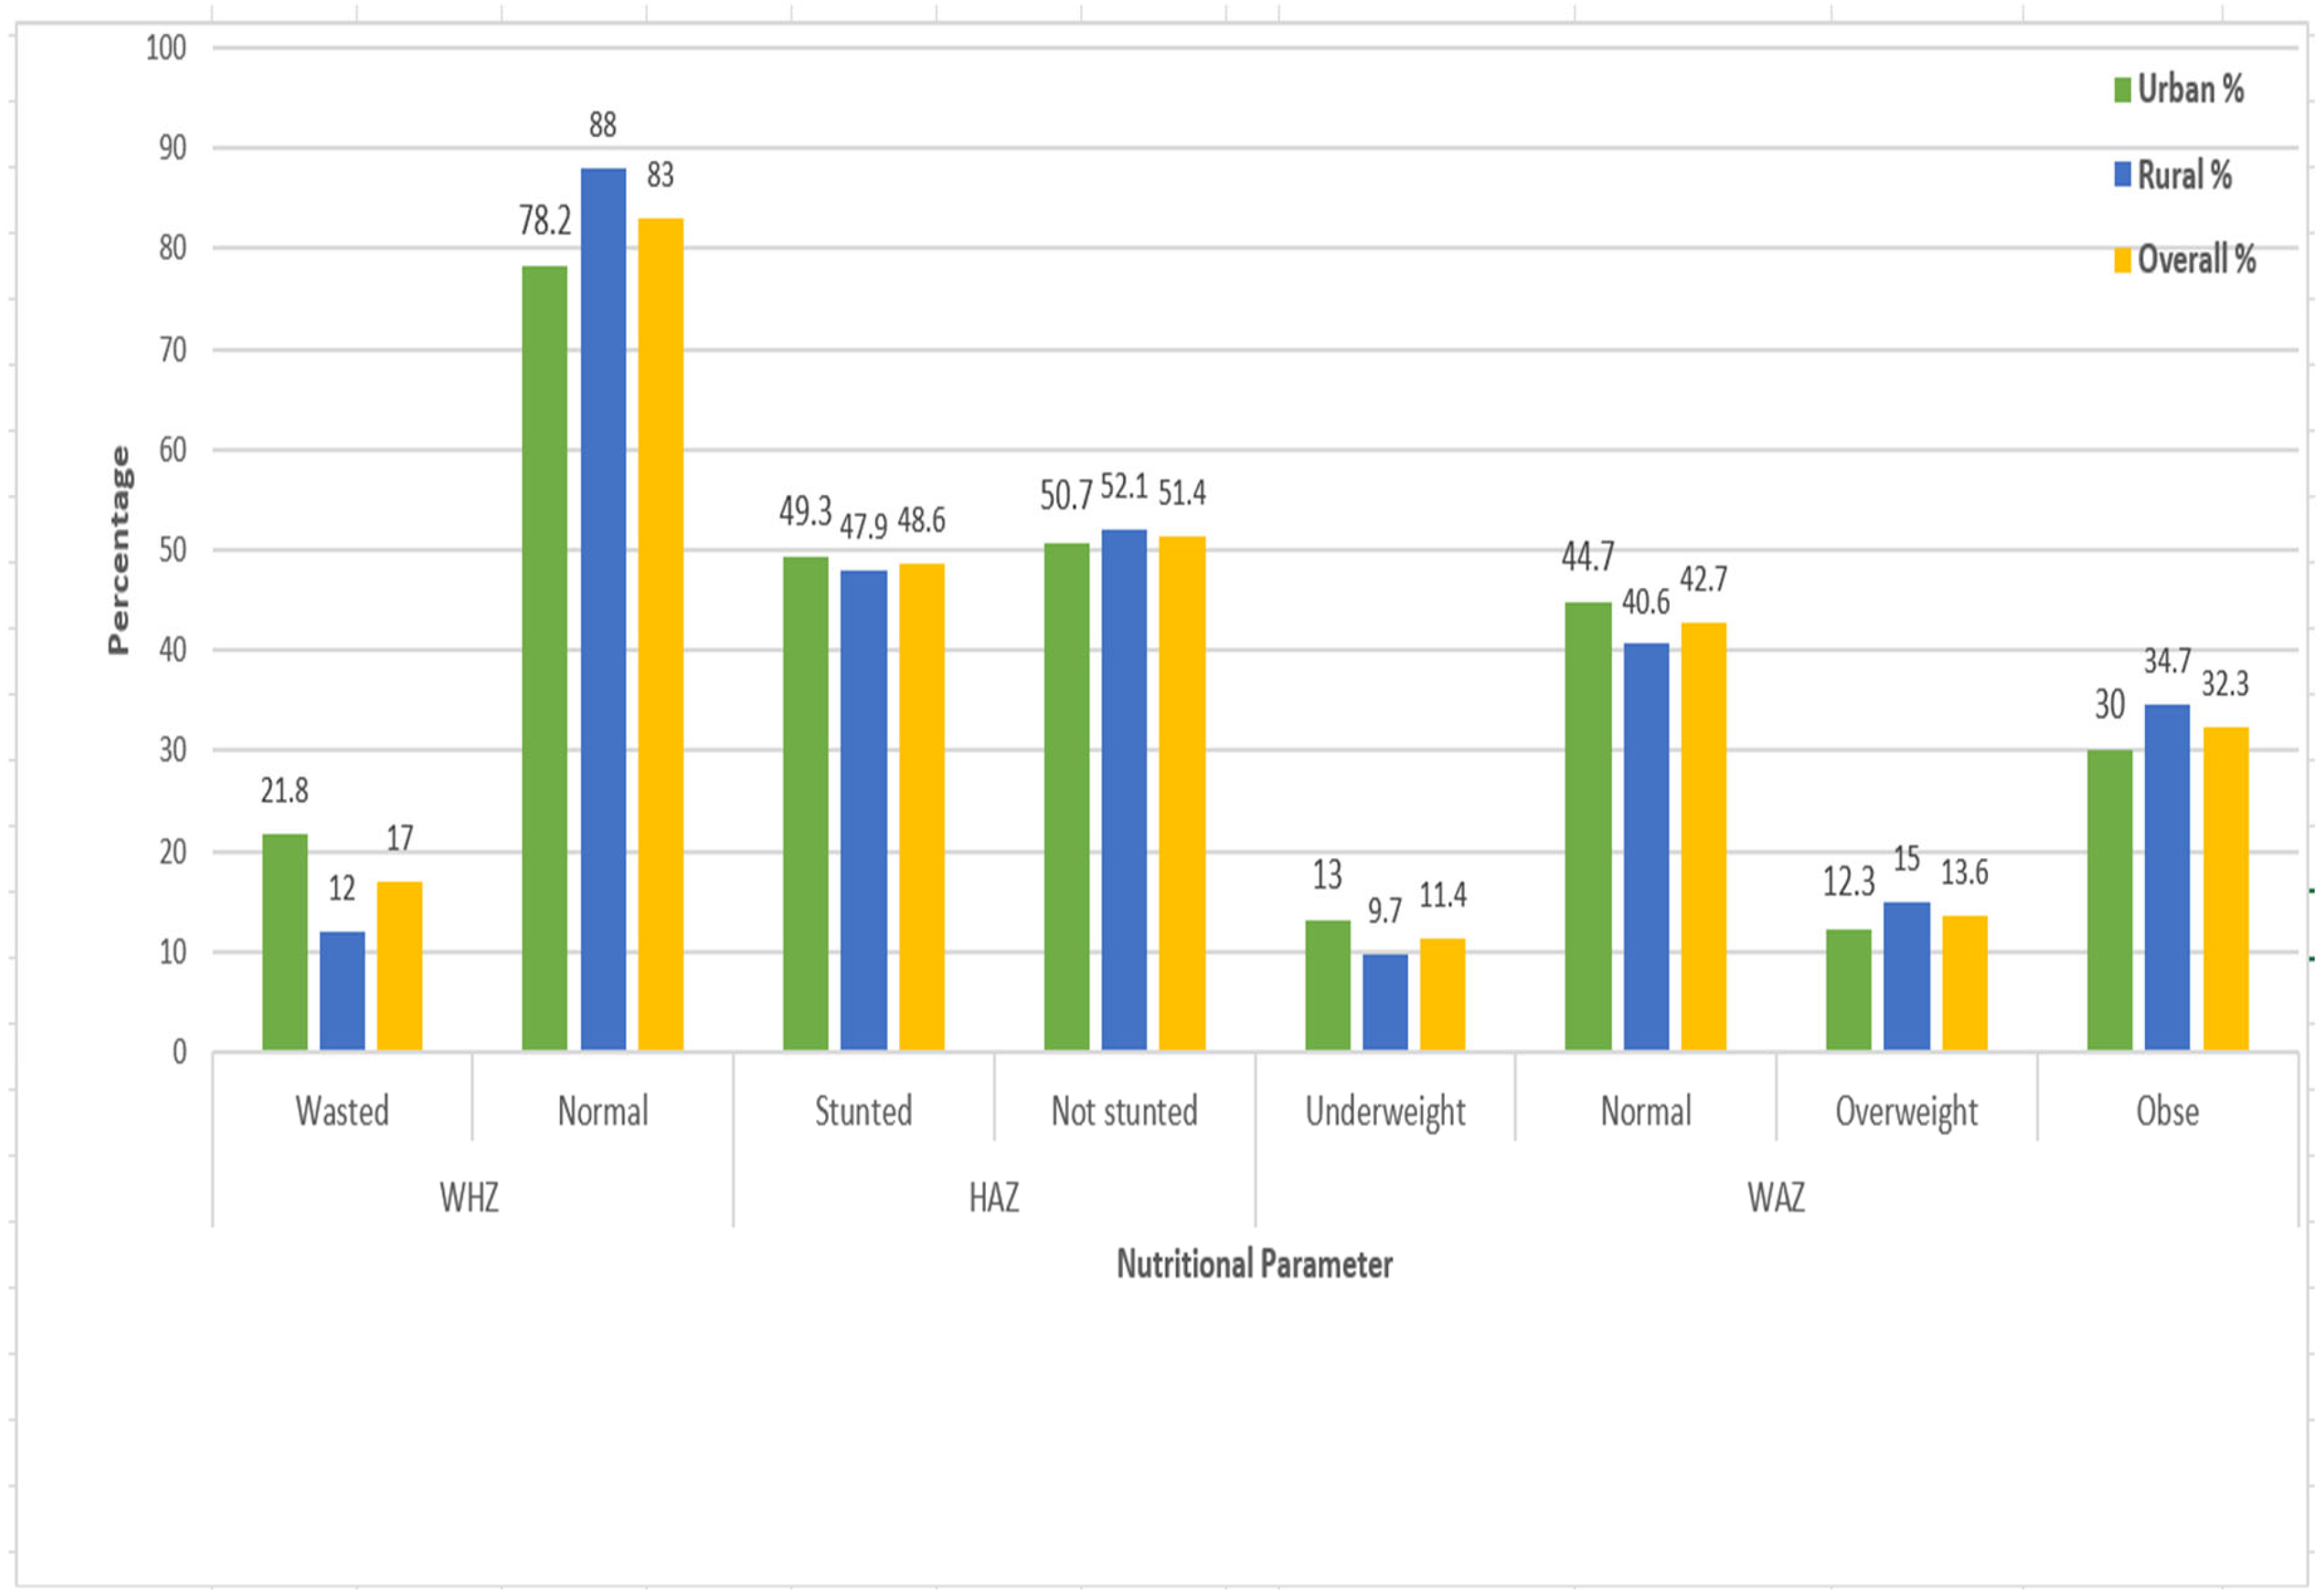
Figure 2.
Prevalence of NTDs in Urban slum and rural communities in Eastern Ethiopia, 2024.
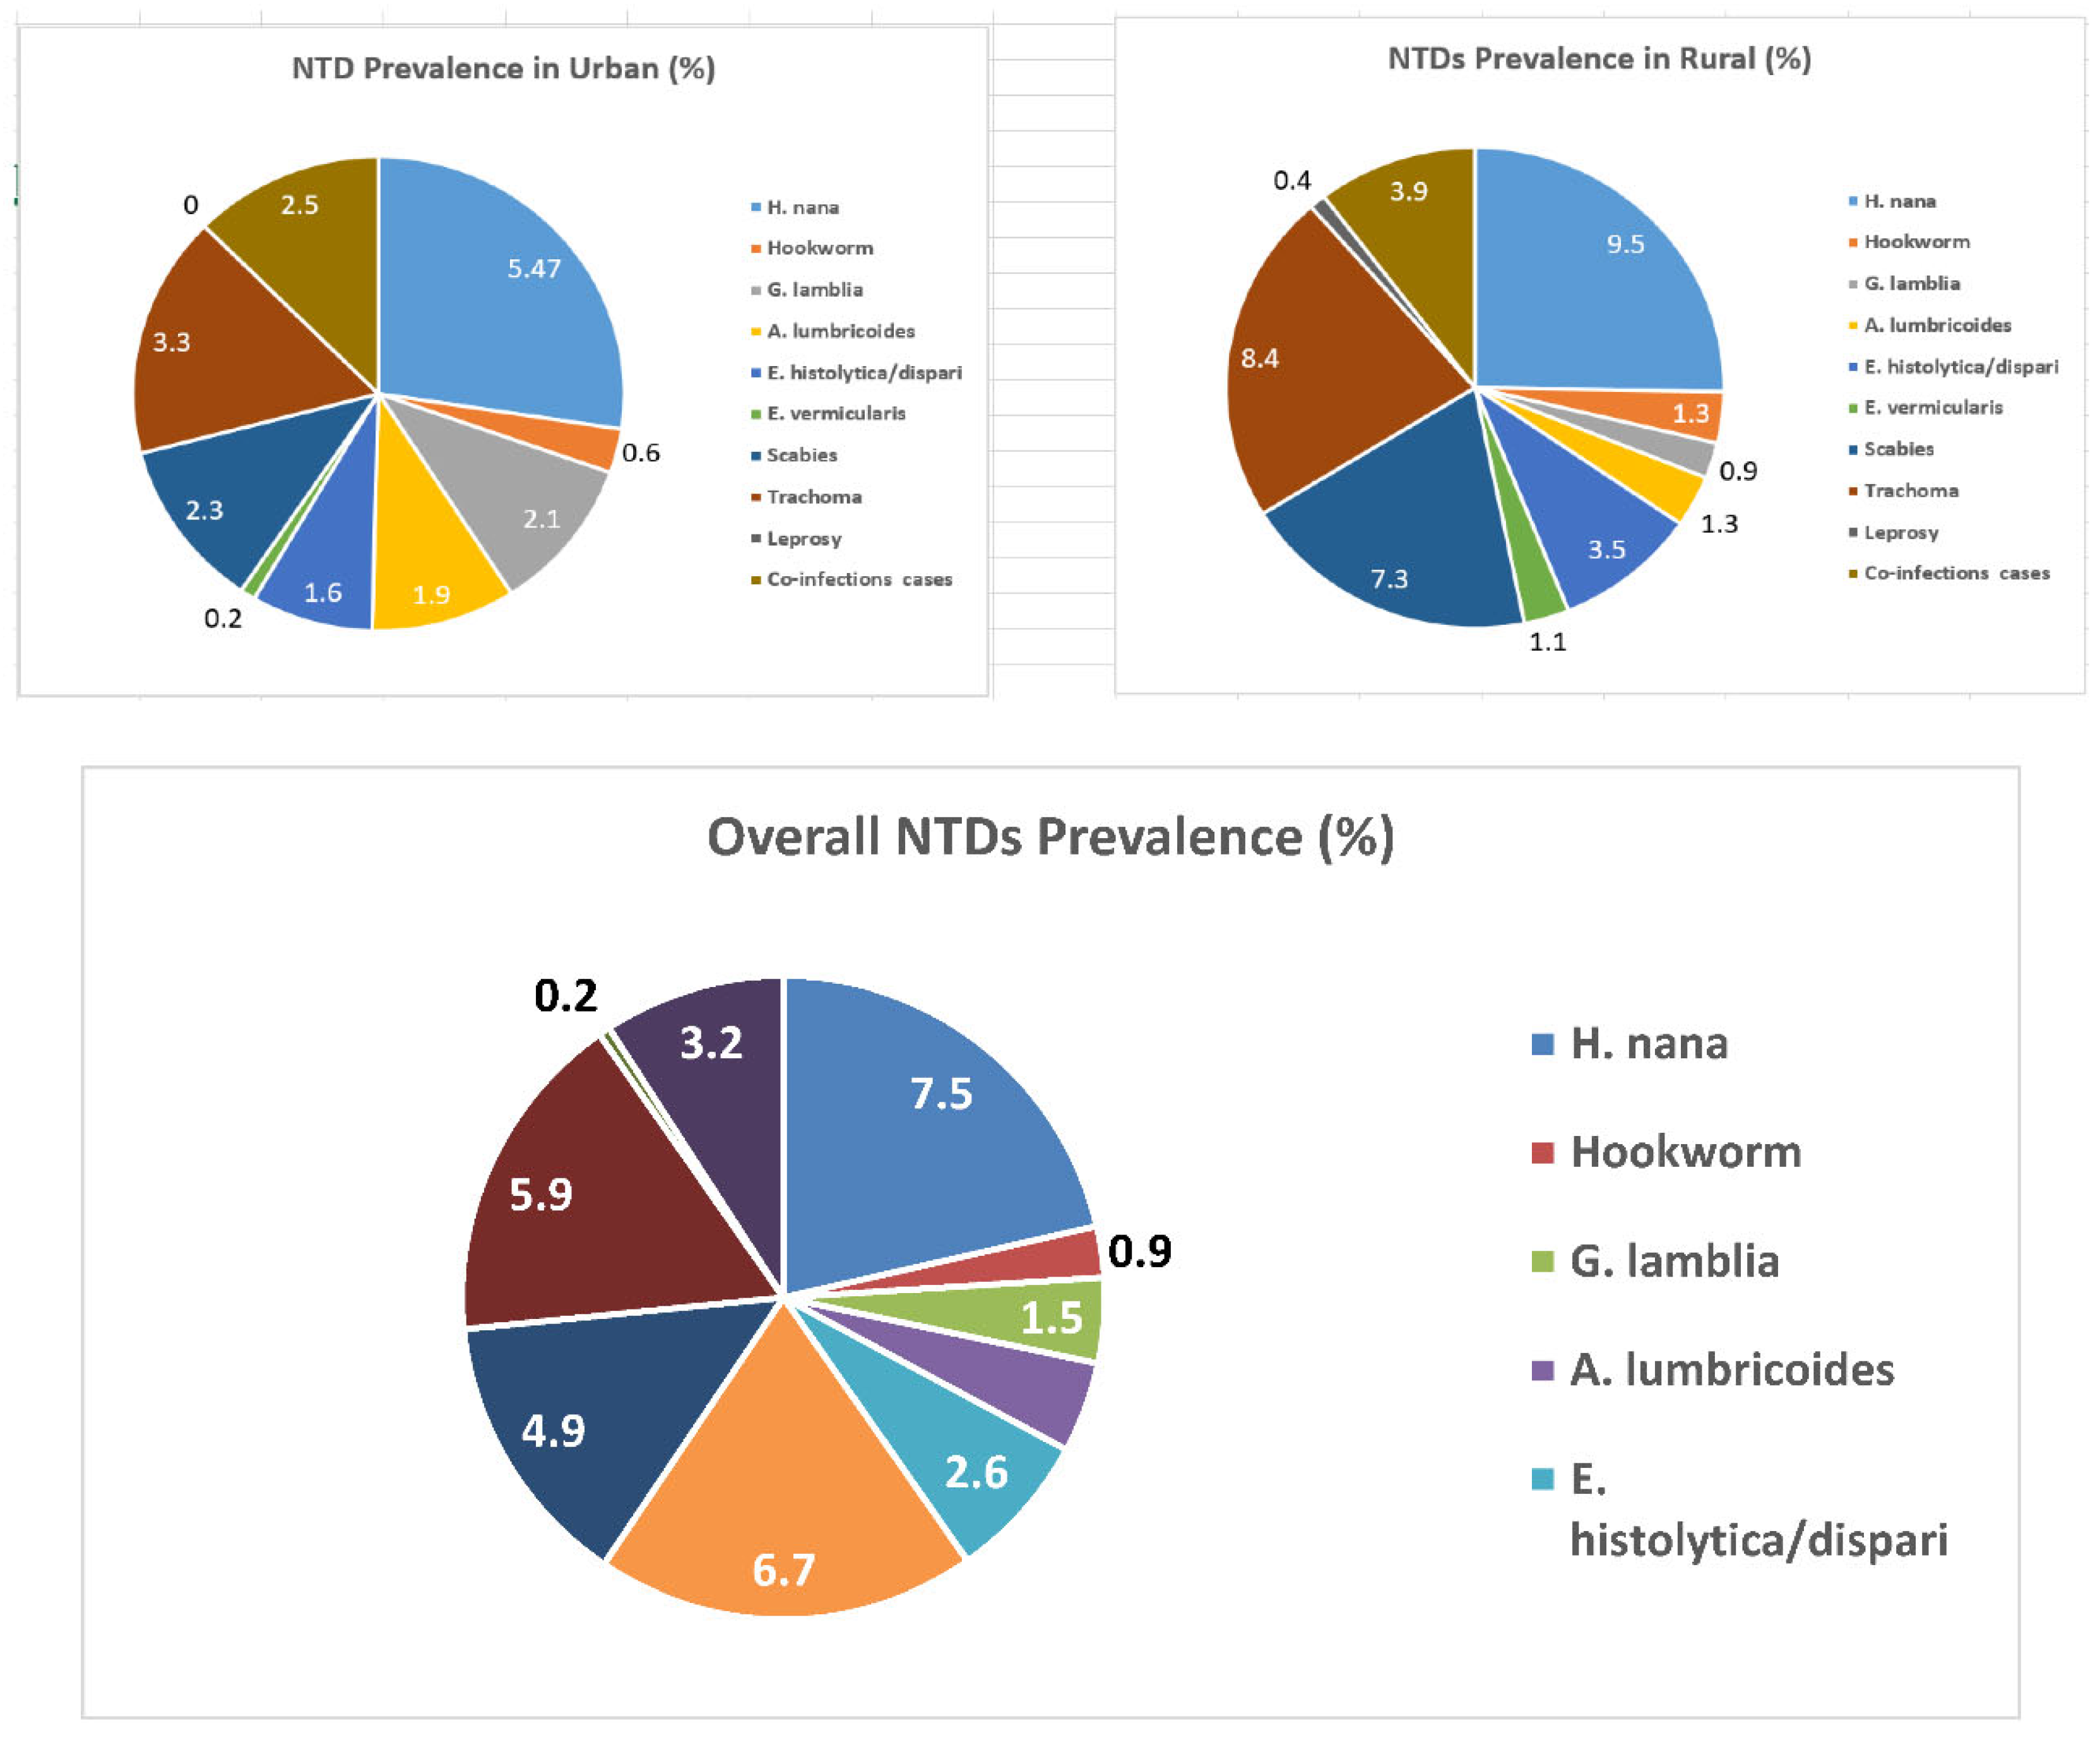
Table 1.
Socio demographic characterstics of households in urban slum and rural settings in Eastern Ethiopia.
Table 1.
Socio demographic characterstics of households in urban slum and rural settings in Eastern Ethiopia.
| Variable | Responses categories | Urban | Rural | Total | |||
|---|---|---|---|---|---|---|---|
| Freq. | % | Freq. | % | Freq. | % | ||
| Caregivers’ age category | 15 to 29 years | 200 | 39 | 193 | 36 | 393 | 38 |
| 30 to 44 years | 256 | 50 | 313 | 58 | 569 | 54 | |
| 45 and above years | 56 | 11 | 30 | 6 | 86 | 8 | |
| Caregivers’ education status | No formal education | 172 | 33 | 376 | 70 | 548 | 52 |
| Read and write | 155 | 30 | 55 | 10 | 210 | 20 | |
| Primary school | 63 | 12 | 40 | 7.5 | 103 | 10 | |
| Secondary school | 14 | 3 | 39 | 7.5 | 53 | 5 | |
| College and above | 108 | 21 | 26 | 5 | 134 | 13 | |
| Caregivers’ marital status | Single | 0 | 0 | 1 | 0.2 | 1 | 0.1 |
| Married | 455 | 89 | 509 | 95 | 964 | 92 | |
| Separated/divorced | 57 | 11 | 26 | 4.8 | 83 | 7.9 | |
| Occupation of caregivers | Farmer | 6 | 1 | 244 | 45 | 230 | 22 |
| Merchant | 160 | 31 | 23 | 4 | 183 | 34 | |
| Employed | 167 | 33 | 36 | 7 | 203 | 194 | |
| Housewife | 69 | 13 | 206 | 38 | 275 | 26 | |
| Others | 110 | 21 | 27 | 5 | 137 | 13 | |
| Monthly income | Low income | 148 | 29 | 429 | 80 | 577 | 55 |
| Good income | 364 | 71 | 107 | 20 | 471 | 45 | |
| Type of energy source for cooking | Wood/animal mud | 268 | 52 | 532 | 99 | 800 | 76 |
| Electricity | 244 | 48 | 4 | 1 | 248 | 24 | |
| Family size | 0 to 5 years | 324 | 63 | 205 | 38 | 529 | 50.5 |
| ➢ 5 years | 188 | 37 | 331 | 62 | 519 | 49.5 | |
| Number of children | 1 to 3 | 372 | 73 | 253 | 47 | 625 | 60 |
| ≥ 4 | 140 | 27 | 283 | 53 | 423 | 40 | |
| Child birth order | 1st | 172 | 33 | 152 | 28 | 324 | 309 |
| 2nd | 164 | 32 | 129 | 24 | 293 | 55 | |
| 3rd | 115 | 22 | 115 | 21 | 230 | 22 | |
| 4th and above | 61 | 12 | 140 | 26 | 201 | 19 | |
| Child sex | Male | 273 | 53 | 252 | 47 | 525 | 50.1 |
| Female | 239 | 47 | 284 | 53 | 523 | 49.9 | |
| Child age catagories | 0 to 5 years | 178 | 35 | 205 | 4 | 383 | 36 |
| 6 to 10 years | 207 | 40 | 225 | 42 | 432 | 40 | |
| 11 to 15 years | 102 | 20 | 97 | 18 | 199 | 19 | |
| 16 to 18 years | 25 | 5 | 9 | 1.5 | 34 | 3 | |
| Child education | Under School | 91 | 18 | 114 | 21 | 205 | 19 |
| Primary School | 293 | 57 | 301 | 56 | 594 | 57 | |
| Secondary School | 24 | 5 | 3 | 0.5 | 27 | 2 | |
| Not Attending School | 104 | 20 | 118 | 22 | 222 | 21 | |
Table 2.
Behavioural characterstics of children in selected urban slum and rural households in Eastern Ethiopia, 2024.
Table 2.
Behavioural characterstics of children in selected urban slum and rural households in Eastern Ethiopia, 2024.
| Variable | Responses catagories | Urban | Rural | Total | |||
|---|---|---|---|---|---|---|---|
| Freq. | % | Freq. | % | Freq. | % | ||
| Sharing clothes | Yes | 270 | 52.7 | 408 | 76 | 678 | 64.7 |
| No | 242 | 47.3 | 128 | 24 | 370 | 35.3 | |
| Waring shoes | Yes | 381 | 74.4 | 335 | 62 | 716 | 68.3 |
| No | 131 | 25.6 | 201 | 38 | 332 | 31.7 | |
| Child nail trimmed | Yes | 308 | 60 | 244 | 45 | 552 | 52.7 |
| No | 204 | 40 | 292 | 55 | 496 | 47.3 | |
| Child playing habit with soil | Yes | 217 | 42.4 | 396 | 74 | 613 | 58.5 |
| No | 295 | 56.6 | 140 | 26 | 435 | 41.5 | |
| Raw vegitable eating habit | Yes | 319 | 62 | 208 | 39 | 527 | 50.3 |
| No | 193 | 38 | 328 | 61 | 521 | 49.7 | |
| Number of critical times of child hand washing | One critical time | 79 | 15 | 279 | 52 | 358 | 34 |
| Two critical times | 223 | 43 | 193 | 36 | 416 | 40 | |
| Three or more critical times | 210 | 42 | 64 | 12 | 274 | 26 | |
| Frequency of washing child face per day | Once | 79 | 15 | 319 | 59 | 398 | 38 |
| Twowice | 202 | 39 | 144 | 27 | 346 | 33 | |
| Three or more times | 231 | 45 | 73 | 14 | 304 | 29 | |
| How do the child wash his/her face | Water only | 238 | 46.5 | 416 | 78 | 654 | 62 |
| Water and soap | 274 | 53.5 | 120 | 22 | 394 | 38 | |
| Are there flies on child face? | Yes | 126 | 24.6 | 337 | 63 | 463 | 44 |
| No | 386 | 75.4 | 199 | 37 | 585 | 56 | |
| Where does the child deficate last time? | Potty/diaper | 101 | 19.6 | 10 | 1.9 | 111 | 10.6 |
| Toilet | 18 | 3.4 | 7 | 1.3 | 25 | 24 | |
| Open ground | 123 | 24.3 | 365 | 68.1 | 488 | 45.6 | |
| Others | 270 | 52.7 | 154 | 28.7 | 424 | 40.4 | |
| When does the water container cleaned? | Today or yesterday | 37 | 7 | 43 | 9 | 80 | 7.6 |
| Three to seven days before | 269 | 52 | 196 | 36 | 465 | 44.4 | |
| Before a week | 193 | 38 | 168 | 31 | 361 | 34 | |
| Don’t remember | 13 | 3 | 129 | 28 | 142 | 13.5 | |
| Are all water containers clean? | Yes | 344 | 67 | 231 | 43 | 575 | 55 |
| No | 168 | 33 | 305 | 57 | 473 | 45 | |
| Where does the child take bath usually? | Bathroom | 18 | 3.5 | 4 | 0.7 | 22 | 2 |
| Toilet | 177 | 34.5 | 22 | 4 | 199 | 19 | |
| Inside home | 265 | 52 | 293 | 55 | 558 | 53 | |
| Others | 52 | 10 | 217 | 40 | 269 | 26 | |
| How do you wash kitchen utinsils? | With cold water only | 144 | 28 | 405 | 75 | 549 | 52 |
| Hot water only | 16 | 3 | 9 | 1.7 | 25 | 2.1 | |
| Cold water with soap | 343 | 66.8 | 121 | 22.6 | 464 | 44 | |
| Hot water with soap | 9 | 0,2 | 1 | 0.2 | 10 | 0.9 | |
| Do you often buy food from street venders for your children? | Yes | 205 | 40 | 143 | 26.7 | 348 | 33 |
| No | 307 | 60 | 393 | 73.3 | 700 | 67 | |
| Do you use animal face fertilizer? | Yes | 13 | 30 | 345 | 83 | 358 | 78 |
| No | 30 | 70 | 70 | 17 | 100 | 22 | |
Table 3.
Environmental factors of selected urban slum and rural households in Eastern Ethiopia, 2024.
Table 3.
Environmental factors of selected urban slum and rural households in Eastern Ethiopia, 2024.
| Variable | Responses catagories | Urban | Rural | Total | |||
|---|---|---|---|---|---|---|---|
| Freq. | % | Freq. | % | Freq. | % | ||
| Type of drinking water source | Improved | 502 | 98 | 386 | 72 | 888 | 84.7 |
| Unimproved | 10 | 2 | 150 | 28 | 160 | 15.3 | |
| Type of water container used | Noarrow mouthed | 353 | 69 | 502 | 94 | 855 | 81.6 |
| Wide mouthed | 20 | 3.9 | 11 | 2 | 31 | 3 | |
| Both type | 139 | 27.1 | 23 | 4 | 162 | 15.4 | |
| Does all water containers covered? | Yes | 261 | 51 | 176 | 32.8 | 437 | 41.7 |
| No | 239 | 46.7 | 336 | 62.7 | 575 | 54.9 | |
| Some only | 12 | 2.3 | 24 | 4.5 | 36 | 3.4 | |
| Methods of withdrawing water | Pouring | 342 | 66.8 | 464 | 86 | 806 | 77 |
| Dipping with cup | 9 | 1.7 | 30 | 5.6 | 39 | 3.7 | |
| Both pouring and dipping | 138 | 2.7 | 39 | 7.3 | 177 | 16.9 | |
| Using spigot/tap | 23 | 4.5 | 3 | 0.6 | 26 | 2.5 | |
| Amount of water used per day per capita | < 20 litter | 464 | 90.6 | 474 | 88 | 938 | 89 |
| > 20 litters | 48 | 9.4 | 62 | 11 | 110 | 10.5 | |
| Do you treat your drinking water? | Yes | 128 | 25 | 14 | 2.6 | 142 | 13.5 |
| No | 384 | 75 | 522 | 97.4 | 906 | 76.5 | |
| Did you experience any water shortage within the previous one months? | Yes | 420 | 82 | 278 | 51.9 | 698 | 66.6 |
| No | 92 | 18 | 258 | 48.1 | 350 | 33.4 | |
| Have you satisfied with the existing water service | Yes | 43 | 8.4 | 275 | 51 | 318 | 30.3 |
| No | 469 | 91.6 | 261 | 49 | 730 | 69.7 | |
| Availability of latrine? | Yes | 416 | 81 | 388 | 72 | 804 | 76.7 |
| No | 96 | 19 | 148 | 28 | 244 | 23.3 | |
| Type of latrine in use? | Improved latrine | 205 | 49 | 54 | 38 | 259 | 24.7 |
| Unimproved latrine | 211 | 51 | 334 | 62 | 545 | 75.3 | |
| Latrine distance from home | < 50 meters | 416 | 100 | 375 | 96.6 | 791 | 98.4 |
| >50 meters | 0 | 0 | 13 | 3.4 | 13 | 1.6 | |
| Latrine distance from the sirect water source | < 250 meter | 414 | 99.5 | 193 | 49.7 | 607 | 75.5 |
| > 250 meters | 2 | 0.5 | 195 | 50.3 | 197 | 24.5 | |
| Faces in the latrine ground | Yes | 89 | 21.4 | 198 | 63 | 287 | 35.7 |
| No | 327 | 78.6 | 190 | 37 | 517 | 64.3 | |
| Flies in the latrine | Yes | 224 | 53.8 | 357 | 92 | 581 | 72 |
| No | 192 | 46.2 | 31 | 8 | 223 | 28 | |
| Are there feces on the ground of the compound? | Yes | 333 | 65 | 245 | 25 | 578 | 55 |
| No | 179 | 35 | 291 | 75 | 470 | 45 | |
| Presence of animal dung in the compound | Yes | 79 | 16 | 415 | 77 | 494 | 47 |
| No | 433 | 84 | 121 | 23 | 554 | 53 | |
| Presence of liquid west in the compound | Yes | 206 | 40 | 367 | 68 | 573 | 54.7 |
| No | 306 | 60 | 168 | 32 | 474 | 45.3 | |
| Availability of hand washing set up | Yes | 2 | 0.4 | 8 | 1.5 | 32 | 3 |
| No | 488 | 99.6 | 528 | 98.5 | 1,016 | 97 | |
| Presence of livestock | Yes | 43 | 8.4 | 415 | 77 | 458 | 43.7 |
| No | 469 | 91.6 | 121 | 23 | 590 | 55.3 | |
Table 4.
Clinical factors of children in selected urban slum and rural households in Eastern Ethiopia, 2024.
Table 4.
Clinical factors of children in selected urban slum and rural households in Eastern Ethiopia, 2024.
| Variable | Responses catagories | Urban | Rural | Total | |||
|---|---|---|---|---|---|---|---|
| Freq | % | Freq. | % | Freq. | % | ||
| Presence of any trauma | Yes | 12 | 97.6 | 26 | 4.8 | 38 | 4 |
| No | 500 | 2.4 | 510 | 95.2 | 1,010 | 96 | |
| History of NTDs | Yes | 57 | 11 | 100 | 18.7 | 157 | 15 |
| No | 455 | 89 | 436 | 81.3 | 891 | 85 | |
| Dewarming/anti parasitic drug within the previous two weeks | Yes | 480 | 95 | 501 | 93 | 981 | 93.6 |
| No | 32 | 5 | 35 | 7 | 67 | 6.4 | |
| Does any family member have beed diagnosed any NTD? | Yes | 77 | 15 | 185 | 34 | 262 | 25 |
| No | 435 | 85 | 351 | 66 | 786 | 75 | |
| Are you regular user of health insurance? | Yes | 283 | 55 | 493 | 92 | 776 | 74 |
| No | 229 | 45 | 43 | 8 | 272 | 26 | |
| Does the cost significantly influence your health care service? | Yes | 322 | 63 | 245 | 45.7 | 567 | 54 |
| Some what | 169 | 33 | 212 | 39.6 | 381 | 36.5 | |
| No | 21 | 4 | 79 | 14.7 | 100 | 9.5 | |
| Awarnes about NTDs | Yes | 383 | 74 | 326 | 60.8 | 709 | 67.6 |
| No | 129 | 26 | 210 | 39.2 | 339 | 32.4 | |
| From where you frequently got health care information | Health workers | 161 | 31 | 396 | 74 | 557 | 53 |
| Mass media | 234 | 46 | 10 | 2 | 244 | 44.3 | |
| Others | 17 | 3 | 11 | 2 | 28 | 2.7 | |
| Do any of the children have NTD in the previous two months? | Yes | 61 | 12 | 86 | 16 | 147 | 14 |
| No | 451 | 88 | 450 | 84 | 901 | 86 | |
Table 5.
Types of NTDs diagnosed among children in selected urban slum and rural households in Eastern Ethiopia from February 25 to April 30, 2023.
Table 5.
Types of NTDs diagnosed among children in selected urban slum and rural households in Eastern Ethiopia from February 25 to April 30, 2023.
| Category of NTDs | Type of NTD diagnosed | Urban (Freq.) | Rural (Freq.) | Total (Freq.) |
|---|---|---|---|---|
| STH | H. nana | 19 | 43 | 62 |
| Hookworm | 3 | 6 | 9 | |
| A. lumbricoides | 6 | 7 | 13 | |
| E. vermicularis | 1 | 6 | 7 | |
| Protozoa | E. histolytica/dispari | 5 | 13 | 18 |
| G. lamblia | 8 | 1 | 9 | |
| Eye infection | Trachoma | 13 | 35 | 48 |
| Skin diseases | Scabies | 9 | 26 | 35 |
| Leprosy | 0 | 1 | 1 | |
| Mixed infections | A. lumbricoides and H.nona | 4 | 0 | 4 |
| A. lumbricoides and Scabies | 0 | 4 | 4 | |
| H. nana and Scabies | 2 | 3 | 5 | |
| H. nana and Trachoma | 3 | 5 | 8 | |
| E. histolytica/dispari and G. lamblia | 3 | 0 | 3 | |
| E. histolytica/dispari and Trachoma | 0 | 3 | 3 | |
| E. histolytica/dispari and Scabies | 0 | 3 | 3 | |
| Hookworm and Scabies | 0 | 1 | 1 | |
| Trachoma and Scabies | 1 | 1 | 2 | |
| Leprosy, Scabies and Trachoma | 0 | 1 | 1 | |
| Total NTD positive cases | 77 | 159 | 236 | |
Disclaimer/Publisher’s Note: The statements, opinions and data contained in all publications are solely those of the individual author(s) and contributor(s) and not of MDPI and/or the editor(s). MDPI and/or the editor(s) disclaim responsibility for any injury to people or property resulting from any ideas, methods, instructions or products referred to in the content. |
© 2024 by the authors. Licensee MDPI, Basel, Switzerland. This article is an open access article distributed under the terms and conditions of the Creative Commons Attribution (CC BY) license (http://creativecommons.org/licenses/by/4.0/).
Copyright: This open access article is published under a Creative Commons CC BY 4.0 license, which permit the free download, distribution, and reuse, provided that the author and preprint are cited in any reuse.