Submitted:
20 October 2024
Posted:
21 October 2024
You are already at the latest version
Abstract
Breast cancer is a global concern as a leading cause of death for women. Early and precise diagnosis can be vital in handling the disease efficiently. Breast cancer subtyping based on estrogen receptor (ER) status is crucial for determining prognosis and treatment. This study uses metabolomics data from plasma samples to detect metabolite biomarkers that could distinguish ER-positive from ER-negative breast cancers in a non-invasive manner. The dataset includes demographic information, ER status, and metabolite levels from 188 breast cancer patients and 73 healthy controls. Supervised, unsupervised, and ensemble machine learning (ML) algorithms were applied to identify key metabolites associated with ER status, including Support Vector Machines (SVM), Multidimensional Scaling (MS), Logistic Regression (LR), and Ensemble learning. The most informative feature set, containing 28 biomarkers and two demographic factors, achieved an impressive 96% accuracy and an area under the curve (AUC) of 93% using the Logistic Regression model. These results suggest that ML has great promise for identifying specific metabolites linked to ER expression, paving the development of a novel analytical tool that can minimize current lab challenges such as analytical sample handling, subjective results interpretation, biological heterogeneity of the tumor in a non-invasive and efficient manner aiding in more precise diagnosis of breast cancer.
Keywords:
Estrogen receptors
; Breast cancer
; Metabolomics
; Machine learning models
1. Introduction
Every breast cancer subtype can be characterized by histological and molecular features and their intrinsic heterogeneity leads to an array of clinical presentation and different responses to therapy. Histological subtypes include mainly ductal and lobular carcinomas. The molecular classification of breast cancer was initially made using gene expression analysis and hierarchical clustering, which can be abridged based on the presence or absence of hormone receptors for estrogen (ER) and progesterone (PR) as well as the human epidermal growth factor receptor 2 (HER2). Combining these classifications creates four main breast cancer subtypes. Luminal A tumors are ER positive and PR positive, but negative for HER2, while ER positive, PR negative and HER2 positive are classified as Luminal B, which can be more aggressive than Luminal A. HER2-positive subtype is overexpressing HER2 gene and lacking both hormone receptors (ER-negative and PR-negative). Finally, tripe-negative breast cancer (TNBC) lacks all three established receptors (ER-negative, PR-negative and HER2-negative).
Understanding the specific subtype based on hormone receptor status and HER2 is crucial mainly because estrogen, in its primary form, 17β-estradiol (E2), has a vital role in breast cancer development, particularly in postmenopausal women [1]. When estrogen binds to receptors located on the surface of the cancer cells, it triggers signals within the cell that promote growth and division. In general, cancer cells that express hormone receptors for the estrogen (ER-positive) have a better prognosis than those that do not (ER-negative) [2]. ER-positive breast cancer is also the most common type, affecting over 60% of cases. Although they are dependent on estrogen to growth, women with ER-positive cancers have better outcomes if they are lacking progesterone receptor (PR) and human epidermal growth factor receptor 2 (HER2) receptors (ER+/PR-/HER2-). ER-negative cancers include triple-negative breast cancer, or TNBC (ER-/PR-/HER2-), which has the poorest survival rate [3]. In addition, estrogen receptor (ER) status affects mortality risk for white and black women with breast cancer [4].
In this regard, unlike Black women, White women with ER-positive tumors had a higher risk of death, underscoring the complexity of hormone receptors in breast cancer [5]. Indeed, both hormone receptor variation as well as tumor heterogeneity may influence breast cancer treatment [6]. Discordance in the level of expression of hormone receptors can be a good indicator in developing non-invasive disease detection and targeted treatment methods [7]. The analysis of different metabolites in the body fluids can facilitate the subtyping of breast cancer and present a viable clinical application. In this regard, studies have found that metabolite levels vary between healthy people and breast cancer patients, thus providing promising scope for the early detection of this type of cancer in premenopausal women [8,9].
The traditional approach for the classification of breast cancer subtypes has largely focused on invasive biopsies that make histopathology analysis laborious and often painful for patients [10]. While several studies have already been conducted to explore the possibility of using metabolite panels as surrogate biomarkers for early detection of breast cancer, many fall short looking at differential metabolic signature representatives of the distinct breast cancer subtypes. Machine learning (ML) tools in the past decade have been used for extensive breast cancer classification using traditional biopsy data [11]. As breast cancer subtype analyses are normally performed from biopsy material and subsequent histopathological analysis, a need for exploring non-invasive detection methods can save time and minimize costs associated with successive biopsy procedures. Recent advancements allow for the analysis of plasma, serum, saliva, and urine metabolites, which can offer exciting possibilities for understanding the relationship between hormone receptor (HR) status and metabolite biomarkers in breast cancer subtyping [12]. The metabolomics platform has several distinct advantages including reliability and accuracy of the data, cost-effectiveness and rapid nature of the test. Metabolomics has the potential to detect metabolic imbalances, even at early disease onset, which enhances treatment outcomes. Identifying key small molecules can be crucial for differentiating between cancerous and healthy tissue and improving diagnosis accuracy [8].
Studies have shown that deep learning methods, such as neural networks, perform well over ML approaches in predicting breast cancer estrogen receptor (ER) status based on the metabolite data of a patient. An area under the curve (AUC) of 0.93 suggests that this approach is promising for future diagnostic tools [13]. Researchers studied 499 metabolites in breast cancer patients with localized tumors. They used five unsupervised ML methods (Principal component analysis (PCA), k-means, sparse k-means, spectral clustering, and SIMLR) to analyze the data and identify patient subgroups. This approach successfully distinguished patterns between patient subgroups, highlighting its effectiveness [14].
Understanding the metabolic pathways involved in cancer cells versus healthy individuals offers an opportunity to leverage tailored computational tools for subsequent predictive analysis [15]. Thus, metabolomics appears to be an adequate analytical approach to detect molecular differences between distinct groups. Along with a noninvasive approach to sample collection, an integrative approach to handling biomarker information can be proposed as a routine clinical practice for a comprehensive understanding of the disease [16]. By using advanced statistical methods on urine samples from breast cancer patients, researchers could find hidden patterns in the metabolome. This is particularly important for complex data such as plasma metabolomes, which can be noisy due to factors such as variations in cancer progression, individual genetics, and overlapping signals [17]. Research using ML analysis of blood serum metabolites has shown promise in distinguishing between breast cancer patients and healthy individuals. This approach holds the potential for a non-invasive diagnostic tool for breast cancer [18]. Accordingly, the present study was undertaken to explore the use of metabolomics to identify specific metabolic biomarkers in breast cancers patient with different hormone receptor status, which may provide the foundations to distinguish ER and HER2 receptor status, thus offering a significant impact on treatment options and improved survival.
2. Results
Patient’s Characteristics
The statistical distribution of demographic variables for Estrogen Receptor status is shown in Table 1. The mean age is higher for the ER-positive group (56.86 years old) compared to ER-negative group (52.97 years old). The mean BMI is slightly lower for the ER-positive group than for the ER-negative group. The proportion of people with a history of smoking is lower for the ER-positive group than for the ER-negative group. The proportion of people who are current smokers is lower for the ER-positive group than for the ER-negative group. The proportion of people who are White is lower for the ER-positive group than for the ER-negative group. The proportion of people who are Black is similar for both groups. A two-sampled t-test with assumptions of continuous, independent, normal distribution of the ER expression of breast cancer data yielded p-value less than 0.05 for age and smoking history demographic variables indicating a statistical significance.
Metabolomics Profiling and Model Creation
Various ML techniques were used to analyze normalized (brought to a standard scale) data, including unsupervised, supervised, and ensemble methods. Different sets of features were also tested to find the models and feature combinations that performed the best. Univariate Naive Bayes (NB) identified the top 20 most accurate features as depicted in Figure 1. PCA selected the top 68 features with the most significant loadings, and support vector machines with bagging selected 17 essential features. The results were combined with three ML to pinpoint metabolites that best predict their relationship to estrogen receptors. A rigorous validation technique called leave-one-out cross-validation was performed on the best-performing feature set to create reliable biomarkers. Additionally, ratios between the identified metabolites were incorporated to strengthen the biomarker panel.
Unsupervised Models
The classification of ER status using unsupervised ML methods by k-means clustering identified ER-positive cases well (high recall) but exhibited difficulty in correctly classifying ER-negative cases (low precision). This led to a high overall error rate. Multidimensional scaling (MDS) and Gaussian mixture models (GMM) achieved moderate overall accuracy (around 67%) but struggled to separate the ER-positive and ER-negative classes effectively. MDS excelled at identifying ER-positive cases but generated many false positives, suggesting the data structure might not be ideal for this method. GMM suffered from class imbalance, favoring ER-positive and missing most ER-negative cases. The current approaches struggle to handle class imbalance effectively and require adjustments to improve classification accuracy for ER-positive and ER-negative cases. Figure 2 compares the clustering variants’ performance and scatter plot for MDS. Support Vector Machine (SVM) with a k-means clustering approach achieved moderate overall accuracy due to class imbalance favoring the ER-positive class. Both classes’ high recall (80%) indicated good overall sensitivity. However, ER-negative cases had low precision (27%) due to a high false positive rate. Conversely, it achieved high precision (98%) for ER-positive cases, demonstrating suitable class identification. The significant difference in F1 scores (0.8 for ER- positive vs. 0.4 for ER-negative) highlighted the bias of this model towards the majority class.
Overall, 2D and 3D Principal Component Analysis (PCA) effectively reduced dimensionality while preserving crucial information from the original data with plots shown in Figure 3. 2D analysis by PCA components p3-p6 captured a high proportion of variance (over 90%), suggesting they contain the essential information for visualization and further analysis. However, p1 and p2 captured less variance, potentially containing less critical details or noise. Similarly, 3D analysis by PCA captured a higher proportion of variance (over 98%) in most components, indicating they hold the most valuable information. However, p2 captured slightly less variance. Alternative approaches or data preprocessing techniques might be necessary to address this issue. However, visual separation for both classes of ER was not evident, which may be attributed to metabolite noise.
The models explored in unsupervised learning showed a bias towards the ER-positive class. This is a crucial insight as it indicates a potential area of improvement for future studies. The results also showed high recall and lower precision for the ER-negative class and a high F1 score for the ER-positive class. This suggests that our models are more effective at identifying ER-positive cases. Overall, the accuracy of the tested methods improved from 67% to 80% with an ensemble combination of SVM with k-means clustering for identifying metabolites specific to the ER-positive class. These outcomes underscore the potential of supervised techniques for further classification and identifying specific metabolites for ER.
Supervised Models
Supervised learning methods outperformed unsupervised algorithms for this task, specifically the Multinomial classifier, compared to other variants (Categorical, Gaussian, and Bernoulli) of NB. Categorical and Bernoulli failed to identify any ER-negative cases. However, they achieved perfect accuracy for ER-positive cases. While they perfectly classified ER-positive cases, their overall performance could be better because of their incapability of handling the negative class. Gaussian NB showed some ability to classify both classes but achieved better results for ER-positive with accuracy (67%). Multinomial NB achieved the best average F1-score (0.65) across ER-negative and positive classes. All four variants performed significantly better at classifying the ER-positive class than the ER-negative class, indicating a class imbalance. This is evident from all models’ higher accuracy and F1-score for ER-positive. A comparison of performance across NB variants is shown in Figure 5. Multinomial NB handles this imbalance slightly better than others, but it is still a factor to consider. While Multinomial NB demonstrates the most balanced performance among the tested models, class imbalance remains challenging. Further cross-validation analysis with Multinomial Naive Bayes achieved the top 20 most informative variables for ER prediction, as in Figure 4.
A linear SVM kernel achieved good overall accuracy (81%) and F1-score (0.87), along with good precision (83%) and recall of 91% for the ER-positive class. The same kernel showed moderate performance on the ER-negative class with higher precision (77%) than recall (62%) and an F1-score of 0.69. By reducing dimensionality with PCA and focusing on the most relevant features, this approach can improve performance, reduce computational costs, and potentially offer valuable insights for data visualization. The results obtained were identical to the Linear SVM kernel, favoring the prediction of the ER-positive class better than the ER-negative class. Further SVM bagging analysis to combine the top 17 features with an ensemble learning technique to potentially enhance classification accuracy and gain insights into the most influential factors for predicting ER status showed an overall accuracy of 83% in predicting an ER-positive class, with perfect predictions of 100% and recall of 82%. Only 33% of the ER-negative class was accurately predicted with high recall and low precision.
Applying more weight to the ER-positive class, the 17 most influential variables relevant to Estrogen Receptor classification are shown in Figure 5, with the top 17 features relevant to ER-positive identified by SVM and Decision Tree (DT) models. The DT model predicted only 60% of the unseen data correctly. Applying the DT bagging approach yielded an accuracy of 81%, comparable to the SVM bagging approach. The ER-positive class performed well with high precision and recall of 89% and 86% and the F1-score. Again, the ER-negative class struggled to be classified and showed average performance with precision and recall at 58% and 64%. DT with bagging and SVM bagging models showed very similar classifications, indicating a potential bias for the ER-positive class due to class imbalance. Dimensional reduction using PCA on the top 17 features showed a drop in accuracy to 69%, compared to 83% for SVM with PCA. Figure 6 shows some separation for the ER-positive class by DT with two principal components. However, it could be a better separation.
The Multilayer Perception (MLP) model used in this study attained a high accuracy of 90% and classified two ER classes comparatively well. There was a good performance for ER-positive classes with high precision, recall, and f1-scores of 91%, 94%, and 0.93. ER-negative classes were also predicted with good precision of 86%, recall of 80%, and f1-score of 0.83. These results indicate that the MLP model, likely trained on the selected features, performed well in classifying ER status. Bagging and other feature selection methods for the top coefficients by MLP significantly underperformed, with performance accuracy dropping to approximately 79%. Figure 7 depicts the weighted averages of the top 13 features from MLP for ER-positive.
The Logistic Regression (LR) model used a subset of 30 features (including both demographic variables and metabolites) and achieved an excellent accuracy of 96% and an area under the curve (AUC) of 0.93, indicating that it correctly predicted 96% of the data points from each class. LR correctly classified 87% of the ER-negative instances, with perfect precision and recall at 100%. This model identifies ER positive and ER negative cases with high recall for both classes, which might indicate a potential class imbalance. In a comparison of performance, both MLP (90%) and LR (96%) models achieved high accuracy in classifying ER status, as shown in Figure 8. MLP performed well for both ER classes with a slight advantage for ER-positive (higher recall and F1-score). LR achieved very high accuracy, potentially due to class imbalance (indicated by the perfect recall for ER-negative, which might be the minority class). It identifies both classes well but requires further investigation into class balance. Bagging and other feature selection methods based on MLP coefficients underperformed compared to the original MLP model. MLP and LR seem promising ER classification options based on the selected features. However, further analysis of class imbalance and the potential cost of misclassification is recommended.
3. Discussion
The present study was undertaken to identify distinct metabolites that are more specific to ER status (ER-positive and ER-negative). Our dataset fell short of identifying distinct metabolites for ER-negative due to a significant class imbalance. The class imbalance in ER-negative significantly affected the overall performance of unsupervised, supervised methods used for this study. With BMI and current smoking status being important demographic outcomes from the ML methods, other identified metabolites were specific byproducts of amino acid metabolism and the urea cycle. These findings can be beneficial for providing an association between the expression of estrogen receptors and metabolomic data from breast cancer patients.
Earlier studies have reported that machine-learning models for ER prediction have performed at around 88% to 99%. The present study achieved moderate to good performance on all the learning models, with the MLP and LR models achieving 90% and 96%, respectively. In comparison with other studies [13] working on a relatively small dataset with an imbalanced class has been a drawback to being able to associate the identified biomarkers with specific ER classes. In addition, our study was focused only on diagnostic accuracy. While this is an essential first step, the potential of this panel for risk assessment, treatment response prediction, and detecting early-stage cancer should be investigated further. Nonetheless, supervised ML for ER classification, both MLP and LR, showed promise for ER classification based on the selected features. However, while class imbalance is a concern, the cost of misclassification should also be considered when choosing the final model.
Breast cancer subtyping is based on hormone receptor levels (ER, PR, HER2) are crucial for predicting survival rates in patients [19]. Studies comparing different ML models on breast cancer data (clinical information and images) have shown that models like Random Forests (RF) and Support Vector Machines (SVMs) are generally more accurate than Logistic Regression (LR) [20,21,22]. A research study suggests that different models may be better suited for specific tasks, with SVMs potentially excelling at diagnosis and Artificial Neural Networks (ANNs) at predicting prognosis [23]. Data analyzed from the California Cancer Registry focusing on triple-negative breast cancer (TNBC) lacks estrogen, progesterone, and HER2 receptors [24]. In this particular study, 271 breast cancer tissue samples, including 204 that were ER-positive and 67 that were ER-negative were examined. Using various statistical methods and ML techniques such as random forest and support vector machines, it was revealed that women with TNBC were more likely to be non-Hispanic Black and residing in low- socioeconomic areas. Furthermore, this group was found to be diagnosed with larger, poorly differentiated tumors at a later stage [24]. In fact, African American women diagnosed with ER-positive breast cancer have a 40% higher risk of death compared to Non-Hispanic White women with the same diagnosis [25].
In another study, five ML models (k-nearest neighbors, random forest, Naive Bayes, support vector machine, and multilayer perceptron) were compared for data from 431 breast cancer patients [26]. The goal was to see if ML could improve personalized predictions of how patients would respond to neoadjuvant chemotherapy before surgery. It was found that models such as random forest were significantly better than traditional methods (AUC of 0.88 compared to 0.64 for logistic regression). This suggests that ML hold promise for personalizing NAC treatment decisions [26]. The ML model also considered factors such as patient menopause status, hormone receptor levels (estrogen receptor or ER, progesterone receptor or PR), HER2 status, tumor grade, size, lymph node involvement, and presence of inflammatory breast cancer. By including these data, the model could distinguish between patients likely to have a complete pathological response to neoadjuvant chemotherapy more accurately.
The history of estrogen receptor (ER+/ER-) status is essential for the molecular classification of breast cancer, and the ability to see if a relationship exists between distinct metabolites from different pathways is an exciting, non-invasive approach to developing robust machine-learning methods for this study. Existing research has tried establishing a relationship between metabolomics and breast cancer subtypes [27,28,29]. The present study builds on existing methods to create efficient models that combine hormone receptor data (ER/PR/HER2) with metabolomic profiles. Furthermore, the study aimed to uncover relationships between hormone receptors and specific metabolites by applying ML algorithms including Support Vector Machines and Random Forests. In addition, we were able to refine supervised and unsupervised learning to identify metabolites specific to each receptor, which is crucial for breast cancer subtyping. Clearly, this approach aligns with advanced ML practices to identify unique metabolites based on hormone receptor profiles in breast cancer patients. Applying advanced supervised and unsupervised ML methods to breast cancer patient data facilitated the identification of biomarkers specific to hormone receptors.
In conclusion, our study focused on expanding the scope of the existing literature by exploring ML models for different ER status. The determination of ER status is an important cornerstone in the management of breast cancer, influencing treatment options, providing prognostic information, enabling personalized medicine, and helping in the classification of the cancer subtype. The novel approach used in this study successfully performed a logistic regression ML method on the metabolomics data specific to the estrogen-positive class. Identified metabolites play a crucial role in amino acid metabolism, some of which play significant roles in cell signaling pathways, cell proliferation, and repair mechanisms. Further analysis and larger cohorts are warranted to validate these metabolites as potential therapeutic strategies for different breast cancer subtypes. Hormone receptors like ER, PR, AR, and HER2 also play crucial roles in ovarian cancers; hence, metabolomics profiling can extend the arena to screen diverse cancers. This approach highlights the importance of using data from multiple sources, including demographics and metabolomics, to better understand health status and potentially improve clinical management in breast cancer.
4. Materials and Methods
Participants and LC-HRMS Analysis
The dataset used for this study included a total of 261 plasma samples from 188 patients with biopsy-confirmed breast cancer and 73 plasma samples from healthy volunteers. All biospecimen were obtained from the Cooperative Human Tissue Network (CHTN) biobank and was approved by the Institutional Review Boards. Demographic information for all the participants and clinical diagnosis of study subjects are summarized in Table 1. The specific information for breast cancer patients included the histology group with the location and type of the tumor. Categories included ductal, invasive mammary carcinoma, lobular, and malignant carcinoid tumor. The demographic dataset included ER, PR, and HER2 receptor status information collected from breast cancer patients. A targeted quantitative analysis of 137 metabolites was performed by DI-LC/MS/MS assay on plasma samples from breast cancer patients and healthy participants.
Data Processing
Data preprocessing excluded male population data from the breast cancer group since they were less than one percent of the total population within the breast cancer dataset. Metabolites with more than 20% missing values were excluded, and missing values for other metabolites were replaced with the detection limit value for specific metabolites. Mean values were used for demographic variables. These steps ensured the continuous use of a standard scale for easier comparison. This study used supervised, unsupervised, and ensemble ML algorithms to train models with already labeled data, which act as solutions for the test data. Each data piece has an input (question) and a corresponding answer (the label). The model learns the relationship between the inputs and the answers using this labeled data. Once trained, the model can predict the outputs for new, unseen data based on what it has learned. The initial analysis needed help to pinpoint critical variables due to similar characteristics and overlapping data in a simplified view. To address this, three machine-learning methods were implemented to identify essential features. Unsupervised learning has employed techniques like clustering and dimensionality reduction to uncover hidden patterns within the data. Supervised learning likely trained models using labeled data (ER-negative or ER-positive) to identify metabolites potentially linked to a specific ER type. Finally, ensemble learning could have combined multiple models to enhance prediction accuracy and reliability. Finally, this feature was evaluated in groups with various ML models (supervised, unsupervised, and ensemble) to determine the optimal combination for the best analytical results.
Author Contributions
Conceptualization, R.A., J-F. H., W.R.F. and M.L.V.; Data curation, J-F. H.; Formal analysis and interpretation, K.A., M.L.V. and W.R.F.; Funding acquisition, R.A. and P.S.T. Methodology, J-F. H., R.A. and P.S. T.; Project administration, R.A.; Project manager, G.H.; Resources, R.A., G.H., J-F. H. and P.S.T.; Writing—original draft, K.A.; Writing—review and editing, K.A.; R.A., J-F. H., P.S.T., W.R.F. and M.L.V. All authors have read and agreed to the published version of the manuscript.
Funding
This study was supported by BioMark Diagnostics Inc. (Richmond, BC, Canada).
Institutional Review Board Statement
The study was conducted in accordance with the Declaration of Helsinki and approved by the University of Manitoba Health Research Ethics Board (Ethics File #: H2012:334) prior to study implementation.
Informed Consent Statement
Informed consent was obtained from all subjects prior to sample donation to Cooperative Health Tissue Network (CHTN) USA biobanks.
Data Availability Statement
All data generated or analyzed during this study are included in this publication. Raw data are not publicly available due to privacy or ethical restrictions.
Acknowledgments
We thank the CHTN USA for providing the plasma samples and patient data. Infrastructure support was provided by the Albrechtsen Research Centre, St. Boniface Hospital and the University of Manitoba.
Conflicts of Interest
R.A.B. is President and CEO of BioMark Diagnostics Inc. and is a shareholder. G.H. is President of BioMark Diagnostic Solutions Inc and is a shareholder of BioMark Diagnostics Inc. J-F. H is General Manager of BioMark Diagnostic Solutions Inc. W.R.F is an advisor of BioMark Diagnostics Inc and P.S.T. is a minor shareholder of BioMark Diagnostics, Inc. The authors have no other relevant affiliations or financial involvement with any organization or entity with a financial interest or financial conflict with the subject matter or materials discussed in the manuscript apart from those disclosed.
References
- Fuhrman, B.J.; Schairer, C.; Gail, M.H.; Boyd-Morin, J.; Xu, X.; Sue, L.Y.; Buys, S.S.; Isaacs, C.; Keefer, L.K.; Veenstra, T.D.; Berg, C.D.; Hoover, R.N.; Ziegler, R.G. Estrogen metabolism and risk of breast cancer in postmenopausal women. J Natl Cancer Inst 2012, 104, 326–339. [Google Scholar] [CrossRef] [PubMed]
- Parise, C.A.; Caggiano, V. Breast cancer survival is defined by the er/pr/her2 subtypes and a surrogate classification according to tumor grade and immunohistochemical biomarkers. J Cancer Epidemiol 2014, 2014, 469251. [Google Scholar] [CrossRef] [PubMed]
- Cicatiello, L.; Mutarelli, M.; Grober, O.M.; Paris, O.; Ferraro, L.; Ravo, M.; Tarallo, R.; Luo, S.; Schroth, G.P.; Seifert, M.; Zinser, C.; Chiusano, M.L.; Traini, A.; De Bortoli, M.; Weisz, A. Estrogen receptor alpha controls a gene network in luminal-like breast cancer cells comprising multiple transcription factors and microRNAs. Am J Pathol 2010, 176, 2113–2130. [Google Scholar] [CrossRef] [PubMed]
- Ma, H.; Lu, Y.; Malone, K.E.; Marchbanks, P.A.; Deapen, D.M.; Spirtas, R.; Burkman, R.T.; Strom, B.L.; McDonald, J.A.; Folger, S.G.; Simon, M.S.; Sullivan-Halley, J.; Press, M.F.; Bernstein, L. Mortality risk of black women and white women with invasive breast cancer by hormone receptors, HER2, and p53 status. BMC Cancer 2013, 13, 225. [Google Scholar] [CrossRef] [PubMed]
- Ma, H.; Lu, Y.; Marchbanks, P.A.; Folger, S.G.; Strom, B.L.; McDonald, J.A.; Simon, M.S.; Weiss, L.K.; Malone, K.E.; Burkman, R.T.; Sullivan-Halley, J.; Deapen, D.M.; Press, M.F.; Bernstein, L. Quantitative measures of estrogen receptor expression in relation to breast cancer-specific mortality risk among white women and black women. Breast Cancer Res 2013, 15, R90. [Google Scholar] [CrossRef]
- Abubakar, M.; Figueroa, J.; Ali, H.R.; Blows, F.; Lissowska, J.; Caldas, C.; Easton, D.F.; Sherman, M.E.; Garcia-Closas, M.; Dowsett, M.; Pharoahz, P.D. Combined quantitative measures of ER, PR, HER2, and KI67 provide more prognostic information than categorical combinations in luminal breast cancer. Mod Pathol 2019, 32, 1244–1256. [Google Scholar] [CrossRef]
- Khande, T.A.; Joshi, A.R.; Khandeparkar, S.G.S.; Kulkarni, M.M.; Gogate, B.P.; Kakade, A.R.; Sahu, P.D.; Khillare, C.D. Study of ER, PR, HER2/neu, p53, and Ki67 expression in primary breast carcinomas and synchronous metastatic axillary lymph nodes. Indian J Cancer 2020, 57, 190–197. [Google Scholar]
- Wei, Y.; Jasbi, P.; Shi, X.; Turner, C.; Hrovat, J.; Liu, L.; Rabena, Y.; Porter, P.; Gu, H. Early breast cancer detection using untargeted and targeted metabolomics. J Proteome Res 2021, 20, 3124–3133. [Google Scholar] [CrossRef]
- Jobard, E.; Dossus, L.; Baglietto, L.; Fornili, M.; Lécuyer, L.; Mancini, F.R.; Gunter, M.J.; Trédan, O.; Boutron-Ruault, M.C.; Elena-Herrmann, B.; Severi, G.; Rothwell, J.A. Investigation of circulating metabolites associated with breast cancer risk by untargeted metabolomics: a case-control study nested within the French E3N cohort. Br J Cancer 2021, 124, 1734–1743. [Google Scholar] [CrossRef]
- Syed, A.H.; Khan, T. Evolution of research trends in artificial intelligence for breast cancer diagnosis and prognosis over the past two decades: A bibliometric analysis. Front Oncol 2022, 12, 854927. [Google Scholar] [CrossRef]
- Ahn, J.S.; Shin, S.; Yang, S.A.; Park, E.K.; Kim, K.H.; Cho, S.I.; Ock, C.Y.; Kim, S. Artificial intelligence in breast cancer diagnosis and personalized medicine. J Breast Cancer 2023, 26, 405–435. [Google Scholar] [CrossRef] [PubMed]
- Jasbi, P.; Wang, D.; Cheng, S.L.; Fei, Q.; Cui, J.Y.; Liu, L.; Wei, Y.; Raftery, D.; Gu, H. Breast cancer detection using targeted plasma metabolomics. J Chromatogr B Analyt Technol Biomed Life Sci 2019, 1105, 26–37. [Google Scholar] [CrossRef] [PubMed]
- Alakwaa, F.M.; Chaudhary, K.; Garmire, L.X. Deep learning accurately predicts estrogen receptor status in breast cancer metabolomics data. J Proteome Res 2018, 17, 337–347. [Google Scholar] [CrossRef] [PubMed]
- Gal, J.; Bailleux, C.; Chardin, D.; Pourcher, T.; Gilhodes, J.; Jing, L.; Guigonis, J.M.; Ferrero, J.M.; Milano, G.; Mograbi, B.; Brest, P.; Chateau, Y.; Humbert, O.; Chamorey, E. Comparison of unsupervised machine-learning methods to identify metabolomic signatures in patients with localized breast cancer. Comput Struct Biotechnol J 2020, 18, 1509–1524. [Google Scholar] [CrossRef]
- Henry, N.L.; Hayes, D.F. Cancer biomarkers. Mol Oncol 2012, 6, 140–146. [Google Scholar] [CrossRef]
- Haince, J.F.; Joubert, P.; Bach, H.; Ahmed Bux, R.; Tappia, P.S.; Ramjiawan, B. Metabolomic fingerprinting for the detection of early-stage lung cancer: From the genome to the metabolome. Int J Mol Sci 2022, 23, 1215. [Google Scholar] [CrossRef]
- Kim, Y.; Koo, I.; Jung, B.H.; Chung, B.C.; Lee, D. Multivariate classification of urine metabolome profiles for breast cancer diagnosis. BMC Bioinformatics 2010, 11, S4. [Google Scholar] [CrossRef]
- Hadi, N.I.; Jamal, Q.; Iqbal, A.; Shaikh, F.; Somroo, S.; Musharraf, S.G. Serum metabolomic profiles for breast cancer diagnosis, grading and staging by gas chromatography-mass spectrometry. Sci Rep 2017, 7, 1715. [Google Scholar] [CrossRef]
- Xiao, Y.; Ma, D.; Yang, Y.S.; Yang, F.; Ding, J.H.; Gong, Y.; Jiang, L.; Ge, L.P.; Wu, S.Y.; Yu, Q.; Zhang, Q.; Bertucci, F.; Sun, Q.; Hu, X.; Li, D.Q.; Shao, Z.M.; Jiang, Y.Z. Comprehensive metabolomics expands precision medicine for triple-negative breast cancer. Cell Res 2022, 32, 477–490. [Google Scholar] [CrossRef]
- Rawal, R. Breast cancer prediction using machine learning. JETIR 2020, 7, 13–24. [Google Scholar]
- Hassan, M.M.; Hassan, M.M.; Yasmin, F.; Khan, M.A.R.; Zaman, S. ; Galibuzzaman; Islam, K.K.; Bairagi, A.K.; A comparative assessment of machine learning algorithms with the least absolute shrinkage and selection operator for breast cancer detection and prediction. Decision Analytics J, 2023, 7, 100245. [Google Scholar]
- Kumar, P.; Samiha, S.P.; Gururaj, C.M.; Kumar, R. Prognostic analysis of machine learning techniques for breast cancer. Int J Bioinfor Intell Comput 2022, 1, 72–83. [Google Scholar]
- Rabiei, R.; Ayyoubzadeh, S.M.; Sohrabei, S.; Esmaeili, M.; Atashi, A. Prediction of breast cancer using ML approaches. J Biomed Phys Eng 2022, 12, 297–308. [Google Scholar] [CrossRef] [PubMed]
- Bauer, K.R.; Brown, M.; Cress, R.D.; Parise, C.A.; Caggiano, V. Descriptive analysis of estrogen receptor (ER)-negative, progesterone receptor (PR)-negative, and HER2-negative invasive breast cancer, the so-called triple-negative phenotype: A population-based study from the California Cancer Registry. Cancer 2007, 109, 1721–1728. [Google Scholar] [CrossRef] [PubMed]
- Santaliz-Casiano,A. ; Mehta, D.; Danciu, O.C.; Patel, H.; Banks, L.; Zaidi, A.; Buckley, J.; Rauscher, G.H.; Schulte, L.; Weller, L.R.; Taiym, D.; Liko-Hazizi, E.; Pulliam, N.; Friedewald, S.M.; Khan, S.; Kim, J.J.; Gradishar, W.; Hegerty, S.; Frasor, J.; Hoskins, K.F.; Madak-Erdogan Z. Identification of metabolic pathways contributing to ER+ breast cancer disparities using a machine-learning pipeline. Sci Rep 2023, 13, 12136. [Google Scholar]
- Meti, N.; Saednia, K.; Lagree, A.; Tabbarah, S.; Mohebpour, M.; Kiss, A.; Lu, F.I.; Slodkowska, E.; Gandhi, S.; Jerzak, K.J.; Fleshner, L.; Law, E.; Sadeghi-Naini, A.; Tran, W.T. Machine learning frameworks to predict neoadjuvant chemotherapy response in breast cancer using clinical and pathological features. JCO Clin Cancer Inform 2021, 5, 66–80. [Google Scholar] [CrossRef]
- Subramani, R.; Poudel, S.; Smith, K.D.; Estrada, A.; Lakshmanaswamy, R. Metabolomics of breast cancer: A review. Metabolites 2022, 12, 643. [Google Scholar] [CrossRef]
- Wang, W.; Rong, Z.; Wang, G.; Hou, Y.; Yang, F.; Qiu, M. Cancer metabolites: promising biomarkers for cancer liquid biopsy. Biomark Res 2023, 11, 66. [Google Scholar] [CrossRef]
- Puskulluoglu, M.; Michalak, I.M. The therapeutic potential of natural metabolites in targeting endocrine-independent HER-2-negative breast cancer. Front Pharmacol 2024, 15, 1349242. [Google Scholar] [CrossRef]
Figure 1.
Top 20 features of naive bayes for estrogen positive receptor. BMI, body mass index.
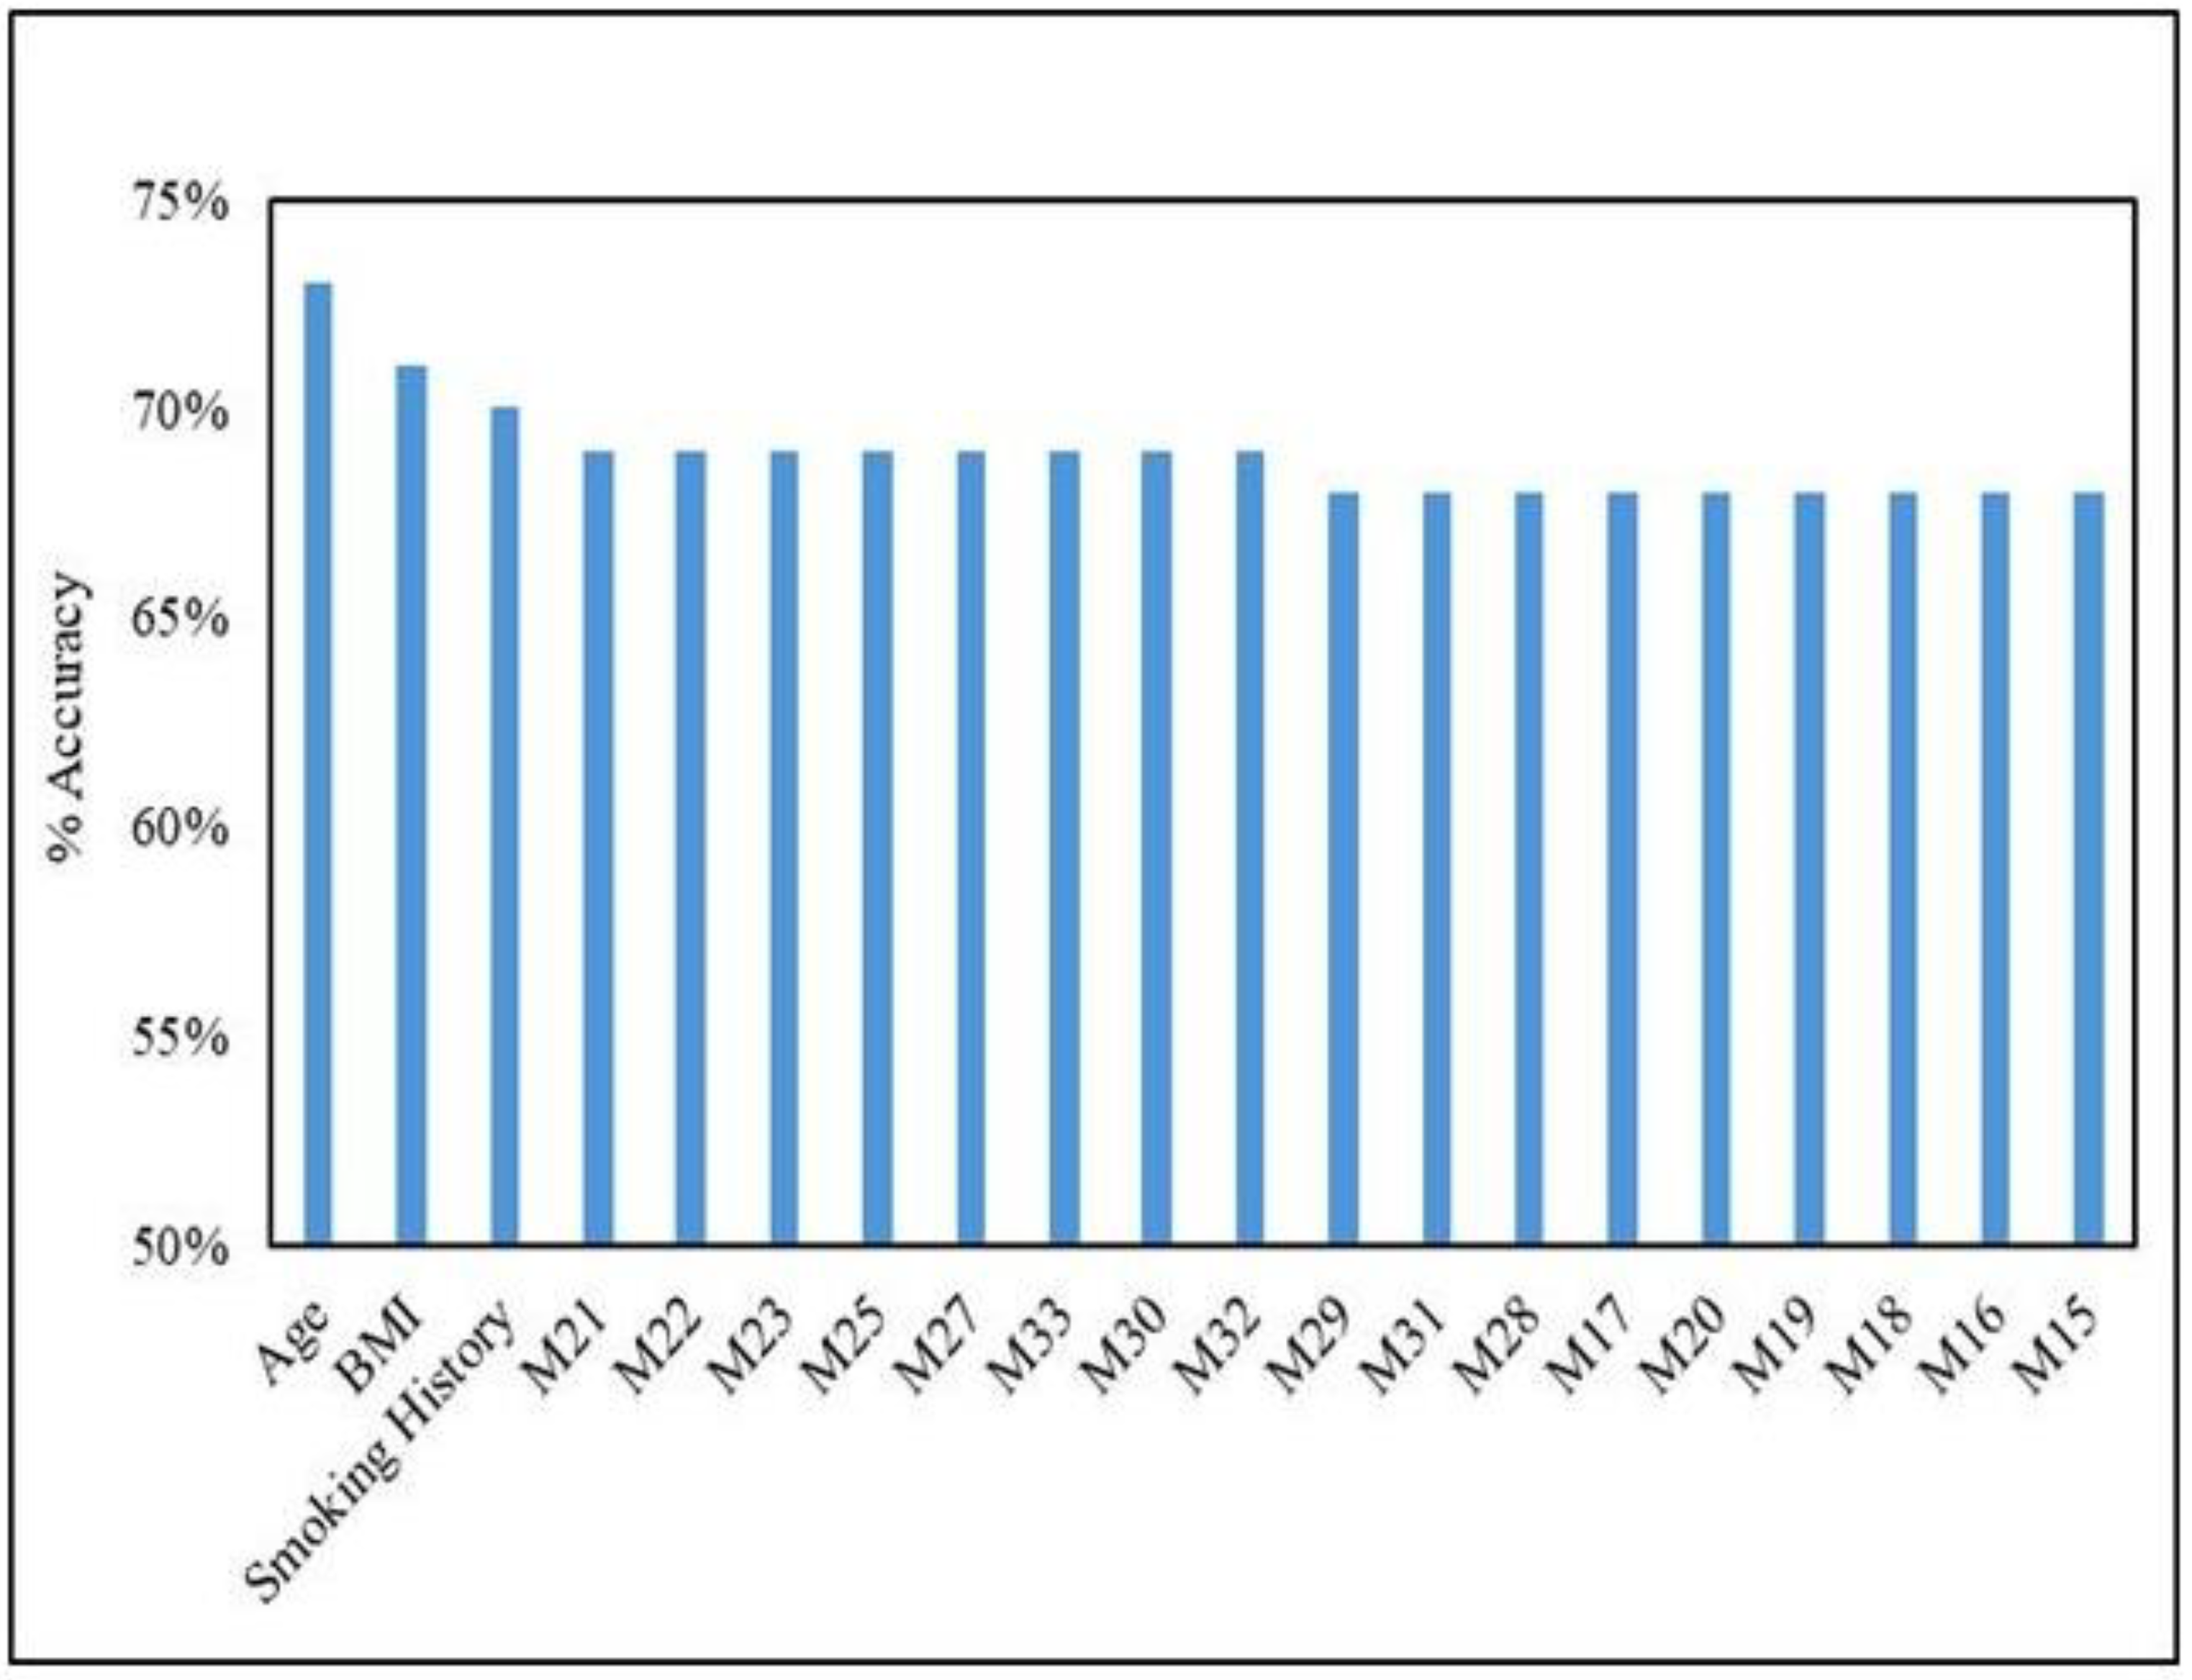
Figure 2.
Comparison and performance of clustering variants and scatter plot for multidimensional scaling. Panel 2A shows the performance of unsupervised machine learning ER-positive receptor and panel 2B shows the multidimensional scaling (MDS) scatter plot for the two ER receptors. k-means clustering is an unsupervised learning algorithm; GMM, Gaussian mixture models.
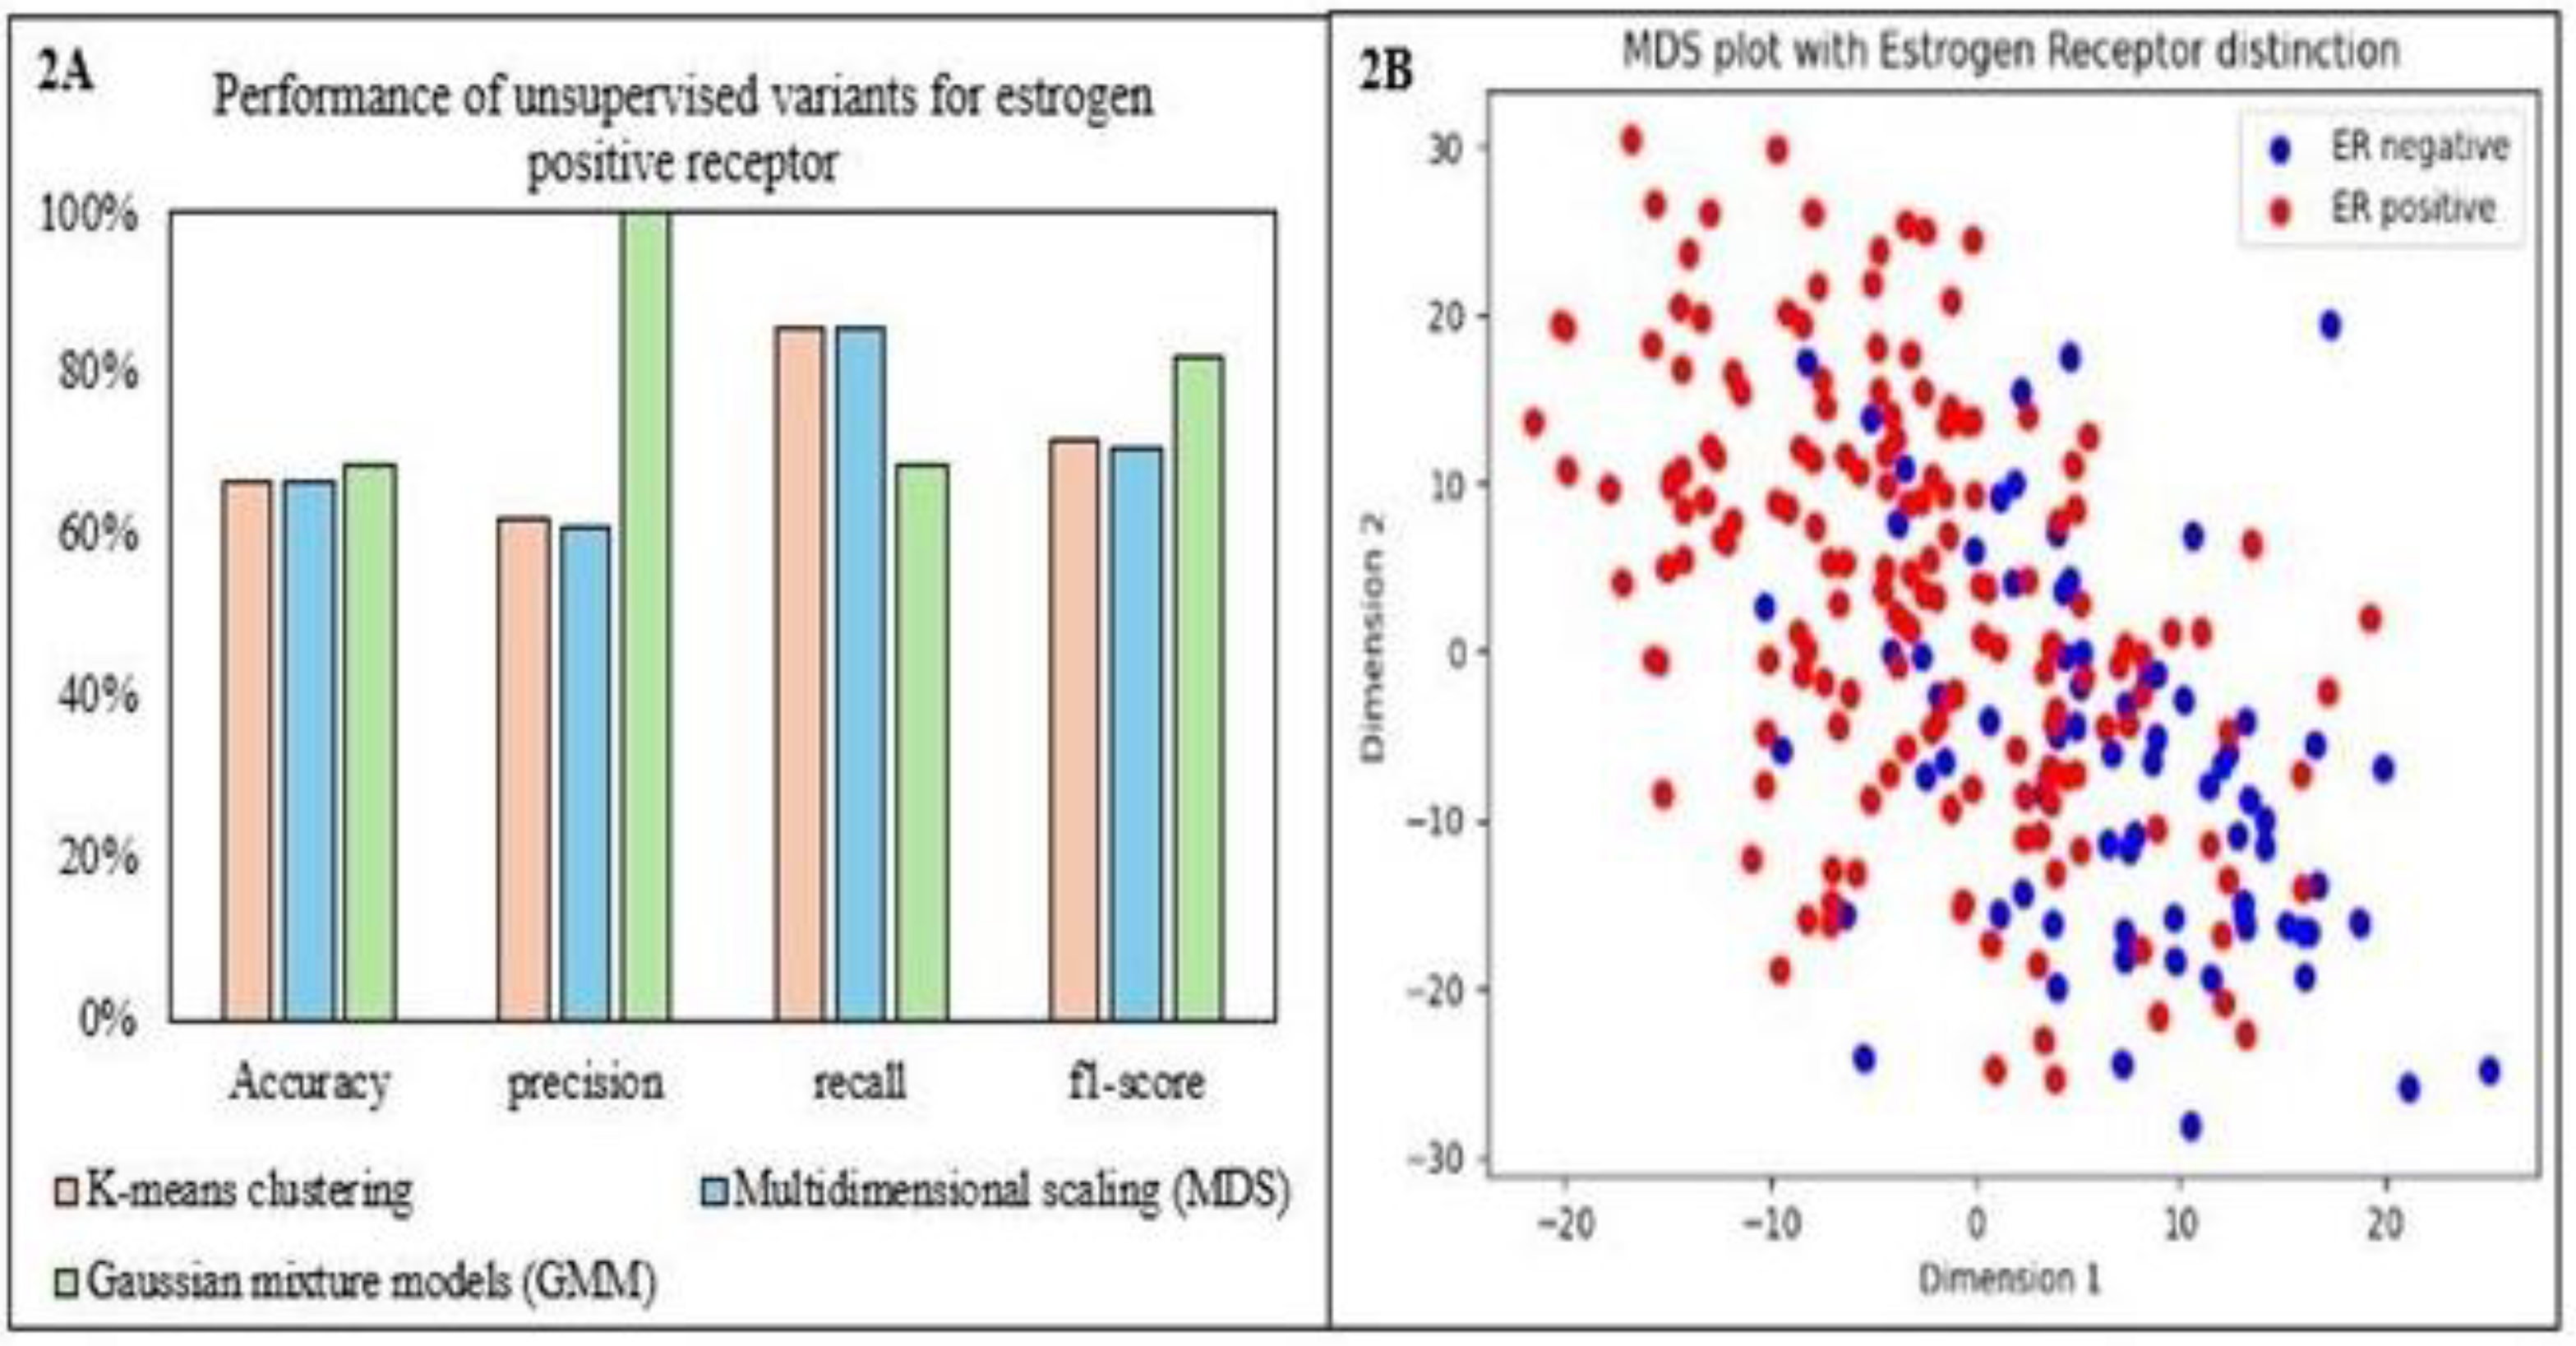
Figure 3.
Principal component analysis for projection for estrogen receptor. Panel 3A shows 2D analysis and Panel 3B shows 3D analysis.
Figure 3.
Principal component analysis for projection for estrogen receptor. Panel 3A shows 2D analysis and Panel 3B shows 3D analysis.
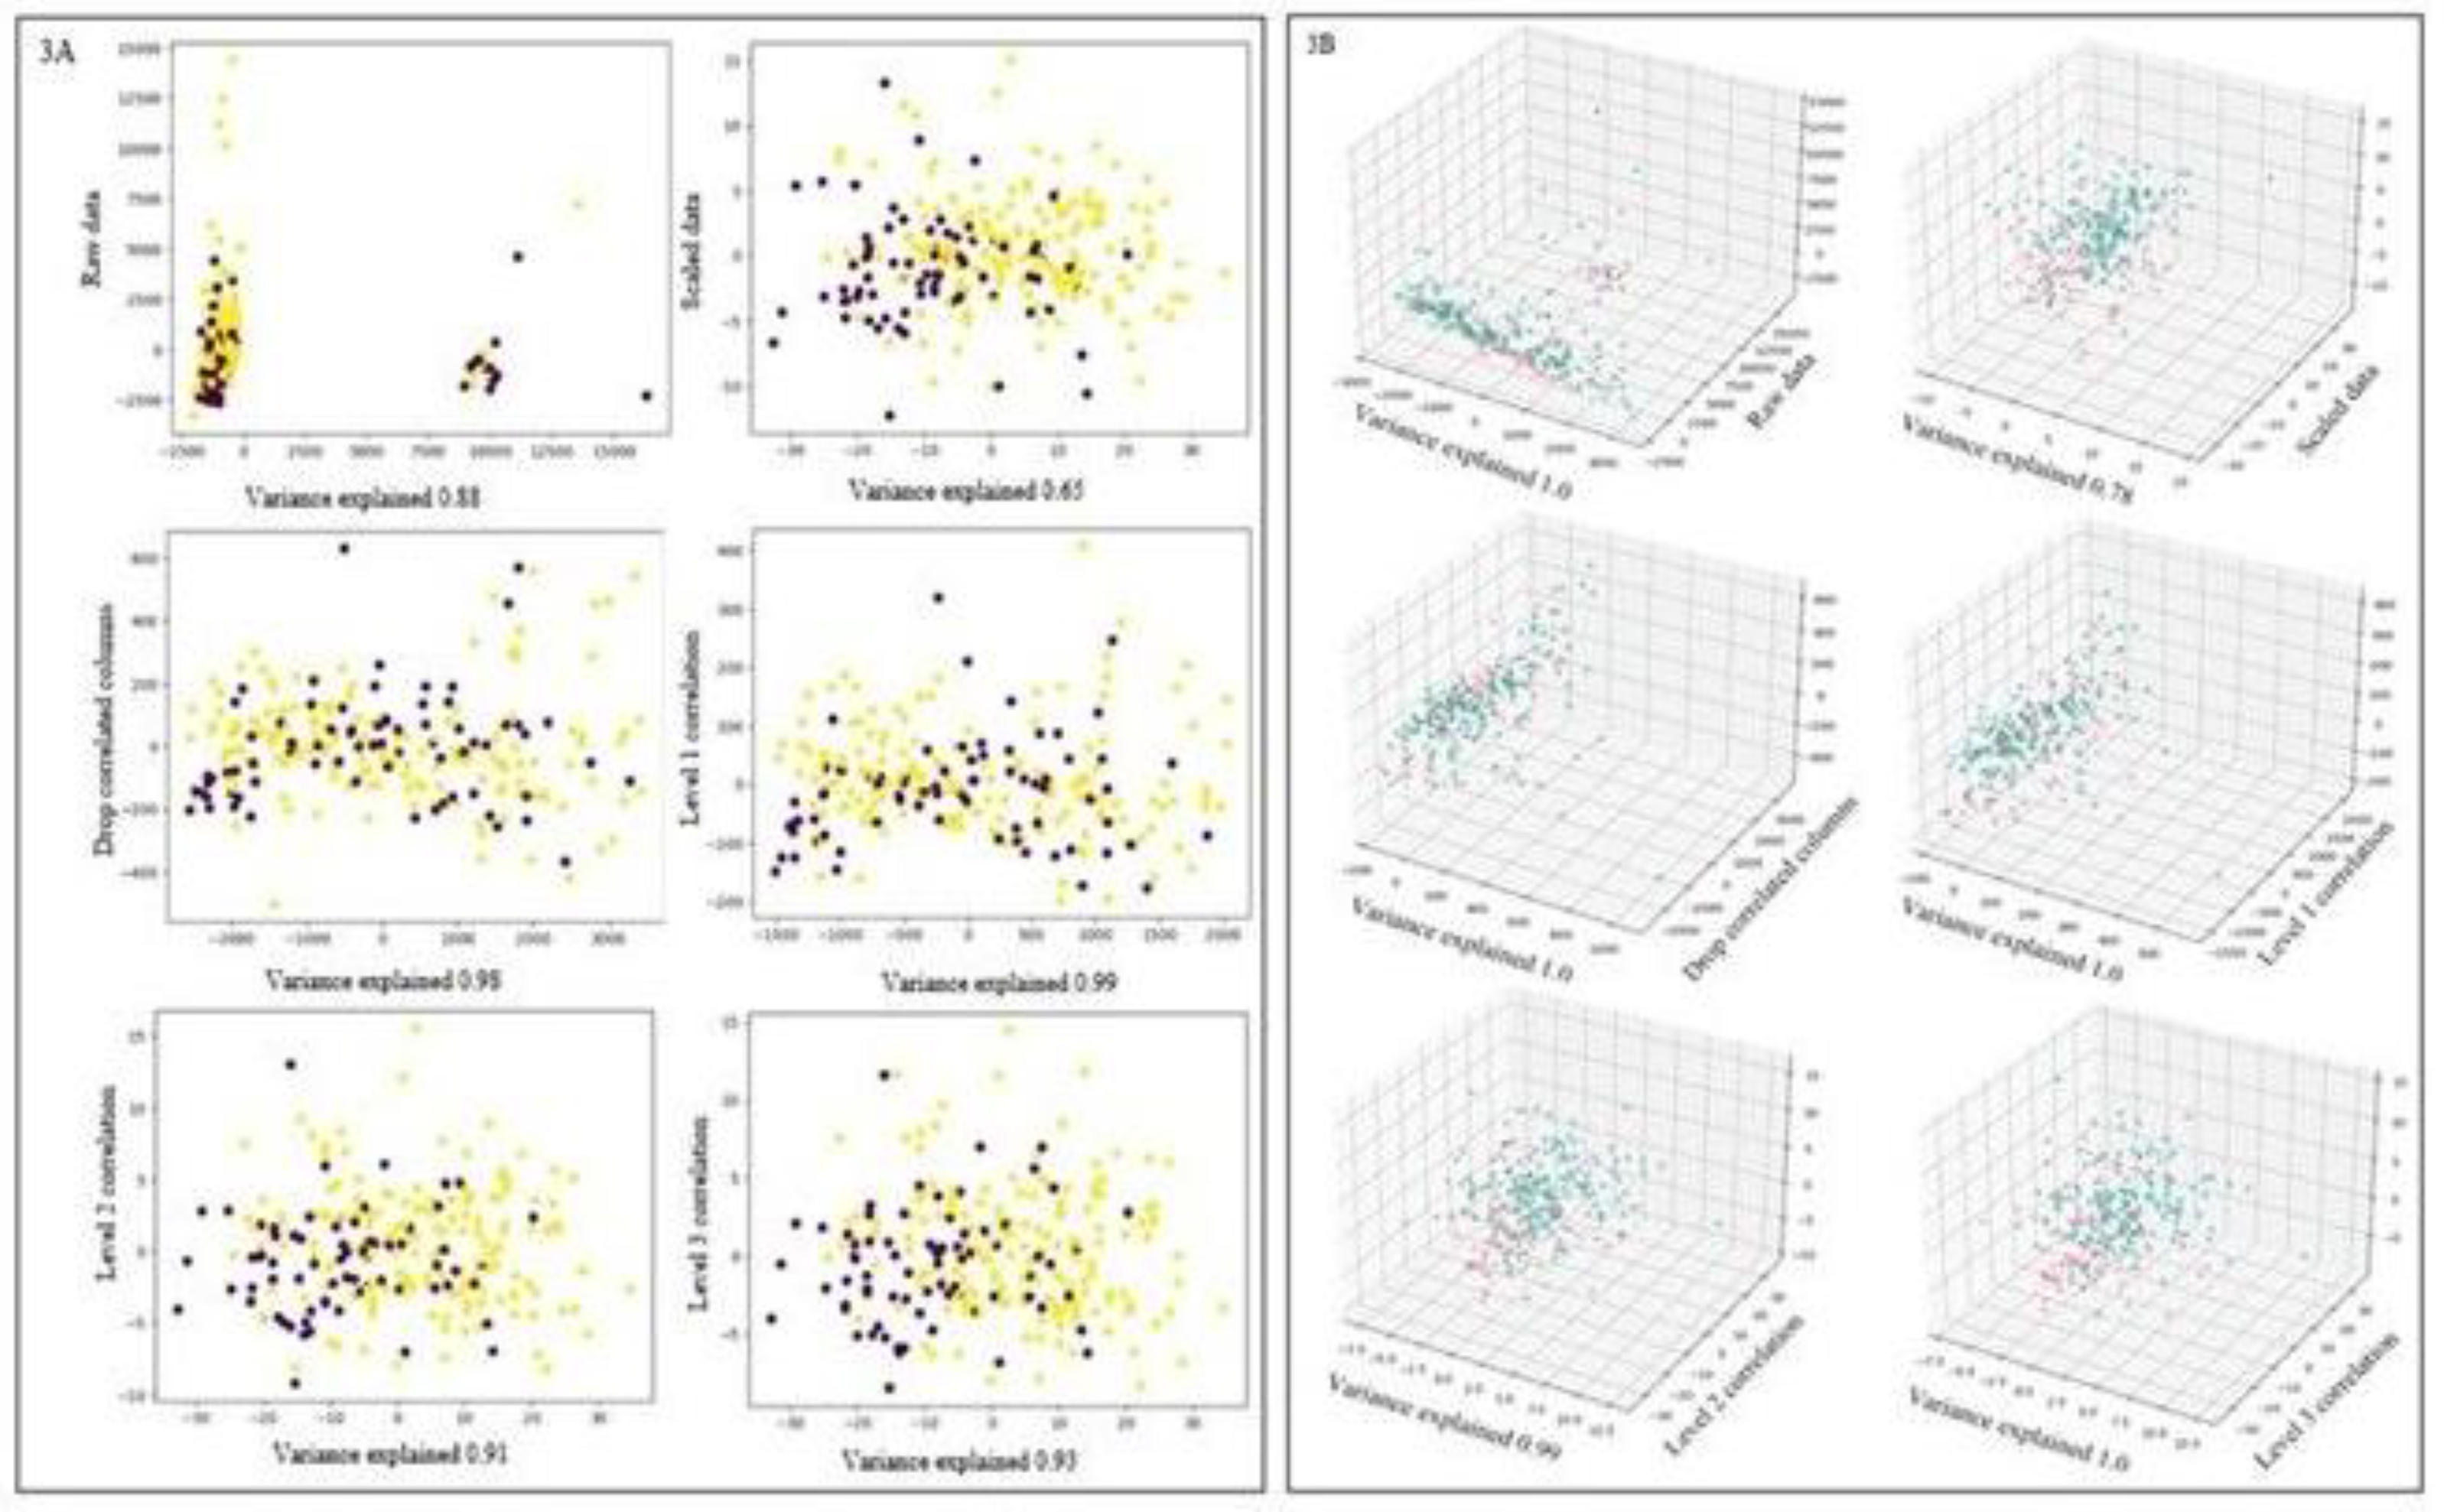
Figure 4.
Cross-validation analysis with multinomial naïve bayes variants estrogen positive receptor. The top 20 informative variables for ER prediction are depicted. F1 score is a measure of the harmonic mean of precision and recall.
Figure 4.
Cross-validation analysis with multinomial naïve bayes variants estrogen positive receptor. The top 20 informative variables for ER prediction are depicted. F1 score is a measure of the harmonic mean of precision and recall.
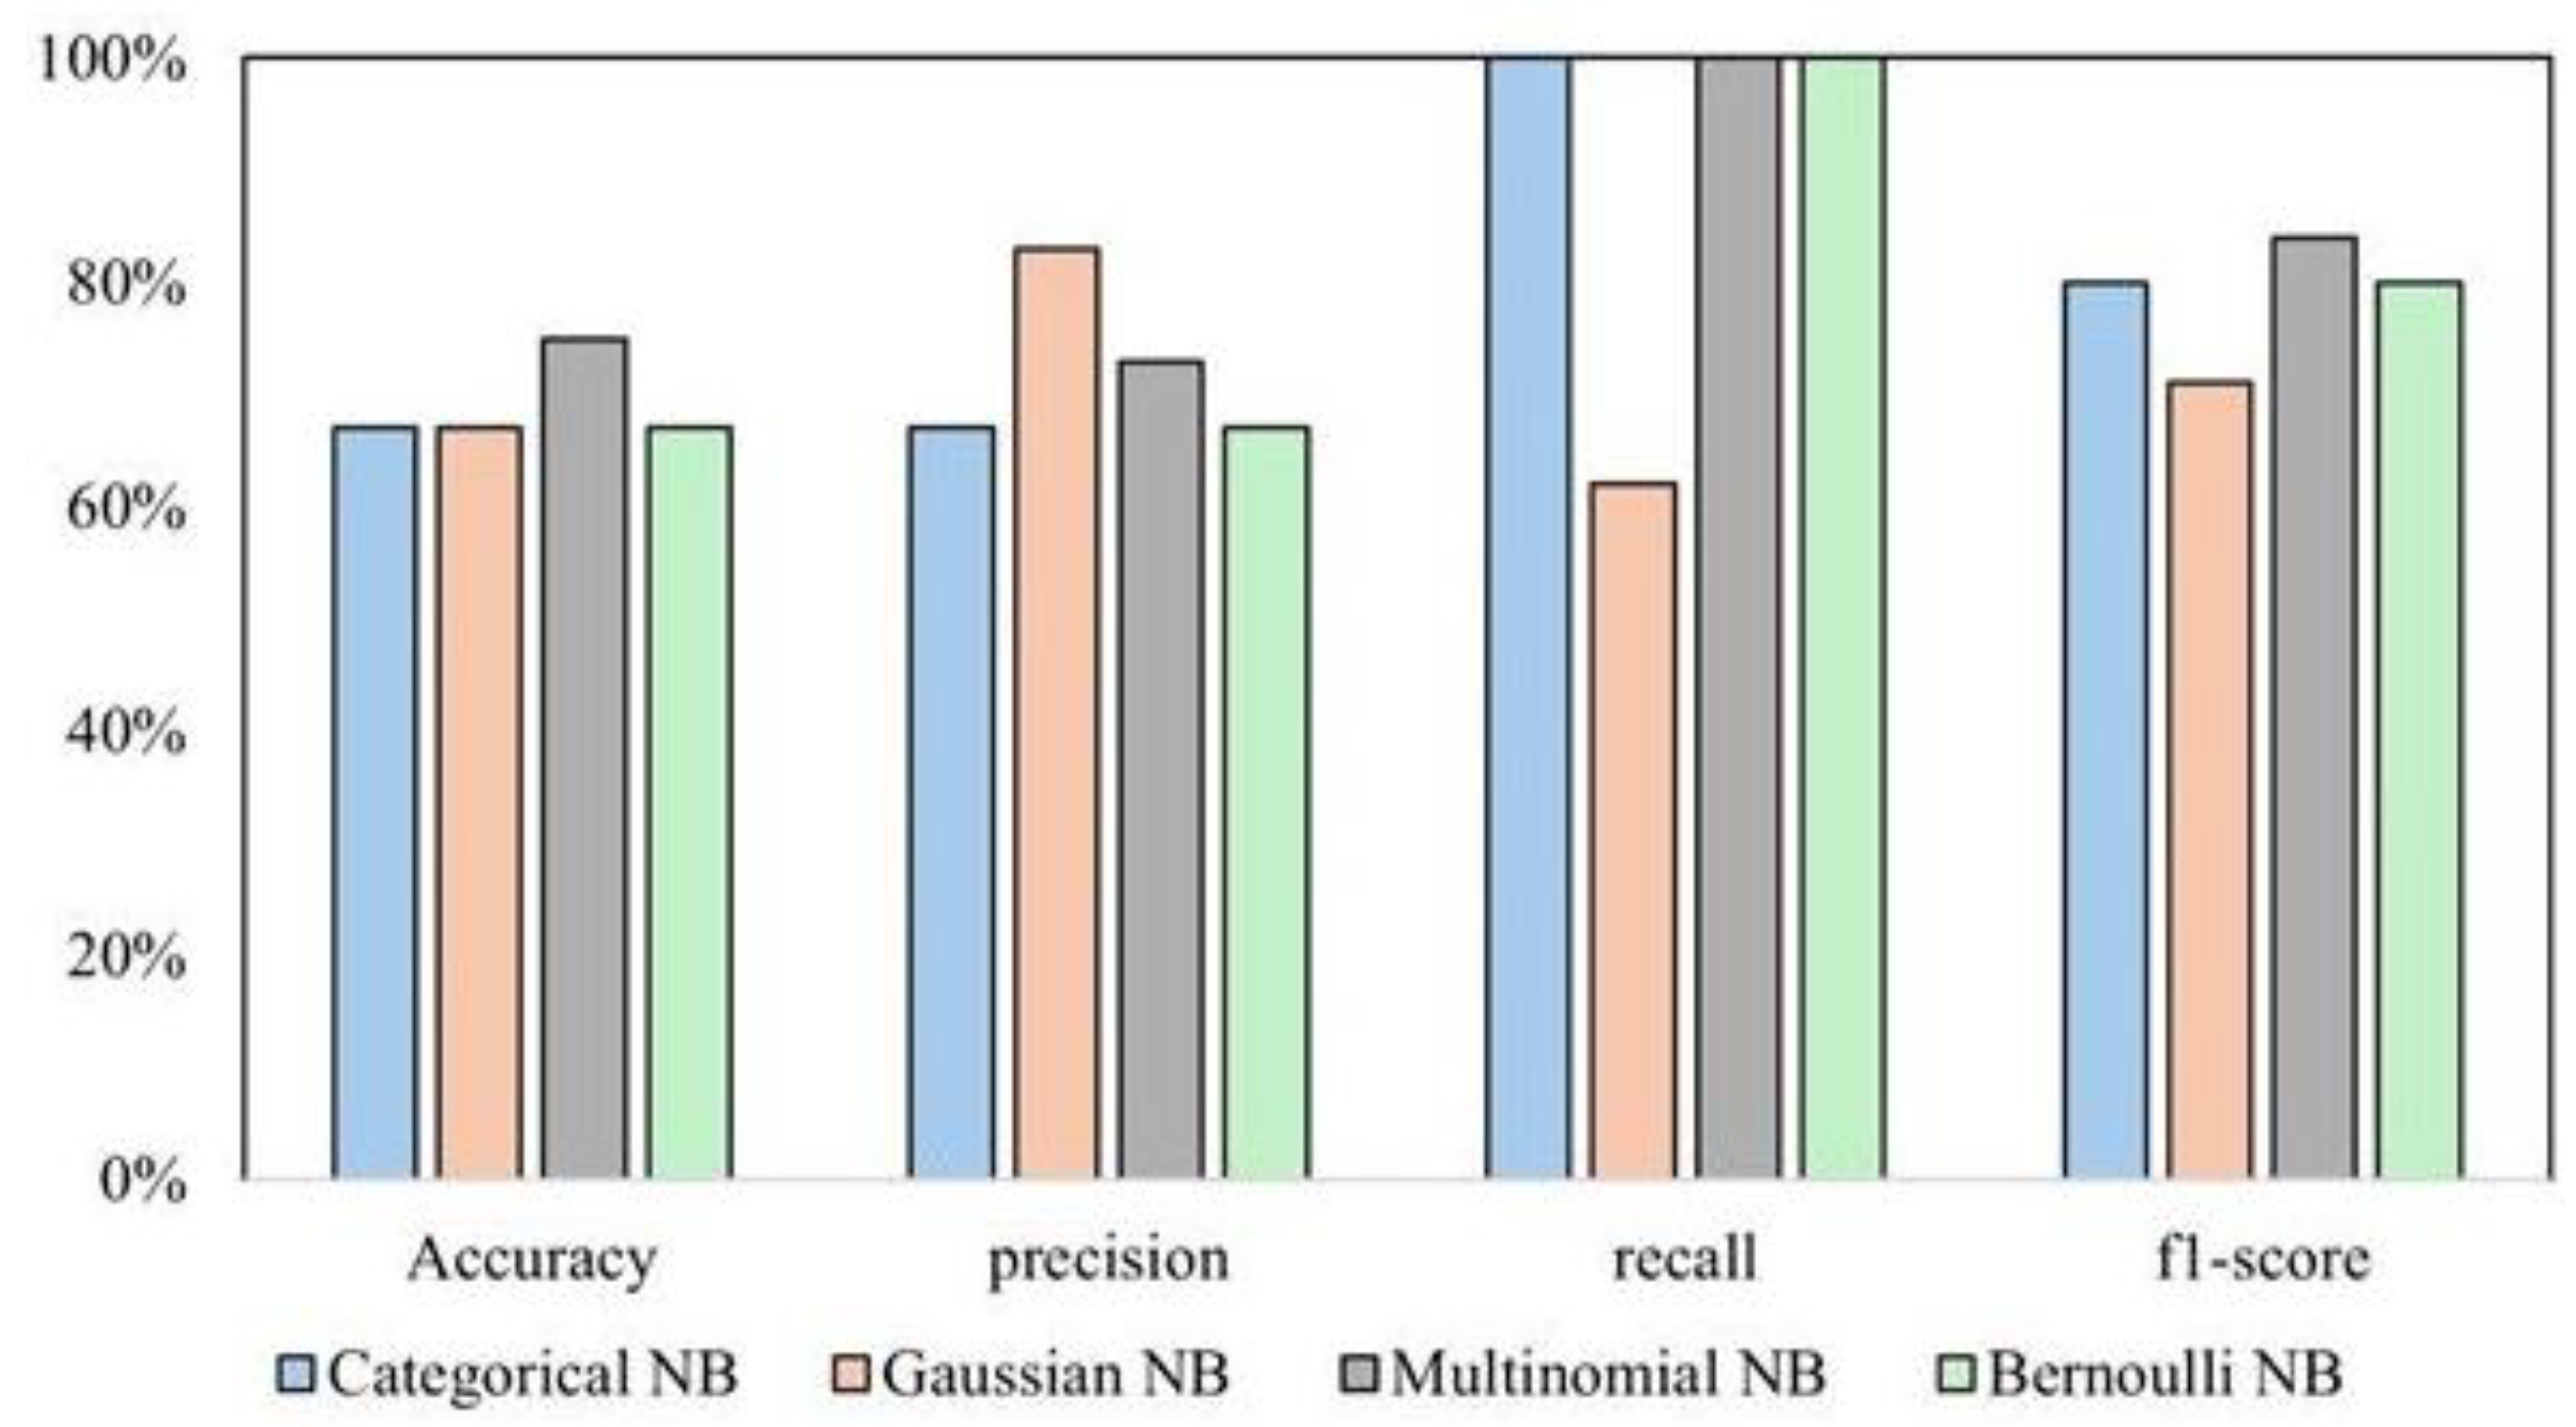
Figure 5.
Estrogen receptor classification. The Top 17 features for estrogen-positive receptors identified by support vector machines and decision tree models.
Figure 5.
Estrogen receptor classification. The Top 17 features for estrogen-positive receptors identified by support vector machines and decision tree models.
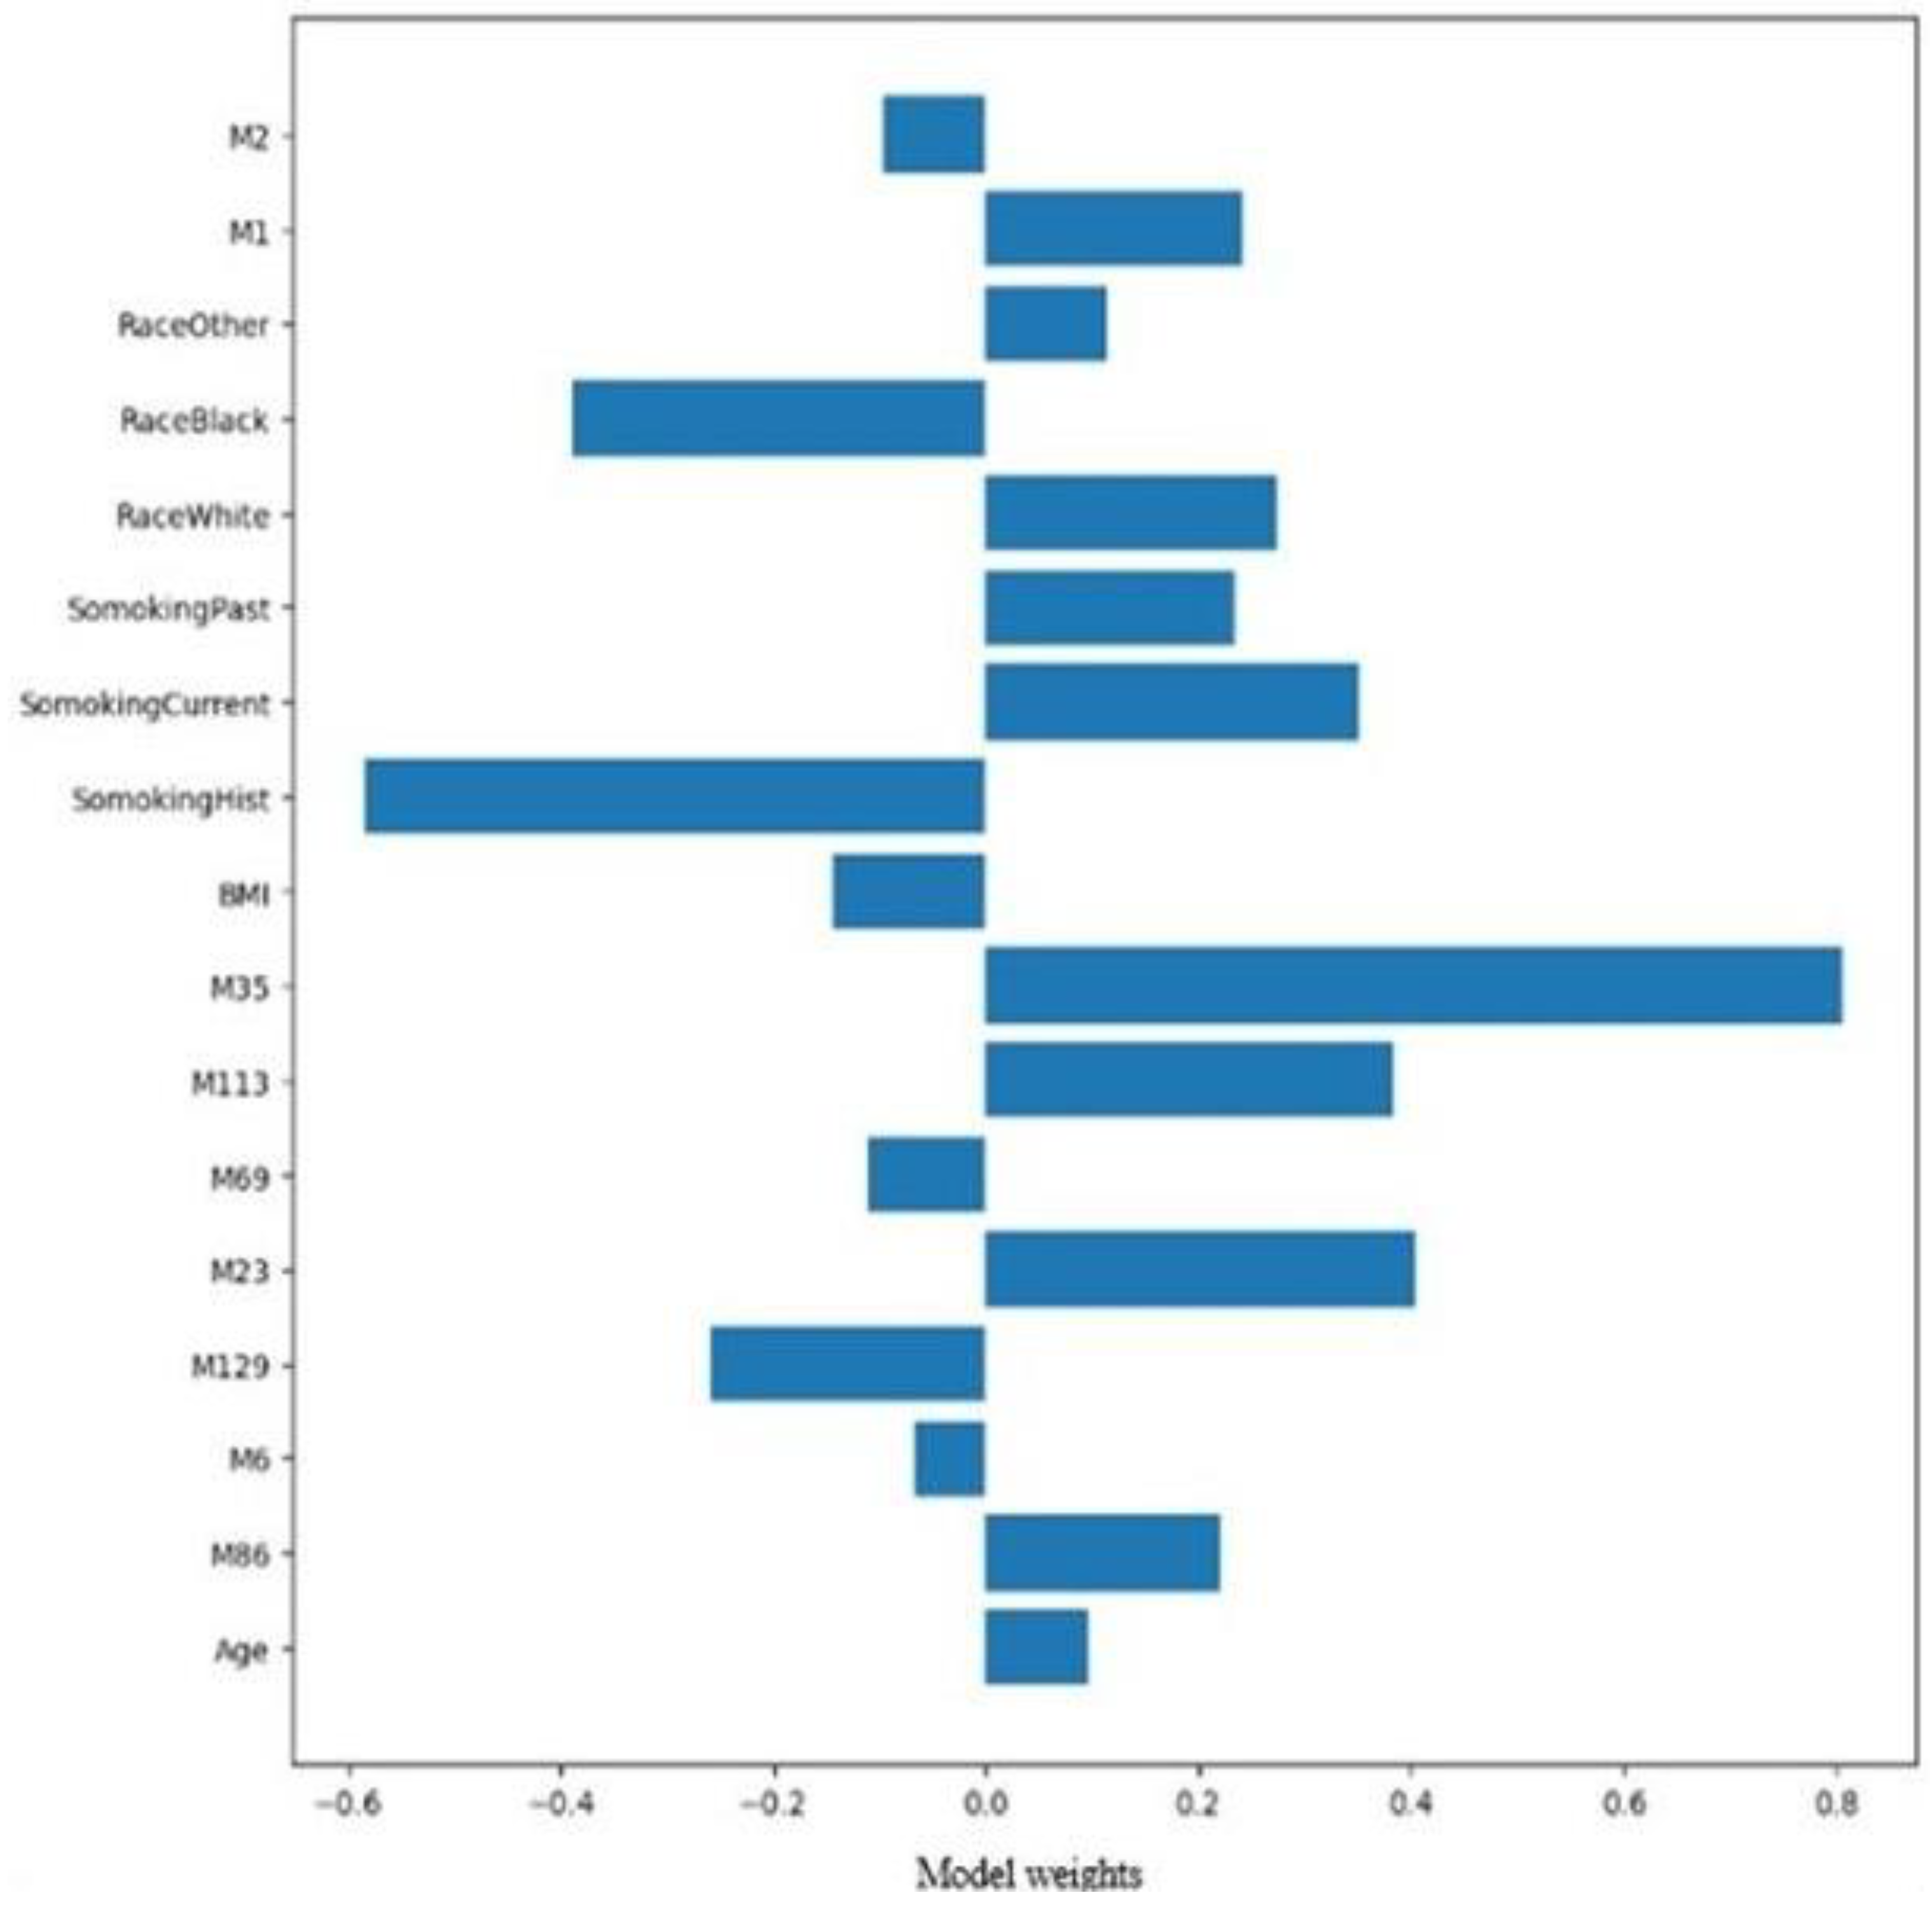
Figure 6.
Separation for the estrogen receptor-positive class. Decision tree with principal component analysis scatter plot for estrogen receptor separation for ER-negative (in blue), ER-positive (in red). ER, estrogen receptor.
Figure 6.
Separation for the estrogen receptor-positive class. Decision tree with principal component analysis scatter plot for estrogen receptor separation for ER-negative (in blue), ER-positive (in red). ER, estrogen receptor.
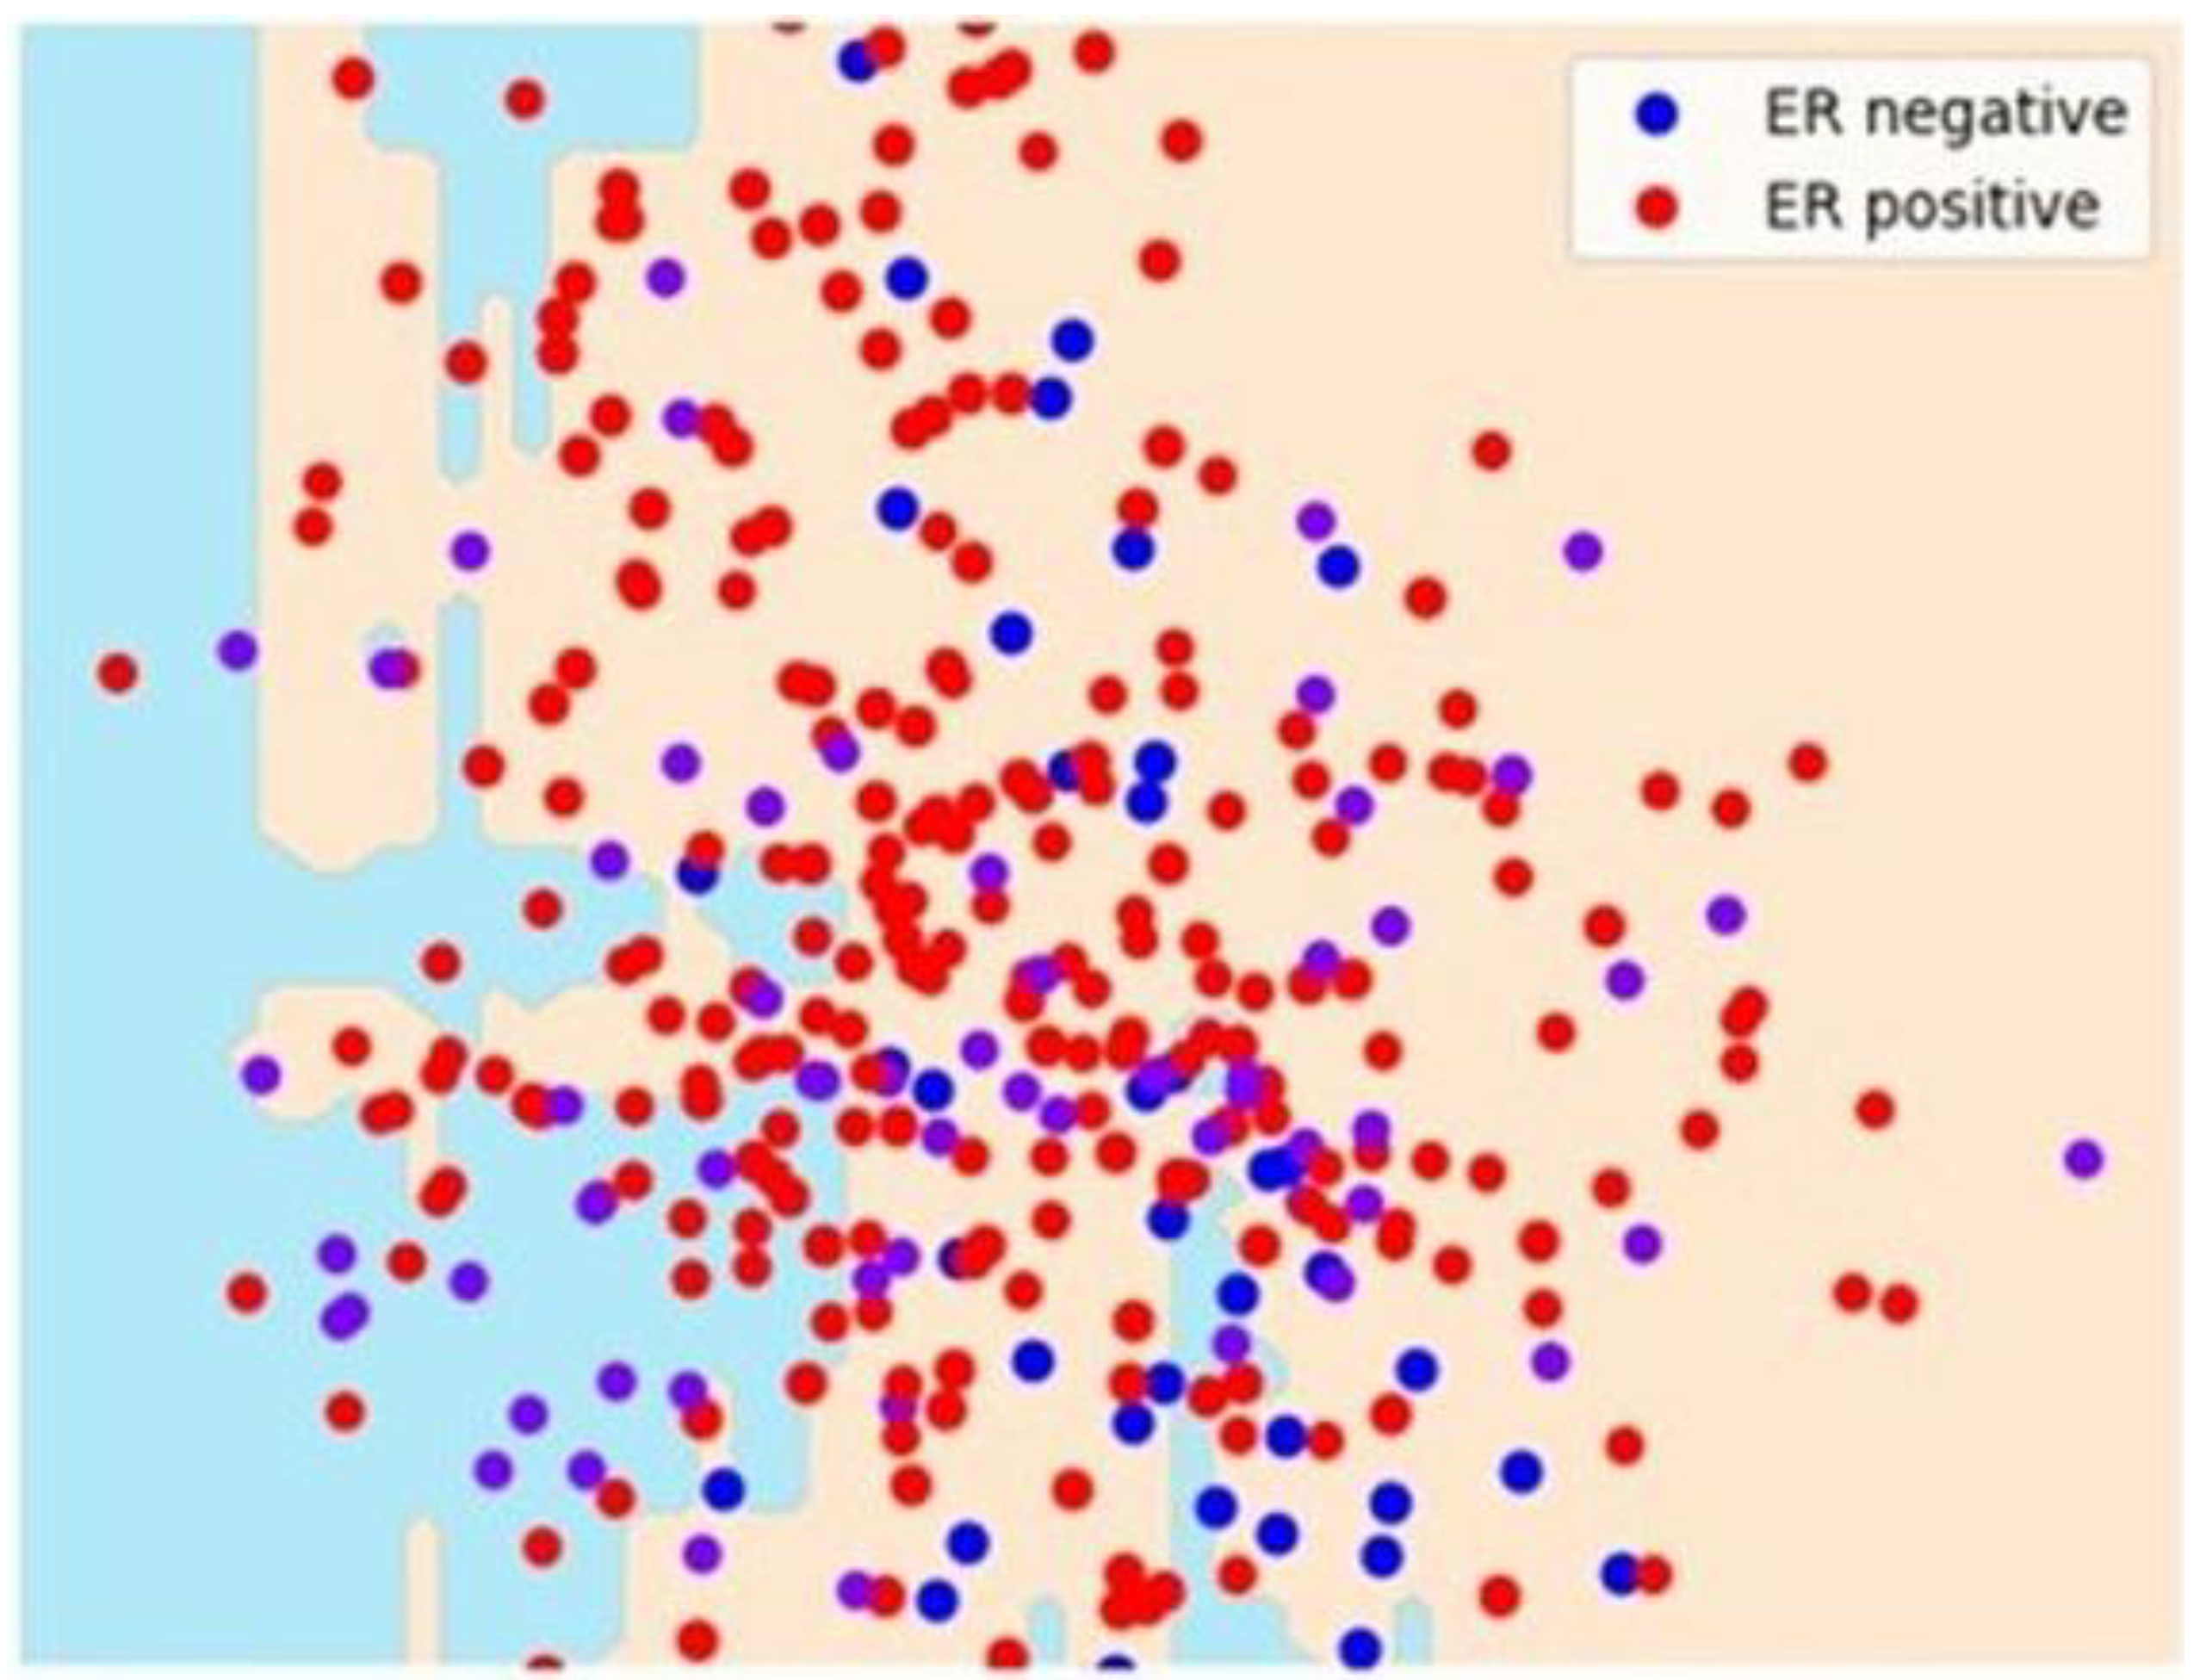
Figure 7.
Estrogen receptor classification. The Top 17 features for estrogen-positive receptors identified by support vector machines and decision tree models.
Figure 7.
Estrogen receptor classification. The Top 17 features for estrogen-positive receptors identified by support vector machines and decision tree models.
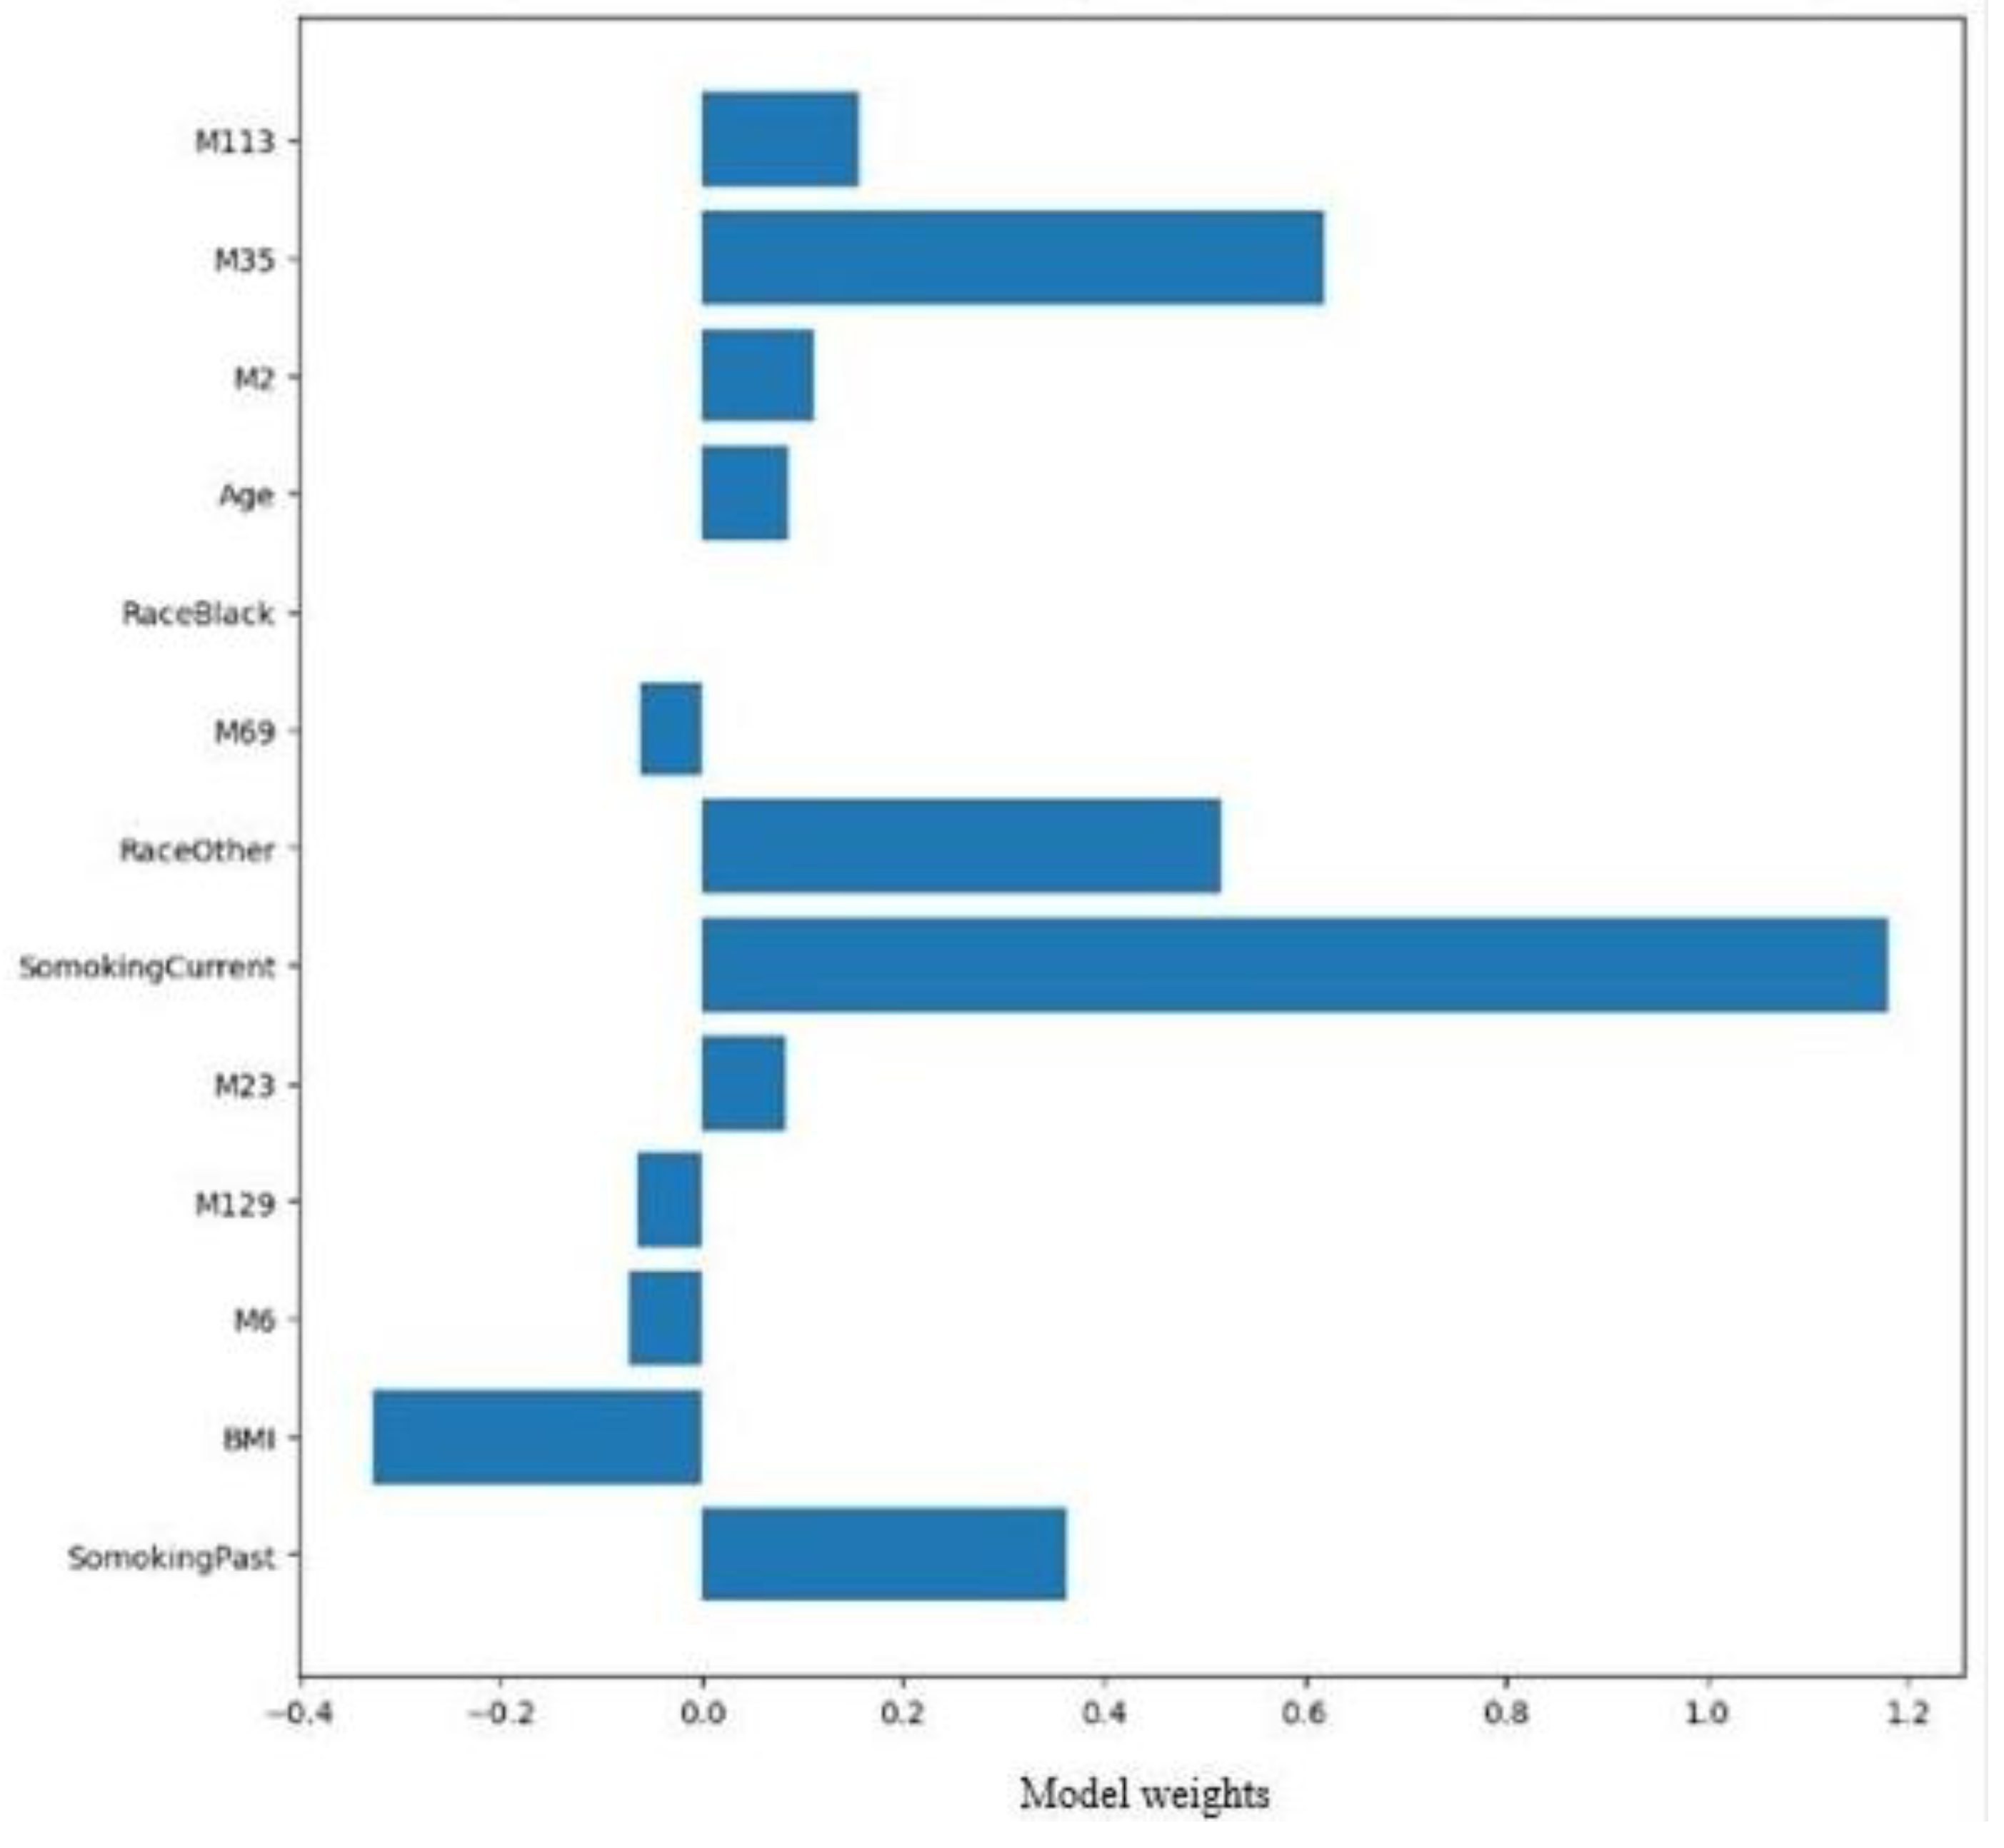
Figure 8.
Performance comparison for supervised machine learning for estrogen receptor. The bar graphs show the level of accuracy (expressed as a %) in the classification of estrogen receptor status. NB, Naïve Bayes; SVM, Support vector machine; DT, Decision tree; MLP, Multilayer perception; LR, Logistic regression.
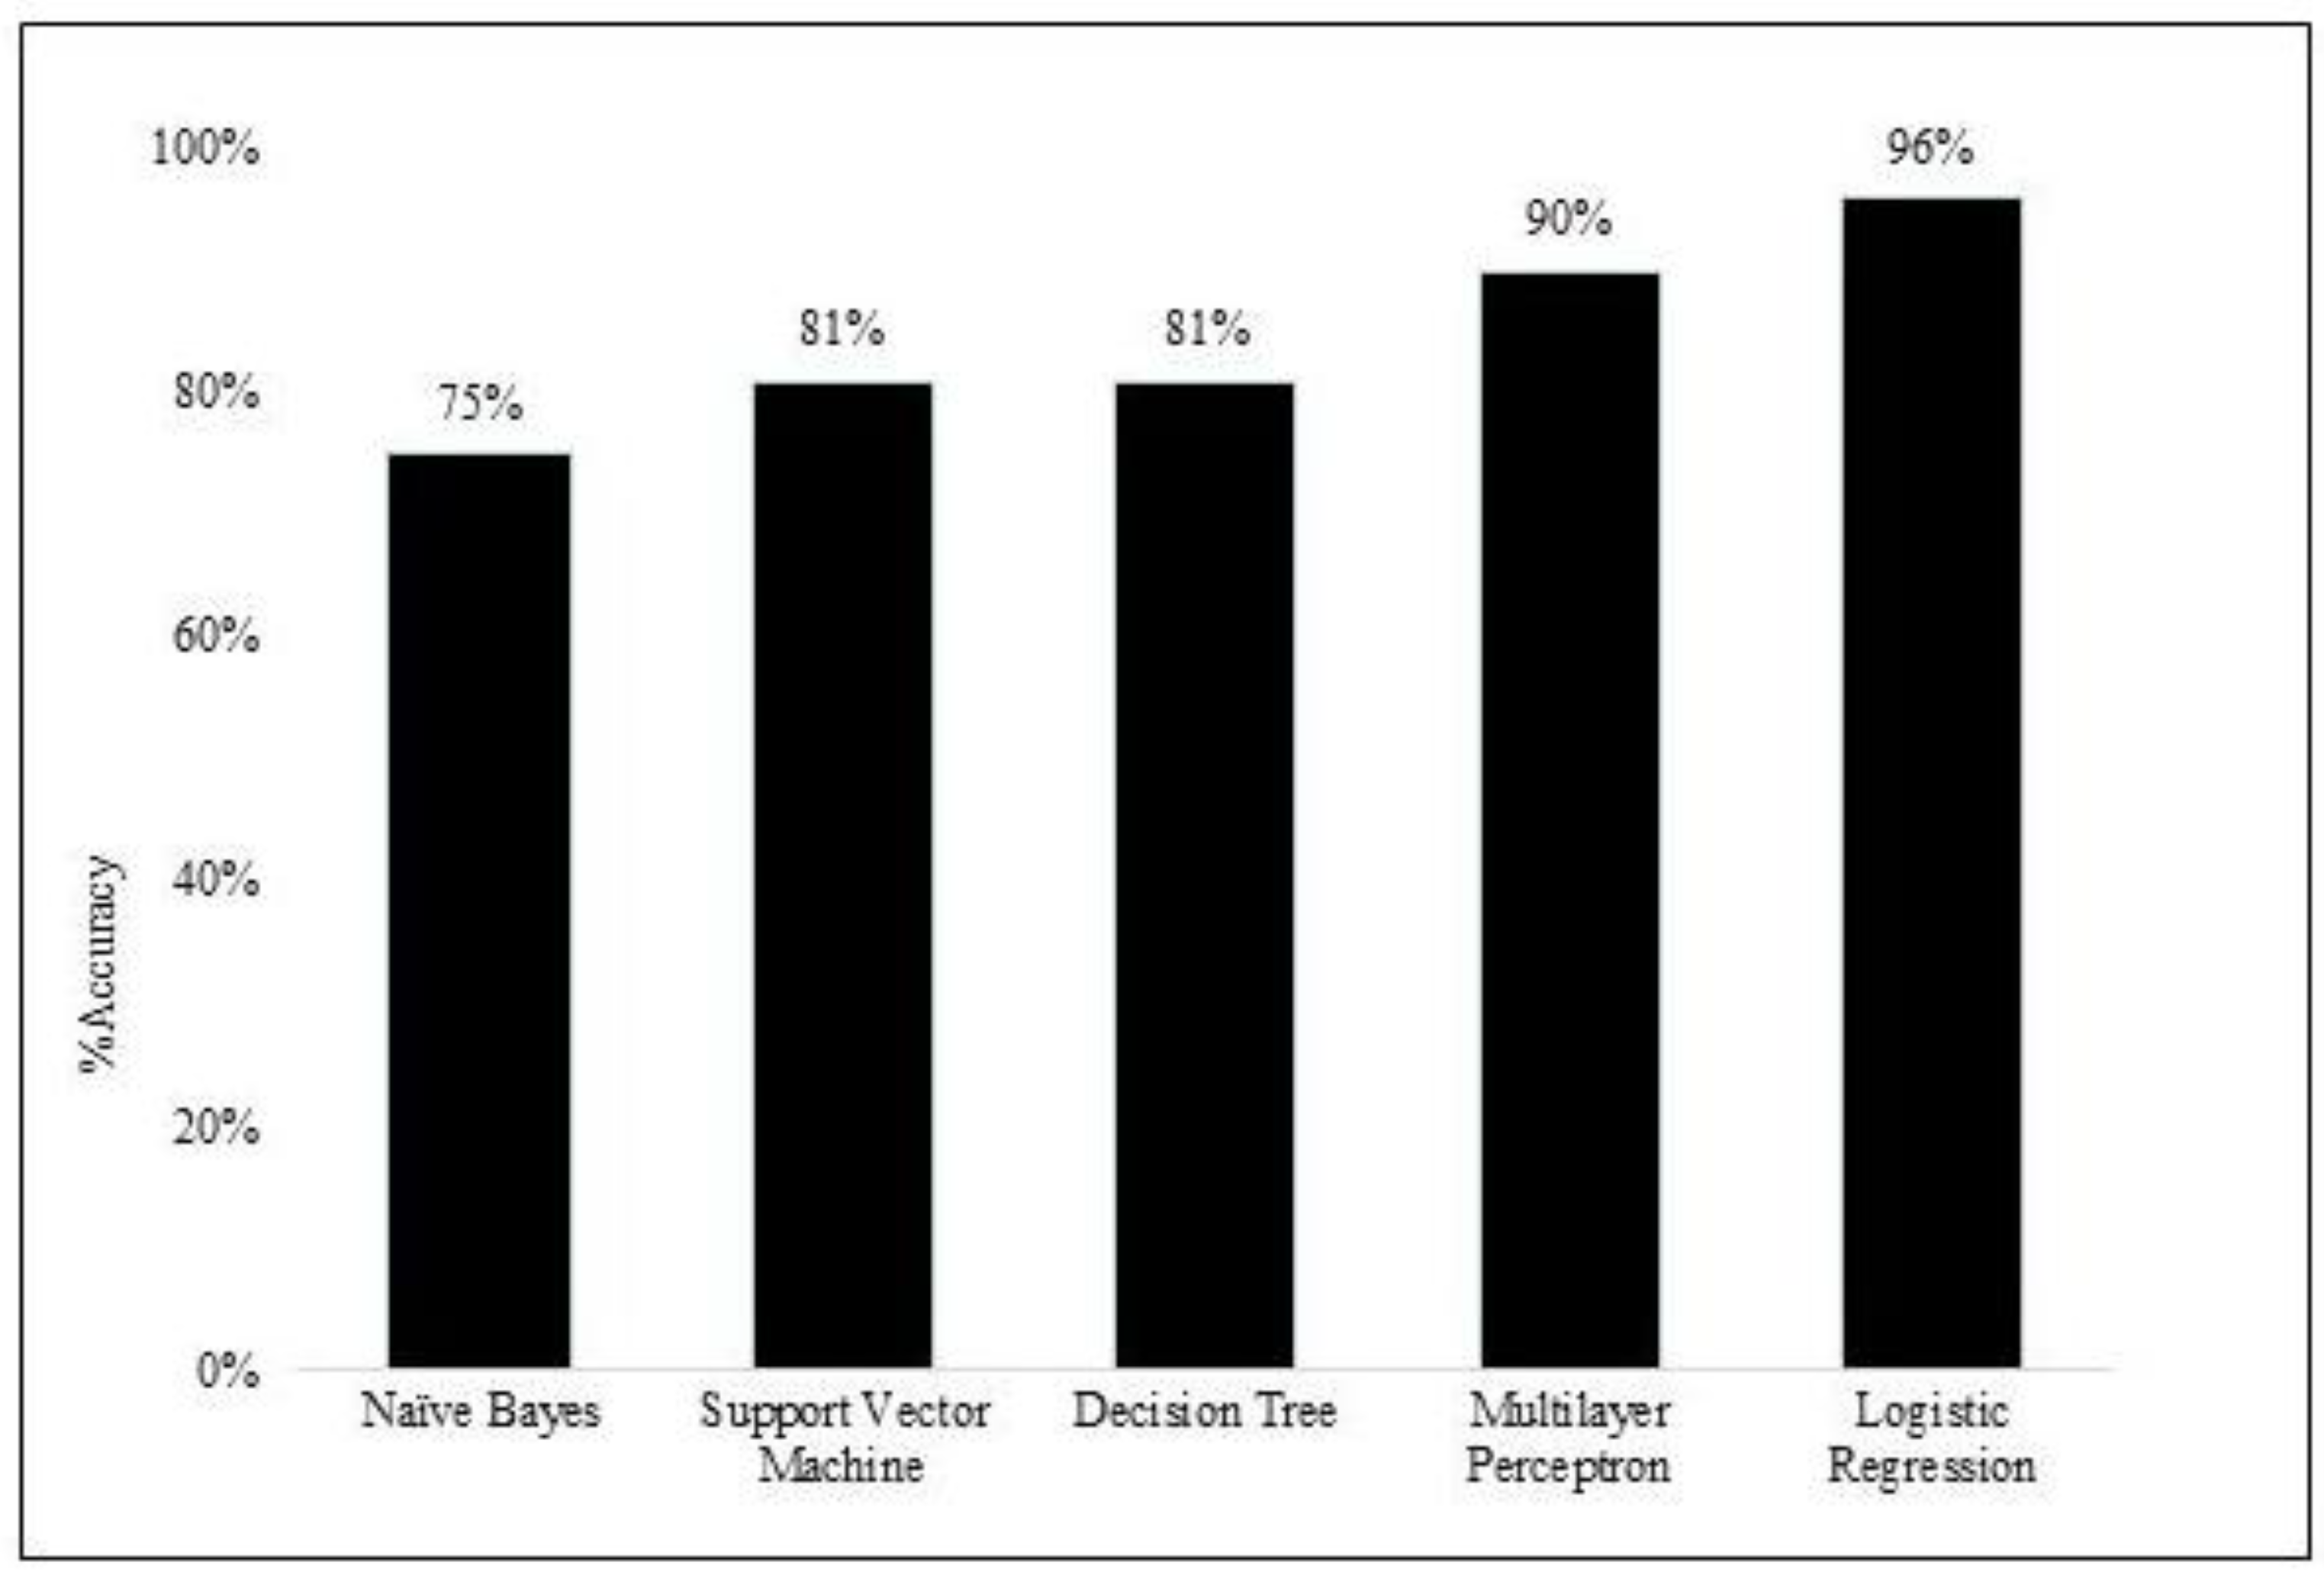

Table 1.
Statistical distribution of demographic variables for estrogen receptor status. ER-positive, estrogen receptor positive (has estrogen binding capacity); ER-negative, estrogen receptor negative (no estrogen binding capacity); Current smokers are those who smoke on either a daily or an occasional basis; Never smoker defined as an individual who has never smoked; former smokers (i.e., do not currently smoke) are individuals who had quit smoking within the past six months (inclusive) prior to study participation. SD, Standard Deviation.
| Total cases (N=238) | ER-positive | ER-negative | p-value | |
|---|---|---|---|---|
| Population | Breast Cancer (N=185) | 164 | 21 | |
| Healthy (N=53) | 0 | 0 | ||
| Race | Black | 11 | 7 | > 0.05 |
| White | 147 | 64 | ||
| Other | 6 | 3 | ||
| Smoking | Current | 18 | 5 | < 0.05 |
| Former | 46 | 14 | ||
| Never | 99 | 54 | ||
| Not Stated | 1 | 1 | ||
| Age | Mean (SD) | 56.86 (12.42) | 52.97 (13.46) | < 0.05 |
| BMI | Mean (SD) | 29.77 (7.28) | 30.30 (7.51) | > 0.05 |
Disclaimer/Publisher’s Note: The statements, opinions and data contained in all publications are solely those of the individual author(s) and contributor(s) and not of MDPI and/or the editor(s). MDPI and/or the editor(s) disclaim responsibility for any injury to people or property resulting from any ideas, methods, instructions or products referred to in the content. |
© 2024 by the authors. Licensee MDPI, Basel, Switzerland. This article is an open access article distributed under the terms and conditions of the Creative Commons Attribution (CC BY) license (http://creativecommons.org/licenses/by/4.0/).
Copyright: This open access article is published under a Creative Commons CC BY 4.0 license, which permit the free download, distribution, and reuse, provided that the author and preprint are cited in any reuse.


