Submitted:
19 October 2024
Posted:
21 October 2024
You are already at the latest version
Abstract
Diabetic kidney disease (DKD) is regarded as a silent assassin due to its delayed signs. It is a progressive illness that can appear in various ways, from mild to severe. The severity of DKD must be determined in order to make educated treatment decisions and understand the hazards that the patient may encounter. DKD is one of the primary causes for death and morbidity among noncommunicable illnesses, affecting 10% to 15% of the global population. Timely prediction of DKD is expected to improve patients' health and reduce mortality. This study aims to predict DKD using machine learning models like Decision Trees, Random Forest, Logistic Regression, Bagging Tree Model and Support Vector Machine, to help in timely detection and cure of this deadly disease. Clinical data required for model training were taken from Kaggle's public repository and additional samples of 50 individuals were collected from local hospital, Coimbatore, Tamil Nadu. Meta-heuristic algorithms based on Swarm Intelligence, such as Particle Swarm Optimization, Ant Colony Optimization, and Firefly Optimization, were employed to optimize the selected models. The main aim of this study is to compare the predictions of different models and identify models that best agree with the given scenario.
Keywords:
1. Introduction
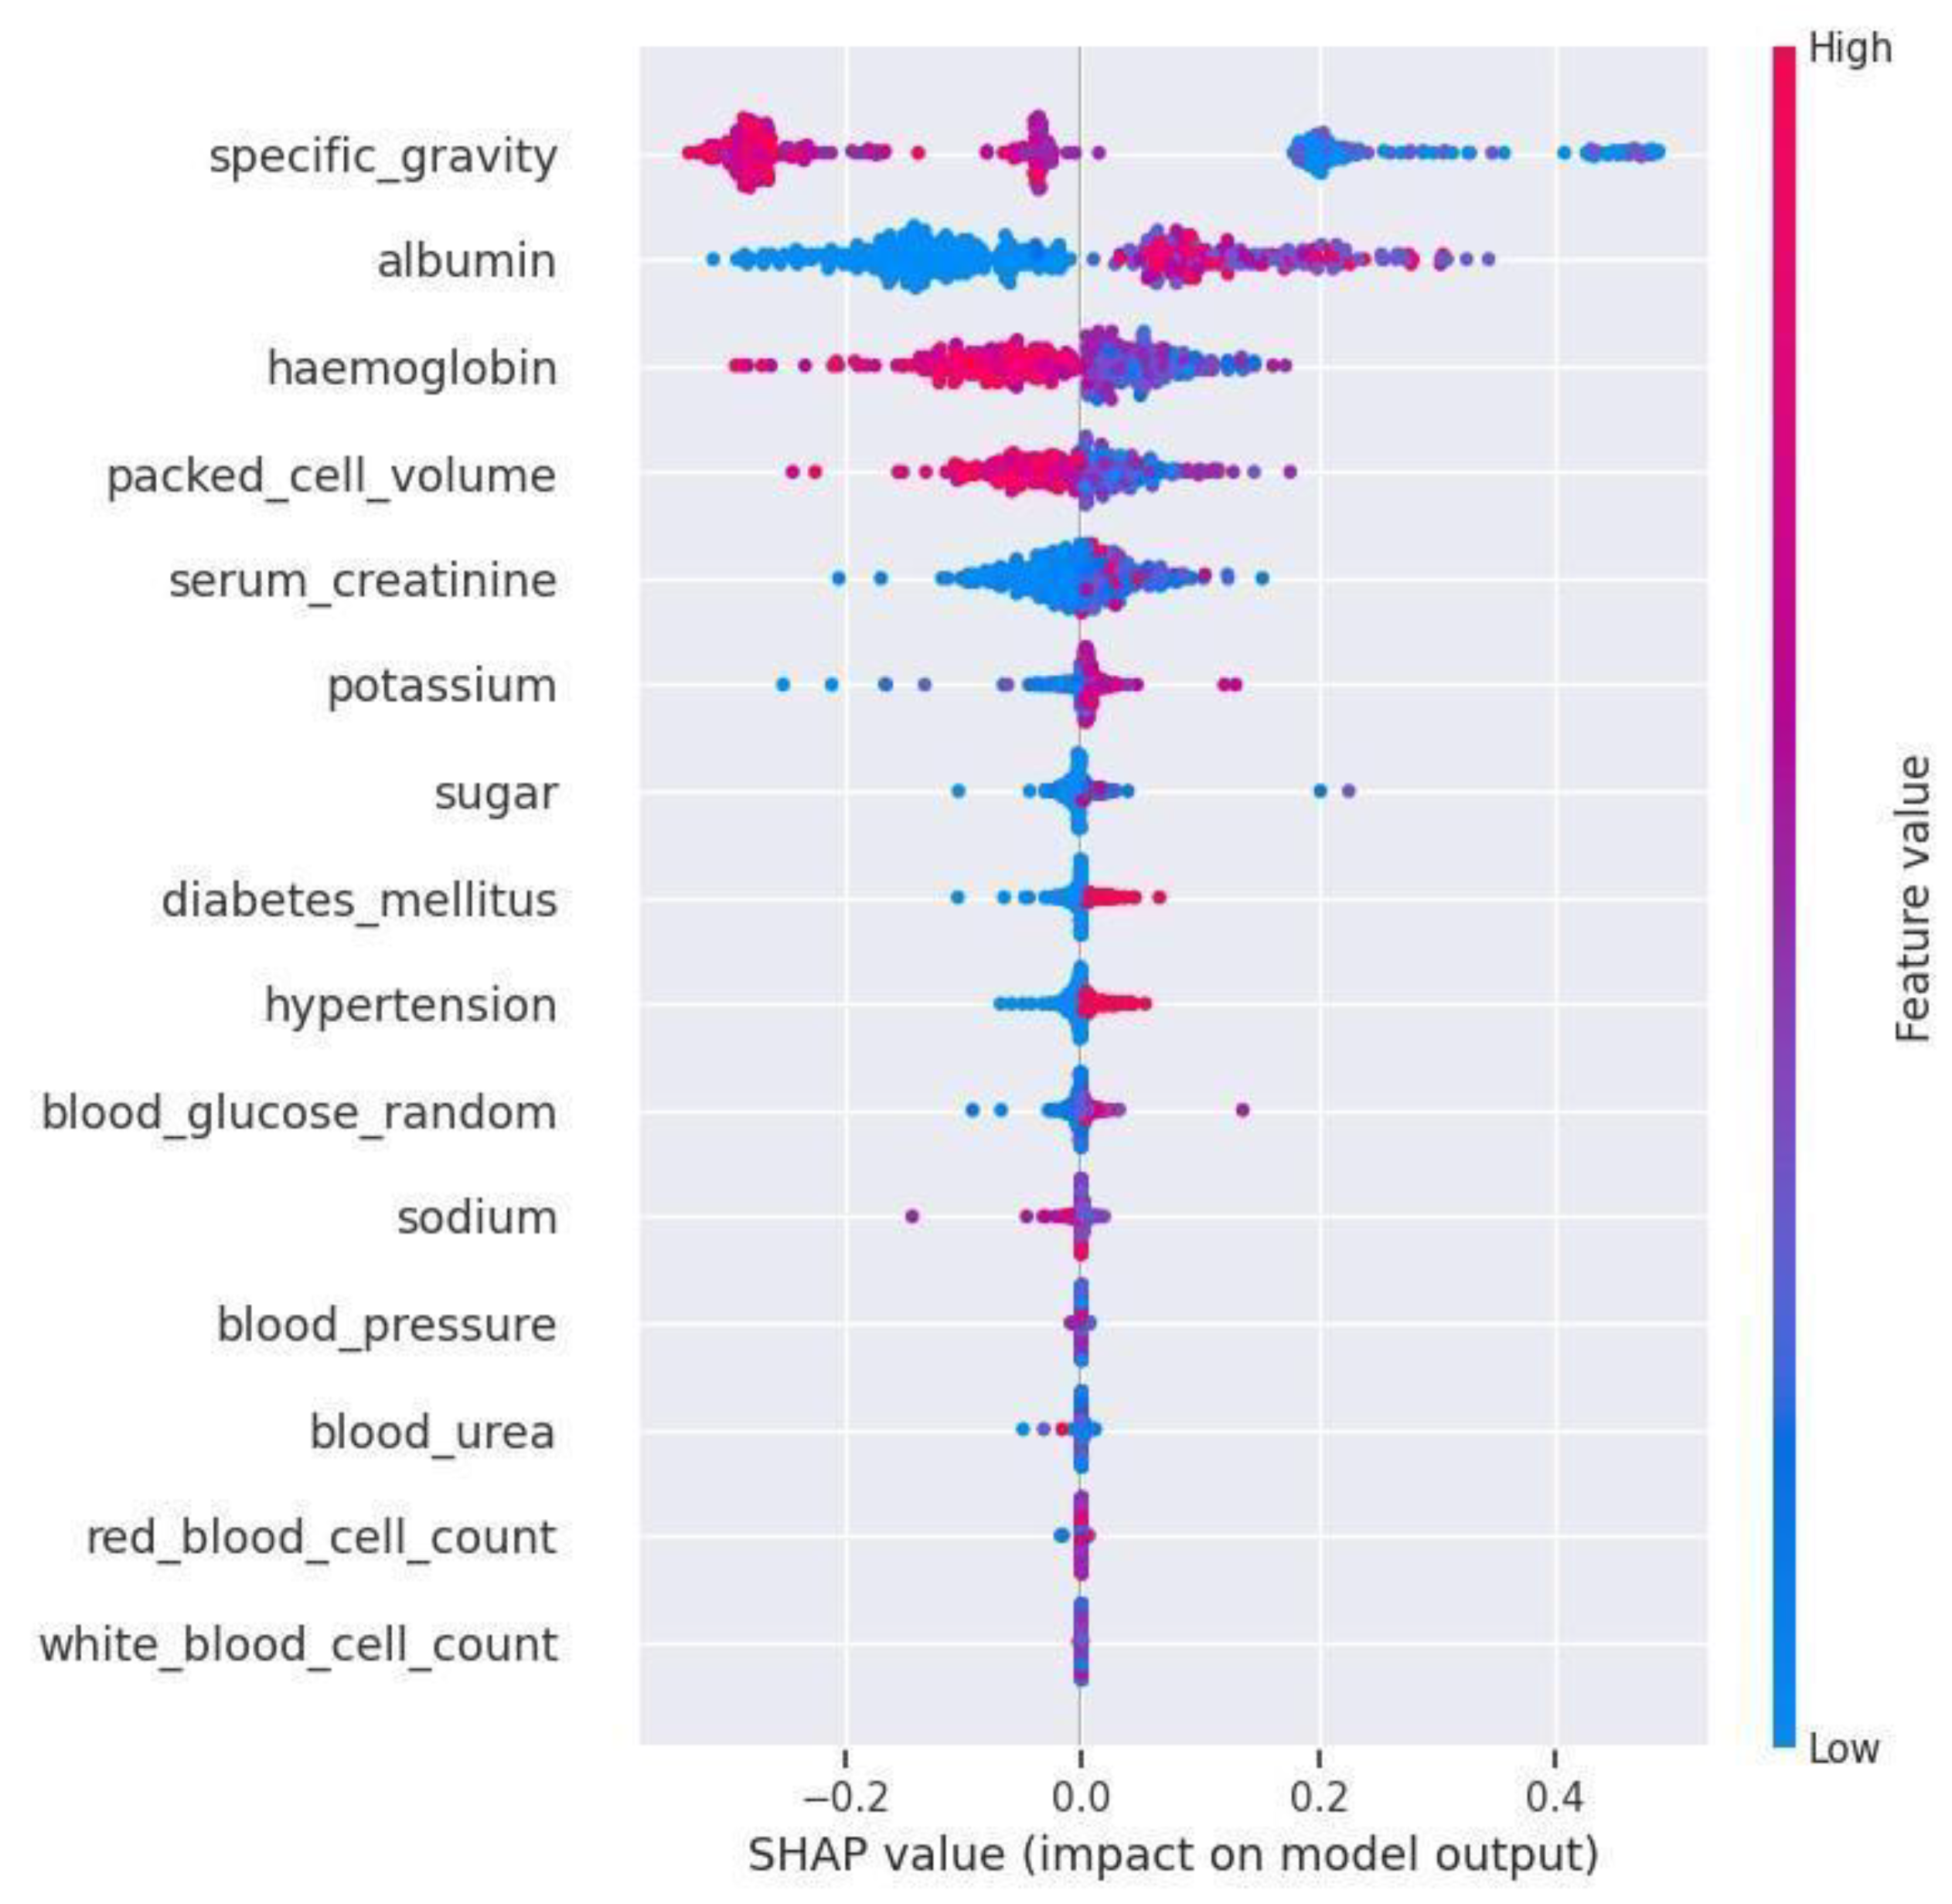
- XGBoost along with SHAP(SHapley Additive exPlanations) was employed for feature selection to enhance the model performance and decrease overfitting.
- The well known machine learning classification algorithms such as Logistic Regression (LR), Decision Tree (DT), Random Forest (RF), Bayesian Tree Model (BTM), and Support Vector Machine (SVM) were trained and evaluated using performance evaluation metrics such as Accuracy, Precision, Recall, Specificity, F1-score and AUC for their effectiveness in predicting kidney disease.
- Most common Swarm Intelligence-based algorithms were utilized for optimization of hyperparameters. Specifically, Particle Swarm Optimization was applied to XGBoost, while Firefly Optimization(FFO) and Ant Colony Optimization(ACO) were utilized for optimizing the LR, DT, RF, BTM and SVM machine learning models. The performance of all models before and after applying FFO and ACO optimization algorithms were compared based on the evaluation metrics.
- The performance of the models was trained and evaluated using a clinical report dataset, which includes diverse information about diabetic patients collected from a private hospital in Coimbatore.
2. Related Work
- Small dataset sizes and challenges in handling missing data.
- Potential biases in the training data was not discussed.
- Unclear data description
- Information about the generalizability of the proposed predictive models for diabetic kidney disease to different populations or settings was not provided.
- Apart from few of the existing studies, mostly the importance of feature selection and model optimization remains unaddressed. The recurring use of advanced algorithms, such as SVM, Random Forest, and Gradient Boosted Trees, along with sophisticated feature selection techniques, underscores the ongoing efforts to mitigate these issues.
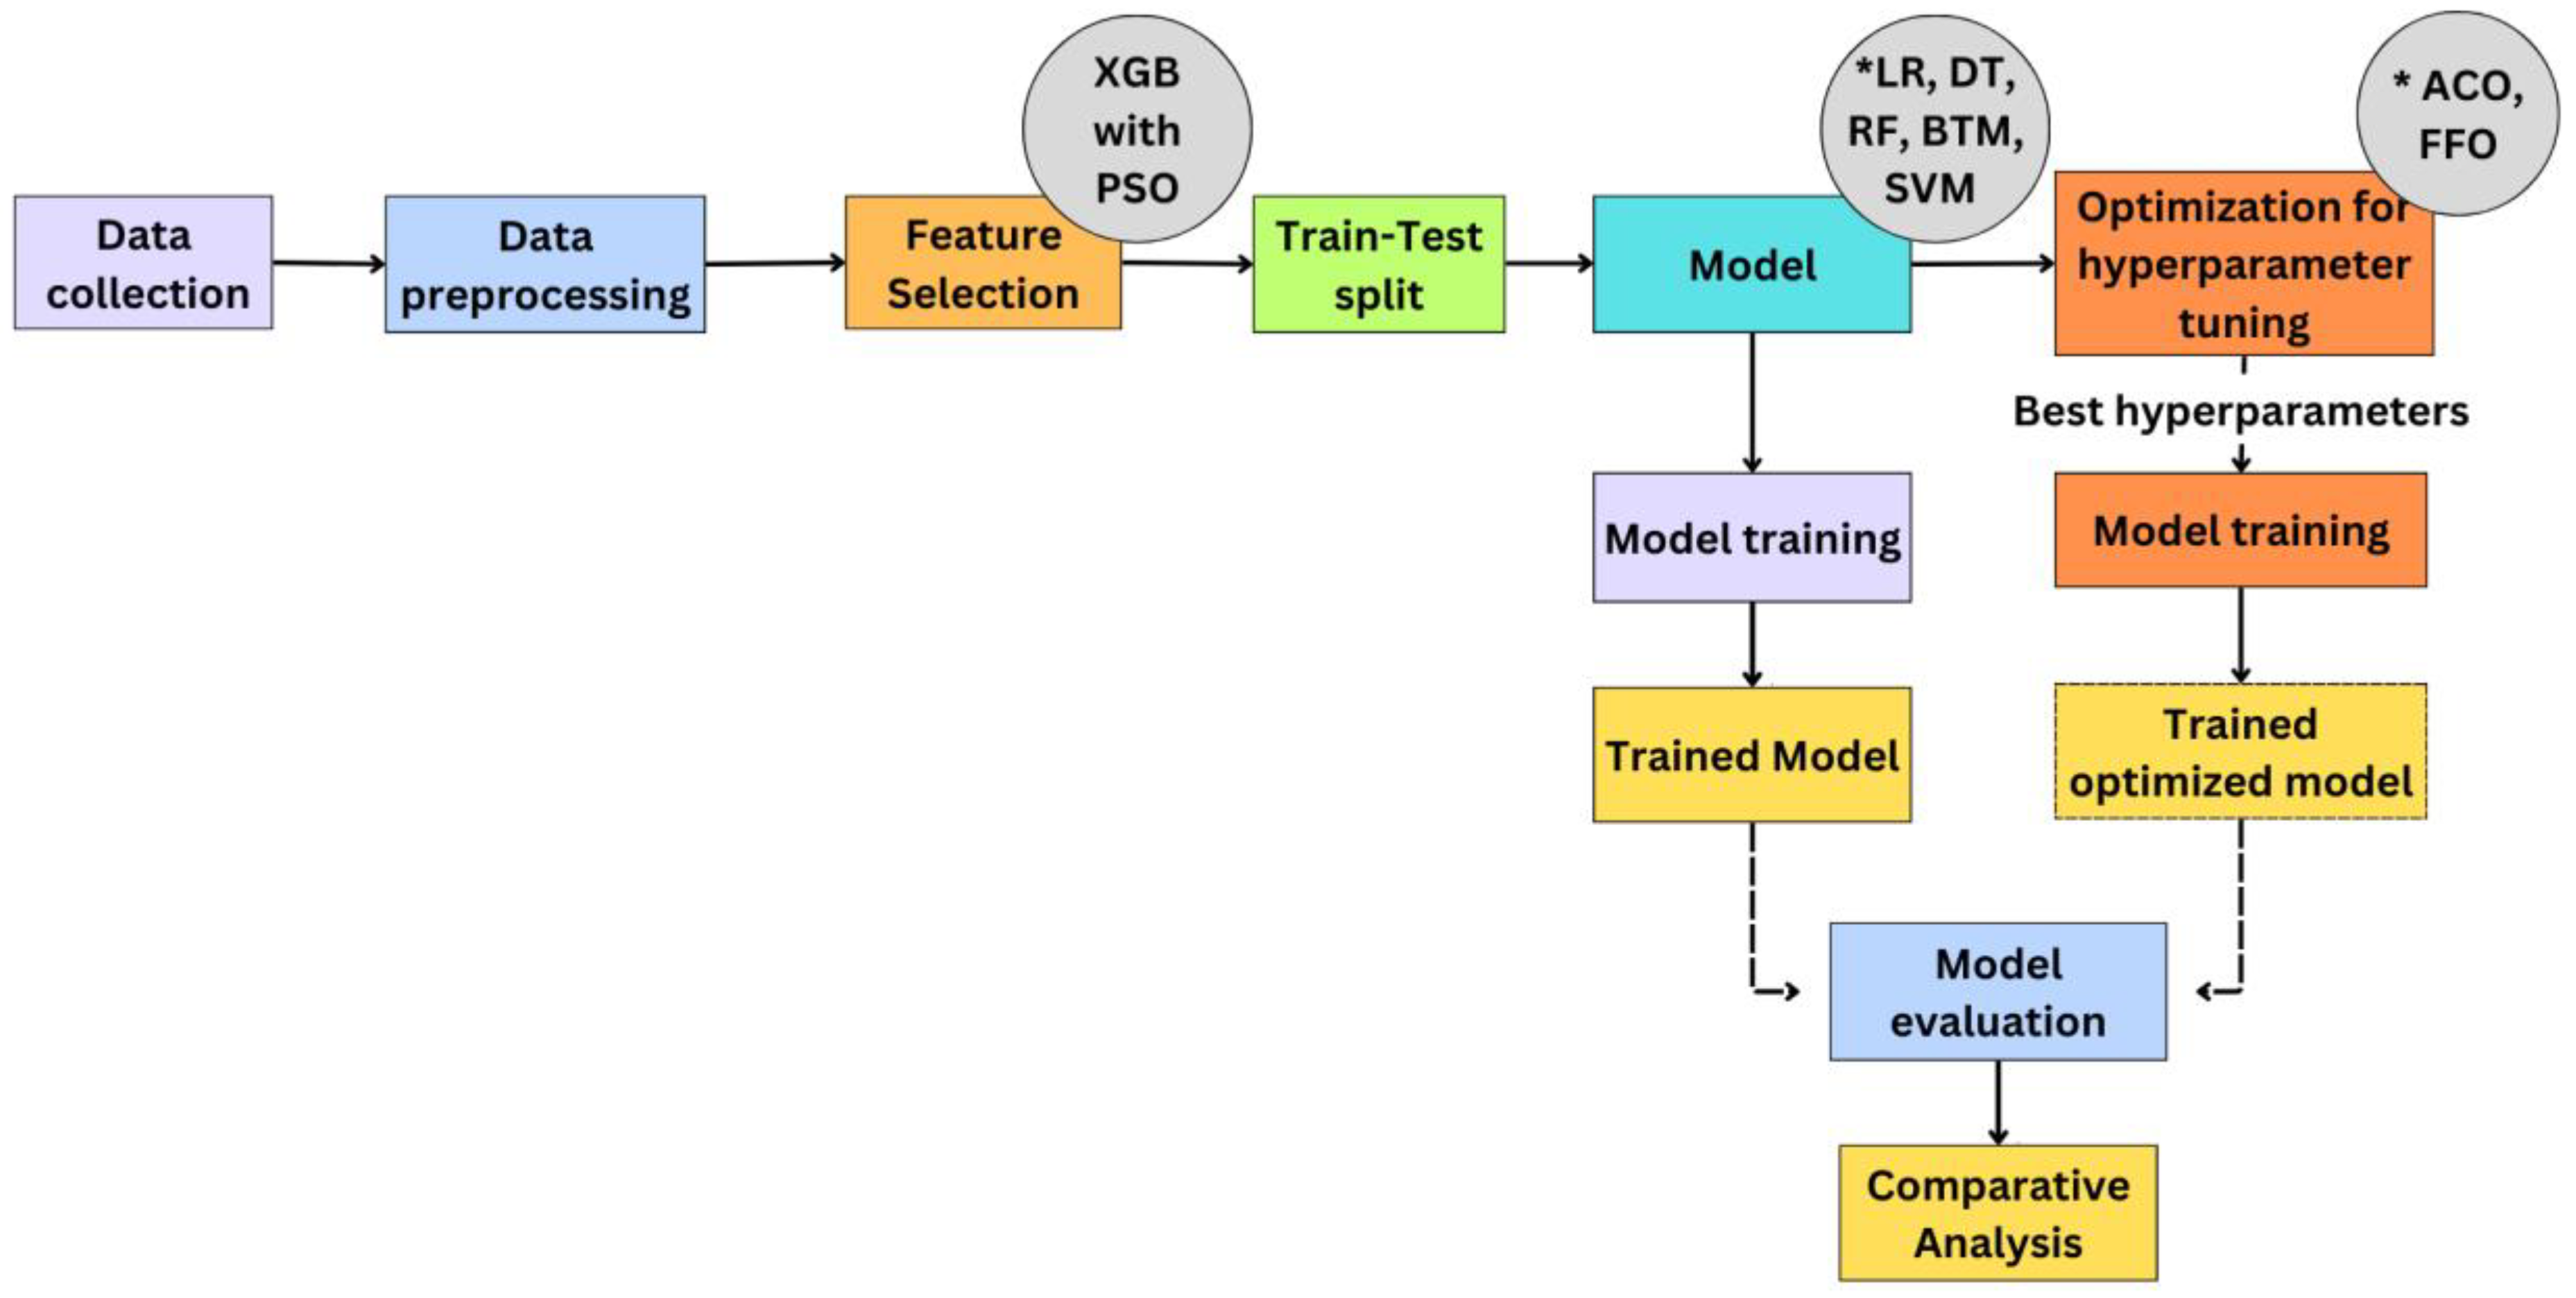
3. Methodology
3.1. Data Collection
3.2. Data Preprocessing
- Managing Missing Values: To handle missing values, the numerical and categorical preprocessing processes entailed imputing the mean and mode, respectively, to the data. This method maintains the dataset’s statistical properties while guaranteeing representative replacements.
- Data Type Conversion: To enable easier handling by numerical-based algorithms, the categorical columns were converted from “object” to “numeric” data types.
- One-Hot Encoding: Transformed categorical attributes into a binary matrix using one-hot encoding to ensure proper interpretation by algorithms, preventing ordinal misinterpretations and enhancing model performance.
- Z-Score Normalization: Standardized the entire dataset using Z-score normalization to enable fair comparison, suppressing the features with larger range from influencing the model training process, and ensuring a mean value of zero and a standard deviation value of one for all numerical features.
3.3. Feature Selection
3.4. Dataset Splitting
3.5. Model Selection
3.5.1. Logistic Regression
3.5.2. Decision Tree
3.5.3. Random Forest
3.5.4. Bayesian Tree Model
3.5.5. Support Vector Machine
3.6. Model Training
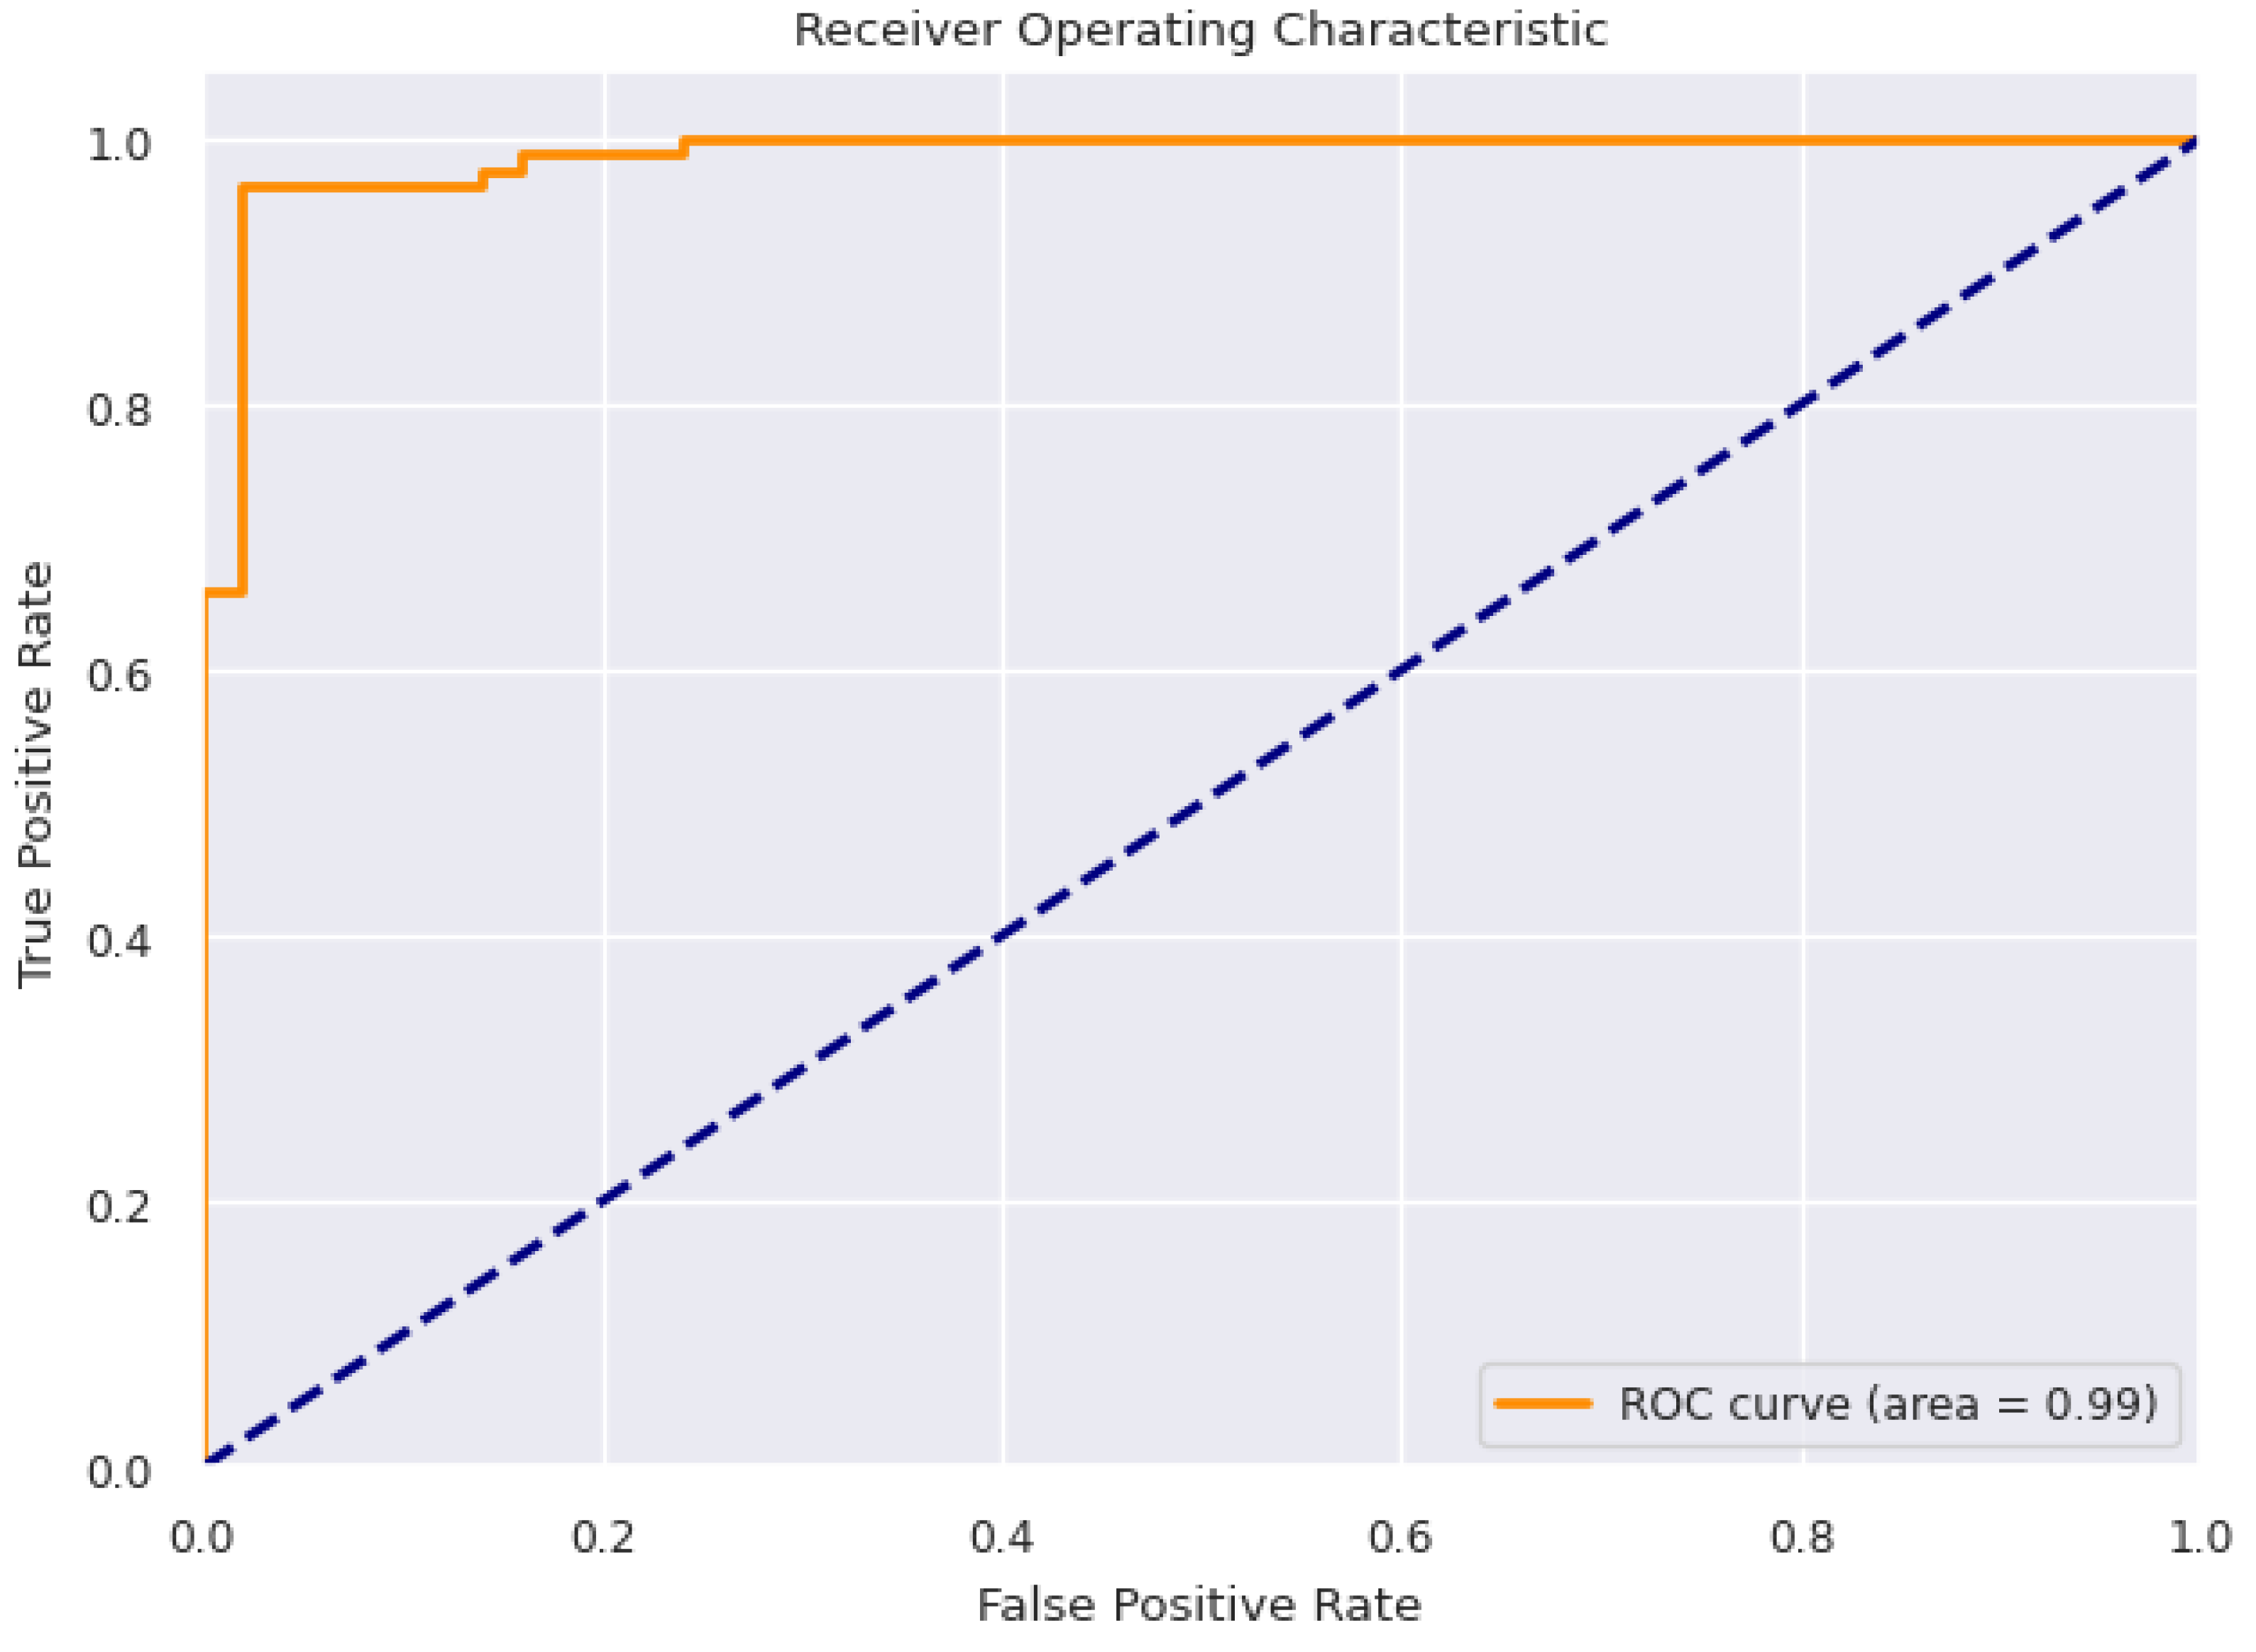
3.7. Model Evaluation
3.8. Hyperparameter Tuning
3.8.1. Swarm Intelligence-Based Optimization Algorithms
3.8.1.1. Particle Swarm Optimization
3.8.1.2. Ant Colony Optimization
3.8.1.3. FireFly Optimization
3.8.1.4. Hyperparameter Tuning Using SI-Based Optimization Algorithms
3.9. Comparative Analysis
4. Result and Discussions
4.1. Feature Importance Findings
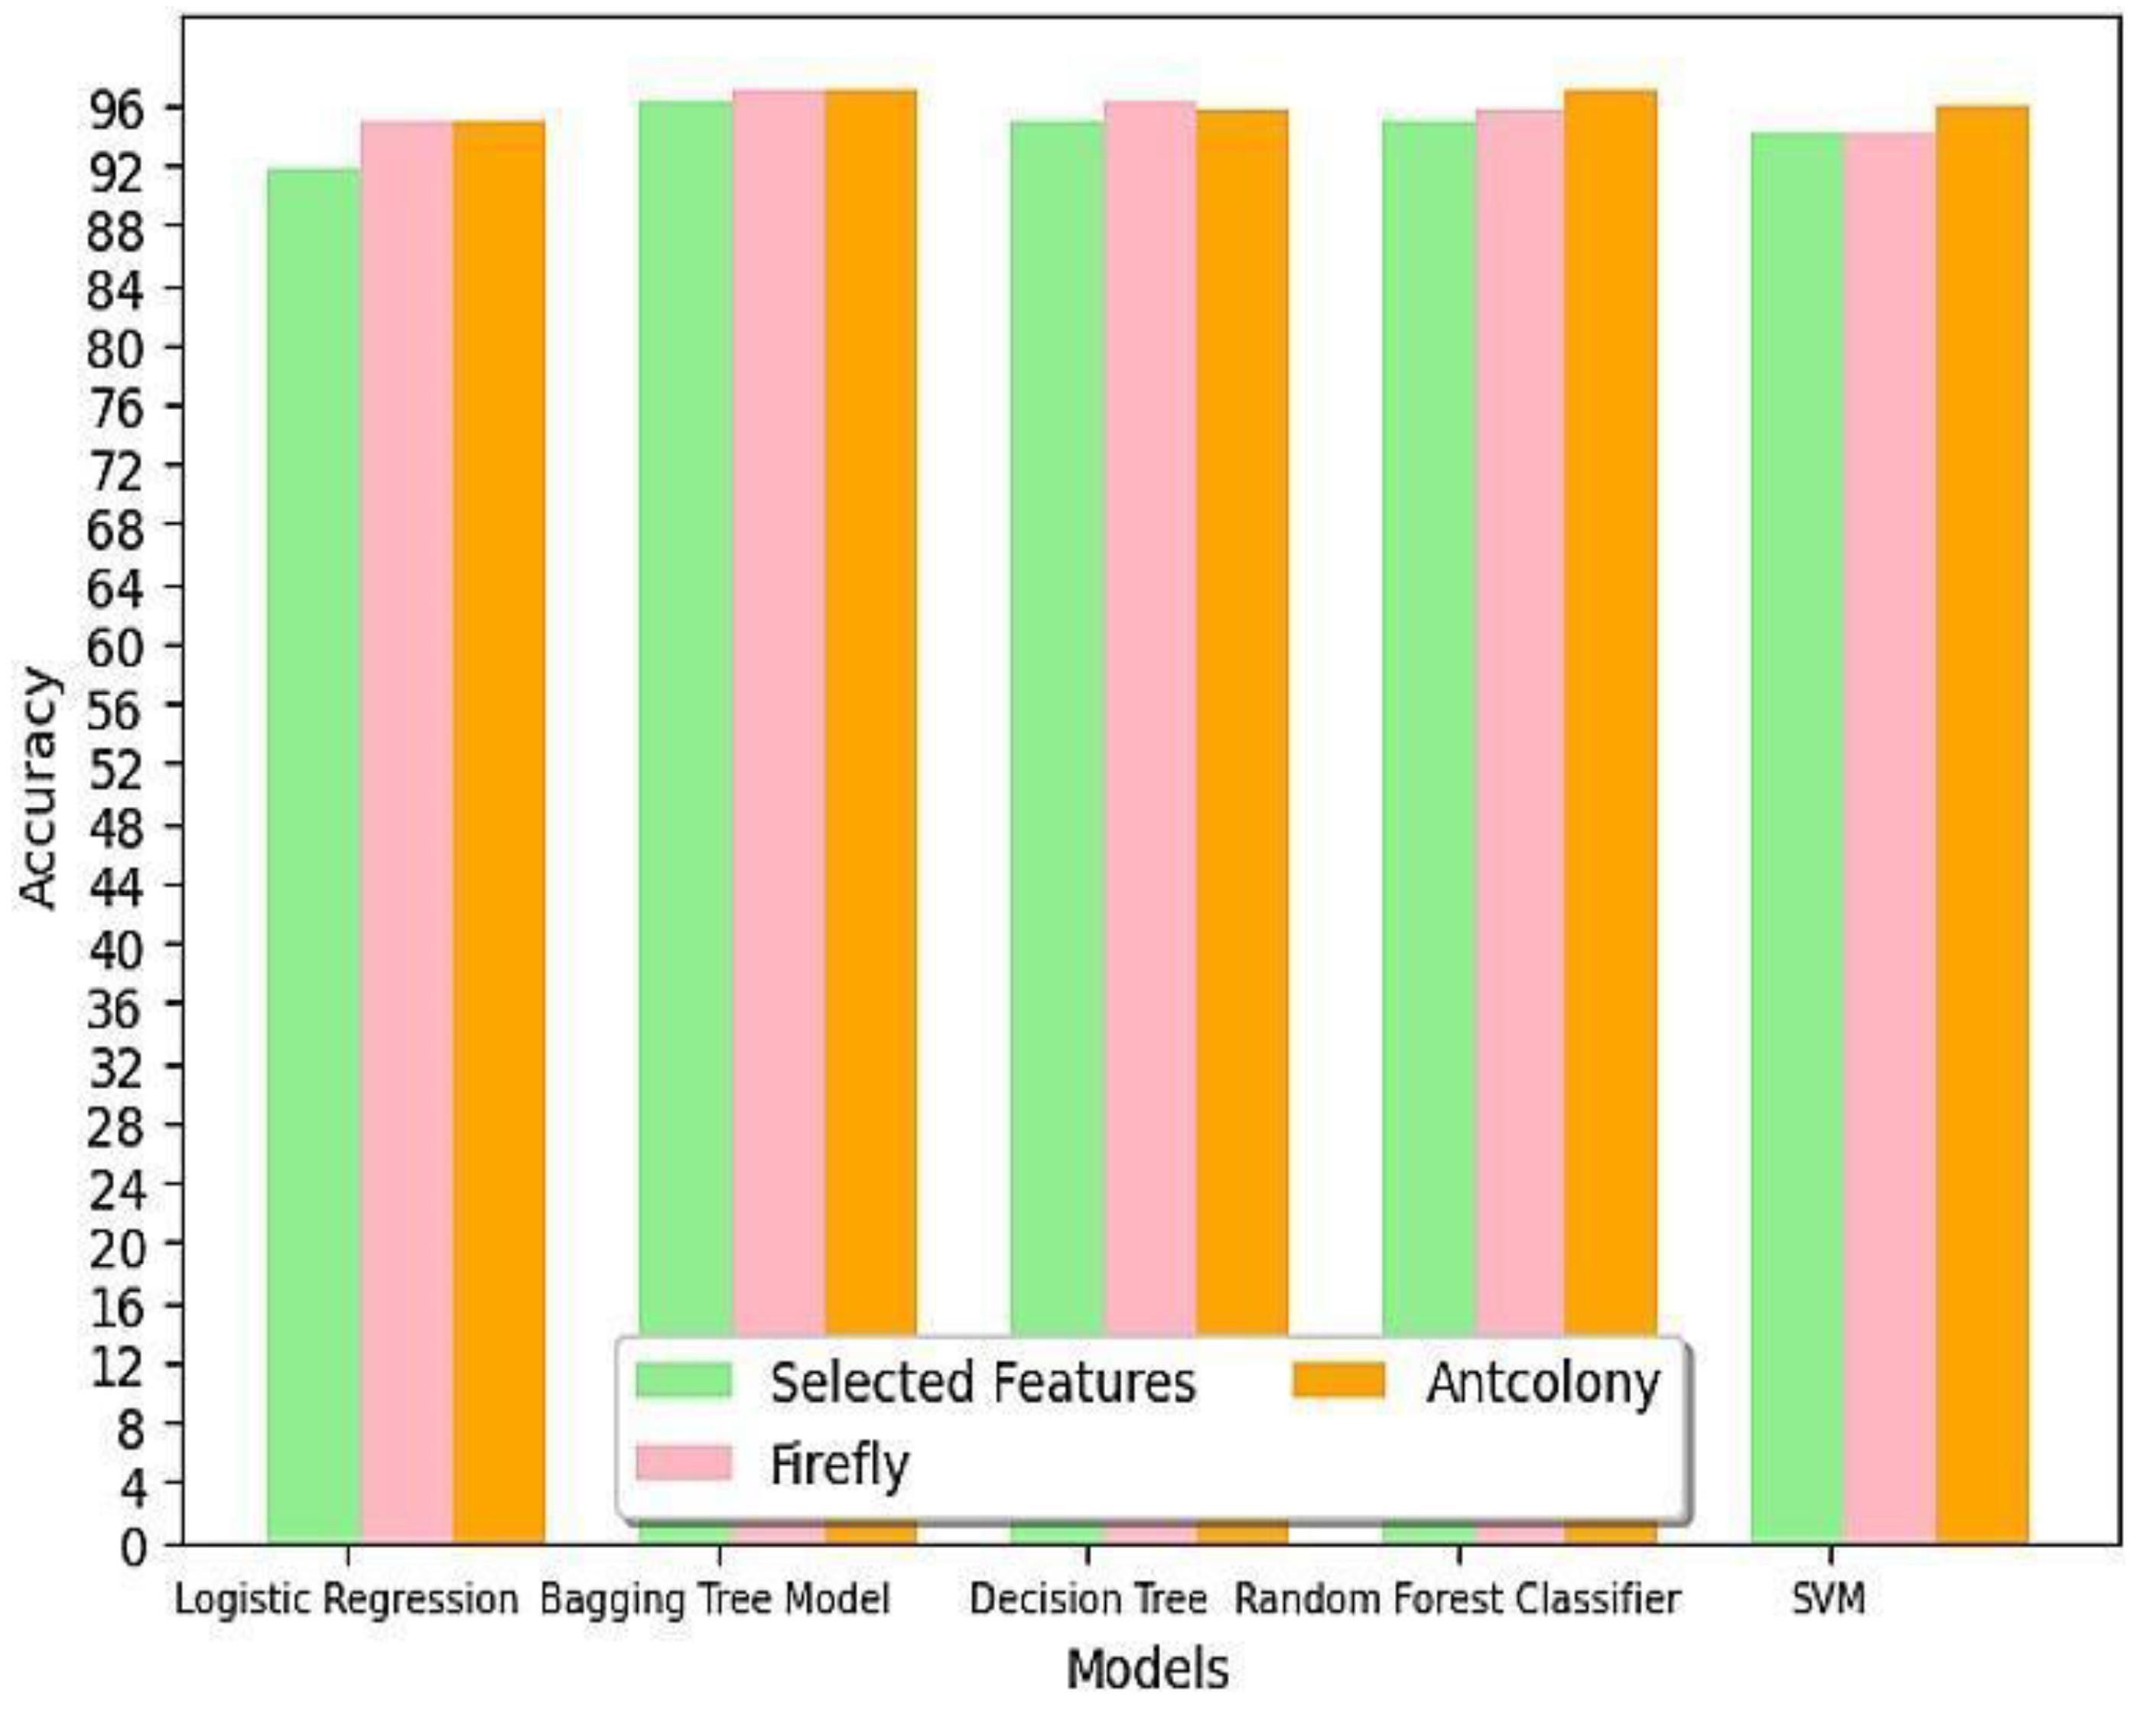
4.2. Comparison of Performance of Machine Learning Models on Selected Features
4.3. Comparison of Performance of Machine Learning Models after Optimization on Selected Features
- Logistic Regression: Both Firefly and Ant Colony Optimization increased the accuracy from 91.85% to 94.81%. Similar impact from both optimization algorithms.
- Bagging Tree Model: Both Firefly and Ant Colony Optimization increased the accuracy from 96.29% to 97.03%. Similar impact from both optimization algorithms.
- Random Trees: Firefly increased the accuracy from 94.81% to 96.29%, while Ant Colony increased it to 95.55%. Firefly performed better for Random Trees.
- Random Forest: Firefly increased the accuracy from 94.81% to 95.55%, while Ant Colony increased it to 97.03%. Ant Colony performed better for Random Forest.
5. Conclusion
Data Availability Statement
References
- Available online: https://www.niddk.nih.gov/health-information/health-statistics/kidney-disease#:~:text=CKD%20is%20most%20common%20among,18%20to%2044%20(6%25).
- Available online: https://www.who.int/news-room/fact-sheets/detail/diabetes.
- Available online: https://www.ncbi.nlm.nih.gov/pmc/articles/PMC4170131/.
- S. Vijayarani, S. S. Vijayarani, S. Dhayanand et al., “Data mining classification algorithms for kidney disease prediction,” International Journal on Cybernetics & Informatics (IJCI), vol. 4, no. 4, pp. 13–25, 2015. [CrossRef]
- W. Gunarathne, K. W. Gunarathne, K. Perera, and K. Kahandawaarachchi, “Performance evaluation on machine learning classification techniques for disease classification and forecasting through data analytics for chronic kidney disease (ckd),” in 2017 IEEE 17th International Conference on Bioinformatics and Bioengineering (BIBE). IEEE, 2017, pp. 291–296.
- 2018. Available online: https://www.researchgate.net/publication/329395701_Prediction_of_Chronic_Kidney_Disease_Using_Machine_Learning_Algorithm.
- 2019. Available online: https://www.researchgate.net/profile/Revathy-Ramesh-3/publication/341398109_Chronic_Kidney_Disease_Prediction_using_machine_Learning_Models/links/5ebe42b1458515626ca85977/Chronic-Kidney-Disease-Prediction-using-Machine-Learning-Models.pdf.
- Rani KJ 2020 Diabetes prediction using machine learning. International Journal of Scientific Research in Computer Science Engineering and Information Technology. 6:294-305.
- Ifraz GM, Rashid MH, Tazin T, Bourouis S, Khan MM 2021 Comparative analysis for prediction of kidney disease using intelligent machine learning methods. Computational and Mathematical Methods in Medicine.
- Available online: https://www.ncbi.nlm.nih.gov/pmc/articles/PMC8772425/.
- Pal S 2023 Prediction for chronic kidney disease by categorical and non_categorical attributes using different machine learning algorithms.Multimedia Tools and Applications.82(26):41253-66.
- Kaur C, Kumar MS, Anjum A, Binda MB, Mallu MR, Al Ansari MS 2023 Chronic kidney disease prediction using machine learning. Journal of Advances in Information Technology.14(2):384-91.
- 1999. Available online: https://www.kaggle.com/datasets/abhia1999/chronic-kidney-disease/data.
- Ogunleye, A. and Wang, Q.G., 2019. XGBoost model for chronic kidney disease diagnosis. IEEE/ACM transactions on computational biology and bioinformatics, 17(6), pp.2131-2140.
- Wang, D. , Tan, D. and Liu, L., 2018. Particle swarm optimization algorithm: an overview. Soft computing, 22(2), pp.387-408. [CrossRef]
- Chu, C.C.F. and Chan, D.P.K., 2020. Feature selection using approximated high-order interaction components of the Shapley value for boosted tree classifier. IEEE Access, 8, pp.112742-112750. [CrossRef]
- Al Imran, A. , Amin, M.N. and Johora, F.T., 2018, December. Classification of chronic kidney disease using logistic regression, feedforward neural network and wide & deep learning. In 2018 International Conference on Innovation in Engineering and Technology (ICIET) (pp. 1-6). IEEE.
- Patel HH, Prajapati P 2018 Study and analysis of decision tree based classification algorithms. International Journal of Computer Sciences and Engineering.6(10):74-8.
- Biau G 2012 Analysis of a random forests model. The Journal of Machine Learning Research.13(1):1063-95.
- Kotsiantis SB, Tsekouras GE, Pintelas PE 2005 Bagging model trees for classification problems.Springer Berlin Heidelberg. InAdvances in Informatics.10th Panhellenic Conference on Informatics, PCI 2005, Volas, Greece, -13, 2005. Proceedings 10 2005. (pp. 328-337). 11 November.
- Wang L, editor 2005 Support vector machines: theory and applications. Springer Science & Business Media.
- Poli, R. , Kennedy, J. and Blackwell, T., 2007. Particle swarm optimization: An overview. Swarm intelligence, 1, pp.33-57.
- Dorigo M, Blum C 2005 Ant colony optimization theory: A survey. Theoretical computer science.344(2-3):243-78.
- Johari, N.F. , Zain, A.M., Noorfa, M.H. and Udin, A., 2013. Firefly algorithm for optimization problem. Applied Mechanics and Materials, 421, pp.512-517. [CrossRef]

| 1 | age | 13 | sodium |
| 2 | blood_pressure | 14 | potassium |
| 3 | specific_gravity | 15 | hemoglobin |
| 4 | albumin | 16 | packed_cell_volume |
| 5 | sugar | 17 | white_blood_cell_count |
| 6 | red_blood_cells | 18 | red_blood_cell_count |
| 7 | pus_cell | 19 | hypertension |
| 8 | pus_cell_clumps | 20 | diabetes_mellitus |
| 9 | bacteria | 21 | coronary_artery_disease |
| 10 | blood_glucose_random | 22 | appetite |
| 11 | blood_urea | 23 | peda_edema |
| 12 | serum_creatinine | 24 | anemia |
| Attribute | Max | Min | Mean | Median | Mode | Std Dev |
|---|---|---|---|---|---|---|
| age | 90 | 2 | 52.2 | 54 | 60 | 16.74 |
| blood_pressure | 180 | 50 | 77 | 80 | 80 | 13.33 |
| specific_gravity | 1.03 | 1.005 | 1.017 | 1.017 | 1.02 | 0.0054 |
| albumin | 5 | 0 | 1.1 | 1 | 0 | 1.32 |
| sugar | 5 | 0 | 0.42 | 0 | 0 | 0.99 |
| blood_glucose_random | 490 | 22 | 150.58 | 129 | 150.58 | 75.5 |
| blood_urea | 391 | 1.5 | 57.71 | 44 | 57.71 | 49.72 |
| serum_creatinine | 76 | 0.4 | 2.95 | 1.5 | 1.2 | 5.33 |
| sodium | 163 | 4.5 | 137.15 | 137.15 | 137.15 | 8.94 |
| potassium | 47 | 2.5 | 4.57 | 4.57 | 4.57 | 2.67 |
| hemoglobin | 17.8 | 3.1 | 12.33 | 12.33 | 12.33 | 2.72 |
| packed_cell_volume | 54 | 9 | 38.16 | 38.16 | 38.16 | 8.15 |
| white_blood_cell_count | 3130 | 2130 | 8570 | 8570 | 8570 | 2879.43 |
| red_blood_cell_count | 8 | 2.1 | 4.62 | 4.62 | 4.62 | 0.85 |
| Optimization algorithm | Fitness function | Population parameters |
|---|---|---|
| Firefly Optimization | Fitness = min(1-accuracy) | n_fireflies= 10 |
| Ant Colony Optimization | Fitness = min(1-accuracy) | n_ants = 10 |
| Name | Importance | |
|---|---|---|
| 1 | specific_gravity | 90.473 |
| 2 | albumin | 52.7335 |
| 3 | hemoglobin | 25.926 |
| 4 | packed_cell_volume | 16.3345 |
| 5 | serum_creatinine | 13.2435 |
| 6 | potassium | 4.3295 |
| 7 | sugar | 3.575 |
| 8 | diabetes_mellitus | 2.8815 |
| 9 | hypertension | 2.877 |
| 10 | blood_glucose_random | 2.055 |
| 11 | sodium | 1.0165 |
| 12 | blood_pressure | 0.331 |
| 13 | blood_urea | 0.316 |
| 14 | red_blood_cell_count | 0.12 |
| METRICS | Accuracy | Precision | Recall | Specificity | F1-score |
|---|---|---|---|---|---|
| MODELS | |||||
| Logistic Regression | 91.85 | 98.68 | 88.23 | 98 | 93.16 |
| Bagging Tree Model | 95.55 | 98.76 | 94.11 | 98 | 96.38 |
| Decision Trees | 94.81 | 98.75 | 92.94 | 98 | 95.75 |
| Random Forest | 94.81 | 95.34 | 96.47 | 92 | 95.9 |
| Support Vector Machine | 93.33 | 97.5 | 91.76 | 96 | 94.54 |
| METRICS | Accuracy | Precision | Recall | Specificity | F1-score |
|---|---|---|---|---|---|
| MODELS | |||||
| Logistic Regression | 91.85 | 98.68 | 88.23 | 98 | 93.16 |
| Bagging Tree Model | 96.29 | 98.78 | 95.29 | 98 | 97 |
| Decision Trees | 94.81 | 98.75 | 92.94 | 98 | 95.75 |
| Random Forest | 94.81 | 95.34 | 96.47 | 92 | 95.9 |
| Support Vector Machine | 94.07 | 97.53 | 92.94 | 96 | 95.18 |
| Model | Hyperparameter | Hyperparameter value | ||
|---|---|---|---|---|
| Before optimization | After FFO | After ACO | ||
| Logistic Regression | max_iter | 2 | 91 | 122 |
| Bagging Tree Model | n_estimators | 20 | 6 | 129 |
| Decision Trees | max_depth | 3 | 32 | 29 |
| Random Forest | n_estimators | 5 | 25 | 96 |
| Support Vector Machine | C, gamma | 0.01,0.001 | 3.49, 0.48 | 1, 0.1 |
| Model | Accuracy before optimization | Accuracy after FFO | Accuracy after ACO |
|---|---|---|---|
| Logistic Regression | 91.85 | 94.81 | 94.81 |
| Bagging Tree Model | 96.29 | 97.03 | 97.03 |
| Decision Trees | 94.81 | 96.29 | 95.55 |
| Random Forest | 94.81 | 95.55 | 97.03 |
| Support Vector Machine | 94.07 | 94.07 | 96 |
| Algorithm | Highest accuracy achieved |
|---|---|
| Bagging Tree Model with both Ant Colony and Firefly optimization | 97.03 % |
| Random Forest with Ant Colony optimization | 97.03 % |
| Decision Tree with Firefly optimization | 96.29 % |
Disclaimer/Publisher’s Note: The statements, opinions and data contained in all publications are solely those of the individual author(s) and contributor(s) and not of MDPI and/or the editor(s). MDPI and/or the editor(s) disclaim responsibility for any injury to people or property resulting from any ideas, methods, instructions or products referred to in the content. |
© 2024 by the authors. Licensee MDPI, Basel, Switzerland. This article is an open access article distributed under the terms and conditions of the Creative Commons Attribution (CC BY) license (http://creativecommons.org/licenses/by/4.0/).


