

Submitted:
17 October 2024
Posted:
17 October 2024
You are already at the latest version
Abstract
Diabetes is a significant global health issue impacting millions. Approximately 26 million diabetics experience foot ulcers, with 20% leading to amputations, resulting in high morbidity, mortality, and costs. Plantar pressure screening shows potential for the early detection of Diabetic Foot Ulcers (DFUs). Although foot ulcers often occur due to excessive pressure on the soles during dynamic activities, most studies focus on static pressure measurements. This study’s primary objective is to apply wireless plantar pressure sensor-embedded insoles to classify and detect diabetic feet from healthy ones based on dynamic plantar pressure. The secondary objective is to compare statistical-based and Machine Learning (ML) classification methods. Data from 150 subjects were collected using the insoles during walking, revealing that diabetic feet have higher plantar pressure than healthy feet, consistent with prior research. The Adaptive Boosting (AdaBoost) ML model achieved the highest accuracy of 0.85, outperforming the statistical method, which had an accuracy of 0.67. These findings suggest that ML models, combined with pressure sensor-embedded insoles, can effectively classify healthy and diabetic feet using plantar pressure features. Future research will focus on using these insoles with ML to classify various stages of diabetic neuropathy, aiming for early prediction of foot ulcers in home settings.
Keywords:
Diabetic foot
; machine learning algorithms
; plantar pressure
; pressure sensor
; smart insole
; statistical analysis
1. Introduction
Diabetes affects a substantial global population, with approximately 540 million people living with the condition [1]. Among its complications, Diabetic Foot Ulcers (DFUs) is one of the most common complications of diabetes, a major cause of lower limb amputations and mortality. DFUs occur from a combination of peripheral neuropathy and poor circulation, impairing wound healing. If left untreated, these ulcers can become infected, leading to severe tissue damage and, in many cases, the need for amputation. It is estimated that approximately 20 million people worldwide suffer from DFUs, while an additional 130 million individuals are at significant risk of developing the condition. This results in nearly 9 million hospitalizations and 2 million amputations annually [2,3,4].
Lower limb amputations not only impact patients’ quality of life but also contribute to increased mortality rates, making early diagnosis and treatment essential. The associated financial burden is considerable, with the average cost per patient-year being $3,368 for ulcer-only cases, $10,468 for minor amputations, and $30,131 for major amputations globally [5]. Therefore, DFU is a severe problem that requires preventive measures. Early detection of the neuropathic condition of the foot is crucial due to the potential severity of its complications.
Most literature acquires data for early DFU detection or classification while the patient is in static mode [6,7,8,9,10,11,12,13,14,15,16]. It is shown that excess plantar pressure occurs during dynamic mode and also can cause foot ulcers [17,18]. Therefore, this work applies a wireless pressure sensor-embedded insole to monitor dynamic plantar pressure instead of static data. The primary objective of this research paper is to conceptually show that the wearable pressure sensor-embedded insole can be used to classify healthy and diabetic feet. The secondary objective is to conduct a comparative study between the statistic-based and machine learning approaches for smart insole-based plantar pressure analysis in diabetes and healthy feet classification. By evaluating the strengths and limitations of both methodologies, this study sheds light on which approach holds more significant promise for accurate and reliable classification. Results show that the Boosting model with Principal Component Analysis (PCA) has the highest accuracy of 0.85, whereas with the statistic-based model, we achieved an accuracy of 0.67. The contributions of this research are:
- Use of wireless pressure sensor-embedded smart insole to collect dynamic plantar pressure data during gait for classification of healthy and diabetic feet.
- Use of feature extraction from the dynamic plantar pressure data obtained from smart insoles, which can classify healthy and diabetic feet accurately.
- Performance comparison of different machine learning models and identify the optimal model for classification of diabetic feet.
- Comparing the statistic-based and machine learning models for healthy and diabetic feet classification.
2. Related Work
Innovative systems have emerged to detect diabetic foot ulcers (DFUs) and associated risks. This work encompasses a range of methods, including manual inspections by healthcare providers (such as the monofilament test and biofilm identification), foot thermal analysis, foot imaging analysis, and plantar pressure analysis. Some DFU detection and classification methods rely on manual inspection [6,7], while others utilize machine learning-based approaches [8,9,10,11,12,13,14] or statistical approaches [15,16]. Although manual inspection is employed for the early detection of DFUs, most other methods may not be specifically designed for early prediction, which is essential for proactive intervention.
2.1. Manual Inspections by Healthcare Providers
Traditional biofilm identification methods are often invasive and technically complex, limiting their clinical use [6]. In contrast, wound blotting offers a non-invasive, faster approach, improving early intervention and treatment outcomes [6]. On the other hand, the monofilament test is a simple, cost-effective tool commonly used to detect sensory loss in patients at risk of DFUs [7]. Healthcare professionals apply a monofilament to areas of the foot, relying on subjective interpretation to identify sensory loss.
Despite their advantages, both the monofilament test and traditional biofilm identification methods can be uncomfortable for patients and often require hospital visits [19]. The monofilament test detects only sensory loss, missing high-pressure areas, and early ulcer formation, while biofilm identification, though accurate, typically involves invasive procedures. Moreover, both methods may fail to identify issues until substantial nerve damage or biofilm development has occurred, delaying intervention. The following sections discuss alternative DFU detection and classification methods that do not require the expertise of healthcare providers by using statistical or machine learning models.
2.2. Foot Thermal Analysis
Elevated temperatures in the plantar region of diabetic patients are linked to a higher risk of ulceration, with a temperature increase of 2.2°C potentially indicating the onset of foot ulcers [20]. Numerous studies have established this relationship, demonstrating that temperature sensors can detect unusual patterns signifying inflammation or infection [21,22]. Recent advancements in thermogram image detection, combined with deep learning classification methods, show promise in improving detection accuracy. For example, the Diabetic Foot Thermogram Network (DFTNet) achieved 85.3% accuracy in classifying diabetic foot thermograms [8]. Smartphone infrared cameras have also been used for machine learning-based identification, where the AdaBoost model outperformed the Convolutional Neural Network (CNN) for real-time monitoring [9]. Furthermore, a framework utilizing deep neural networks and decision fusion reached 100% accuracy in classifying DFU thermal images compared to healthy ones [10].
The foot thermal analysis methods enable ongoing monitoring of foot health by detecting abnormal temperature variations, allowing for timely interventions. However, foot thermal analysis has limitations; thermogram images primarily capture surface temperature, and factors such as ambient temperature and recent activities can distort results, leading to false positives [23]. While foot thermal analysis can detect early signs of inflammation, it may not effectively identify ulcers or provide detailed insights into pressure points and mechanical stress factors contributing to ulcer formation. Other DFU detection alternatives have been proposed, such as using foot images instead of thermogram images.
2.3. Foot Imaging Analysis
Imaging modalities like X-rays, MRI, and ultrasound provide insights into foot structure, effectively detecting deep infections, bone involvement, and abscesses while classifying ulcer severity [11,24]. Deep learning models, specifically Convolutional Neural Networks (CNNs), have been employed to classify diabetic foot ulcer (DFU) images. The Diabetic Foot Ulcer Network (DFUNet), developed by Manu et al. [12], demonstrated high accuracy in detecting foot ulcers from images, achieving an AUC score of 0.96. Additionally, studies [11,13] utilized automated DFU detection with CNNs for classification, while [14] employed CNN architectures like ResNet50 and EfficientNetB0 to achieve high-accuracy results.
However, the success of these models depends on image quality [25], and they primarily focus on detecting ulcers after they occur [11,12,13], lacking early-stage detection capabilities. Additionally, advanced imaging techniques can be expensive and are often limited to diagnosing established ulcers rather than preventing their development. In the following section, plantar pressure data was used to identify ulcer risk at an earlier stage than foot imaging.
2.4. Plantar Pressure Analysis
Research has shown that mean peak plantar pressure and pressure time integral measurements for the toes and midfoot are significantly higher in diabetic feet than those with healthy feet [15]. In a study by Ahsan et al. [16], diabetic participants exhibited higher pressure in the midfoot area, while healthy participants displayed increased pressure in the heel section.
It is worth noting that [15,16] relied on static plantar pressure data where data were collected on a force plate. However, foot ulcers occur due to excessive pressure on the soles during routine activities such as walking and running, giving rise to the need for dynamic foot pressure [17,18]. It is also important to recognize that plantar pressures in static posture are considerably lower than those experienced during dynamic foot activities [26,27]. Therefore, there is a need for real-time monitoring of dynamic plantar pressure. One such technology is the wireless pressure sensor-embedded insoles that monitor dynamic plantar pressure distribution in real time. These insoles offer continuous plantar pressure monitoring that potentially enables timely interventions and reduces the risk of diabetic foot complications.
Moreover, [15,16] employ statistical significance tests (e.g., independent samples t-test), which are effective in evaluating straightforward relationships but often fail to capture complex interactions, such as those between plantar pressure and variables like age, weight, or foot structure [28]. While statistical models offer interpretable results, they struggle with non-linear patterns crucial to foot ulcer risk [28,29]. In contrast, ML models, such as decision trees and neural networks, can process dynamic plantar pressure data and identify subtle shifts and interactions that traditional methods might overlook. Additionally, ML models are better equipped to handle incoming data effectively compared to statistical tests [30,31,32,33]. This makes ML models more effective in detecting risk factors and pressure patterns, leading to more precise predictions. Therefore, applying ML models to dynamic plantar pressure data may yield better outcomes than statistical methods.
In this work, dynamic plantar pressure data from wireless pressure sensor-embedded insoles were thereby used to classify healthy and diabetic feet. The study also compares the effectiveness of statistical methods and ML models to identify the most accurate approach for early detection of diabetic foot risks.
This research paper consists of the following sections. The Materials and Methods section details the calibration of wireless pressure sensor-embedded insoles, data collection, preprocessing, and feature extraction. The Experiments and Results section presents three phases of experiments, encompassing statistical significance tests, statistical-based classification, and machine learning classification models for classifying between healthy and diabetic and feet, as well as comparing statistical-based and ML classifications. The Discussion section analyzes the results of these phases, and the paper concludes with findings and future research.
3. Materials and Methods
The plantar pressure data was collected using a wireless pressure sensor-embedded insole called SuraSole (provided by Suratec Co. Ltd., Nakhon Ratchasima, Thailand).
3.1. Smart Insole (SuraSole)
Dynamic plantar pressures were collected during the subjects’ walk using SuraSole. This insole is equipped with five Force Sensitive Resistor (FSR) sensors, each with an 18 mm diameter, embedded within both insoles, as shown in Figure 1a. These sensors were uniquely positioned to detect and quantify a relative change in the force. The experimental data were categorized into five specific foot zones: the big toe (referred to as Hallux or HA), the medial forefoot (M1), the lateral forefoot (M5), the midfoot (MF), and the heel (HF), as depicted in Figure 1b. These sensors are seamlessly integrated with a microcontroller using a voltage divider circuit. The resulting output is then transmitted to an Analog-to-Digital Converter (ADC), transforming into a digital signal. The circuit configuration is optimized for a total force range of 0 to 20 kg. These real-time measurements are transmitted to a smartphone through Bluetooth and then recorded on a database server for further analysis. Insole sizes are separated into 5 different sizes to keep the sensors in position for accurate measurement: extra small (35-36 EU), small (37-38 EU), medium (39-40 EU), large (41-42 EU), and extra large (43-44 EU), to provide coverage for a wide range of individuals.
The upcoming sections will outline the calibration and validation of the SuraSole smart insole compared to the standard device. Ensuring accurate calibration and validation is crucial for obtaining reliable data and enhancing its usefulness in research and clinical settings.
3.1.1. Calibration
The pressure sensor calibration converts the output digital signal to the force unit (N). A universal testing machine (UTM: Puller SK-10-500N press digital, SHSIWI) was used to apply a range of known forces to the sensor and calibrate the sensor circuit output signal. We repeated this step for 5 trials, for each force value and took the sample average. The relative error between these trials was found to be less than 5%, indicating a high degree of consistency and reliability in our calibration measurements. Figure 2 shows the optimal curve fitting exponential equation obtained from the calibration method.
3.1.2. Validation
The smart insole was validated against a clinically used force plate (Kistler Instrumente AG, Winterthur, Switzerland), an ISO/IEC 17025 machine. Kistler’s force plate is widely recognized in academia, clinics, and rehabilitation centers for its applications in sports performance diagnostics, motion analysis, and clinical gait analysis [34]. The data analysis of the validation was carried out using the Bland-Altman method.
Data collection occurred at King Chulalongkorn Memorial Hospital, Thailand, involving 20 healthy subjects who underwent 5 trials while wearing the smart insole and stepping on the force plate. The pressure on the force plate’s contact time is extracted and synchronized with SuraSole plantar pressure data. The plantar pressure data from both devices were normalized, and the mean plantar pressure was calculated. Data samples include that from the left and right foot, obtaining 200 data samples. After removing noise from the data, we obtained 190 data samples. Figure 3 shows that 178 of 190 data points exhibited strong agreement within the predefined Limits of Agreement (LoA), defined as ±1.96 times the standard deviation [35], achieving a Bland-Altman Index of 93.68%, indicating a statistically significant level of agreement between the smart insole (SuraSole) and the Kistler’s force plate.
3.2. Data Collection
Once the insoles were calibrated and validated, they were used to collect dynamic plantar pressure for this study. This study was conducted at the Diabetic Clinic, Sirindhorn Hospital, and Sam Liam Community Health Center, Khon Kaen Province, Thailand. The study was approved by the medical ethics committee, Suranaree University of Technology (Project code EC-62-94). Written informed consent was obtained from each subject. A wireless pressure sensor-embedded smart insole, as illustrated in Figure 1a,b, was utilized for data collection from both healthy and diabetic volunteers.
A total of 150 volunteers, comprising 75 individuals with healthy foot and 75 with diabetic foot, participated in the study. The experiment excluded individuals with plantar wounds, unstable medical conditions such as lower limb amputation, mobility disorders, or the inability to walk ten meters or wear the SuraSoles. The data collection process involved participants walking back and forth over a ten-meter distance to collect dynamic plantar pressure data.
Demographic characteristics included personal details such as age (years), weight (kg), height (cm), gender (M/F), BMI (kg/m²), fasting blood sugar (mg/dl), and diabetes duration (years).
3.3. Data Preprocessing
After data collection, the sensor data at the beginning and end of each sample was trimmed to eliminate the transition periods. With participants walking back and forth, two samples were collected from each, resulting in a total of 300 samples. After removing samples with invalid data and noise, 243 samples remained for the experiment (126 from healthy participants and 117 from diabetic participants).
The collected data were then subjected to further analysis to determine various gait-related pressure parameters, which include
- Peak plantar pressure (PPP): The maximum amount of pressure exerted on the plantar surface (smart insole) of the foot during gait.
-
Pressure time integral (PTI): The cumulative pressure experienced by the foot over over the duration of the gait cycle. It provides a summary of the total pressure distribution and load on the footwhere P(t) = pressure at a given time interval .
- Forefoot-to-rearfoot ratio (F/R ratio): The distribution of pressure between the front part of the foot (forefoot) and the rear part of the foot (rearfoot).
The parameters discussed above (PPP, PTI, F/R ratio) were calculated for different foot zones, resulting in a total of 18 parameters. Table 1 presents all 18 parameters extracted from the experiments.
4. Experiments and Results
We hypothesize that the wireless insole can be used for diabetic feet classification. To validate such hypothesis, we conducted our experimentation in three distinct phases.
- Phase 1 Statistical Significance Test: The objective of this experiment is to compute which parameters are significant for classification. We applied an independent sample t-test on the 18 extracted parameters. The significant parameters will be selected for the next phase of experiment.
- Phase 2 Statistic-based Classification Model: The objective of this experiment is to classify healthy and diabetic feet based on the selected significant parameters from Phase 1. Threshold values were extracted from each significant parameter for this classification model. The model was assessed based on the accuracy, sensitivity, specificity, and F1-score performance metrics.
- Phase 3 Machine Learning Classification Model: The objective of this experiment is to classify healthy and diabetic feet using machine learning (ML) models. Specifically, nine ML models were utilized: Support Vector Machine (SVM), Random Forest (RF), Logistic Regression (LR), Naive Bayes (NB), Decision Tree (DT), K-Nearest Neighbor (KNN), Extreme Gradient Boosting (XGBoost), Light Gradient-Boosting Machine (LightGBM), and Adaptive Boosting (AdaBoost). Deep learning models were excluded due to their lack of transparency and high computational demands [36,37], making traditional machine learning models more suitable for tasks requiring interpretability, such as healthcare [38]. These ML models were assessed based on performance metrics, including accuracy, sensitivity, specificity, F1-score, and Area Under Curve (AUC).
The results for each phase of the experiments are shown in the following sections.
Phase 1: Statistical Significance Test
In this experiment, we employed an independent samples t-test to identify all significant parameters which have the potential to classify healthy and diabetic feet. The extracted parameters were analyzed using the Jupyter Notebook program, with a confidence interval of 95%, and the results are presented in Table 1.
The results revealed a significant difference in peak plantar pressure (PPP) between the healthy and diabetic groups in the forefoot, midfoot, and entire foot of both the left and right feet, as indicated by the asterisks in Table 1. The diabetic foot showed higher peak plantar pressure than the healthy foot in all zones except the heel region, likely because the diabetic group exhibited a higher F/R ratio and increased forefoot pressure, resulting in lower pressure in the heel. These findings are consistent with previous studies [15,16]. The graphical depiction of these outcomes can be observed in Figure 4a,b.
Furthermore, the results showcased a significant difference in pressure time integral (PTI) of the forefoot, midfoot, and entire foot between the two groups, as indicated by the asterisks in Table 1. The diabetes group showed the highest pressure time integral compared to the healthy group, which agrees with [15]. The visual representation of these significant results are shown in Figure 5a,b.
Moreover, the findings also indicated a significant difference in forefoot-to-rearfoot ratio (F/R ratio) between the two groups on both the left and the right foots, indicated by the asterisks in Table 1. The diabetes group showed a higher F/R ratio than the healthy group, which agrees with [39]. The visual representation of these findings presented in Figure 6.
In Phase 2, the selection process involved choosing the top parameter based on accuracy and F1-score, as these metrics provide a balanced evaluation of classification performance, considering both precision and recall. In Phase 3, the complete set of all 18 parameters, including demographic variables, was incorporated. The choice of p-value exclusively impacts the number of significant parameters identified in Phase 1. The number of significant parameters varied across different p-values: p < 0.05 resulted in 13 parameters, p < 0.01 resulted in 10 parameters, and p < 0.001 resulted in 7 parameters. Therefore, p < 0.05 was utilized for visualization to strike a balance between identifying significant parameters while avoiding an overly stringent threshold. This indicates that 13 of the 18 parameters were identified as statistically significant through t-test analysis. These 13 parameters will be employed individually in Phase 2 of the study to classify healthy and diabetic feet.
Phase 2: Statistic-based Classification Model
In Phase 2, a statistical approach was utilized to classify healthy and diabetic feet. The dataset was split into a 70:30 ratio for training and testing purposes. Each significant parameter identified in Phase 1 was employed to determine the optimal threshold for classification. This threshold was determined by maximizing the accuracy derived from the training dataset. Figure 7 depicts the procedure for selecting optimal thresholds based on accuracy, exemplified by the pressure time integral on the left forefoot (PTI_FL) parameter. An optimal threshold was established for each significant parameter. Subsequently, these thresholds were applied to the test dataset to classify healthy and diabetic feet.
Figure 8 depicts the 13 significant parameters derived from Phase 1, organized based on accuracy and F1-score through the statistical-based classification model. The parameters PTI_FL and PTI_FR yield the highest accuracy of 0.67, while F/R_Left and F/R_Right achieve the highest F1-score of 0.72. These results demonstrate that both PTI and F/R parameters, whether measured on the left or right foot, are equally effective in distinguishing between healthy and diabetic feet. Additionally, performance metrics such as sensitivity and specificity were also calculated and compared with machine learning classification models, as detailed in Table 3. In the following section, we implement machine learning classification models to provide a comparative analysis with the statistic-based classification model.
Phase 3: Machine Learning Classification Model
In Phase 3, we use 9 different machine learning models to classify individuals as either diabetic or healthy foot. To understand the importance of each parameter in relation to the classification target variable, we employ a feature scoring method [40]. This method assigns scores to each parameter based on their impact on the target variable, allowing us to assess their significance in the classification process.
To reduce parameter redundancy, we applied Principal Component Analysis (PCA) to eliminate the redundant features from the dataset. Further details of this process can be found in the next section. After obtaining the subset of features through the feature scoring method, we employed machine learning models for classification, i.e., SVM, RF, LR, NB, DT, and KNN. In addition, three boosting algorithms, namely XGBoost, LightGBM, and AdaBoost, were also compared. The selection of SVM, RF, LR, NB, DT, KNN, and boosting algorithms for binary classification was based on the unique strengths of each model. SVM addressed non-linear relationships, RF reduced noise, LR provided simplicity, NB efficiently handled small datasets, DT captured complex decision boundaries, KNN recognized local patterns, and boosting algorithms enhanced overall performance. The boosting models were selected over the traditional ML model because boosting improves the ML model’s performance by converting multiple weak learners into a single strong learning model [41].
4.0.1. Principal Component Analysis (PCA)
PCA is a dimensionality reduction technique employed to reduce the dimensionality of the feature set while retaining important information. By transforming the original feature set into a new feature set with lower dimensions, PCA enables the elimination of redundant or less informative features. PCA serves as a tool in preprocessing and feature selection, allowing more efficient and effective modeling by capturing the most relevant information in a reduced feature space.
We selected 10 components to attain 99% cumulative variance with a minimal number of components. The Naive Bayes (NB) model, known for its efficiency in handling small datasets and binary classification [42], was employed. Figure 9 shows an analysis of PCA components and their accuracy scores for the NB model revealed the highest accuracy using the top seven components.
Figure 10 illustrates the scores of the identified PCA components, wherein a higher score denotes increased relevance within the classification models. It can be observed that both Figure 9 and 10 indicate that the optimal number of PCA components is 7. Thus, for this experiment, we used the top 7 components from the PCA.
To boost the performance of the ML classification models, we carried out hyperparameter tuning. We used the GridSearchCV library [43] to pinpoint the optimal parameters for each classification algorithm. By fine-tuning the models’ parameters, we aimed to achieve the best possible performance for each ML method in classifying the healthy and diabetic individuals. The optimal hyperparameters were determined using the GridSearchCV library on the PCA dataset, as shown in Table 2.
We evaluated the performance of the machine learning models while utilizing the optimal parameters obtained through hyperparameter tuning. The same 70:30 ratio of train and test datasets were used as in Phase 2. Figure 11 illustrates the accuracy scores for each model, with the Adaptive Boosting (AdaBoost) model achieving the highest accuracy of 0.85. Table 3 presents detailed results of performance metrics for both Phase 2 and Phase 3 models.
5. Discussion
Our research underscores the significance of dynamic plantar pressure parameters in the classification of healthy and diabetic feet. In Phase 1 of the experiment, we observed that peak plantar pressure and pressure time integral were notably higher in diabetic foot across all regions except for the heel region, aligning with previous studies [15,16]. Additionally, the forefoot-to-rearfoot ratio was elevated in diabetic foot compared to healthy ones, consistent with prior studies [39]. In Phase 2, the statistical-based classification model indicated that the pressure time integral on the forefoot achieved the highest accuracy of 0.67 for both the left and right foot. Meanwhile, the forefoot-to-rearfoot ratio achieved the highest F1-score of 0.72 for both the left and right foot. Figure 8 emphasizes the equal significance of these parameters’ left and right feet in classifying healthy and diabetic and feet. The parameter selection should align with the priority of the target performance metrics. If accuracy is the primary concern, the optimal parameter is the pressure time integral on the forefoot. Conversely, if the emphasis is on the F1-score, the preferred parameter is the forefoot-to-rearfoot ratio. However, when comparing the results of Phases 2 and 3, the statistics-based classification model demonstrated limited performance, possibly because statistical models are not generalized and cannot effectively handle unseen data, i.e., the test dataset [30].
In contrast, boosting models performed better than traditional ML models because the boosting model enhances the ML model’s performance by combining multiple weak learners into a single robust learning model [41]. The AdaBoost model achieved the highest performance with an accuracy of 0.85 and sensitivity, specificity, F1-score, and AUC values of 0.83, 0.86, 0.85, and 0.88, respectively. AdaBoost’s superior performance may stem from its effective combination of weak learners, offering robust generalization and adaptive instance weighting [44]. This emphasizes the effectiveness of boosting algorithms in our experiments. Our findings support the notion that individuals with diabetes exhibit increased plantar pressure [15,16].
Furthermore, the use of insoles on dynamic plantar pressure data for diabetic feet classification may be an affordable monitoring device for a home environment. In addition, dynamic plantar pressure can detect early signs of DFU [17,18]. Therefore, leveraging machine learning models with plantar pressure sensor embedded insoles offers the potential for the early detection of pressure indicators for Diabetic Foot Ulcers (DFUs), as observed from performance enhancements over traditional statistical models.
6. Conclusions
This paper aims to compare diabetic foot classification between statistical and machine learning (ML) methods, utilizing wireless insoles for plantar pressure acquisition during dynamic movement to identify diabetic foot. Plantar pressures in static posture are considerably lower than those experienced during dynamic foot activities, making dynamic plantar pressure a significant measure in identifying foot ulcers [17,18]. Therefore, the use of wireless pressure sensor-embedded insoles is suitable to collecting dynamic plantar pressure. In this work, wireless pressure sensor-embedded insoles are used to classify diabetic feet from healthy feet. Our approach involved measuring peak plantar pressure, forefoot-to-rearfoot ratio, and pressure time integral from gait measurements. The proposed method was evaluated on a dataset of 150 participants, 75 healthy individuals, and 75 individuals with diabetes. Walking data was collected using the pressure-embedded insole, and subsequent analysis involved conducting an independent sample t-test to compare the diabetes and healthy groups. The results revealed that individuals with diabetes exhibited higher plantar pressure than the healthy group, aligning with previous findings [15,16].
Our study compared a statistic-based classification model and machine learning models for healthy and diabetic feet classification. From the statistic-based classification model, we achieved an accuracy of 0.67. On the other hand, the AdaBoost ML method achieved the highest accuracy of 0.85. These findings indicate that wireless pressure-sensor embedded insoles, used with ML models, have the potential to classify individuals into either the diabetic or healthy group. This suggests the potential of using pressure sensor-embedded insoles with ML to identify various stages of individuals with diabetes, particularly early stages, to detect neuropathy conditions. The future work includes multi-class classifications of such early stages, such as no neuropathy, mild neuropathy, and severe neuropathy, ultimately facilitating the early prediction of foot ulceration within a home environment in future work.
Author Contributions
Conceptualization, D.K.A. and W.J.; methodology, D.K.A., S.P., W.U., P.W.; software, W.J., S.P. and W.U.; validation, W.J., P.W., P.T. and T.V.; formal analysis, D.K.A., W.J., W.U. and P.W.; project administration, S.P., P.W. and T.V. funding acquisition, S.P., W.U., P.W., P.T. and T.V.; investigation, D.K.A., W.J., P.W., P.T. and T.V.; resources, W.J., S.P., P.W. and T.V.; data curation, D.K.A., S.P., P.W., P.T. and T.V.; writing—original draft, D.K.A., W.J.; writing—review and editing, D.K.A., W.U. and S.P.; visualization, S.P., W.U., P.W. and P.T.; supervision, S.P. and W.U. All authors have read and agreed to the published version of the manuscript.
Funding
This work was supported by (i) Suranaree University of Technology (SUT), (ii) Thailand Science Research and Innovation (TSRI), and (iii) National Science, Research and Innovation Fund (NSRF) (Project code 90464). The authors extend their heartfelt gratitude to all participants and dedicated staff members who played an integral role in the collection of data for this study.
Institutional Review Board Statement
The study was conducted at the Diabetic Clinic, Sirindhorn Hospital, and Sam Liam Community Health Center, Khon Kaen Province, Thailand, and approved by the medical ethics committee, Suranaree University of Technology (Protocol code EC-62-94) for studies involving humans.
Informed Consent Statement
Informed consent was obtained from all subjects involved in the study. Written informed consent has also been obtained from the patients for the publication of this paper.
Data Availability Statement
The data presented in this study are available from the corresponding author upon reasonable request, subject to ethical considerations.
Acknowledgments
The authors express their gratitude to Suratec Co. Ltd. in Nakhon Ratchasima, Thailand, for supplying the wireless pressure sensor-embedded insoles used in this study. Their contributions and technical support were instrumental to our research on plantar pressure analysis and diabetic foot health, significantly enhancing the quality of our work
Conflicts of Interest
The authors declare no conflicts of interest.
References
- “Facts & figures,” International Diabetes Federation. https://idf.org/about-diabetes/diabetes-facts-figures/ (accessed Aug. 03, 2023).
- Zhang Y, Lazzarini PA, McPhail SM, van Netten JJ, Armstrong DG, Pacella RE (2020) Global disability burdens of diabetes related lower-extremity complications in 1990 and 2016. Diabetes Care 43(5):964–974. [CrossRef]
- Armstrong DG, Boulton AJM, Bus SA (2017) Diabetic foot ulcers and their recurrence. N Engl J Med 376(24):2367–2375. https:// doi.org/10.1056/NEJMra1615439.
- Lazzarini PA, Hurn SE, Kuys SS et al (2017) The silent overall burden of foot disease in a representative hospitalised population. Int Wound J 14(4):716–728. [CrossRef]
- Lo, Z. J. , Surendra, N. K., Saxena, A., & Car, J. (2021). Clinical and economic burden of diabetic foot ulcers: A 5-year longitudinal multi-ethnic cohort study from the tropics. International wound journal, 18(3), 375–386. [CrossRef]
- Astrada, A., Nakagami, G., & Sanada, H. (2024). Challenges in Biofilm Identification in Diabetic Foot Infections: Review of Literature. The international journal of lower extremity wounds, 15347346241273112. Advance online publication. [CrossRef]
- “monofilament testing in diabetic foot - Primary Care Notebook,” https://primarycarenotebook.com/simplepage.cfm?ID=x2020063010498191128 (accessed Jan. 13, 2023).
- Cruz-Vega, I., Hernandez-Contreras, D., Peregrina-Barreto, H., Rangel-Magdaleno, J. J., & Ramirez-Cortes, J. M. (2020). Deep Learning Classification for Diabetic Foot Thermograms. Sensors (Basel, Switzerland), 20(6), 1762. [CrossRef]
- Khandakar A, Chowdhury MEH, Ibne Reaz MB, et al. A machine learning model for early detection of diabetic foot using thermogram images. Comput Biol Med. 2021;137:104838. [CrossRef]
- K. Munadi et al., “A Deep Learning Method for Early Detection of Diabetic Foot Using Decision Fusion and Thermal Images,” Applied Sciences, vol. 12, no. 15, p. 7524, Jul. 2022. [CrossRef]
- "Diabetic foot ulcer classification using sequential cnn algorithm." International Research Journal Of Modernization In Engineering Technology And Science (2024). [CrossRef]
- M. Goyal, N. D. Reeves, A. K. Davison, S. Rajbhandari, J. Spragg and M. H. Yap, "DFUNet: Convolutional Neural Networks for Diabetic Foot Ulcer Classification," in IEEE Transactions on Emerging Topics in Computational Intelligence, vol. 4, no. 5, pp. 728-739, Oct. 2020. [CrossRef]
- S, Sudha. "Detection of Diabetic Foot Ulcers Using Dense Net Framework." International journal of innovative research in information security, 10 (2024). [CrossRef]
- Garima, Verma. "Leveraging smart image processing techniques for early detection of foot ulcers using a deep learning network." Polish Journal of Radiology, (2024). [CrossRef]
- Fernando ME, Crowther RG, Lazzarini PA, et al. Plantar pressures are higher in cases with diabetic foot ulcers compared to controls despite a longer stance phase duration. BMC Endocr Disord. 2016;16(1):51. Published 2016 Sep 15. [CrossRef]
- Ahsan M, Shanab AA, Nuhmani S. Plantar Pressure Distribution Among Diabetes and Healthy Participants: A Cross-sectional Study. Int J Prev Med. 2021;12:88. Published 2021 Jul 9. [CrossRef]
- Luger E, Nissan M, Karpf A, Steinberg E, Dekel S. Dynamic pressures on the diabetic foot. Foot Ankle Int. 2001;22(9):715-719. [CrossRef]
- Jay, Dicharry., Jason, R., Franz., Ugo, Della, Croce., Robert, P., Wilder., Patrick, O., Riley., D., Casey, Kerrigan. "Differences in Static and Dynamic Measures in Evaluation of Talonavicular Mobility in Gait." Journal of Orthopaedic & Sports Physical Therapy, 39 (2009).:628-634. [CrossRef]
- “Monofilament testing withstands critiques | Lower Extremity Review Magazine,” lermagazine.com, Jan. 17, 2012. https://lermagazine.com/article/monofilament-testing-withstands-critiques (accessed Feb. 11, 2023).
- Ashok, Bhargavi & K.A, Sunitha & Janarthan, Kumar. (2020). Plantar temperature and vibration perception in patients with diabetes: A cross-sectional study. Biocybernetics and Biomedical Engineering. 40. 1600-1610. [CrossRef]
- Adam, Muhammad et al. “Computer aided diagnosis of diabetic foot using infrared thermography: A review.” Computers in biology and medicine vol. 91 (2017): 326-336. [CrossRef]
- Hernandez-Contreras, D. & Peregrina-Barreto, Hayde & Rangel-Magdaleno, José & Gonzalez, Jesus. (2016). Narrative Review: Diabetic Foot and Infrared Thermography. Infrared Physics & Technology. 78. [CrossRef]
- Aylwin PE, Racinais S, Bermon S, Lloyd A, Hodder S, Havenith G. The use of infrared thermography for the dynamic measurement of skin temperature of moving athletes during competition; methodological issues. Physiol Meas. 2021;42(8):10.1088/1361-6579/ac1872. Published 2021 Aug 2. [CrossRef]
- Leyla, Gödekmerdan, Önder. "Imaging Modalities in Radiology: X-ray, CT, MRI, and Ultrasound." (2023). [CrossRef]
- V. Thambawita, I. Strümke, S. A. Hicks, P. Halvorsen, S. Parasa, and M. A. Riegler, “Impact of Image Resolution on Deep Learning Performance in Endoscopy Image Classification: An Experimental Study Using a Large Dataset of Endoscopic Images,” Diagnostics, vol. 11, no. 12, p. 2183, Nov. 2021. [CrossRef]
- MacWilliams, Bruce & Armstrong, P.F.. (2000). Clinical applications of plantar pressure measurement in pediatric orthopedics. Pediatr. Gait. [CrossRef]
- Malindu, E., Fernando., Robert, G., Crowther., Elise, Pappas., Peter, A, Lazzarini., Margaret, Cunningham., Kunwarjit, S., Sangla., Petra, Buttner., Jonathan, Golledge. "Plantar pressure in diabetic peripheral neuropathy patients with active foot ulceration, previous ulceration and no history of ulceration: A meta-analysis of observational studies." (2014).
- Kevin, R., Murphy., Brett, Myors. "Statistical Power Analysis: A Simple and General Model for Traditional and Modern Hypothesis Tests." (1998).
- Robert, V., Hogg., Elliot, A., Tanis. Probability and Statistical Inference. (1977).
- Bzdok, D., Altman, N. & Krzywinski, M. Statistics versus machine learning. Nat Methods 15, 233–234 (2018),. [CrossRef]
- Christina, Orphanidou., David, Wong. Machine Learning Models for Multidimensional Clinical Data. (2017).177-216. [CrossRef]
- Yifan, Li., Xiaohui, Yu., Nick, Koudas. (2021). Data Acquisition for Improving Machine Learning Models. D: arXiv. [CrossRef]
- Wenjuan, Wang., Martin, Kiik., Niels, Peek., Vasa, Curcin., Iain, J., Marshall., Anthony, Rudd., Yanzhong, Wang., Abdel, Douiri., Charles, D.A., Wolfe., Benjamin, Bray. "A systematic review of machine learning models for predicting outcomes of stroke with structured data." PLOS ONE, 15 (2020).:1-16. [CrossRef]
- “Biomechanics and life sciences | Kistler,” www.kistler.com. https://www.kistler.com/INT/en/biomechanics-and-life-sciences/C00000187 (accessed June. 21, 2023).
- F. Schoonjans, “Sample size calculation: Bland-Altman plot,” MedCalc. https://www.medcalc.org/manual/sample-size-bland-altman.php.
- Talaei Khoei, T., Ould Slimane, H. & Kaabouch, N. Deep learning: systematic review, models, challenges, and research directions. Neural Comput & Applic 35, 23103–23124 (2023). [CrossRef]
- "Understanding from Machine Learning Models." The British Journal for the Philosophy of Science, 73 (2022). [CrossRef]
- Nikita, Silaparasetty. (2020). Machine Learning vs. Deep Learning. 57-65. [CrossRef]
- Caselli A, Pham H, Giurini JM, Armstrong DG, Veves A. The forefoot-to-rearfoot plantar pressure ratio is increased in severe diabetic neuropathy and can predict foot ulceration. Diabetes Care. 2002;25(6):1066-1071. [CrossRef]
- L. Buitinck, G. Louppe, M. Blondel, F. Pedregosa, A. Mueller, et al., "API design for machine learning software: experiences from the scikit-learn project," European Conference on Machine Learning and Principles and Practices of Knowledge Discovery in Databases, Sep 2013, Prague, Czech Republic.
- “What is Boosting? Guide to Boosting in Machine Learning - AWS,” Amazon Web Services, Inc. https://aws.amazon.com/what-is/boosting/.
- “Beginners Guide to Naive Bayes Algorithm in Python,” Analytics Vidhya, Jan. 16, 2021. https://www.analyticsvidhya.com/blog/2021/01/a-guide-to-the-naive-bayes-algorithm/.
- LaValle, Steven M., Michael S. Branicky, and Stephen R. Lindemann. “On the Relationship between Classical Grid Search and Probabilistic Roadmaps.” The International Journal of Robotics Research 23, no. 7–8 (August 2004): 673–92. [CrossRef]
- AdaBoost Algorithm in Machine Learning. AlmaBetter. (n.d.). https://www.almabetter.com/bytes/tutorials/data-science/adaboost-algorithm.
Figure 1.
(a) The smart insole layers. (b) The locations of sensing points in different foot zones.
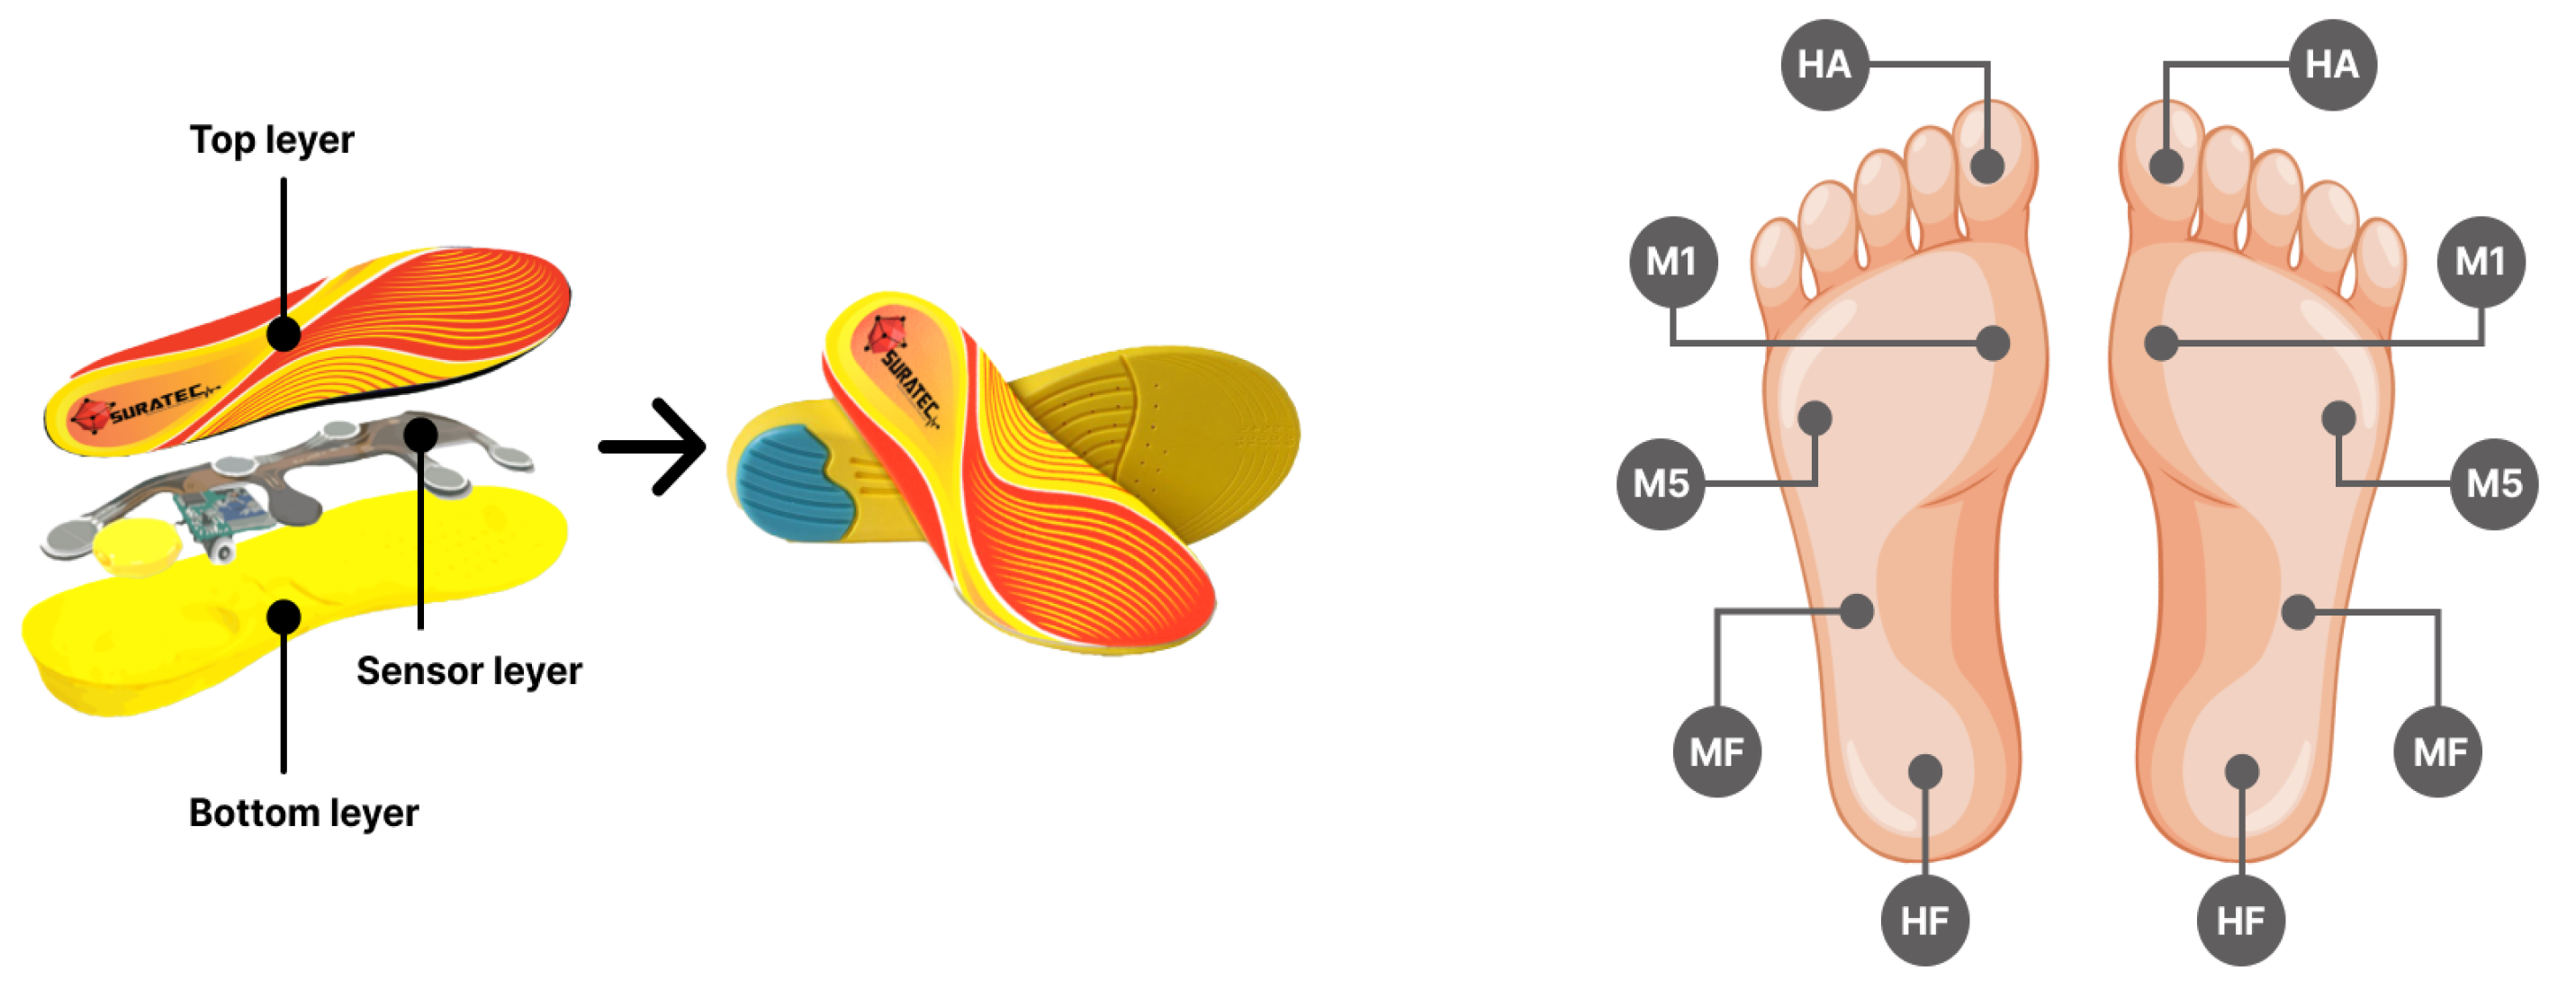
Figure 2.
SuraSole sensor signal calibration curve (ADC-to-Force).
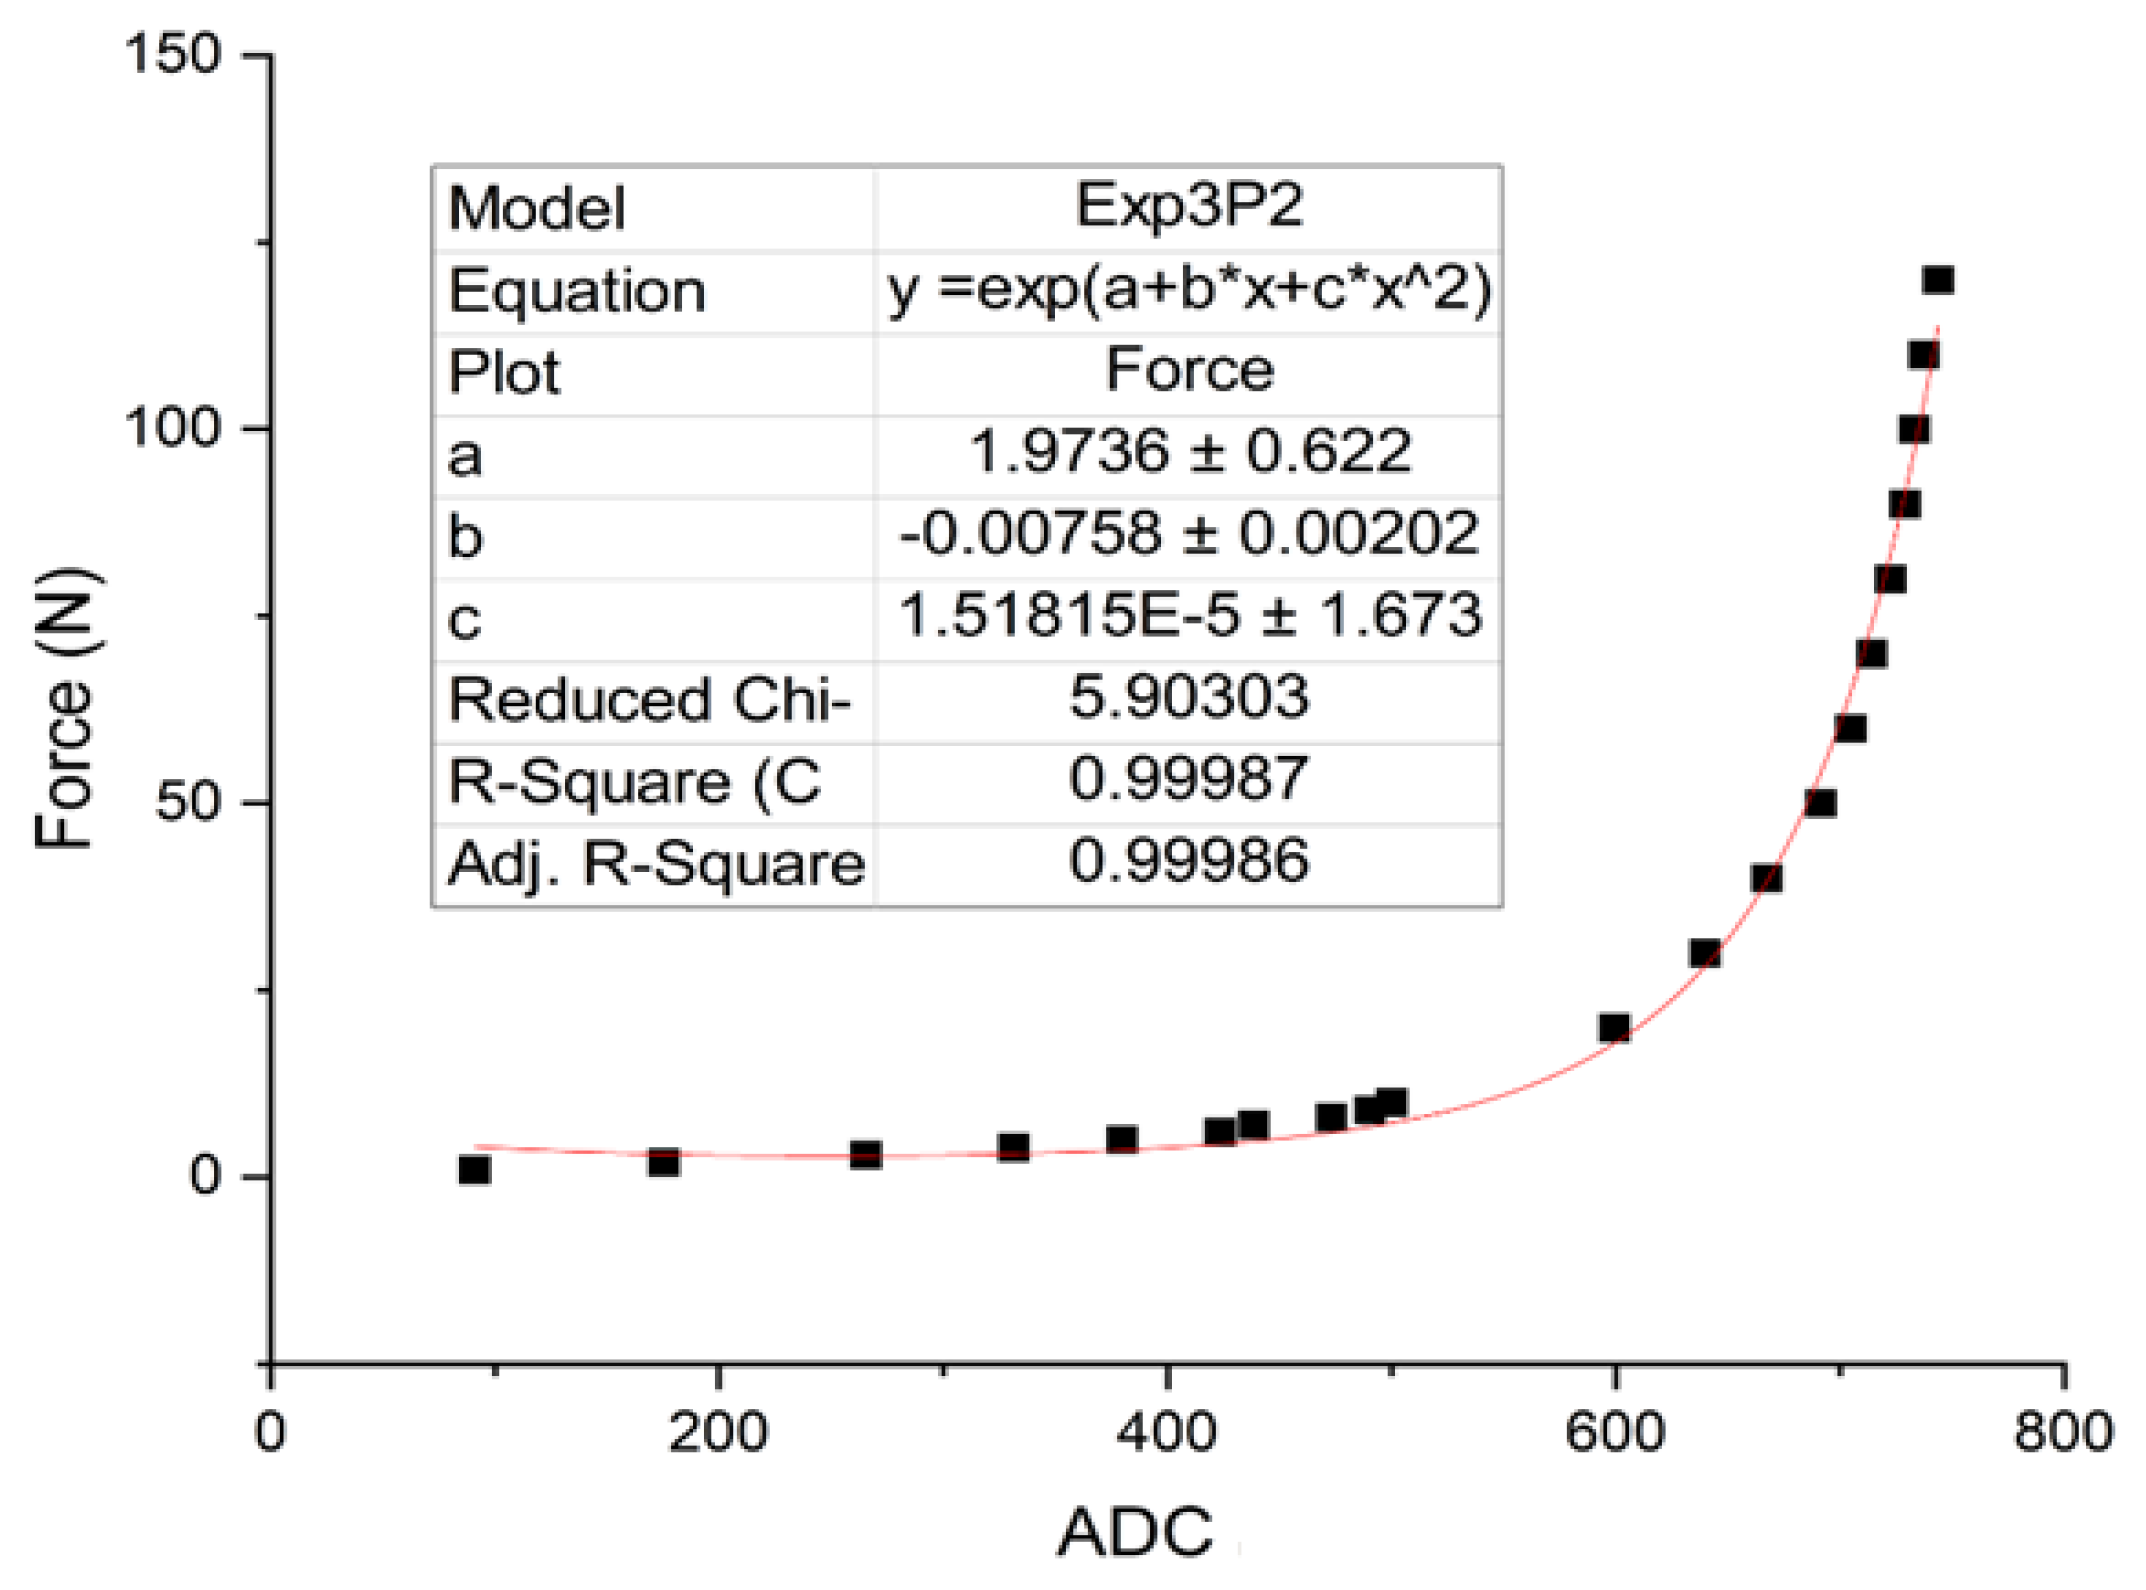
Figure 3.
Bland - Altman plot showing the agreement analysis between Kistler’s force plate and SuraSole.
Figure 3.
Bland - Altman plot showing the agreement analysis between Kistler’s force plate and SuraSole.
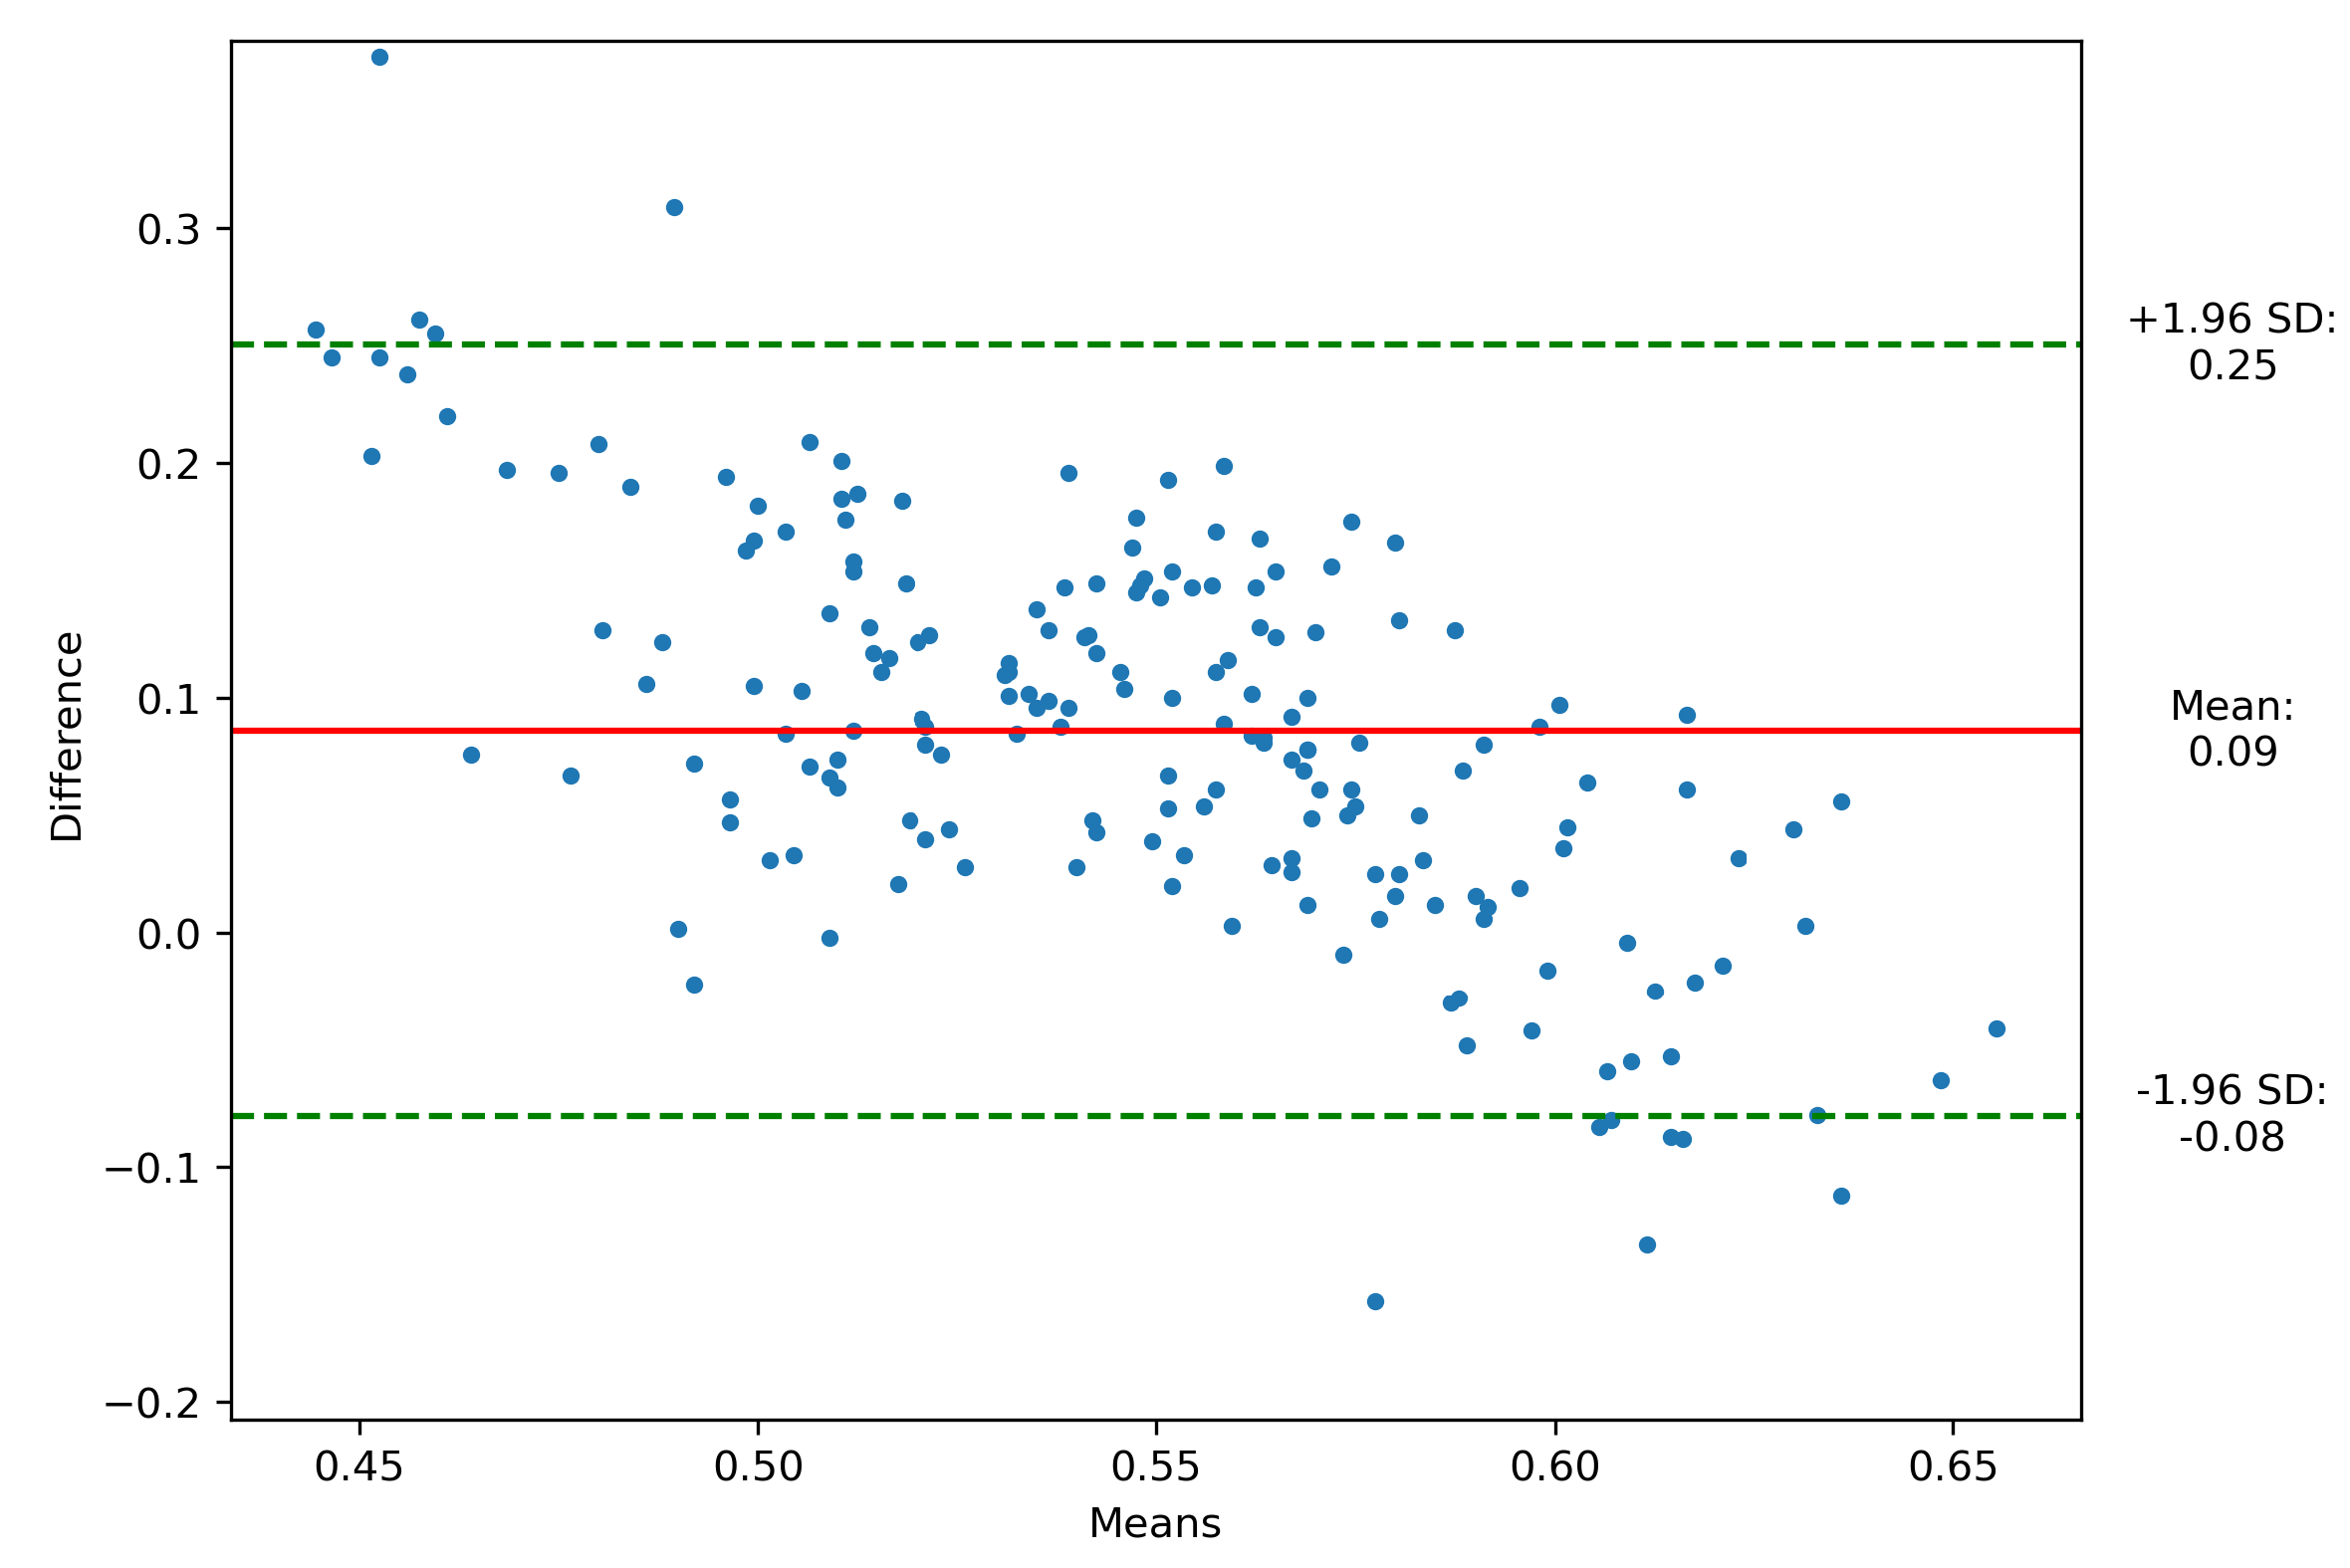
Figure 4.
Peak plantar pressure of healthy vs diabetic foot (a) Left foot; (b) Right foot.
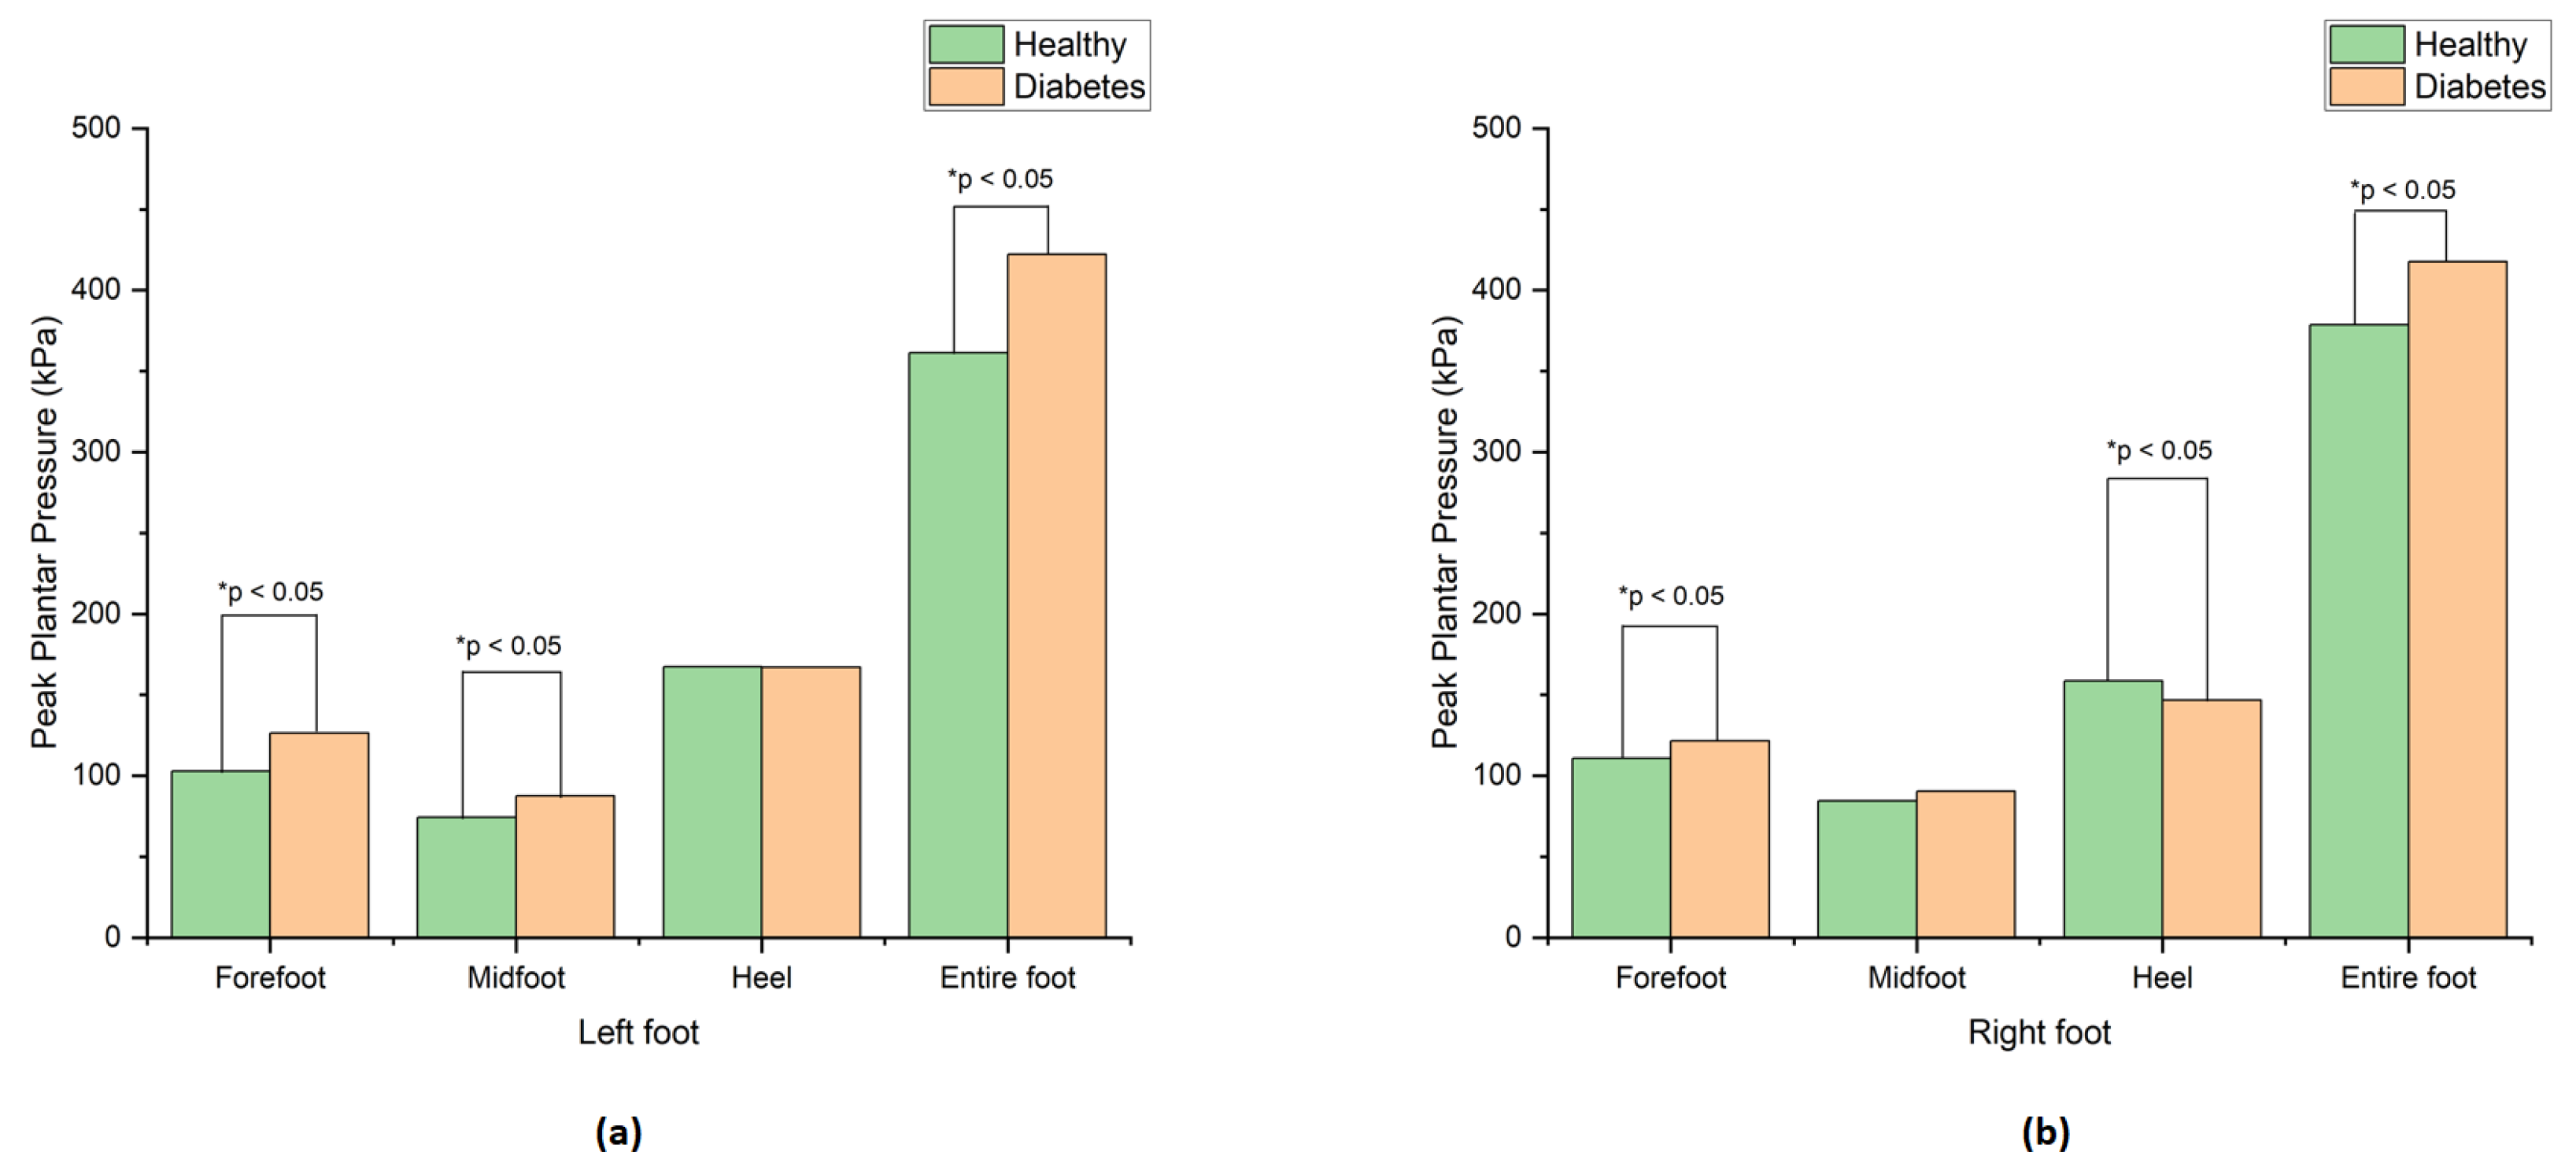
Figure 5.
Pressure time integral of healthy vs diabetes foot (a) Left foot; (b) Right foot.
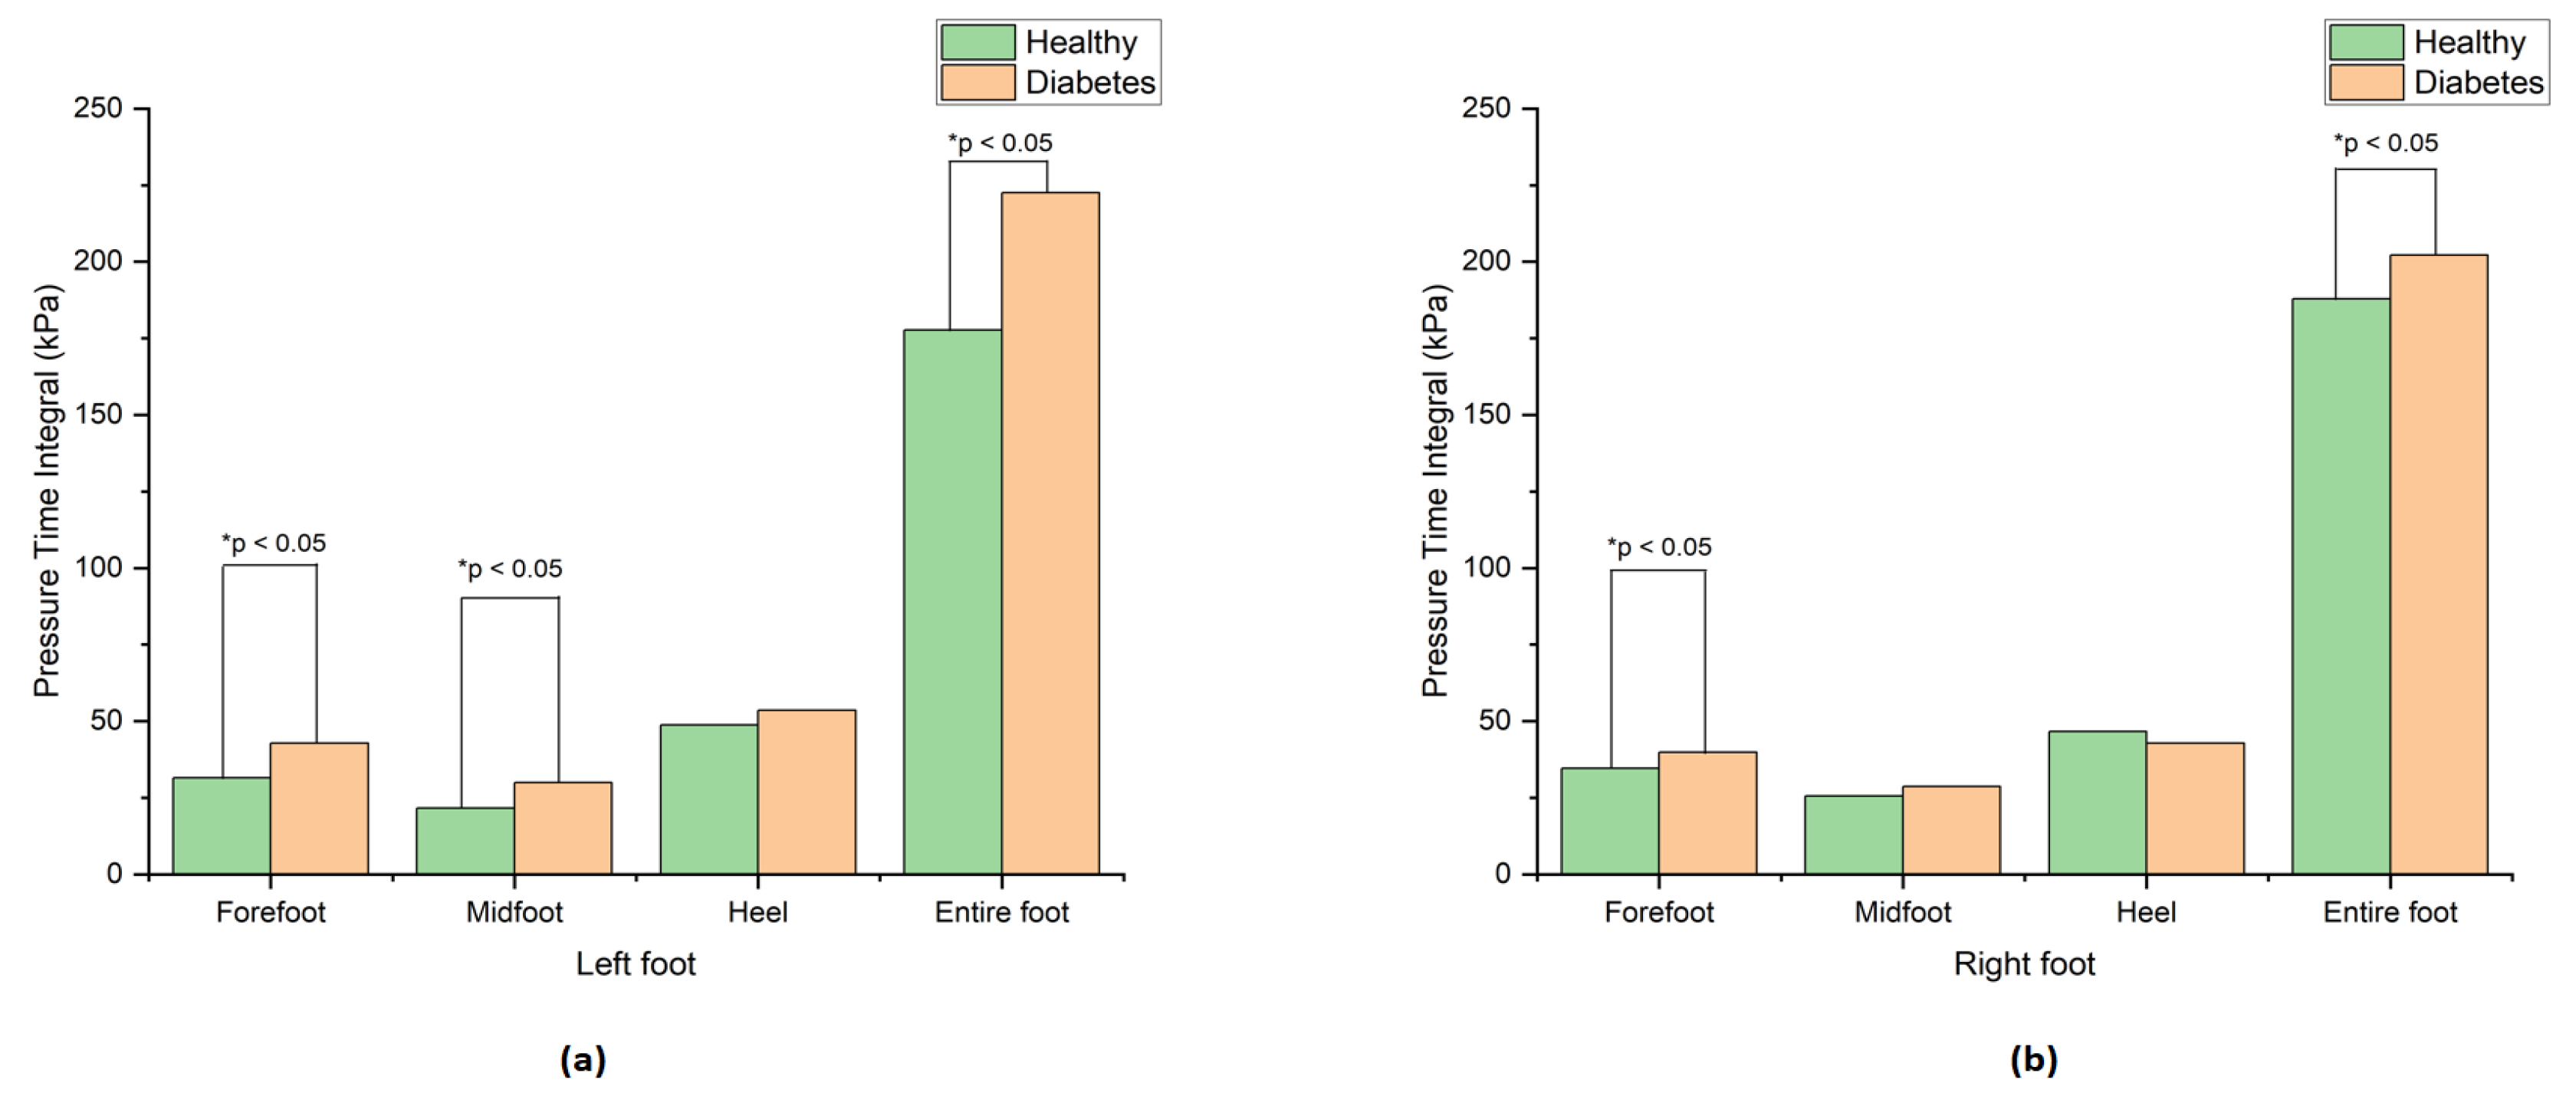
Figure 6.
Forefoot-to-rearfoot ratio of healthy vs diabetes foot.
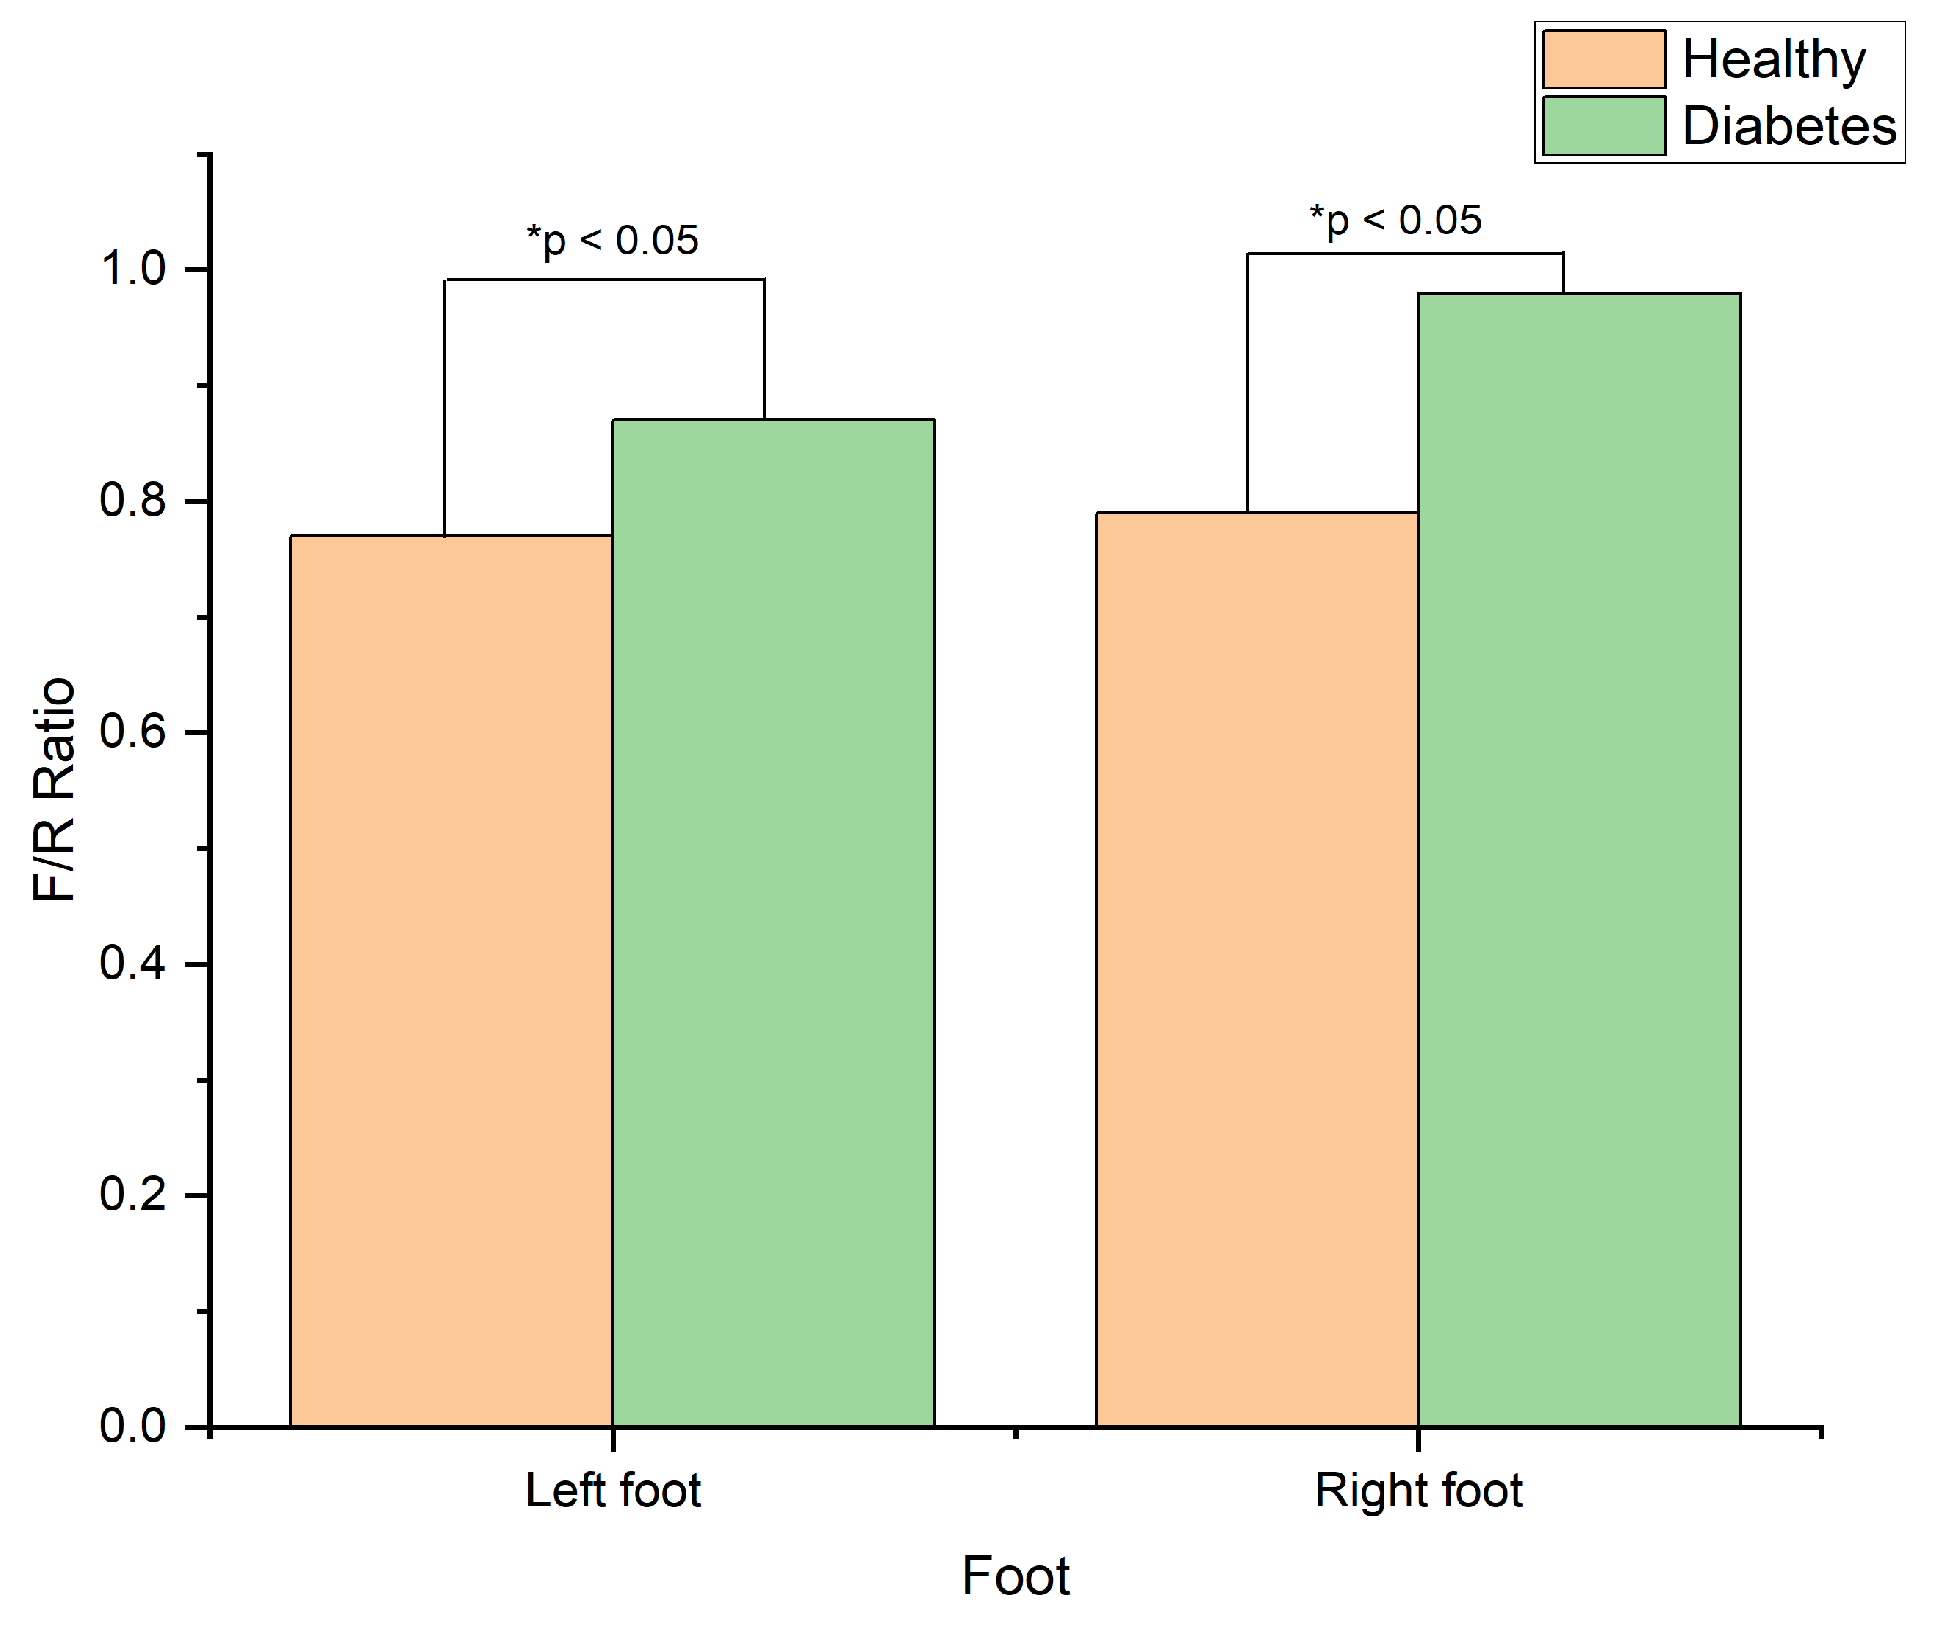
Figure 7.
Accuracy-driven optimal threshold selection from train Data.
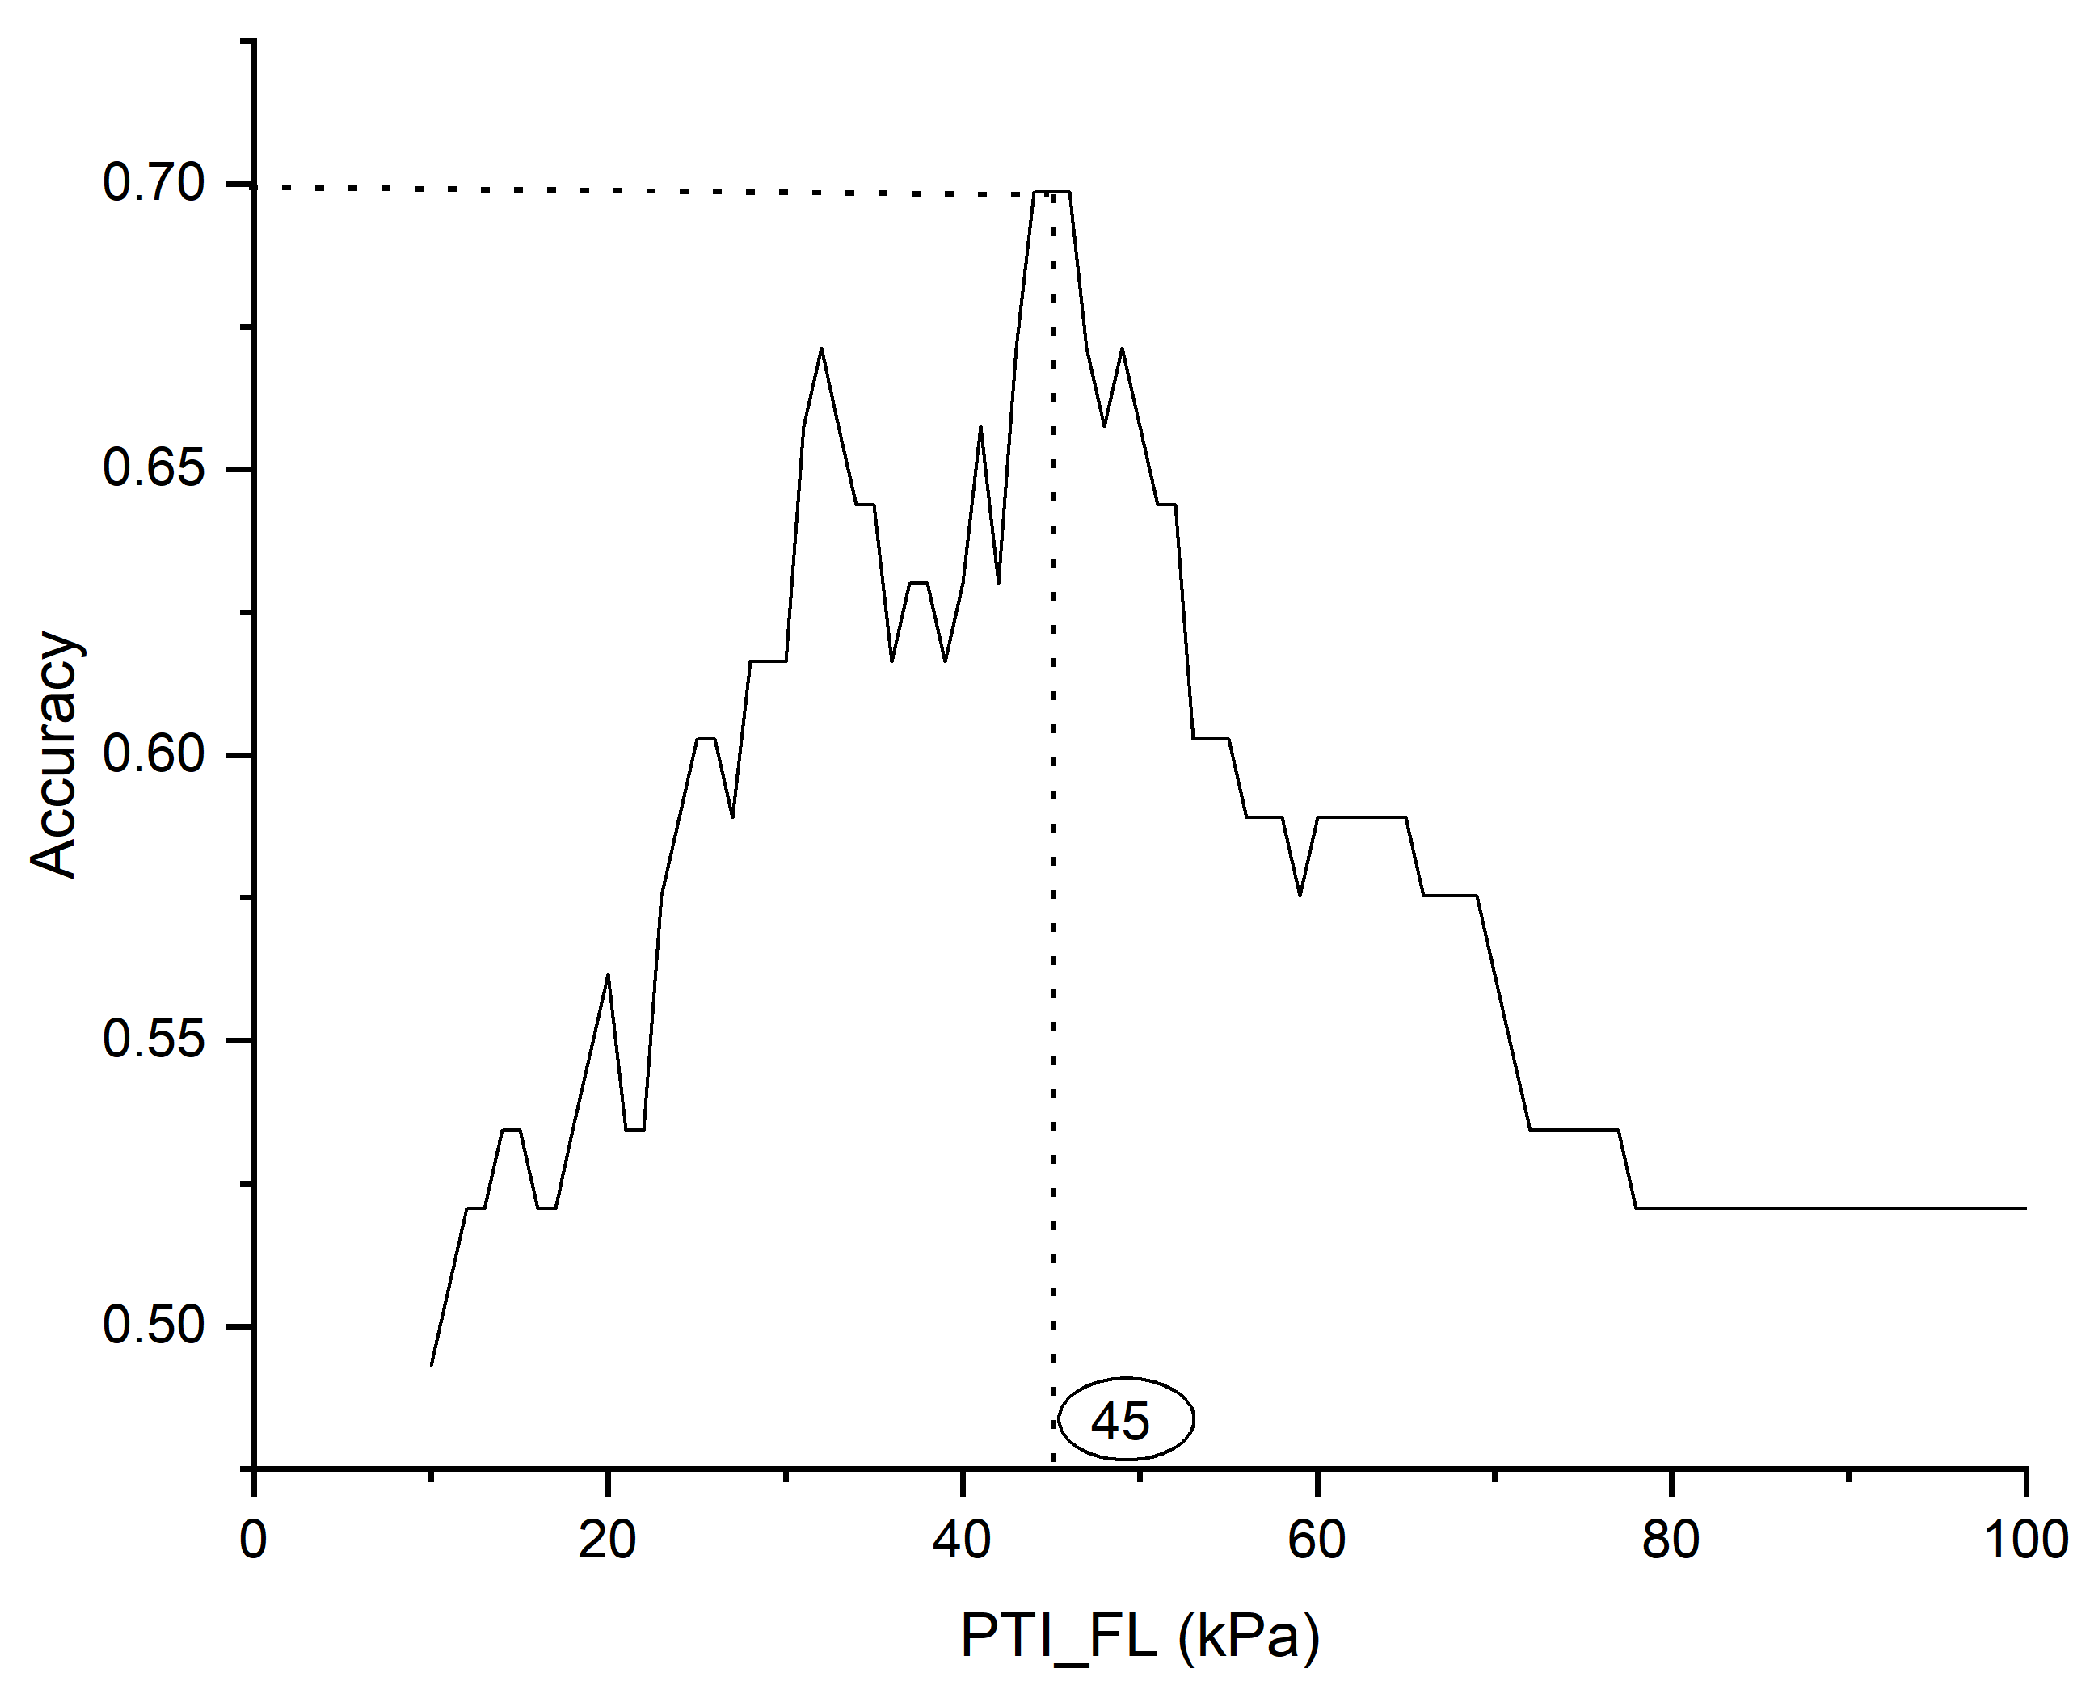
Figure 8.
Accuracy and F1-score assessment of the 13 significant parameters from Table 1 using a statistic-based classification model.
Figure 8.
Accuracy and F1-score assessment of the 13 significant parameters from Table 1 using a statistic-based classification model.
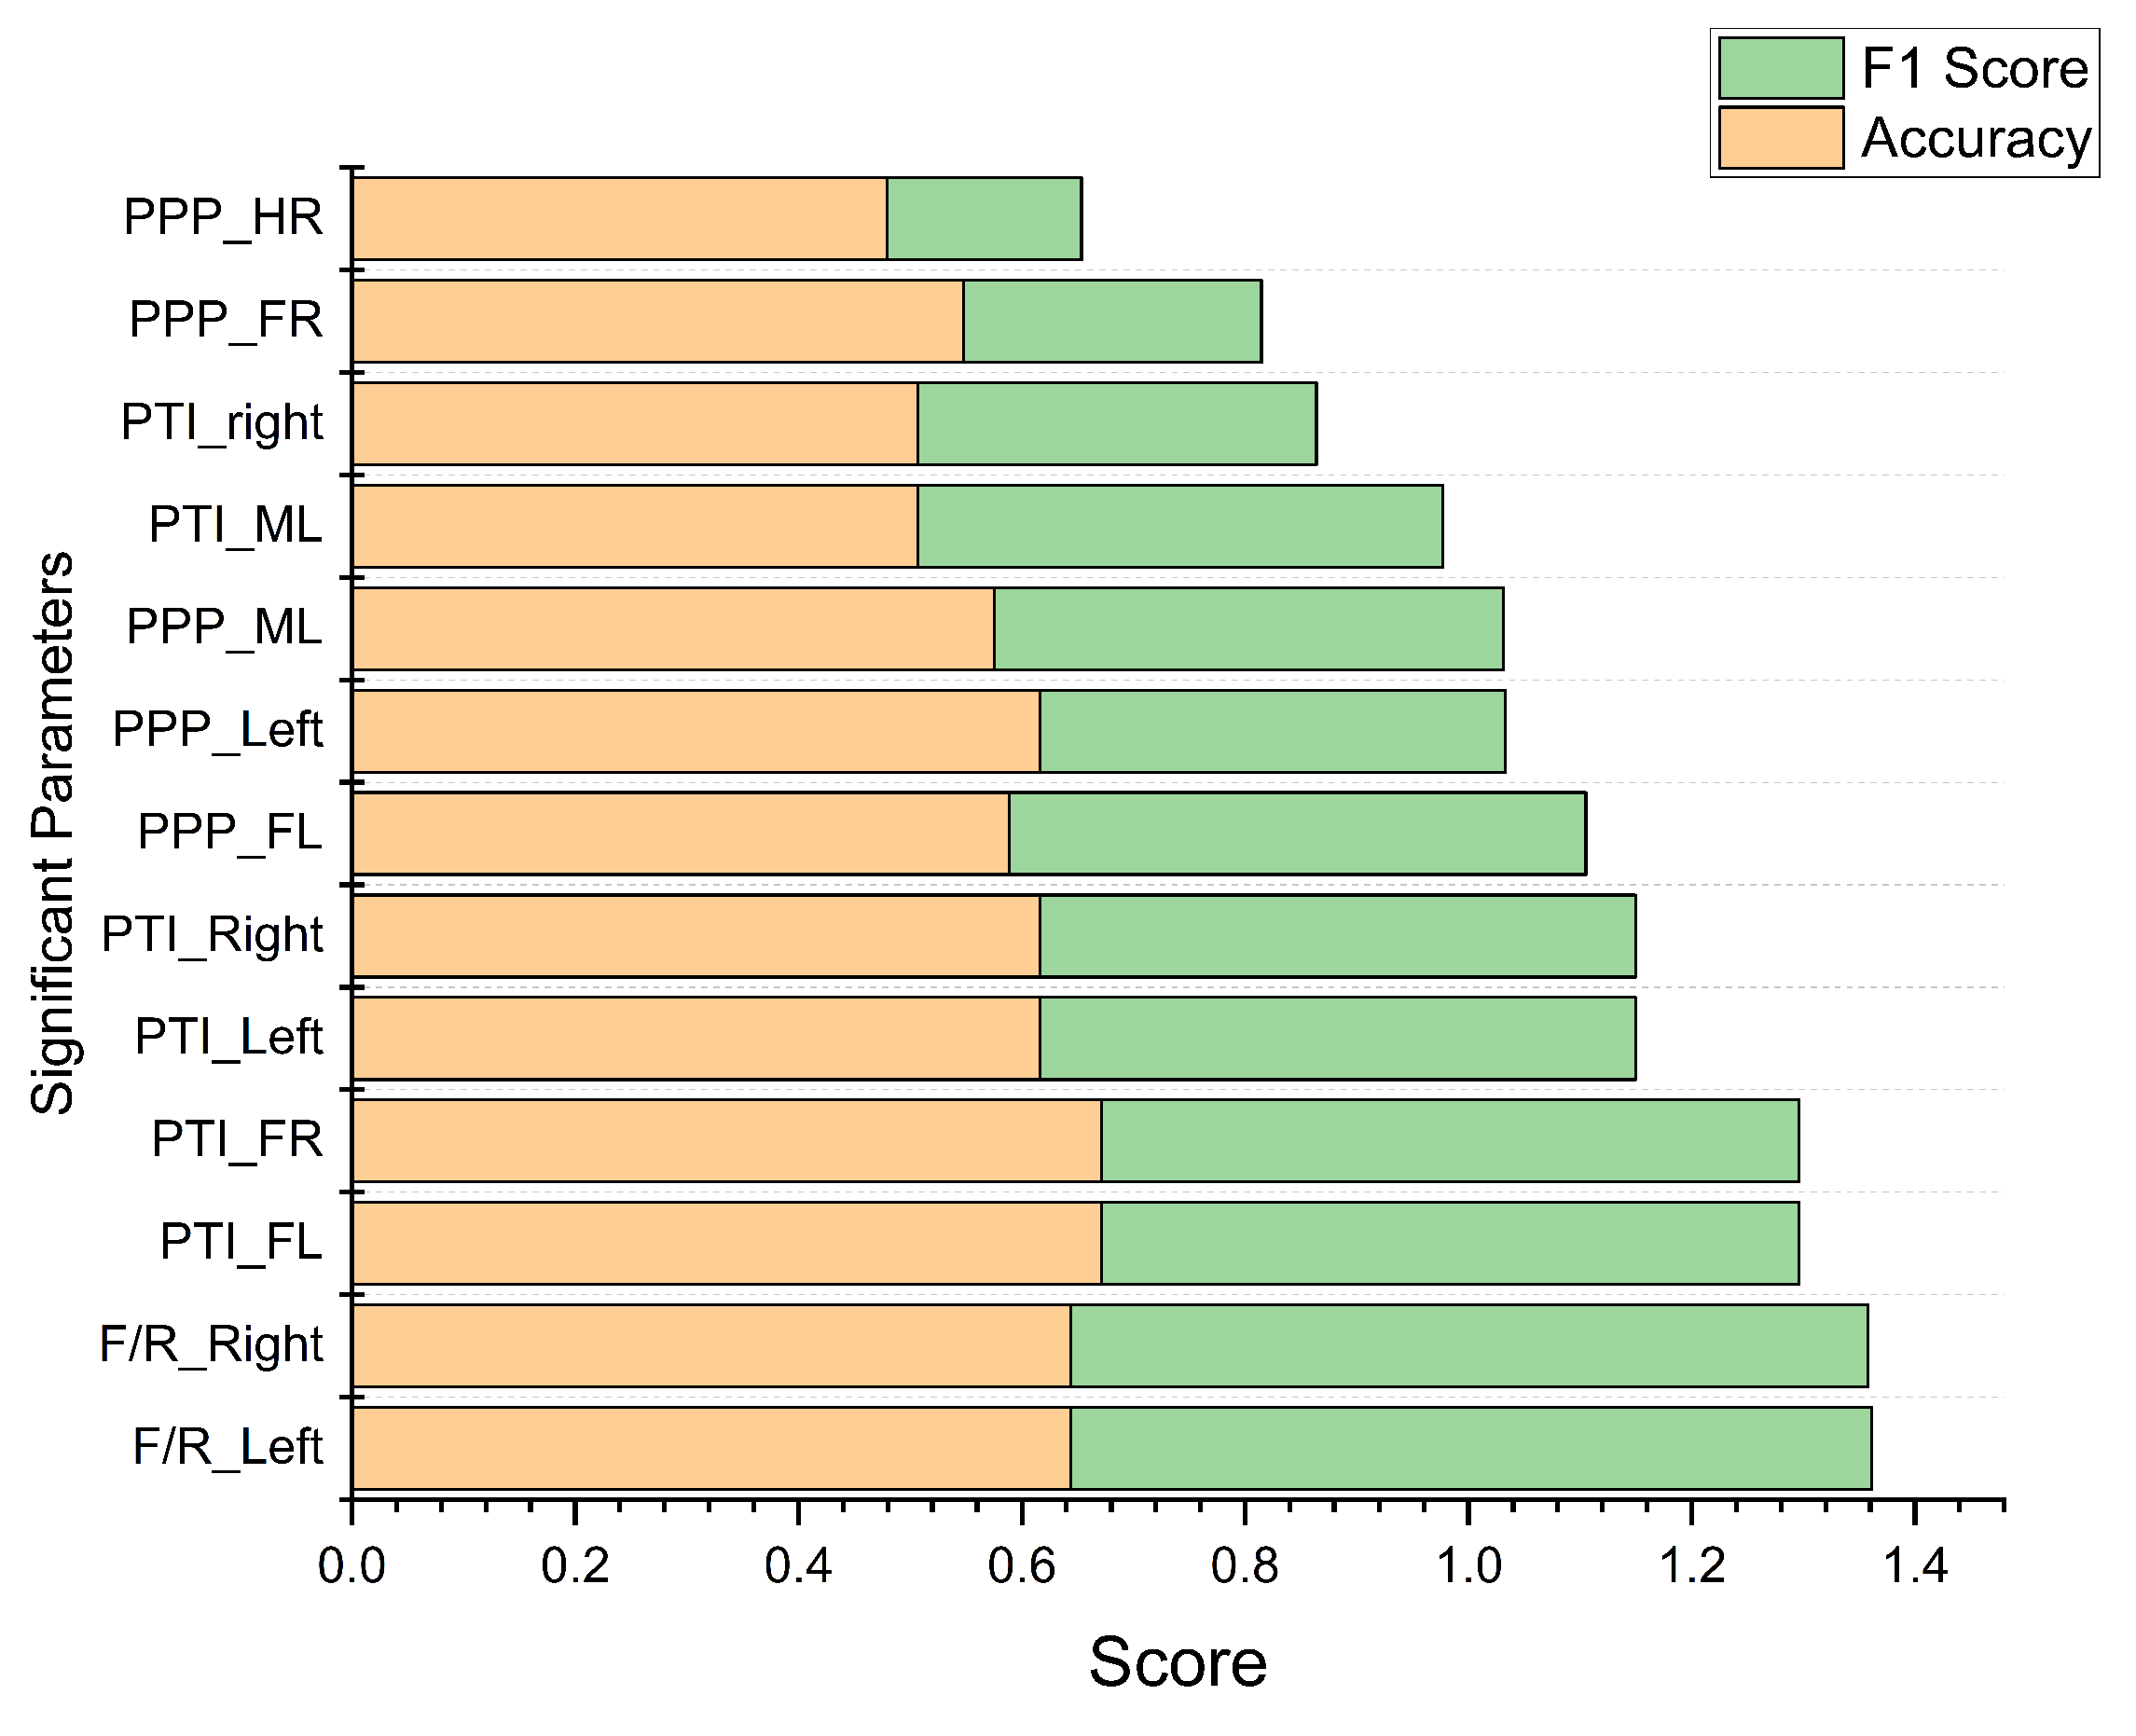
Figure 9.
Number of PCA components vs accuracy score of NB model.
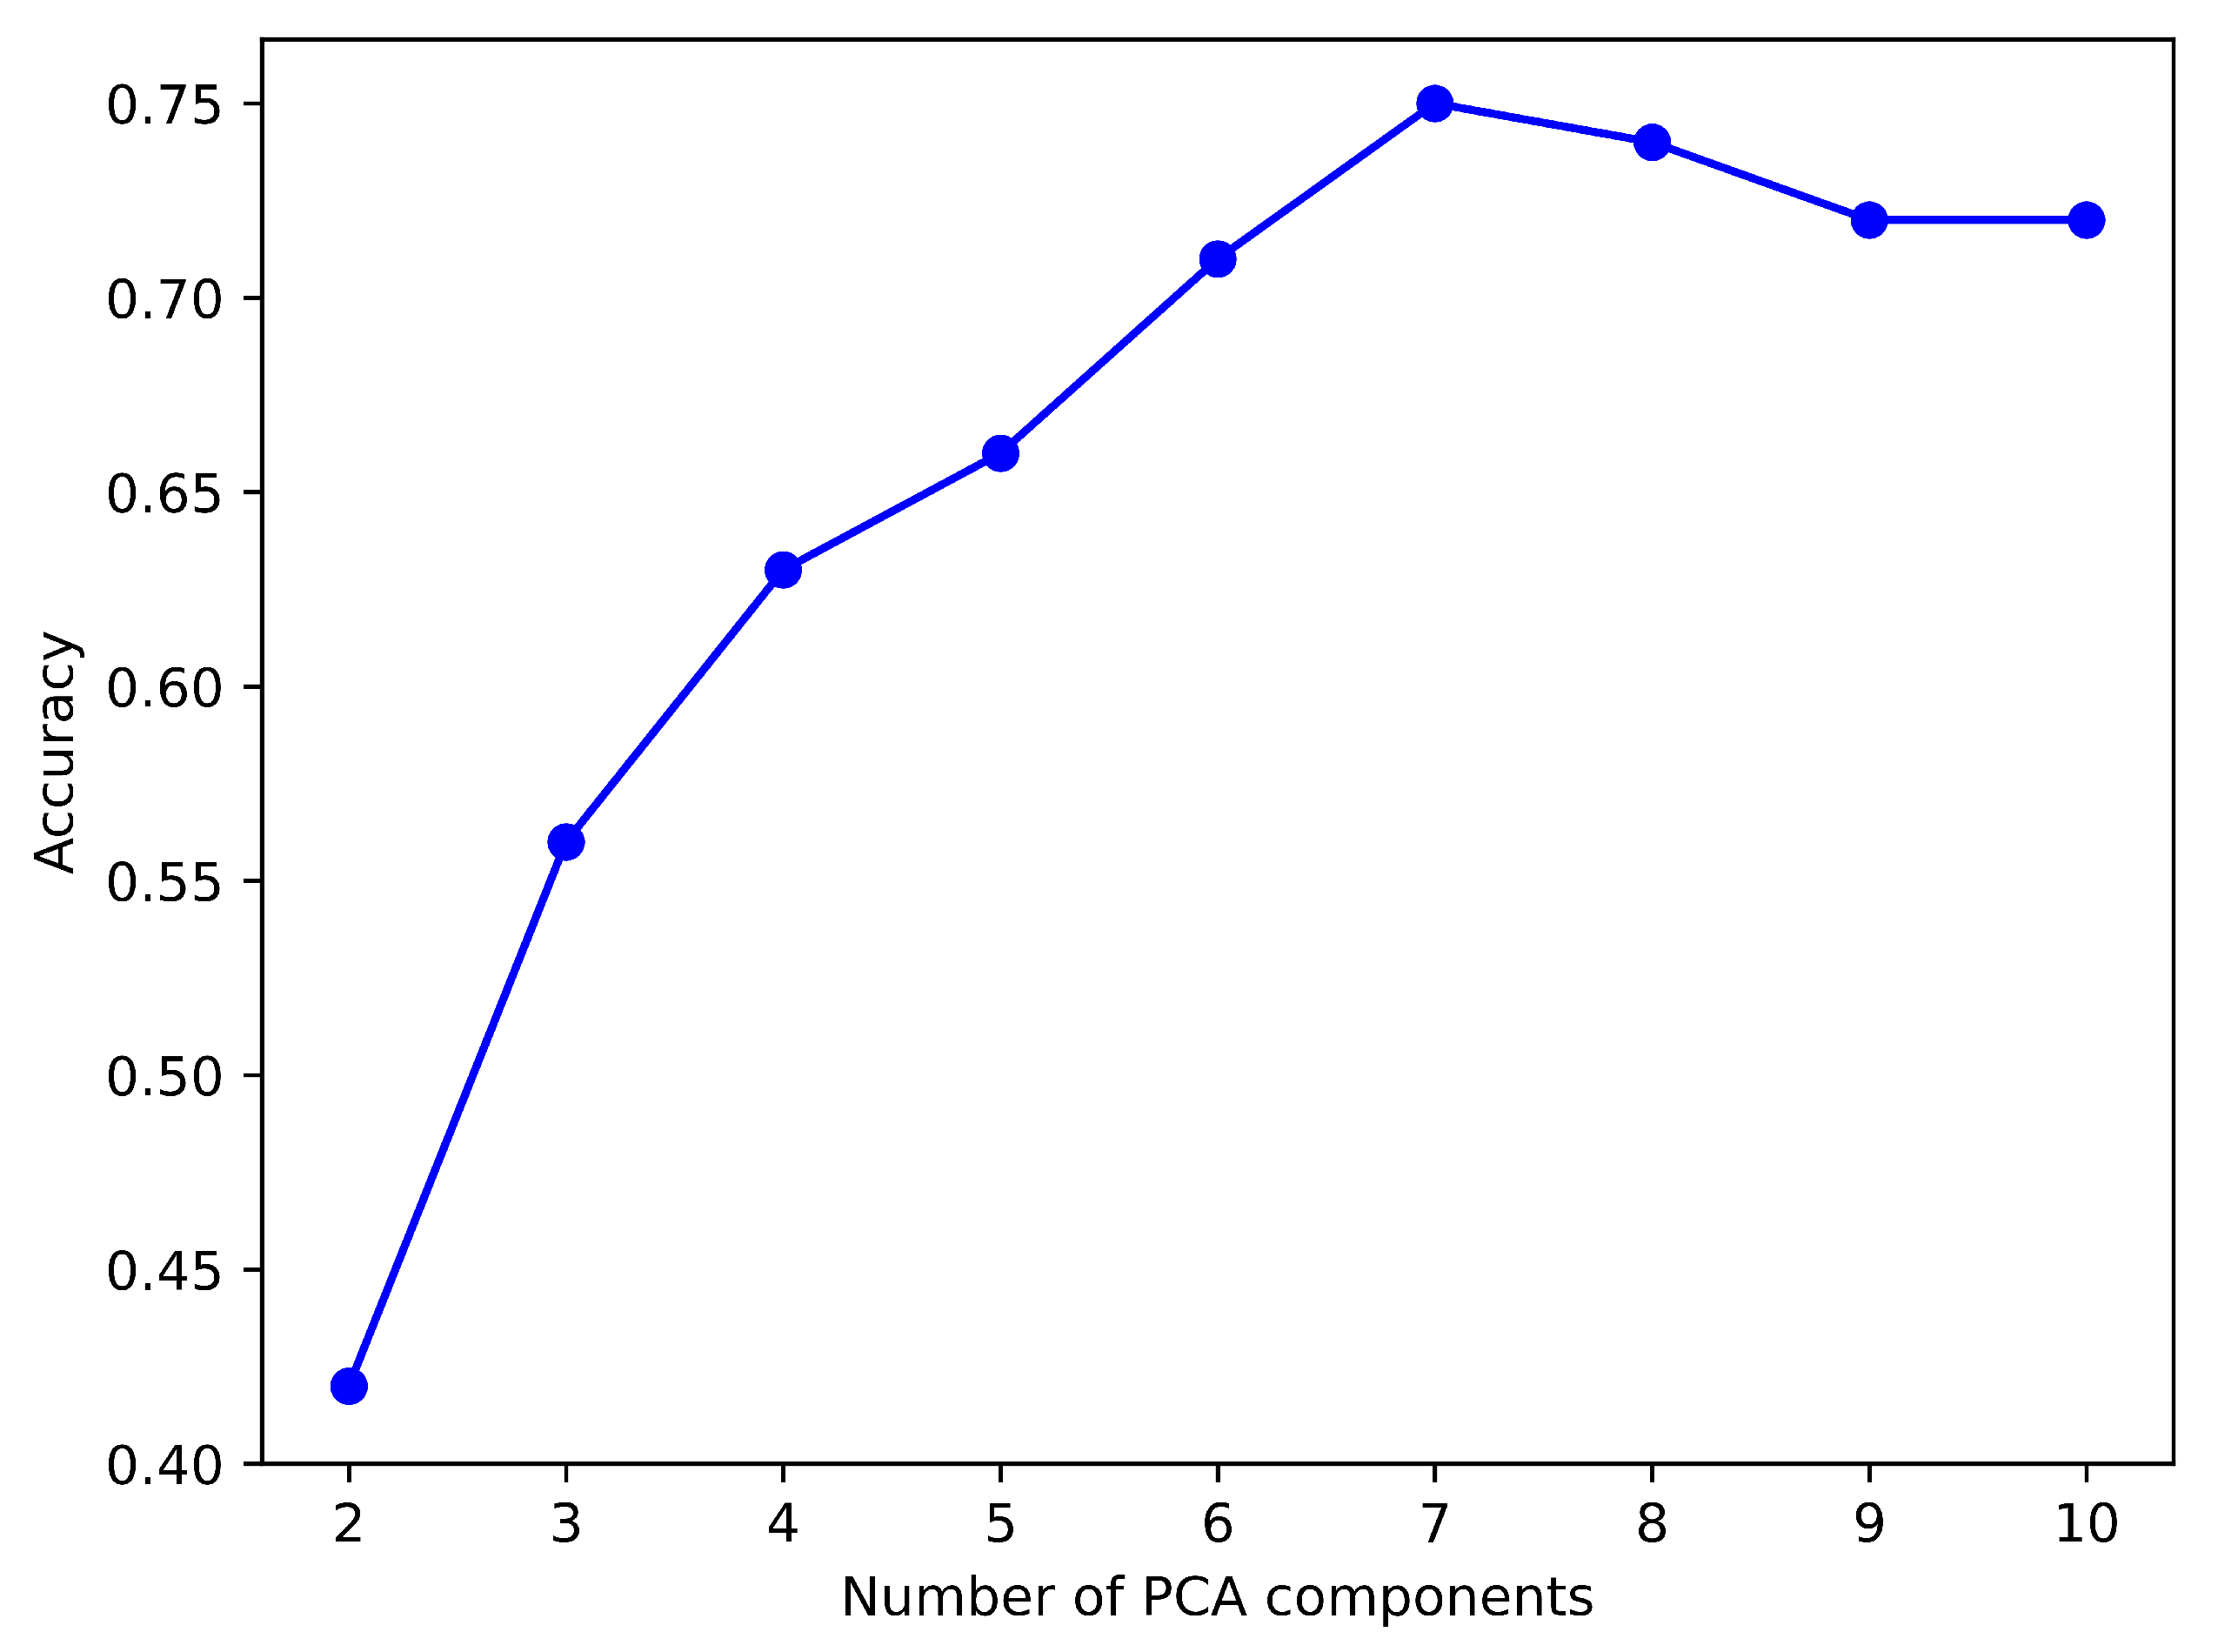
Figure 10.
PCA components and their corresponding feature scores.
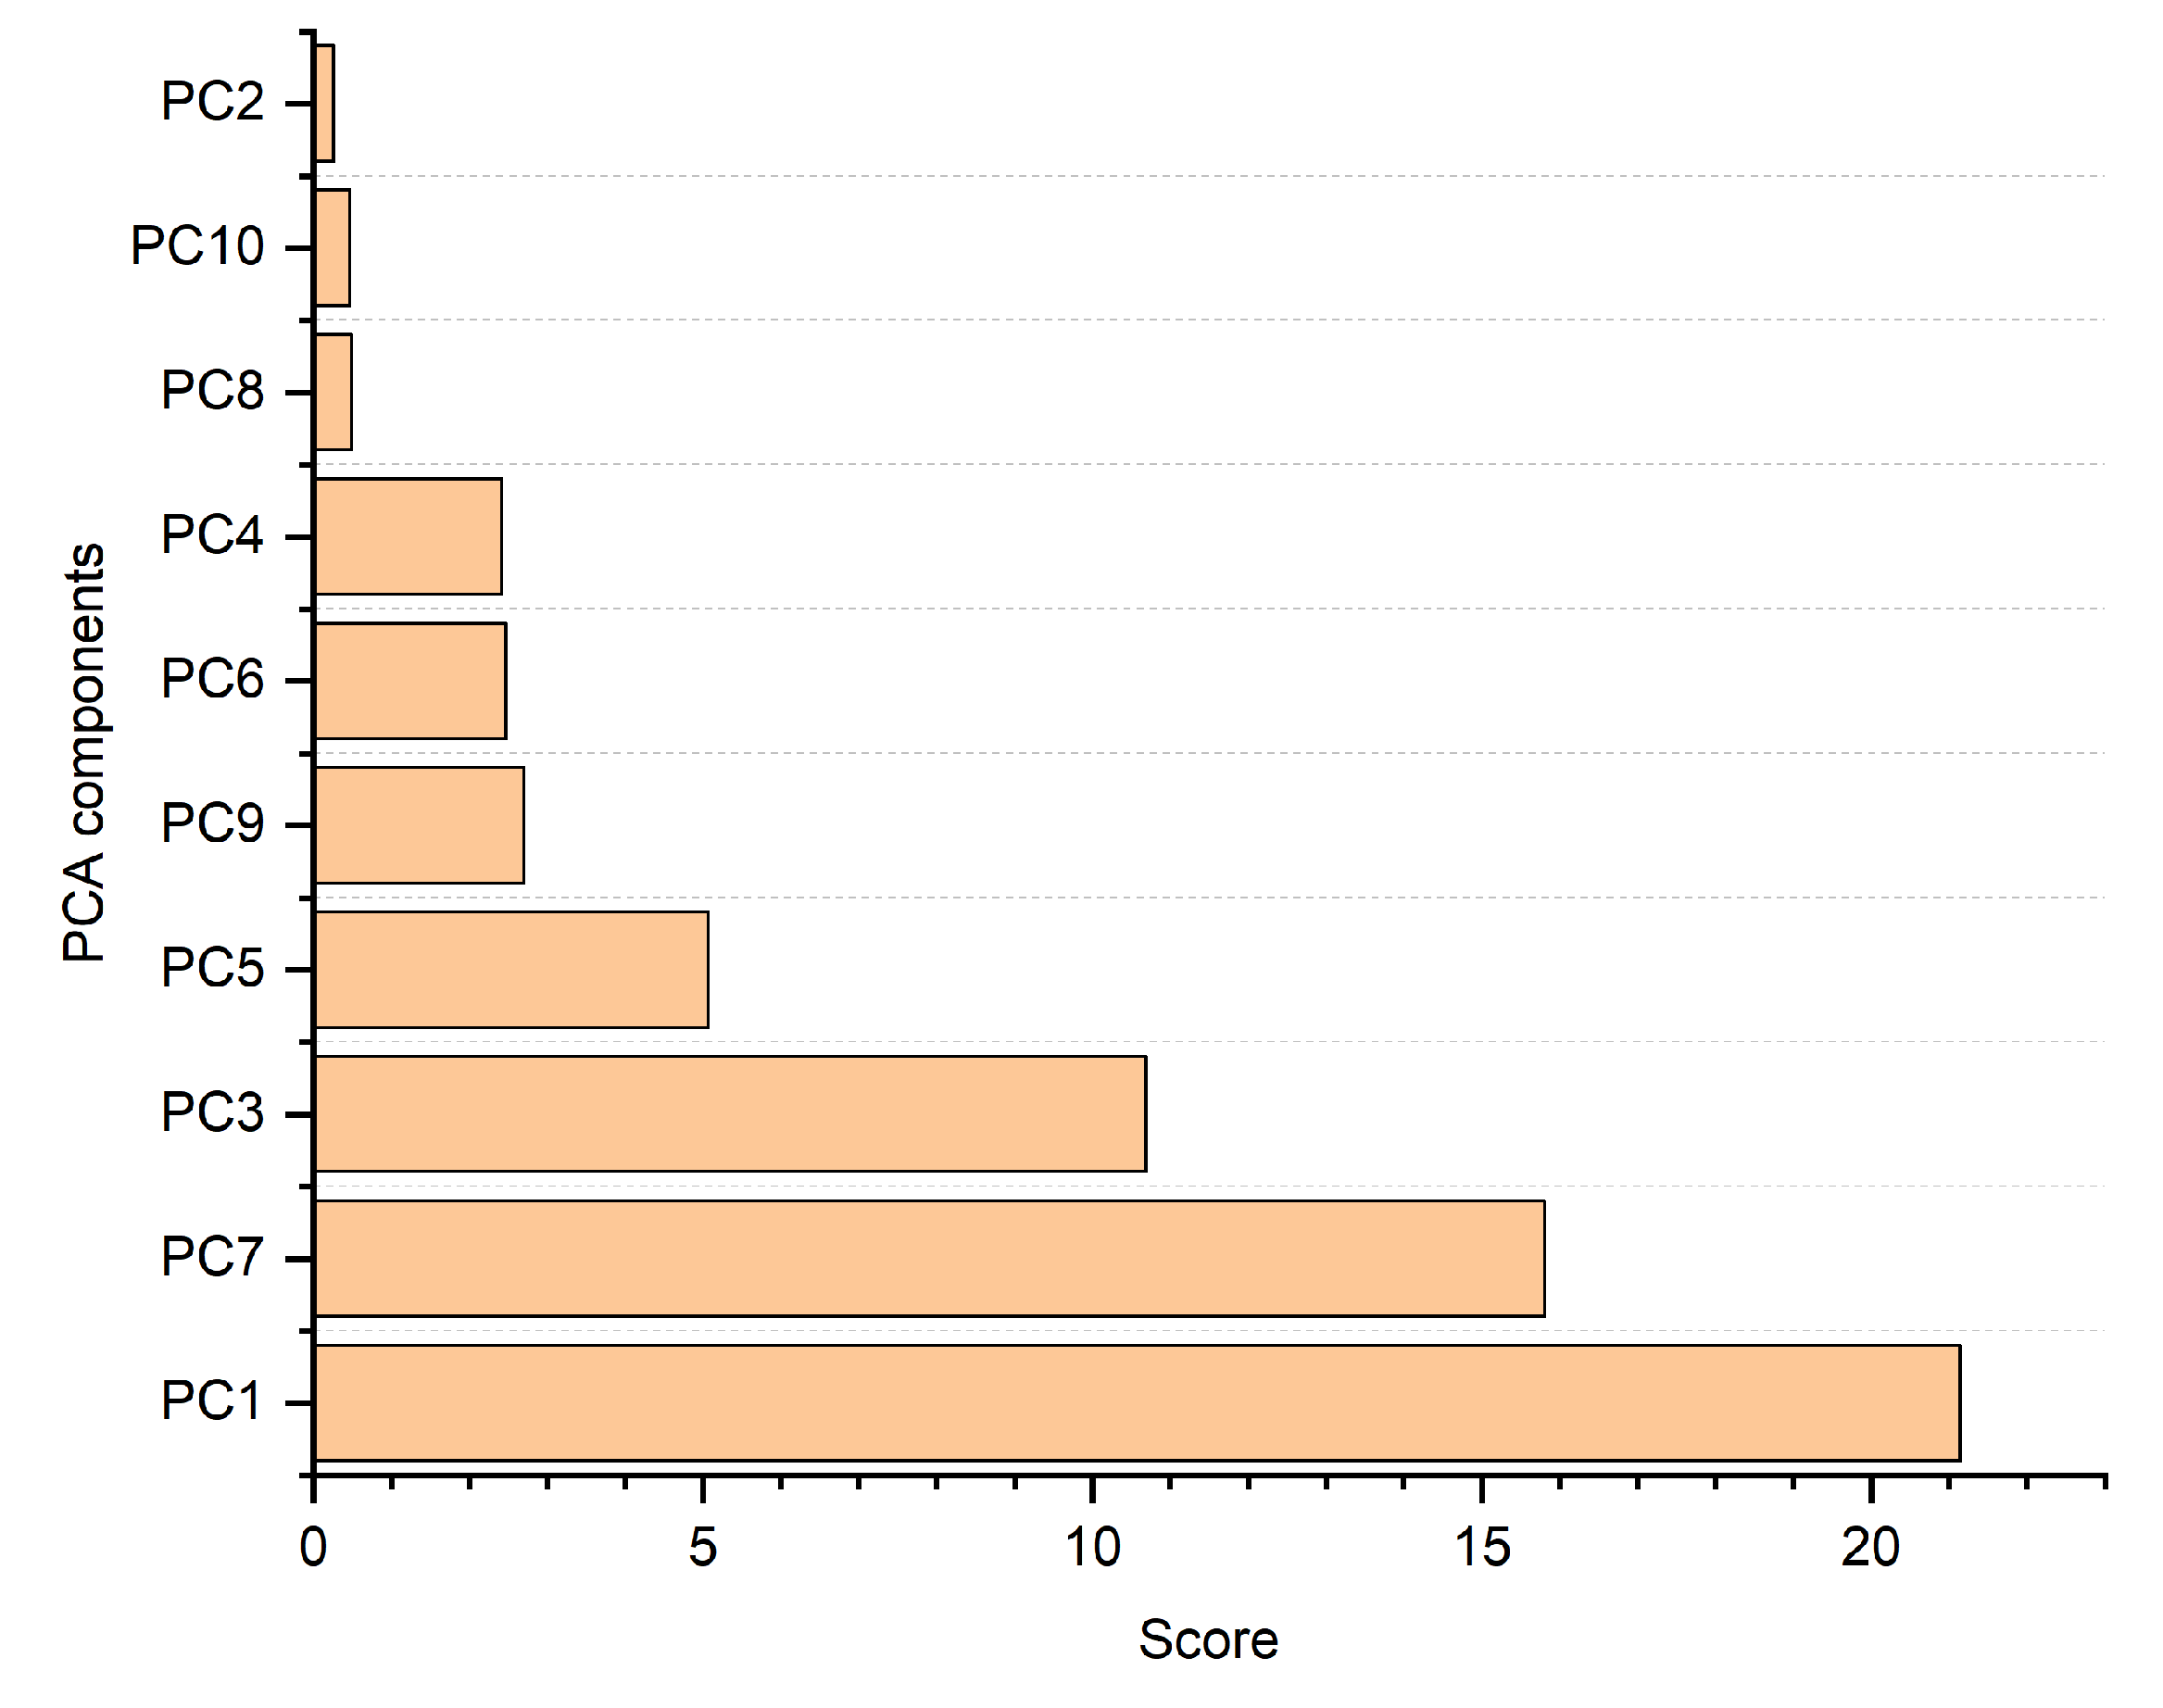
Figure 11.
Performance evaluation: ML models and their accuracy scores.
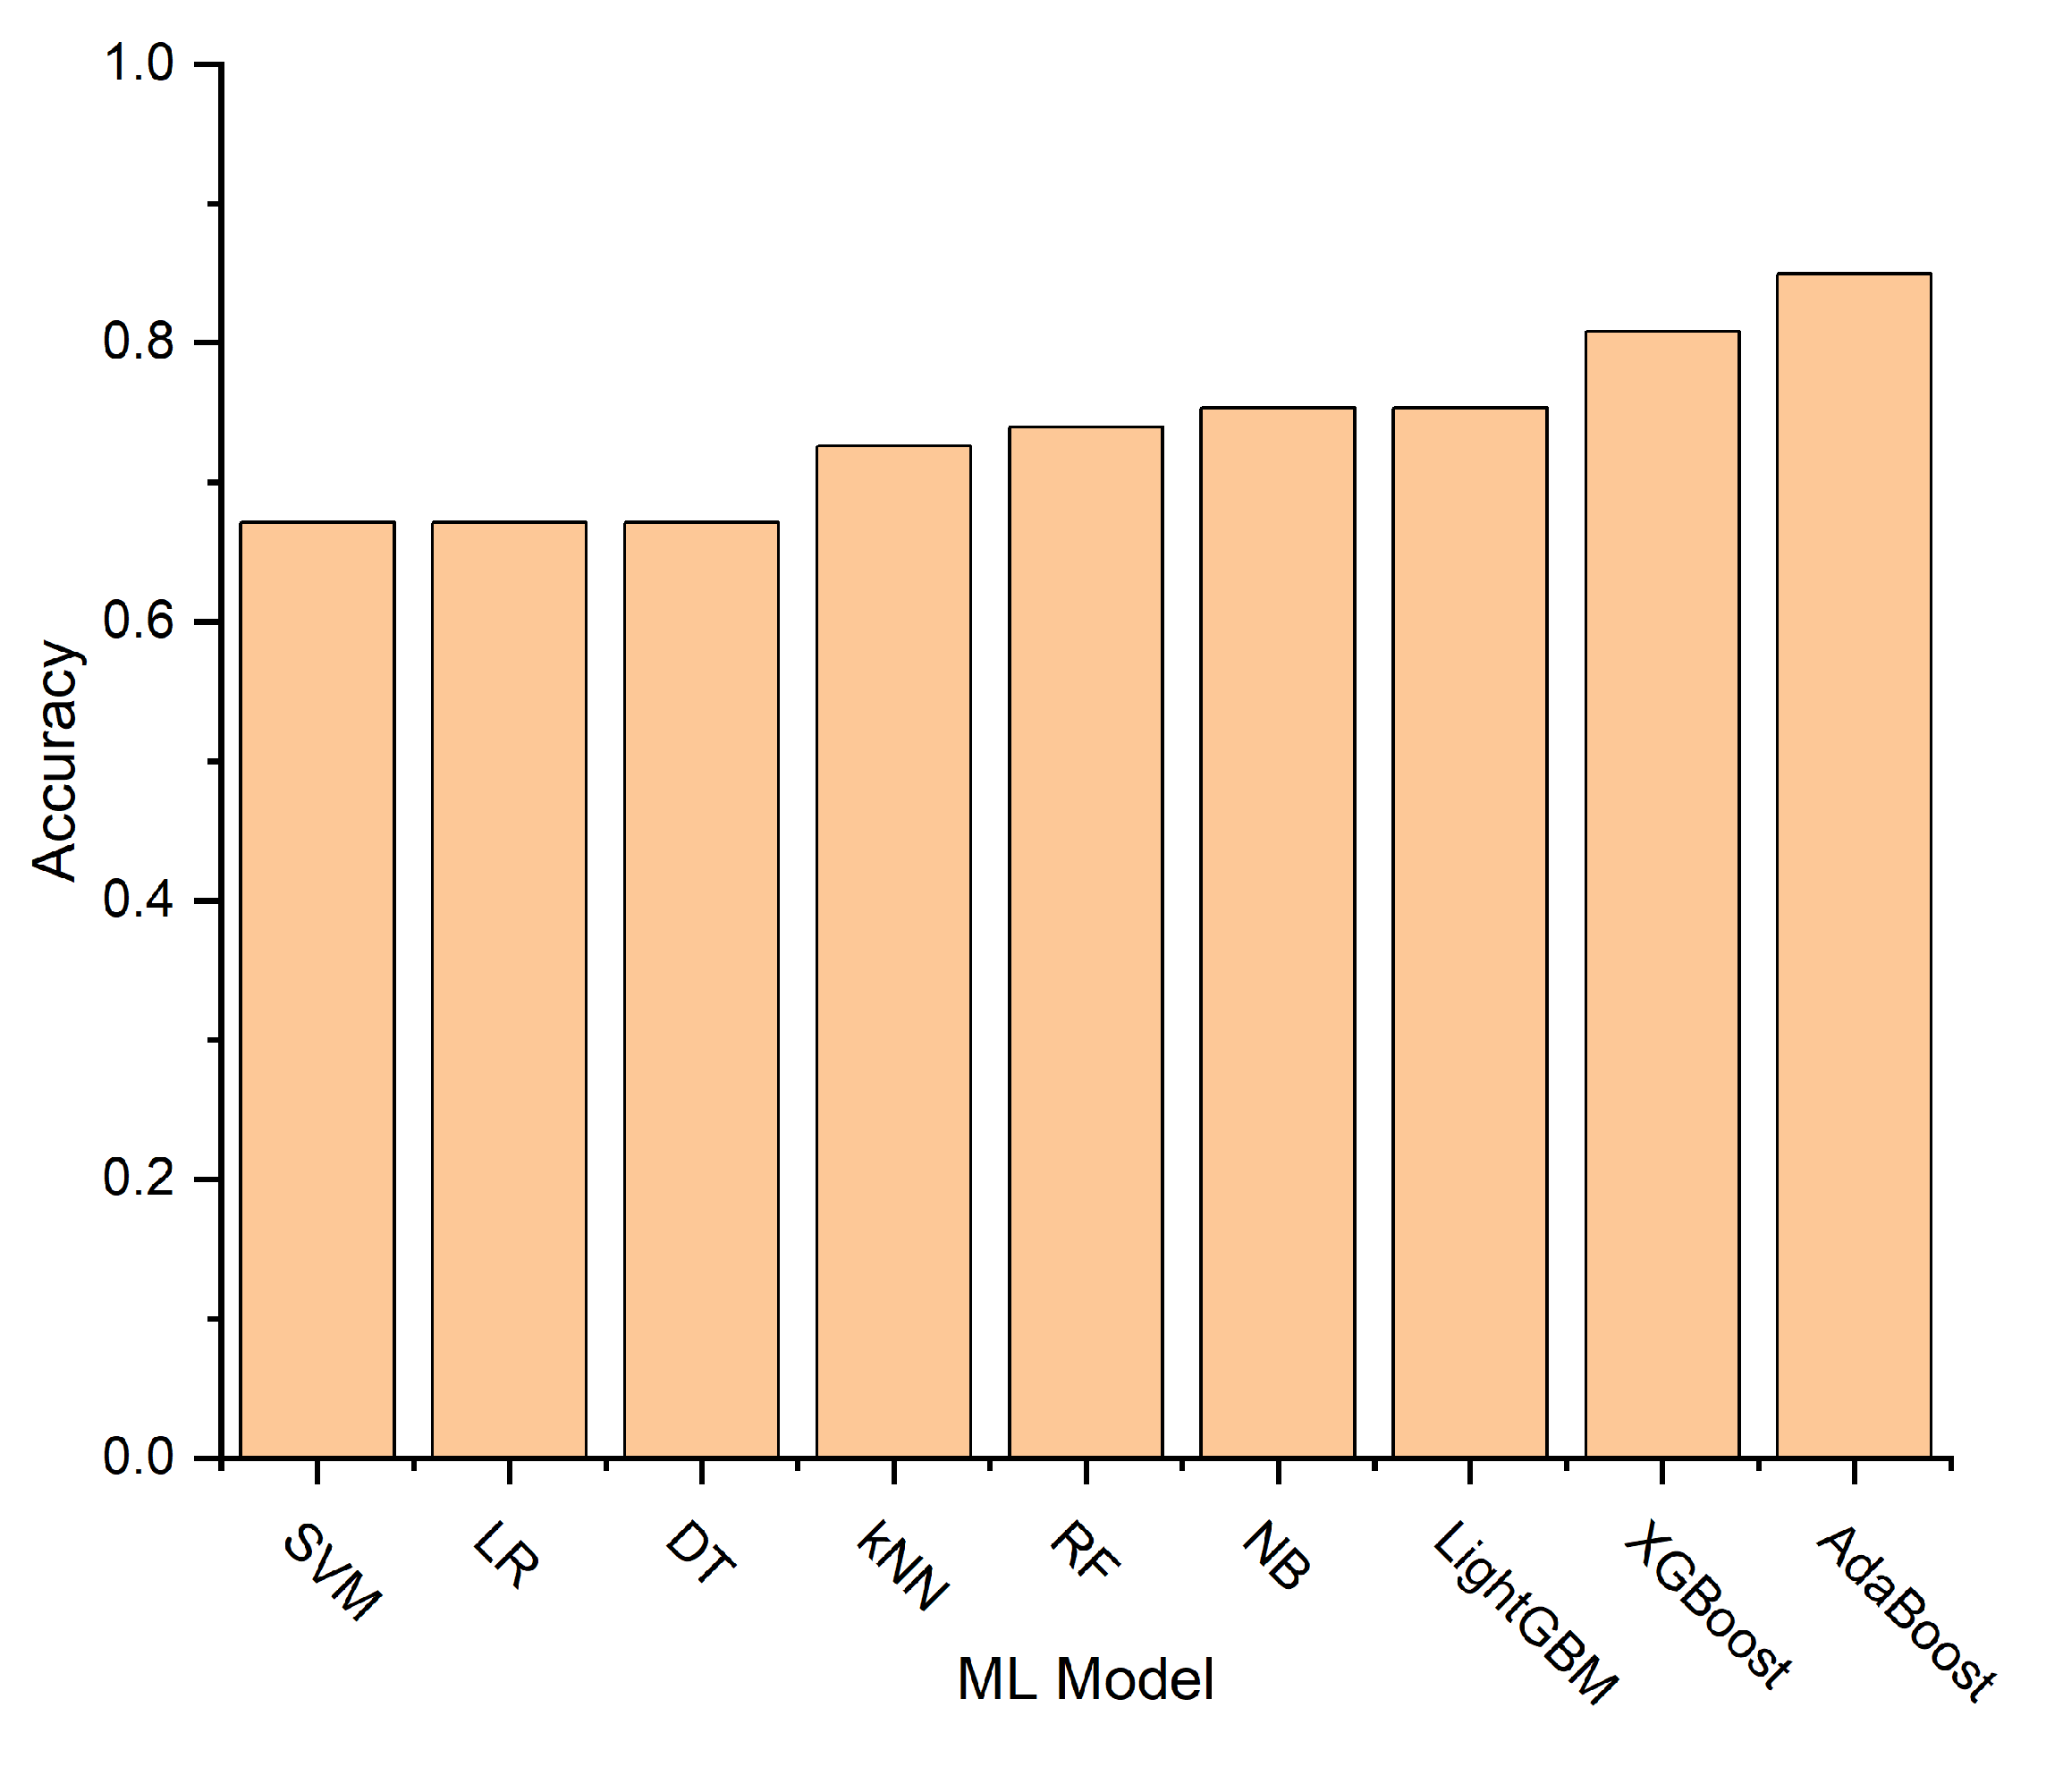

Table 1.
Statistical t-test on peak plantar pressure, pressure time integral and forefoot-to-rearfoot ratio.
Table 1.
Statistical t-test on peak plantar pressure, pressure time integral and forefoot-to-rearfoot ratio.
| Parameter | Abbreviation | Healthy (126) | Diabetes (117) | t | P value | ||||
|---|---|---|---|---|---|---|---|---|---|
| Mean | SD | Means | SD | ||||||
| Peak Plantar Pressure | Left foot | Forefoot | PPP_FL | 102.87 | 32.78 | 126.35 | 43.47 | -4.7 | 0.000004* |
| Midfoot | PPP_ML | 74.23 | 31.59 | 87.56 | 45.85 | -2.6 | 0.0097* | ||
| Heel | PPP_HL | 167.48 | 63.19 | 167.02 | 60.75 | 0.05 | 0.954 | ||
| Entire foot | PPP_Left | 361.27 | 89.4 | 422.26 | 123.53 | -4.36 | 0.00002* | ||
| Right foot | Forefoot | PPP_FR | 110.92 | 33.13 | 121.66 | 34.81 | -2.45 | 0.0149* | |
| Midfoot | PPP_MR | 84.37 | 33.43 | 90.44 | 51.89 | -1.07 | 0.2857 | ||
| Heel | PPP_HR | 158.46 | 39.1 | 146.71 | 51.66 | 1.98 | 0.0489* | ||
| Entirefoot | PPP_Right | 378.51 | 85.58 | 417.5 | 93.86 | -3.36 | 0.0009* | ||
| Pressure Time Integral | Left foot | Forefoot | PTI_FL | 31.47 | 11.82 | 42.74 | 20.2 | -5.23 | 4.52E-07* |
| Midfoot | PTI_ML | 21.58 | 13.78 | 29.91 | 22.23 | -3.46 | 0.000655* | ||
| Heel | PTI_HL | 48.77 | 22.64 | 53.61 | 28.39 | -1.45 | 0.1464 | ||
| Entirefoot | PTI_Left | 177.7 | 48.77 | 222.53 | 82.44 | -5.08 | 8.80E-07* | ||
| Right foot | Forefoot | PTI_FR | 34.63 | 13.49 | 39.91 | 16.09 | -2.74 | 0.0065* | |
| Midfoot | PTI_MR | 25.56 | 13.98 | 28.73 | 24.33 | -1.22 | 0.221 | ||
| Heel | PTI_HR | 46.59 | 18.96 | 42.78 | 20.97 | 1.47 | 0.1407 | ||
| Entirefoot | PTI_Right | 187.95 | 47.2 | 202.2 | 61.36 | -2.009 | 0.0457* | ||
| Forefoot-to-rearfoot ratio | Left foot | F/R_Left | 0.77 | 0.31 | 0.87 | 0.27 | -2.7 | 0.0073* | |
| Right foot | F/R_Right | 0.79 | 0.25 | 0.98 | 0.36 | -4.78 | 0.000003* | ||
Table 2.
Optimal hyperparameters on PCA dataset using GridSearchCV library.
| ML model | Optimal hyperparameter |
|---|---|
| SVM | {’C’: 1, ’kernel’: ’rbf’} |
| LR | {’C’: 1} |
| DT | {’criterion’: ’gini’, ’max_depth’: 4} |
| kNN | {’metric’: ’manhattan’, ’n_neighbors’: 15, ’weights’: ’distance’} |
| RF | {’n_estimators’: 5} |
| NB | {’var_smoothing’: 0.01} |
| LightGBM | {’learning rate’: 0.01, ’max_depth’: 3, ’n_estimators’: 500} |
| XGBoost | {’learning rate’: 0.1, ’max_depth’: 3, ’n_estimators’: 500} |
| AdaBoost | {’learning rate’: 0.1, ’n_estimators’: 200} |
Table 3.
Optimal hyperparameters on PCA dataset using GridSearchCV library.
| Evaluation Metrics | Statistic-based classification model |
ML classification models | |||||||||
|---|---|---|---|---|---|---|---|---|---|---|---|
| PTI_FL | F/R_Left | SVM | LR | DT | KNN | RF | NB | LightGBM | XGBoost | AdaBoost | |
| Accuracy | 0.67 | 0.64 | 0.67 | 0.67 | 0.67 | 0.73 | 0.74 | 0.75 | 0.75 | 0.81 | 0.85 |
| Sensitivity | 0.36 | 0.92 | 0.56 | 0.58 | 0.58 | 0.50 | 0.56 | 0.61 | 0.64 | 0.72 | 0.83 |
| Specificity | 0.97 | 0.38 | 0.78 | 0.76 | 0.76 | 0.95 | 0.92 | 0.89 | 0.86 | 0.89 | 0.86 |
| F1-Score | 0.52 | 0.72 | 0.63 | 0.64 | 0.64 | 0.64 | 0.68 | 0.71 | 0.72 | 0.79 | 0.85 |
| AUC | — | — | 0.88 | 0.76 | 0.69 | 0.87 | 0.85 | 0.83 | 0.86 | 0.88 | 0.88 |
Disclaimer/Publisher’s Note: The statements, opinions and data contained in all publications are solely those of the individual author(s) and contributor(s) and not of MDPI and/or the editor(s). MDPI and/or the editor(s) disclaim responsibility for any injury to people or property resulting from any ideas, methods, instructions or products referred to in the content. |
© 2024 by the authors. Licensee MDPI, Basel, Switzerland. This article is an open access article distributed under the terms and conditions of the Creative Commons Attribution (CC BY) license (http://creativecommons.org/licenses/by/4.0/).
Copyright: This open access article is published under a Creative Commons CC BY 4.0 license, which permit the free download, distribution, and reuse, provided that the author and preprint are cited in any reuse.