Submitted:
11 October 2024
Posted:
16 October 2024
You are already at the latest version
Abstract
Objective: Colorectal cancer (CRC) is the third most prevalent malignant tumor type and the second leading cause of cancer-related death. Sequence similarity family 50 member A (FAM50A) plays a vital role in numerous disease processes, including tumor progression. This study aimed to evaluate the prognostic significance of FAM50A in CRC and to explore its role in CRC cell proliferation. Methods: The Cancer Genome Atlas (TCGA) database was used to assess the mRNA expression levels of FAM50A in CRC. Immunohistochemical staining was used to study the expression of FAM50A in CRC tissues. Patient survival data were used to assess the prognostic significance of FAM50A in CRC using Kaplan–Meier analysis and Cox regression analysis. The Cell Counting Kit-8, 5-ethynyl-2′-deoxyuridine, and colony-formation assays were employed to assess the impact of FAM50A knockdown on tumor cell proliferation. Co-expression and correlation heatmaps were used to identify genes whose expression levels were highly correlated with FAM50A, and to further investigate the possible mechanism of action of FAM50A in CRC cell proliferation. Results: Analysis of data from TCGA database revealed a notable upregulation of FAM50A expression levels in CRC tissue compared with adjacent normal tissue. Moreover, FAM50A expression was positively correlated with N, M, and TNM stages in 145 patients with CRC. Cox regression analysis and construction of a nomogram revealed that high FAM50A expression was a prognostic indicator for poor overall survival in patients with CRC. Knockdown of FAM50A decreased cell proliferation ability, the proportion of EdU positive cells, and the number of CRC cell colonies, whereas overexpressing FAM50A promoted proliferative phenotypes. The expression levels of three genes in CRC were significantly negatively correlated, while the expression levels of 18 genes were significantly positively correlated, with the expression level of FAM50A. Conclusion: FAM50A may be a novel prognostic marker for CRC, and may participate in regulating tumor progression by interacting with some highly correlated molecules that drive CRC cell proliferation.
Keywords:
colorectal cancer
; FAM50A
; prognostic
; marker
; proliferation
1. Introduction
Colorectal cancer (CRC) ranks as the third most common malignant tumor type globally, and the second leading cause of cancer-related death . The incidence and mortality rates of CRC have stabilized and declined in some Western countries because of nationwide screening programs and the widespread use of colonoscopy . However, the incidence of CRC remains high, resulting in a significant financial burden to society . Owing to continued economic progress and changes in dietary practices in developing countries, the number of new CRC cases is expected to increase to approximately 2.4 million globally by 2035 . Despite recent progress in medical technology and the advent of multidisciplinary and comprehensive treatments for CRC, the high mortality rate associated with this disease has not improved significantly . The 5-year overall survival (OS) rate is 90% in patients diagnosed with early-stage CRC, 70% in those with locally advanced CRC, and 15% in patients with metastatic CRC . The majority of patients with CRC are diagnosed with an advanced stage of disease. While treatments such as chemotherapy, molecular targeted therapy, and immunotherapy have increased survival rates, some patients develop initial insensitivity or resistance to these drugs over time, leading to primary and secondary drug resistance [7,8]. Thus, the development of drug resistance remains a significant clinical challenge in the treatment of CRC . The primary cause of drug resistance is typically abnormal metabolism, transport, or targeting of anti-tumor drugs . Cell death pathways, cytokine pathways, oncogenic signals, compensatory feedback loop signaling pathways, and the tumor immune microenvironment can contribute to various drug resistance mechanisms . Together with tumor recurrence and metastasis, drug resistance is therefore a major factor in the mortality rates related to CRC . A thorough understanding of the mechanisms underlying the occurrence and progression of CRC is essential for the discovery of novel diagnostic biomarkers and treatment approaches. This will enhance our understanding of CRC and facilitate the development of more efficient clinical diagnosis and treatment methods.
Tumor progression is characterized by gradual cellular changes over time . Tumor cells evolve into subtypes that have clear proliferation advantages. In vivo, they progressively lose the normal controls for cell proliferation and subsequently transition to a new phase of proliferation . As cell proliferation and DNA mutations increase simultaneously, the cells escape their normal regulatory mechanisms. The morphology and metabolism of tumor cells are also altered. In a review published in 2011, Hanahan and Weinberg further elaborated the defining features of tumors. Cancer cells possess the ability to evade apoptosis, overcome growth suppression, induce angiogenesis, and sustain proliferative signaling, while exhibiting immortalization and unlimited replication potential . Many scientists have since focused their research on tumor cell proliferation, resulting in a deeper understanding of this process [15,16].
The family of sequence similarity (FAM) refers to a group of genes that share similar sequences and are involved in various diseases . Owing to the widespread expression of FAM20C in various cancer types, it has been linked to tumorigenesis in humans . Furthermore, deletion of FAM13A following hypoxia was reported to decrease the proliferation and metastatic capabilities of tumor cells, suggesting that it may be a promising target for cancer therapy . Sequence similarity family 50 member A (FAM50A) and FAM50B are two distinct members of the sequence similarity 50 gene family. FAM50A is known as X chromosome-associated protein 5 (Xap5) . This protein has a nuclear localization sequence, and can act as a DNA-binding protein or transcription factor. FAM50A is cytogenetically positioned on human chromosome Xq28 and comprises five exons that encode 339 amino acids with a molecular weight of 40 kDa . It may serve as a splicing factor in the processing of RNA precursors, and may also be associated with the development of X-chromosome-related intellectual disability . However, the function of FAM50A in CRC is not well understood, and there is limited research on its expression and role in this tumor type.
The aim of this study was, therefore, to investigate FAM50A expression during the onset and progression of CRC. First, data from The Cancer Genome Atlas (TCGA) public database was extracted and analyzed to study the potential tumorigenic effects of FAM50A in CRC. Immunohistochemical (IHC) staining was used to quantify the expression levels of FAM50A protein in CRC samples. Additionally, the prognostic significance of FAM50A in CRC was evaluated by analyzing patient survival. Finally, given the importance of cell proliferation in tumor growth, several experimental methods (Cell Counting Kit-8 [CCK-8], 5-ethynyl-2′-deoxyuridine [EdU], and colony-formation assays) were used to investigate the impact of FAM50A on cell proliferation.
2. Materials and Methods
2.1. Extraction and Analysis of Data from Public Databases
Data from public databases, TCGA and GTEx, were used to compare the mRNA expression profile of FAM50A between pan-cancer tissues and corresponding normal tissues . Subsequently, RNA-seq data and corresponding clinical information from unpaired and paired samples of CRC in TCGA database were systematically collected and processed based on the research interests of our research . The expression level of FAM50A was statistically analyzed following log2 transformation. The analysis and mapping of FAM50A expression in tumors was then conducted using “limma” and other R (v4.2.2) packages, with statistical significance set at P < 0.05 .
2.2. Immunohistochemical Analysis
Building upon a previous study , IHC analysis was utilized to confirm the differential expression levels of FAM50A in CRC samples. Following surgical resection, the tumor diameter was measured, signs of bleeding and necrosis were noted, and relevant tissue was collected for further analysis. The samples were fixed in 10% formalin, embedded, sectioned, stained with hematoxylin and eosin (HE), and observed under a light microscope. IHC analysis was carried out on suitable samples using a rabbit anti-FAM50A antibody (Bioss, Woburn, MA, USA; bs-8208R, 1:200) using a previously described procedure . The stained sections were photographed under a microscope at either 40× or 200× magnification. The expression level of FAM50A was quantified based on the intensity of staining and the proportion of positive cancer cells, as described in our previous study . This study was approved by the Ethics Committee of Bozhou Hospital, Anhui Medical University (No. 202223). Samples were collected from newly diagnosed patients with CRC who had not received any anti-tumor treatment. Informed consent was obtained from patients prior to specimen collection.
2.3. Clinical Correlation and Prognostic Analysis
The Wilcoxon test was utilized to investigate correlations between FAM50A expression levels and various clinicopathological characteristics, including T stage, N stage, clinicopathological stage, and age. Patients with CRC were stratified into high- and low-expression FAM50A groups according to the FAM50A expression level cut-off value, as determined by receiver operating characteristic (ROC) analysis. Data collection and analysis was carried out by two dedicated individuals. Following data entry and review, Kaplan–Meier analysis was employed to examine patient survival. Cox regression analysis (univariate and multivariate) was utilized to investigate the relationship between the FAM50A expression level and patient survival. A nomogram was utilized to examine the ability of FAM50A levels to determine CRC prognosis .
2.4. Cell Culture and Construction of Cell Lines With Stable FAM50A Knockdown and Overexpression Plasmids
CRC cell lines (SW480, HCT-8, HCT-116, and RKO) and human normal intestinal epithelial cell lines, FHC and HEK293T, were obtained from the American Type Culture Collection. All cells were cultured in Dulbecco’s modified Eagle medium with a high glucose concentration and 10% fetal bovine serum at 37°C and 5% CO2 . The lentiviral vector plasmids pLKO.1-Scramble and pLKO.1-shFAM50A were generated from the lentiviral vector plasmid pLKO.1-Puro; moreover, pCDH-puro-control and pCDH-puro-FAM50A plasmids were designated sequentially . The target sequences for FAM50A knockdown were: sh-FAM50A-1, 5′-CCGGCGAGATCCTTCGGAAAGACTTGGATCCAAGTCTTTCCGAAGGATCTCGTTTTTG-3′ (forward) and 5′-AATTCAAAAA CGAGATCCTTCGGAAAGACTT GGATCC AAGTCTTTCCGAAGGATCTCG-3′ (reverse); sh-FAM50A-2, 5′-CCGG GAGCTGGTACGAGAAGAACAAGGATCCTTGTTCTTCTCGTACCAGCTCTTTTTG-3′ (forward) and 5′-AATTCAAAAAGAGCTGGTACGAGAAGAACAAGGATCCTTGTTCTTCTCGTACCAGCTC-3′ (reverse). To generate the FAM50A-overexpression system, a gene fragment was obtained using the following primers: 5′-GCGAATTC ATGGCTCAATACAAGGGCGC-3′ (forward) and 5′-GCGGATCC TCAGCGGATCGTGTACTTGTCC-3′ (reverse). HEK293T cells were used for virus packaging and to collect viruses .
2.5. Quantitative Reverse Transcription Polymerase Chain Reaction (qRT-PCR)
Total RNA was extracted from cells using a commercially available RNA extraction kit (MN-MS-RNA-250; Bioscience, Shanghai, China). The qRT-PCR assay was performed using a Prime Script RT and SYBR Premix Ex Taq kit (Vazyme, Nanjing, China) according to the manufacturer’s instructions. Gene expression levels were normalized to that of β-actin. The qRT-PCR results were analyzed to obtain the Ct value of gene amplification products, and the 2-ΔΔCt method was used for further analysis. The specific primers used for qRT-PCR were as follows: FAM50A, 5′-TCCCTCACCATCACAGCTTC-3′ (forward) and 5′-TCACTGAGCAACCGCACATC-3′ (reverse) and β-actin, 5′-GGCACCCAGCACAATGAAGA-3′ (forward) and 5′-ACTCCTGCTTGCTGATCCAC-3′ (reverse).
2.6. Western Blotting
Cells were lysed using radioimmunoprecipitation assay buffer (P0013B; Beyotime Biotechnology, Shanghai, China) containing proteinase and phosphatase inhibitors. The protein concentration of the samples was measured using a bicinchoninic acid (BCA) kit (P0010; Beyotime Biotechnology, Shanghai, China) according to the manufacturer’s protocol. Equal amounts of protein sample were separated using 10% sodium dodecyl sulfate-polyacrylamide gel electrophoresis and then transferred to a nitrocellulose membrane. Subsequently, the membrane was blocked with 5% skim milk powder for 1 h at room temperature (20-25°C) and incubated with the following primary antibodies overnight at 4°C: anti-FAM50A (Proteintech, Rosemont, IL, USA; 19849-1-AP, 1:1,000) and anti-β-tubulin (Proteintech, 10068-1-AP, 1:5,000). The membrane was then incubated with the appropriate horseradish-peroxidase-conjugated secondary antibody (Beyotime Biotechnology, A0208 and A0216, 1:5,000) for 30 min at room temperature. Finally, the bands were visualized using an enhanced chemiluminescence system and quantified using Image J software (National Institutes of Health, Bethesda, MD, USA).
2.7. CCK-8 Assay
Cells were seeded (1,000 cells per well) in a 96-well plate, with three replicate wells. Following inoculation, they were incubated overnight in a controlled environment. Subsequently, 100 μL of CCK-8 solution was added to the cells and they were incubated for 1 h at five different time points (after seeding 0 [24h], 1 [24h], 2 [72h], 3 [96h] and 4 [120h ] days). The optical density at 450 nm was then determined using a microplate reader (Thermo Fisher Scientific, Waltham, MA, USA) .
2.8. EdU Assay
Cells were cultured in six-well plates and incubated with a final concentration of 10 μM EdU for 2 h. They were then immobilized prior to Click Additive Solution buffer, DNA staining, and image acquisition as described previously .
2.9. Colony-Formation Assay
For each experimental group, 1,000 cells per well were seeded into six-well plates and cultured for 10 days with careful monitoring and regular changes of the growth medium. The resulting colonies were then stained and photographed as described previously .
2.10. Statistical Analysis
Descriptive and statistical analyses were conducted using Statistical Package for the Social Sciences (SPSS) version 22.0 (IBM; Armonk, New York, USA) or R software (v4.2.2). The Wilcoxon rank-sum test was utilized to assess the differential expression levels of FAM50A between the two groups. Correlations between FAM50A expression levels and clinicopathological characteristics were determined using Spearman’s rank correlation coefficient (Spearman’s r). Kaplan–Meier analysis was used to examine patient survival, and groups were compared utilizing the log-rank test. One-way analysis of variance was used to compare multiple groups, and the Student’s t test was used for pairwise comparisons.
3. Results
3.1. FAM50A was Highly Expressed in CRC
We first extracted FAM50A expression data for 33 tumor types from TCGA database. Analysis revealed that FAM50A was significantly overexpressed in various tumors, including bladder urothelial carcinoma, colon cancer, rectal cancer, and other common tumor types (P < 0.05, Figure 1A and 1B). Since FAM50A was highly expressed in both colon and rectal cancer, and given that CRC is our long-term research focus, this gene was selected for further detailed investigation. Subsequent analysis revealed a notable upregulation of FAM50A expression levels in CRC tumor tissue than in the adjacent normal tissue. Figure 1C depicts the results for unpaired CRC samples, while Figure 1D depicts the results for paired CRC samples. Following the observation of high FAM50A expression levels in CRC from a public database, we confirmed its expression in CRC tissue using IHC staining. A total of 145 patients with CRC were studied, comprising 67 women and 78 men. The baseline characteristics of this CRC cohort are presented in Table 1. Consistent with results of the analysis of data from TCGA database, FAM50A expression levels were higher in tumor tissue than in the adjacent normal tissue (P < 0.05, Figure 1E and 1F). Based on the above results, we conducted a series of in-depth studies of FAM50A.
3.2. FAM50A Expression was Related to Clinical Pathological Features of CRC
Subsequently, we investigated correlations between FAM50A expression levels and tumor clinical characteristics. Using ROC curve analysis, 2.9 was determined as the cut-off value for distinguishing patients with CRC revealing a high (95 patients, 65.5%) or low (50 patients, 34.5%) level of FAM50A expression. Positive correlations were observed between FAM50A expression levels and several clinical characteristics, including N stage (N0 vs. N1–N2; P < 0.001; Figure 2H), M stage (M0 vs. M1; P < 0.05; Figure 2I), and TNM stage (I–II vs. III–IV; P < 0.001; Figure 2J). No statistically significant correlations were observed between other features (all P > 0.05; Figure 2A–2G). Further results are presented in Table 1. These findings suggest that FAM50A plays a crucial role in driving tumor progression and they support the hypothesis that FAM50A may act as a proto-oncogene in CRC.
3.3. The Prognostic Value of FAM50A in CRC
Patient prognosis is an important factor in clinical practice. Kaplan–Meier survival analysis was utilized to investigate the association between FAM50A expression level and prognosis in CRC. The mean OS duration after surgery was 69.50 months (95% confidence interval [CI]: 65.24–73.75; Figure 3A). Kaplan–Meier and univariate regression analyses revealed that an advanced T stage (III–IV vs. I–II; hazard ratio [HR]: 2.015, 95% CI: 1.197–3.390; P = 0.008; Figure 3H), N stage (N1–N2 vs. N0; HR: 3.839, 95% CI: 2.181–6.757; P < 0.001; Figure 3I), M stage (M1 vs. M0; HR: 3.788, 95% CI: 2.026–7.081; P < 0.001; Figure 3J), TNM stage (I–II vs. III-IV; HR: 4.581, 95% CI: 2.602–8.065; P < 0.001; Figure 3K), and FAM50A expression level (high vs. low; HR: 2.544, 95% CI: 1.504–4.303; P < 0.001; Figure 3L) were associated with poor OS. There was no statistically significant difference in other variables (Figure 3B-3G, all P > 0.05). The corresponding risk factors are presented in Table 2. Multivariate Cox regression analysis showed that advanced M stage, advanced TNM stage, and high FAM50A expression level were independent predictors of poor OS (all P < 0.05, Table 2). These findings indicated that FAM50A may be a prognostic biomarker in predicting the survival outcome of patients with CRC.
Next, forest plots were drawn to visually illustrate the prognostic impact of FAM50A. These revealed a significant association between high FAM50A expression levels and the poor survival of patients with CRC (Figure 4A and 4B, Table 2). Nomograms can employ multiple indicators to simultaneously diagnose or predict the onset or progression of disease . In the present study, a nomogram was constructed to display the prognostic ability of FAM50A levels in patients with CRC. Candidate prognostic variables were assessed using a proportional hazard plot. This revealed that T, N, M, and TNM stage, as well as FAM50A expression level, all fitted the inclusion criteria (Figure 5A–5E). A nomogram was subsequently constructed using these five variables and subsequently assessed using a calibration curve. A high level of FAM50A expression was associated with higher scores and with a decreased probability of patient survival (Figure 5F). The calibration curve also indicated that the nomogram was well-constructed, since the predicted values were in good agreement with the actual values (Figure 5G).
3.4. Construction of Cell Lines with Stable FAM50A Expression
Continuous proliferation signals and the evasion of growth inhibition are characteristic phenotypes of tumor cells. We, therefore, investigated the potential role of FAM50A in promoting tumor cell proliferation. The gene expression level of FAM50A was first analyzed in four CRC cell lines (SW480, HCT-8, HCT-116, and RKO) and in normal intestinal epithelial cells (FHC). Results from RT-qPCR and western blotting analyses revealed higher FAM50A expression levels in tumor cell lines than normal FHC cells, at both the mRNA (Figure 6A, upper panel) and protein levels (Figure 6A, lower panel). The SW480 and HCT-8 cell lines were used to construct knockdown cell lines as they revealed the highest expression levels. Furthermore, the expression level of FAM50A in RKO cells was relatively lower and therefore, these cells were used for overexpression. Cells were first transfected with lentivirus, followed by drug screening to obtain cells with stable knockdown or overexpression . The efficiencies of knockdown and overexpression were verified at the mRNA and protein level in both SW480 (Figure 6B), HCT-8 (Figure 6C), and RKO (Figure 7A) cells. These stably expressing cells were then used in experiments to study the cell phenotype, as described below.
3.5. FAM50A Promoted CRC Cell Proliferation
The efficiencies of knockdown were verified at the mRNA and protein level in SW480 (Figure 6B), and HCT-8 (Figure 6C) cells. These stably expressing cells were then used in experiments to study the cell phenotype, as described below. The proliferation of CRC cells was evaluated using the CCK-8 method. Knockdown of FAM50A significantly reduced the proliferation of SW480 (Figure 6D) and HCT-8 (Figure 6E) cells. EdU staining was used to evaluate the effect of FAM50A knockdown on cell proliferation ability. Knockdown of FAM50A significantly reduced the proportion of EdU-positive FAM50A-sh-1 and FAM50A-sh-2 cells (Figure 6F). In addition, the number of cell clones was greatly reduced in cells with low FAM50A expression levels (Figure 6G). Moreover, overexpression of FAM50A was verified (Figure 7A), and significantly enhanced the proliferation ability of the RKO cell line (Figure 7B). The results of the EdU staining and colony-formation experiments demonstrated that overexpression of FAM50A significantly increased the number of EdU-positive cells (Figure 7C) and the extent of colony formation (Figure 7D). Overall, these results confirmed the role of FAM50A in cell proliferation.
3.6. FAM50A Expression in CRC was Highly Correlated with the Levels of Numerous other Genes
To investigate the mechanism by which FAM50A is involved in tumor progression, TCGA database was utilized to identify molecules that could potentially interact with FAM50A. The correlation coefficients for gene expression levels were calculated individually, with the cut-off value being < -0.4 for a negative correlation coefficient, and > 0.6 for a positive correlation coefficient. Twenty-one candidate genes were identified, and a co-expression heatmap of these genes was generated based on the level of FAM50A expression. The co-expression heatmap revealed a negative correlation between the expression level of FAM50A and those of RO60, CDC42SE2, and NRIP1, whereas the expression levels of all remaining genes revealed positive correlations with the expression level of FAM50A (Figure 8A). The correlation heatmap was redrawn, revealing that three genes with a negative correlation and 18 genes with a positive correlation were closely linked to the regulation of FAM50A (Figure 8B). Subsequently, correlation graphs between the expression levels of 21 genes and FAM50A were individually generated and analyzed. The results for the three genes with negative correlations were as follows: RO60 (r = -0.431, P < 0.001, Figure 8C), CDC42SE2 (r = -0.408, P < 0.001, Figure 8D), and NRIP1 (r = -0.404, P < 0.001, Figure 8E). The results for the 18 genes with positive correlation coefficients are depicted in Figure 8F–W (P < 0.001). These findings suggested that FAM50A may be involved in the malignant progression of CRC through interactions with the abovementioned gene products.
4. Discussion
Ongoing research in CRC has demonstrated that for effective diagnosis and treatment, potential targets must exhibit significant differential expression at the mRNA or protein level between tumor and corresponding normal tissue. Additionally, the target should demonstrate specific functional effects in terms of promoting or suppressing tumor growth . We observed that the FAM50A expression level was significantly elevated in tumor tissues compared to adjacent normal tissues, suggesting that it may serve as a potential biomarker in CRC. The clinical significance of genes such as p53, C-myc, Ras, EGFR, PMS1, PMS2, COX-2, CD44, PD-1, PD-L1, and CTLA4 in cancer has been extensively investigated. This includes the study of inactivated tumor suppressor genes (p53), activated proto-oncogenes (C-myc, Ras, and EGFR), mismatch repair genes (PMS1 and PMS2), modifying genes (COX-2 and CD44), and immune-related genes (PD-1, PD-L1, and CTLA4). These genes play crucial roles in genetic diagnosis, prognostic assessment, immunotherapy, and targeted therapy [38,39,40,41,42]. The results of the current study revealed significant correlations between FAM50A expression levels and the clinical features of N, M, and TNM stage, which is consistent with the results of a related study . Together, they suggest that FAM50A may be a valuable prognostic marker for clinical use. Multivariate Cox regression analysis demonstrated that the FAM50A expression level was an independent prognostic factor in CRC.
There is limited research on FAM50A, and its function has yet to be fully elucidated. The expression level of FAM50A varies across different tissues and tumors in the human body, as revealed by pan-cancer analysis of public databases. This variability may be attributed to tissue specificity, the involvement of diverse signaling regulatory mechanisms, and distinct epigenetic modifications . The results for FAM50A expression in the TCGA database were validated by IHC, thus highlighting its potential oncogenic activity. To further investigate its potential role as an oncogene, we constructed HCT-8 and SW480 cell lines with reduced FAM50A expression levels and confirmed the efficacy of knockdown using qRT-PCR and western blotting methods. Given the importance of tumor cell proliferation , our initial focus was to examine the effect of FAM50A on the proliferation of malignant CRC cells. CCK-8, EdU, and colony-forming assays were performed to study the effects of FAM50A knockdown, with the results consistently demonstrating decreased cell proliferation.
The mechanism of action of FAM50A in tumor cell proliferation was subsequently explored using co-expression heat mapping and correlation analysis. A total of 21 genes with expression levels revealing high correlations with FAM50A expression levels were included in the analysis. RO60 is associated with inflammatory diseases , and thus FAM50A may play a role in the progression of CRC by influencing specific inflammatory factors. NRIP1 is associated with the cAMP signaling pathway and facilitates the progression of lung cancer . It may, therefore, have a similar impact on the progression of CRC. IRAK1 mediates the down-regulation of AKR1B10 in lung cancer, and hence FAM50A may also regulate AKR1B10 through IRAK1 in CRC. OTUD5 is involved in the progression of numerous tumor types. For examples, it promotes the growth of hepatocellular carcinoma by stabilizing SLC38A1 . Therefore, OTUD5 may play an important role in the development of CRC. NSDHL is involved in regulating the activity of EGFR, thereby enhancing tumor growth and can possibly interact with FAM50A in CRC. Elevated expression levels of LAGE3 in CRC have been associated with poor prognosis and immune infiltration . FAM50A may, therefore, regulate LAGE3 expression in CRC. A previous study reported that UBL4A inhibited autophagy and increased the proliferation of pancreatic ductal adenocarcinoma cells by targeting LAMP1 . Based on this earlier study and the present results, we hypothesize that FAM50A may play a role in CRC by targeting LAMP1. Other genes that were closely associated with FAM50A in the present study have been implicated in tumorigenesis in previous reports [53,54].
While our findings demonstrated the prognostic value of FAM50A in CRC and a possible role in promoting tumor cell proliferation, several issues warrant further exploration. First, the limited sample size and pathology information of our CRC patient cohort may have affected the reliability and generalizability of our results. Samples with relevant patient information will be collected for analysis in future research endeavors. Additionally, the cell lines used for in vitro studies may not replicate the intricate and diverse nature of human CRC because of the lack of appropriate immune and physiological environments. Therefore, we will consider incorporating further in vitro testing in more comprehensive investigations in future studies. Financial constraints also restricted the scale of the experiments, the number of replicates, and the use of more sophisticated techniques. If various factors, such as funding and time, permit, our team Further in vivo research will conduct more experiments in vivo, which could may provide more precise results and conclusions. ImportantlyNotably, the specific mechanism involving whereby FAM50A in contributed to CRC progression has not been fully elucidated and requires more in-depth study.
In summary, our results show revealed that FAM50A may be a novel biomarker for CRC prognosis; and moreover, FAM50A may participate be involved in regulating tumor progression by interacting with some certain highly correlated molecules to that drive CRC cell proliferation.
5. Data Accessibility
All data are available from the authors for reasonable purposes and means.
Author contributions: Conceptualization, Longhai Li, Jizhao Shuai, Guangyun Li, Hao Gu and Yan Sun; Data curation, Hao Gu; Investigation, Jizhao Shuai; Methodology, Longhai Li; Resources, Jizhao Shuai; Software, Yan Sun; Supervision, Yan Sun; Writing-original draft, Yan Sun; Writing-review & editing, Longhai Li.
Declaration of competing interest: All authors declared that there were no financial interests or personal relationships that could influence the work reported in this paper.
Funding
This research was supported by the Bozhou Key R&D projects (No. bzzc2021020).
References
- Wang, R.; Li, J.; Zhou, X.; Mao, Y.; Wang, W.; Gao, S.; et al. Single-cell genomic and transcriptomic landscapes of primary and metastatic colorectal cancer tumors. Genome medicine 2022, 14, 93. [Google Scholar] [CrossRef] [PubMed]
- Sung, H.; Ferlay, J.; Siegel, R.L.; Laversanne, M.; Soerjomataram, I.; Jemal, A.; et al. Global burden of colorectal cancer in 2020 and 2040: incidence and mortality estimates from GLOBOCAN. Gut. 2023, 72, 338–344. [Google Scholar]
- Baidoun, F.; Elshiwy, K.; Elkeraie, Y.; Merjaneh, Z.; Khoudari, G.; Sarmini, M.T.; et al. Colorectal Cancer Epidemiology: Recent Trends and Impact on Outcomes. Current drug targets. 2021, 22, 998–1009. [Google Scholar] [PubMed]
- Rad, A.H.; Aghebati-Maleki, L.; Kafil, H.S.; Abbasi, A. Molecular mechanisms of postbiotics in colorectal cancer prevention and treatment. Critical reviews in food science and nutrition. 2021, 61, 1787–1803. [Google Scholar] [CrossRef]
- Wong, M.C.; Huang, J.J.; Lok, V.; Wang, J.X.; Fung, F.; Ding, H.Y. Differences in Incidence and Mortality Trends of Colorectal Cancer Worldwide Based on Sex, Age, and Anatomic Location. Clinical gastroenterology and hepatology. 2021, 19, 955–966. [Google Scholar] [CrossRef]
- Wang, Q.Y.; Shen, X.F.; Chen, G.; Du, J.F. Drug Resistance in Colorectal Cancer: From Mechanism to Clinic. Cancers. 2022, 14, 2928. [Google Scholar] [CrossRef]
- Xia, J.; Ma, N.; Shi, Q.; Liu, Q.C.; Zhang, W.; Cao, H.J.; et al. XAF1 promotes colorectal cancer metastasis via VCP-RNF114-JUP axis. The Journal of cell biology. 2024, 223, e202303015. [Google Scholar] [CrossRef]
- Sarfaty, E.; Khajoueinejad, N.; Yu, A.T.; Hiotis, S.; Golas, B.J.; Sarpe, U.; et al. Actual 5-Year Survival After Cytoreductive Surgery and Hyperthermic Intraperitoneal Chemotherapy for Patients with Peritoneal Carcinomatosis of Colorectal Origin. Annals of surgical oncology 2024, 31, 1970–1979. [Google Scholar] [CrossRef]
- Albadari, N.; Xie, Y.; Li, W. Deciphering treatment resistance in metastatic colorectal cancer: roles of drug transports, EGFR mutations, and HGF/c-MET signaling. Frontiers in pharmacology. 2024, 14, 1340401. [Google Scholar] [CrossRef]
- Huang, X.; Ke, K.; Jin, W.; Zhu, Q.; Zhu, Q.; Mei, R.; et al. Identification of Genes Related to 5-Fluorouracil Based Chemotherapy for Colorectal Cancer. Frontiers in immunology. 13 (2022) 887048. [CrossRef]
- Wang, Z.; Hu, J.; Chen, J.; Zhang, J.; Li, W.; Tian, Y.; et al. ICAT promotes colorectal cancer metastasis via binding to JUP and activating the NF-κB signaling pathway, J Clin Lab Anal. 2022, 36, e24678.
- Chen, J.W.; Liu, X.Y.; Zou, Y.; Gong, J.L.; Ge, Z.H.; Lin, X.L.; et al. A high-fat diet promotes cancer progression by inducing gut microbiota-mediated leucine production and PMN-MDSC differentiation. Proceedings of the National Academy of Sciences of the United States of America. 2024, 121, e2306776121. [Google Scholar] [CrossRef] [PubMed]
- Shad, A.N.; Fanoodi, A.; Maharati, A.; Akhlaghipour, I.; Bina, A.R.; Saburi, E.; et al. Role of microRNAs in tumor progression by regulation of kinesin motor proteins. International journal of biological macromolecules. 2024, 270 Pt 1, 132347. [Google Scholar]
- Douglas, H.; Weinberg, R.A. Hallmarks of cancer: the next generation. Cell. 2011, 144, 646–674. [Google Scholar]
- Cram, J.P.; Wu, J.Q.; Coover, R.A.; Rizvi, T.A.; Chaney, K.E.; Ravindran, R.; et al. P2RY14 cAMP signaling regulates Schwann cell precursor self-renewal, proliferation, and nerve tumor initiation in a mouse model of neurofibromatosis. ELife. 2022, 11, e73511. [Google Scholar] [CrossRef] [PubMed]
- Cheng, Q.; Shi, X.L.; Li, Q.L.; Wang, L.; Wang, Z. Current Advances on Nanomaterials Interfering with Lactate Metabolism for Tumor Therapy. Advanced science (Weinheim). 2024, 11, e2305662. [Google Scholar] [CrossRef] [PubMed]
- Chi, H.; Gao, X.R.; Xia, Z.J.; Yu, W.Y.; Yin, X.S.; Pan, Y.F.; et al. FAM family gene prediction model reveals heterogeneity, stemness and immune microenvironment of UCEC. Frontiers in molecular biosciences. 10 (2023) 1200335. [CrossRef]
- Gong, B.; Liang, L.; Zhang, Q.; Li, H.; Xiao, J.L.; Wang, L.; et al. Epigenetic and transcriptional activation of the secretory kinase FAM20C as an oncogene in glioma. Journal of genetics and genomics. 2023, 50, 422–433. [Google Scholar] [CrossRef]
- Suchanek, I.Z.; Podralska, M.; Żurawek, M.; Łaczmańska, J.; Iżykowska, K.; Krawczyk, A.D.; et al. Hypoxia-Induced FAM13A Regulates the Proliferation and Metastasis of Non-Small Cell Lung Cancer Cells. International journal of molecular sciences. 2021, 22, 4302. [Google Scholar] [CrossRef]
- Xie, X.D.; Li, L.; Tao, S.; Chen, M.S.; Fei, L.; Yang, Q.L.; et al. Proto-Oncogene FAM50A Can Regulate the Immune Microenvironment and Development of Hepatocellular Carcinoma In Vitro and In Vivo. International journal of molecular sciences. 2023, 24, 3217. [Google Scholar] [CrossRef]
- Jackson, A.P.; Goyard, S.; Xia, D.; Foth, B.J.; Sanders, M.; Wastling, J.M.; et al. Global Gene Expression Profiling through the Complete Life Cycle of Trypanosoma vivax. PLoS neglected tropical diseases. 2015, 9, e0003975. [Google Scholar] [CrossRef]
- Lee, L.Y.; Khan, K.; Uhas, K.A.; Srikanth, S.; Thompson, N.A.; Pardo, M.; et al. Mutations in FAM50A suggest that Armfield XLID syndrome is a spliceosomopathy. Nature communications. 2020, 11, 3698. [Google Scholar] [CrossRef] [PubMed]
- Yang, W.; Liu, Z.D.; Liu, T. Pan-cancer analysis predicts CANT1 as a potential prognostic, immunologic biomarker. Cellular signalling. 2024, 117, 111107. [Google Scholar] [CrossRef] [PubMed]
- Cai, X.T.; Lin, J.; Liu, L.; Zheng, J.F.; Liu, Q.Y.; Ji, L.Y.; et al. A novel TCGA-validated programmed cell-death-related signature of ovarian cancer. BMC cancer. 2023, 24, 515. [Google Scholar] [CrossRef] [PubMed]
- Ussing, J.T.; Jensen, C.; Nissen, N.I.; Cox, T.R.; Kalluri, R.; Karsdal, M.; et al. The collagen landscape in cancer: profiling collagens in tumors and in circulation reveals novel markers of cancer-associated fibroblast subtypes. The Journal of pathology. 2024, 262, 22–36. [Google Scholar] [CrossRef] [PubMed]
- Stelloo, E.; Jansen, A.M.; Osse, E.M.; Nout, R.A.; Creutzberg, C.L.; Ruano, D.; et al. Practical guidance for mismatch repair-deficiency testing in endometrial cancer. Annals of oncology: official journal of the European Society for Medical Oncology. 2017, 28, 96–102. [Google Scholar] [CrossRef]
- Farhat, E.B.; Adib, E.; Daou, M.; Naqash, A.R.; Matulonis, U.; Ng, K.; et al. Benchmarking mismatch repair testing for patients with cancer receiving immunotherapy. Cancer cell. 2024, 42, 6–7. [Google Scholar] [CrossRef]
- Li, L.H.; Jiang, K.; Li, D.P.; Li, D.X.; Fan, Z.T.; Dai, G.S.; et al. The Chemokine CXCL7 Is Related to Angiogenesis and Associated With Poor Prognosis in Colorectal Cancer Patients. Front Oncol. 2023, 11, e754221. [Google Scholar] [CrossRef]
- Zhang, W.; Ji, L.C.; Wang, X.J.; Zhu, S.B.; Luo, J.C.; Zhang, Y.; et al. Nomogram Predicts Risk and Prognostic Factors for Bone Metastasis of Pancreatic Cancer: A Population-Based Analysis. Frontiers in endocrinology. 2022, 12, 752176. [Google Scholar] [CrossRef]
- Lv, T.; Zhang, B.; Jiang, C.; Zeng, Q.; Yang, J.; Zhou, Y. USP35 promotes hepatocellular carcinoma progression by protecting PKM2 from ubiquitination-mediated degradation. Int J Oncol. 2023, 63, 113. [Google Scholar] [CrossRef]
- Shi, Z.; Su, Y.; Wang, F.; Liu, P. Downregulation of microRNA-181a attenuates hydrogen peroxide-induced human lens epithelial cell apoptosis in vitro. Molecular medicine reports. 2018, 17, 6009–6015. [Google Scholar] [CrossRef]
- Sheng, Z.H.; Cao, X.; Deng, Y.N.; Zhao, X.Y.; Liang, S.F.; et al. SUMOylation of AnxA6 facilitates EGFR-PKCα complex formation to suppress epithelial cancer growth. Cell communication and signaling. 2023, 21, 189. [Google Scholar] [CrossRef] [PubMed]
- Sun, H.; Wang, X.; Ma, L.; Li, X.; Jin, W.; Yang, Y. CNPY2 governs PDGF-BB-treated vascular smooth muscle cell proliferation, migration and phenotypic transformation via the Akt/mTOR/GSK-3β signaling pathway. Exp Ther Med. 2024, 27, 197. [Google Scholar] [CrossRef] [PubMed]
- Chen, J.; Chen, T.; Zhu, Y.; Li, Y.; Zhang, Y.; Wang, Y.; et al. circPTN sponges miR-145-5p/miR-330-5p to promote proliferation and stemness in glioma. J Exp Clin Cancer Res. 2019, 38, 398. [Google Scholar] [CrossRef] [PubMed]
- Liu, X.; Gao, Z.; Wang, X.; Shen, Y. Parthenolide targets NF-κB (P50) to inhibit HIF-1α-mediated metabolic reprogramming of HCC. Aging (Albany NY). 2022, 14, 8346–8356. [Google Scholar] [CrossRef]
- Liu, R.J.; Liu, R.L.; Guo, Z.Y.; Ren, J.H.; Huang, J.; Luo, Q.Q.; et al. shRNA-mediated knockdown of KNTC1 inhibits non-small-cell lung cancer through regulating PSMB8. Cell death & disease. 2022, 13, 685. [Google Scholar]
- Chen, Z.Z.; Li, Y.D.; He, K.; Yang, J.G.; Deng, Q.C.; Chen, Y.J.; et al. CircGPRC5A enhances colorectal cancer progress by stabilizing PPP1CA and inducing YAP dephosphorylation. Journal of experimental & clinical cancer research. 2023, 42, 334. [Google Scholar]
- Zong, Z.; Xie, F.; Wang, S.; Wu, X.J.; Zhang, Z.Y.; Yang, B.; et al. Alanyl-tRNA synthetase, AARS1, is a lactate sensor and lactyltransferase that lactylates p53 and contributes to tumorigenesis. Cell. 2024, 187, 2375–2392. [Google Scholar] [CrossRef]
- Wang, R.T.; Xu, K.; Chen, Q.; Hu, Q.; Zhang, J.; Guan, X.X. Cuproptosis engages in c-Myc-mediated breast cancer stemness. Journal of translational medicine. 2023, 21, 409. [Google Scholar] [CrossRef]
- Isik, E.; Shukla, K.; Pospisilova, M.; König, C.; Andrs, M.; Rao, S.; et al. MutSβ-MutLβ-FANCJ axis mediates the restart of DNA replication after fork stalling at cotranscriptional G4/R-loops. Science advances. 2024, 10, eadk2685. [Google Scholar] [CrossRef]
- Rodrigues, P.; Bangali, H.; Hammoud, A.; Mustafa, Y.F.; AlHetty, H.R.; Alkhafaji, A.T.; et al. COX2-inhibitors; a thorough and updated survey into combinational therapies in cancers. Medical oncology. 2024, 41, 41. [Google Scholar] [CrossRef]
- Lin, K.X.; Istl, A.C.; Quan, D.; Skaro, A.; Tang, E.; Zheng, X.F. PD-1 and PD-L1 inhibitors in cold colorectal cancer: challenges and strategies. Cancer immunology, immunotherapy. 2022, 72, 3875–3893. [Google Scholar] [CrossRef] [PubMed]
- Wang, Y.; Chen, L.; Chen, J.; Bai, Z.Z.; Cao, L.Y. Comprehensive analysis of transcriptome data and experimental identification show that solute carrier 35 member A2 (SLC35A2) is a prognostic marker of colorectal cancer. Aging. 2023, 15, 11554–11570. [Google Scholar] [CrossRef] [PubMed]
- Zhang, F.F.; Zhang, X.; Zhang, H.K.; Lin, D.D.; Fan, H.L.; Guo, S.C.; et al. Pan-precancer and cancer DNA methylation profiles revealed significant tissue specificity of interrupted biological processes in tumorigenesis. Epigenetics. 2023, 18, 2231222. [Google Scholar] [CrossRef] [PubMed]
- Sorrenti, V.; Buriani, A.; Fortinguerra, S.; Davinelli, S.; Scapagnini, G.; Cassidy, A.; et al. Cell Survival, Death, and Proliferation in Senescent and Cancer Cells: the Role of (Poly) phenols. Advances in nutrition. 2023, 14, 1111–1130. [Google Scholar] [CrossRef]
- Mazeda, C.; Oliveira, N.; Abreu, C.; Fraga, V.; Maduro, I.; Saraiva, A.; et al. Anti-SSA Ro52 and anti-Ro60 autoantibodies: association with clinical phenotypes, Clinical and experimental rheumatology. Online ahead of print.
- Tsagkaraki, E.; Guilherme, A.; Nicoloro, S.M.; Kelly, M.; Lifshitz, L.M.; Wang, H.; et al. Crosstalk between corepressor NRIP1 and cAMP signaling on adipocyte thermogenic programming. Molecular metabolism. 2023, 76, 101780. [Google Scholar] [CrossRef]
- Watanabe, F.; Sato, S.; Hirose, T.; Endo, M.; Endo, A.; Ito, H.; et al. NRIP1 regulates cell proliferation in lung adenocarcinoma cells. Journal of biochemistry. 2024, 175, 323–333. [Google Scholar] [CrossRef]
- Yang, Y.G.; Jia, S.Y.; Zhu, N.; Xiao, X.L.; Ma, Y.; Tu, K.S.; et al. OTUD5 promotes the growth of hepatocellular carcinoma by deubiquitinating and stabilizing SLC38A1. Biology direct. 2024, 19, 31. [Google Scholar] [CrossRef]
- Kim, D.G.; Cho, S.; Lee, K.Y.; Cheon, S.H.; Yoon, H.J.; Lee, J.Y.; et al. Crystal structures of human NSDHL and development of its novel inhibitor with the potential to suppress EGFR activity. Cellular and molecular life sciences: CMLS. 2021, 78, 207–225. [Google Scholar] [CrossRef]
- Dong, X.B.; Lv, S.H.; Zhang, X.H.; Hao, R.T. Upregulation of LAGE3 correlates with prognosis and immune infiltrates in colorectal cancer: A bioinformatic analysis. International immunopharmacology. 2021, 85, 106599. [Google Scholar] [CrossRef]
- Chen, H.Z.; Li, L.; Hu, J.S.; Zhao, Z.J.; Ji, L.; Cheng, C.D.; et al. UBL4A inhibits autophagy-mediated proliferation and metastasis of pancreatic ductal adenocarcinoma via targeting LAMP1. Journal of experimental & clinical cancer research. 2019, 38, 97. [Google Scholar]
- Zhang, S.J.; Wang, Y.; Zhang, X.D.; Wang, M.; Wu, H.; Tao, Y.W.; et al. ATP6AP1 as a potential prognostic biomarker in CRC by comprehensive analysis and verification. Scientific reports. 2024, 14, 4018. [Google Scholar] [CrossRef]
- Xie, X.; Lin, H.J.; Zhang, X.L.; Song, P.T.; He, X.Y.; Zhong, J.; et al. Overexpression of GDP dissociation inhibitor 1 gene associates with the invasiveness and poor outcomes of colorectal cancer. Bioengineered. 2021, 12, 5595–5606. [Google Scholar] [CrossRef]
Figure 1.
High expression of FAM50A in CRC. (A) Panoramic analysis of FAM50A gene expression in tumors and normal tissues (unpaired) from the TCGA database. (B) Panoramic analysis of FAM50A gene expression in tumors and corresponding normal tissues (paired). (C) Expression of FAM50A in tumor tissues and normal tissues (unpaired). (D) Expression of FAM50A in paired tumor and normal tissues. (E) IHC showed high expression of FAM50A in CRC tumor cells (upper panel: 40X; lower panel: 200X). (F) Normal cells showed only weak staining for FAM50A (upper panel: 40X; lower panel: 200X). * P ≤ 0.05, ** P ≤ 0.01, *** P ≤ 0.001, ns: not significant.
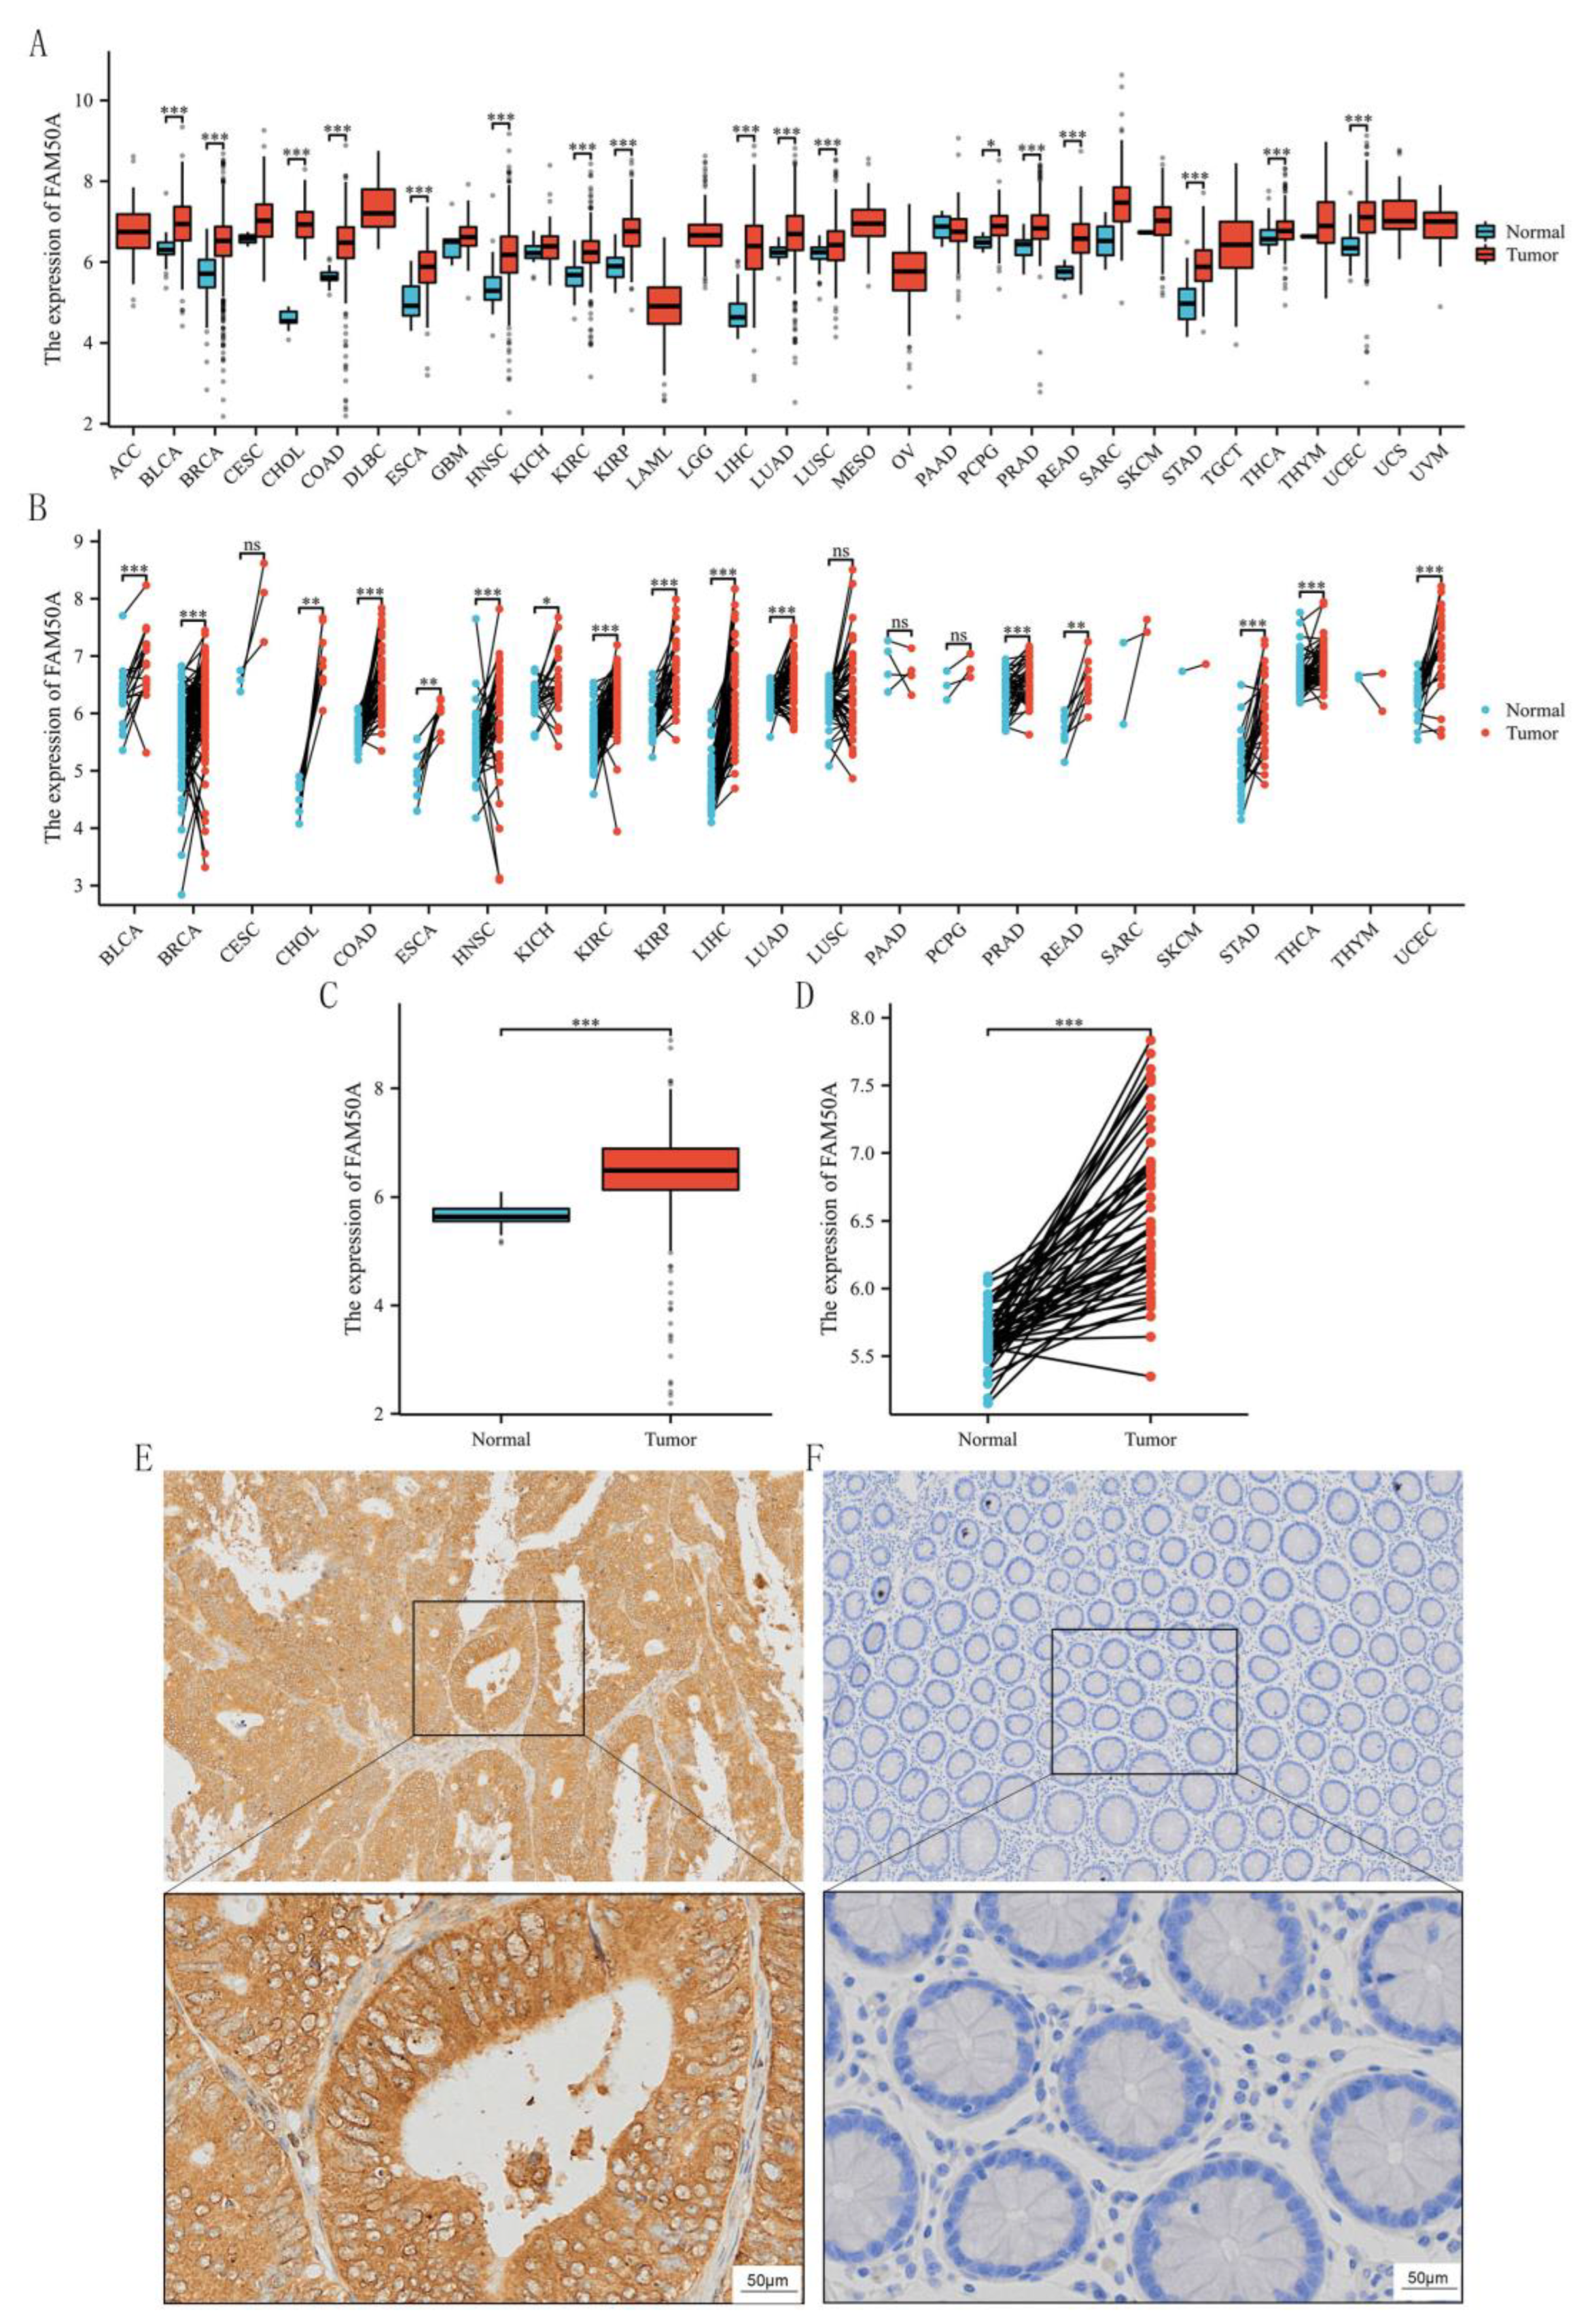
Figure 2.
Correlation of FAM50A expression with clinical and pathological features of CRC. (A) Expression of FAM50A in male and female CRC patients. (B) Expression of FAM50A in different CRC patient age groups. (C) Expression of FAM50A in relation to tumor size. (D) Expression of FAM50A in relation to tumor location. (E) FAM50A expression in relation to cancer site. (F) FAM50A expression in relation to histological differentiation (M, moderate differentiation; P, poor differentiation). (G) FAM50A expression in relation to the depth of tumor invasion. (H) FAM50A expression according to lymph node metastasis. (I) FAM50A expression according to the presence of distant metastasis. (J) FAM50A expression according to TNM stage. * P ≤ 0.05, ** P ≤ 0.01, *** P ≤ 0.001, ns: not significant.
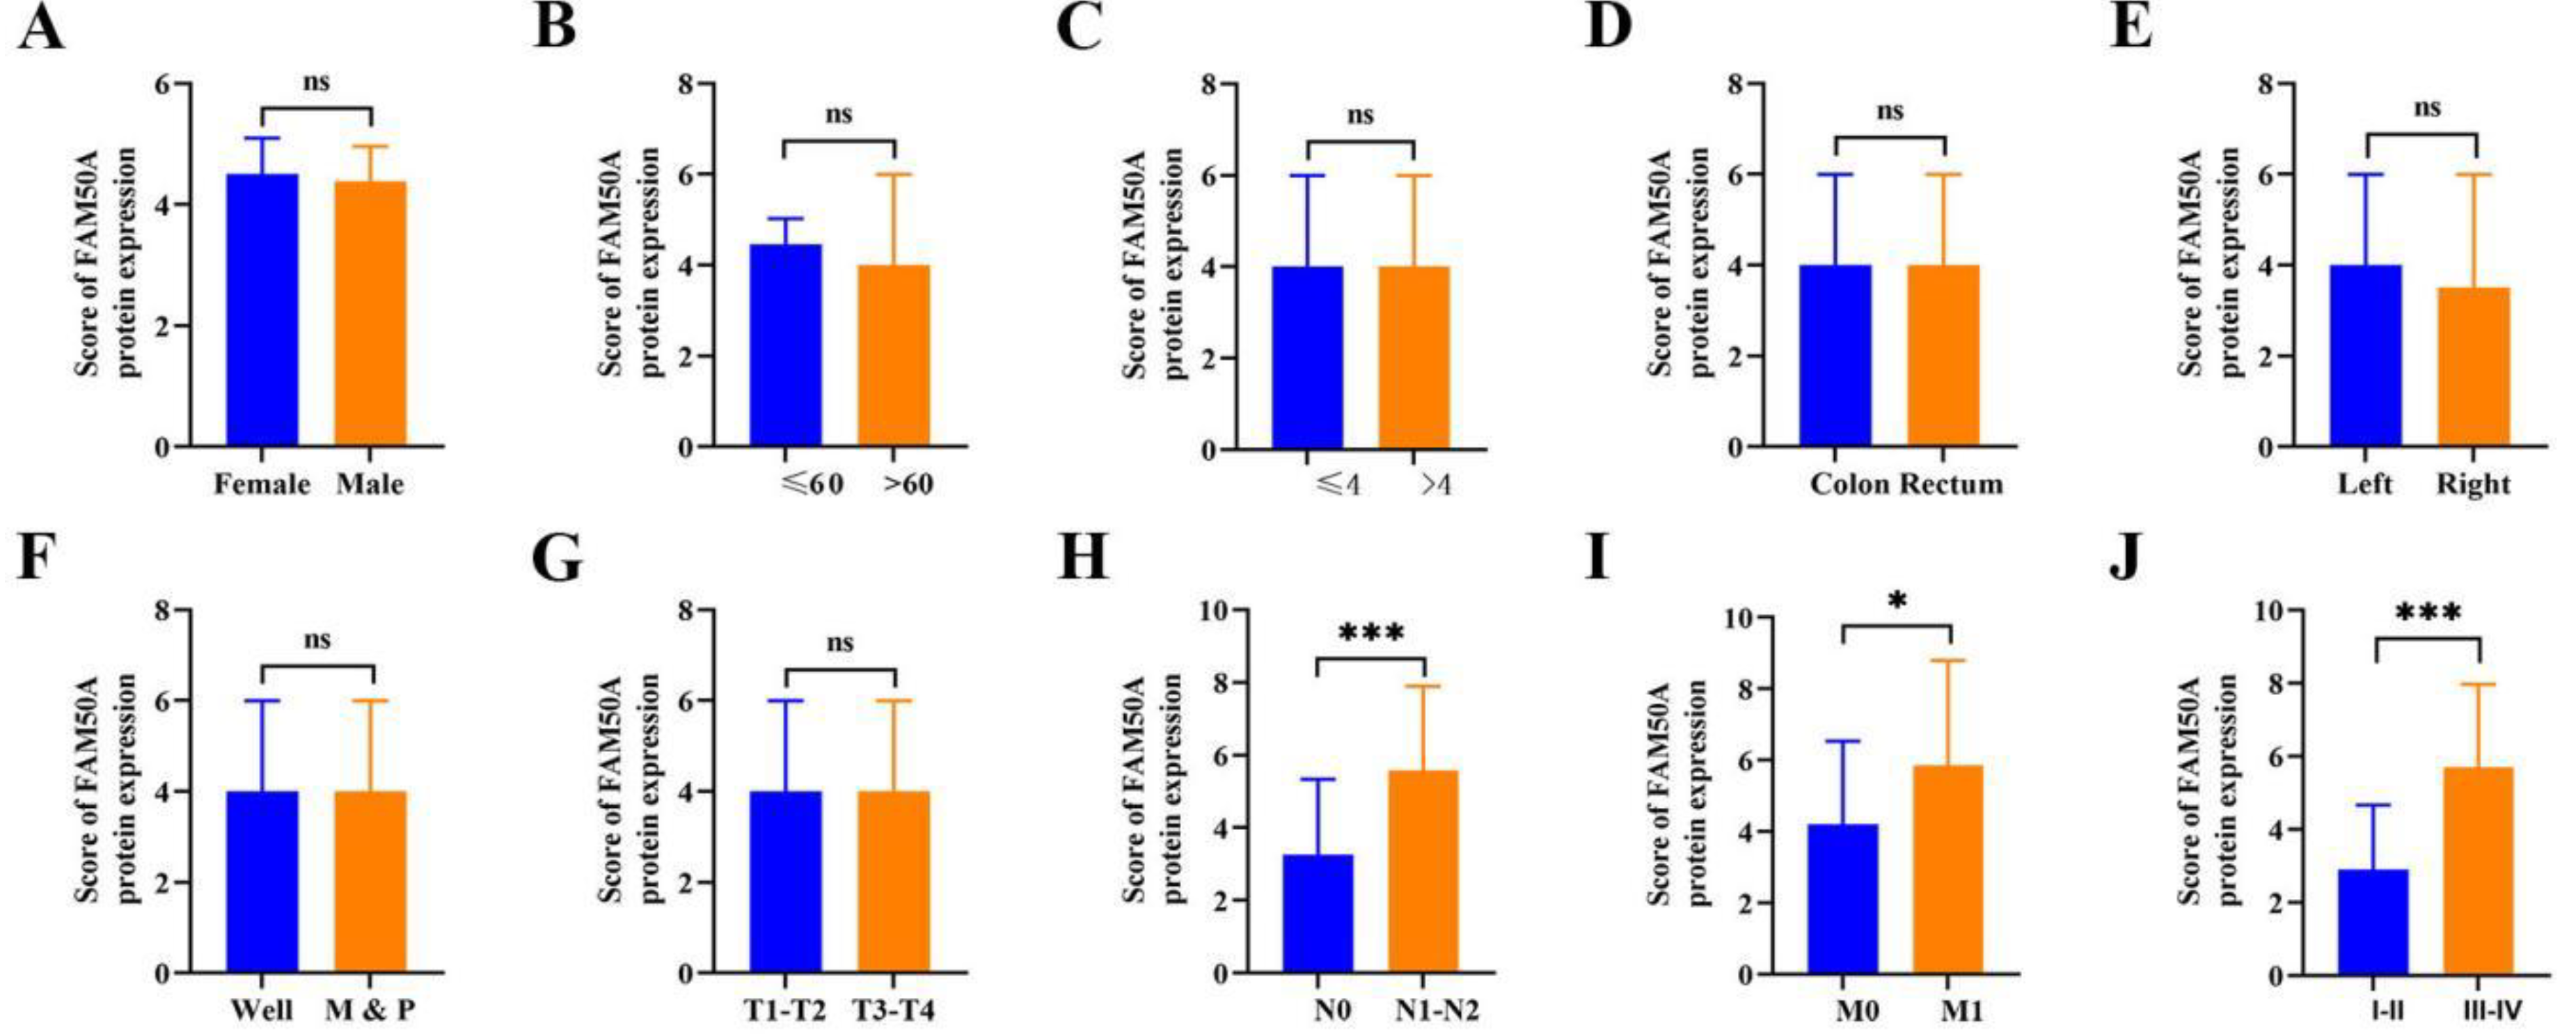
Figure 3.
Cox regression analysis in CRC. (A) Overall survival rate in CRC patients (n=145). (B) OS in female and male groups. (C) OS in different age groups. (D) OS related to tumor size. (E) OS related to tumor location. (F) OS of ddifferent cancer site. (G) OS interrelated with differentiation. (H-K) OS in T, N, M and TNM stages. (L) OS in FAM50A high and low groups. *P ≤ 0.05, **P ≤ 0.01, ***P ≤ 0.001 and ns: no significance.
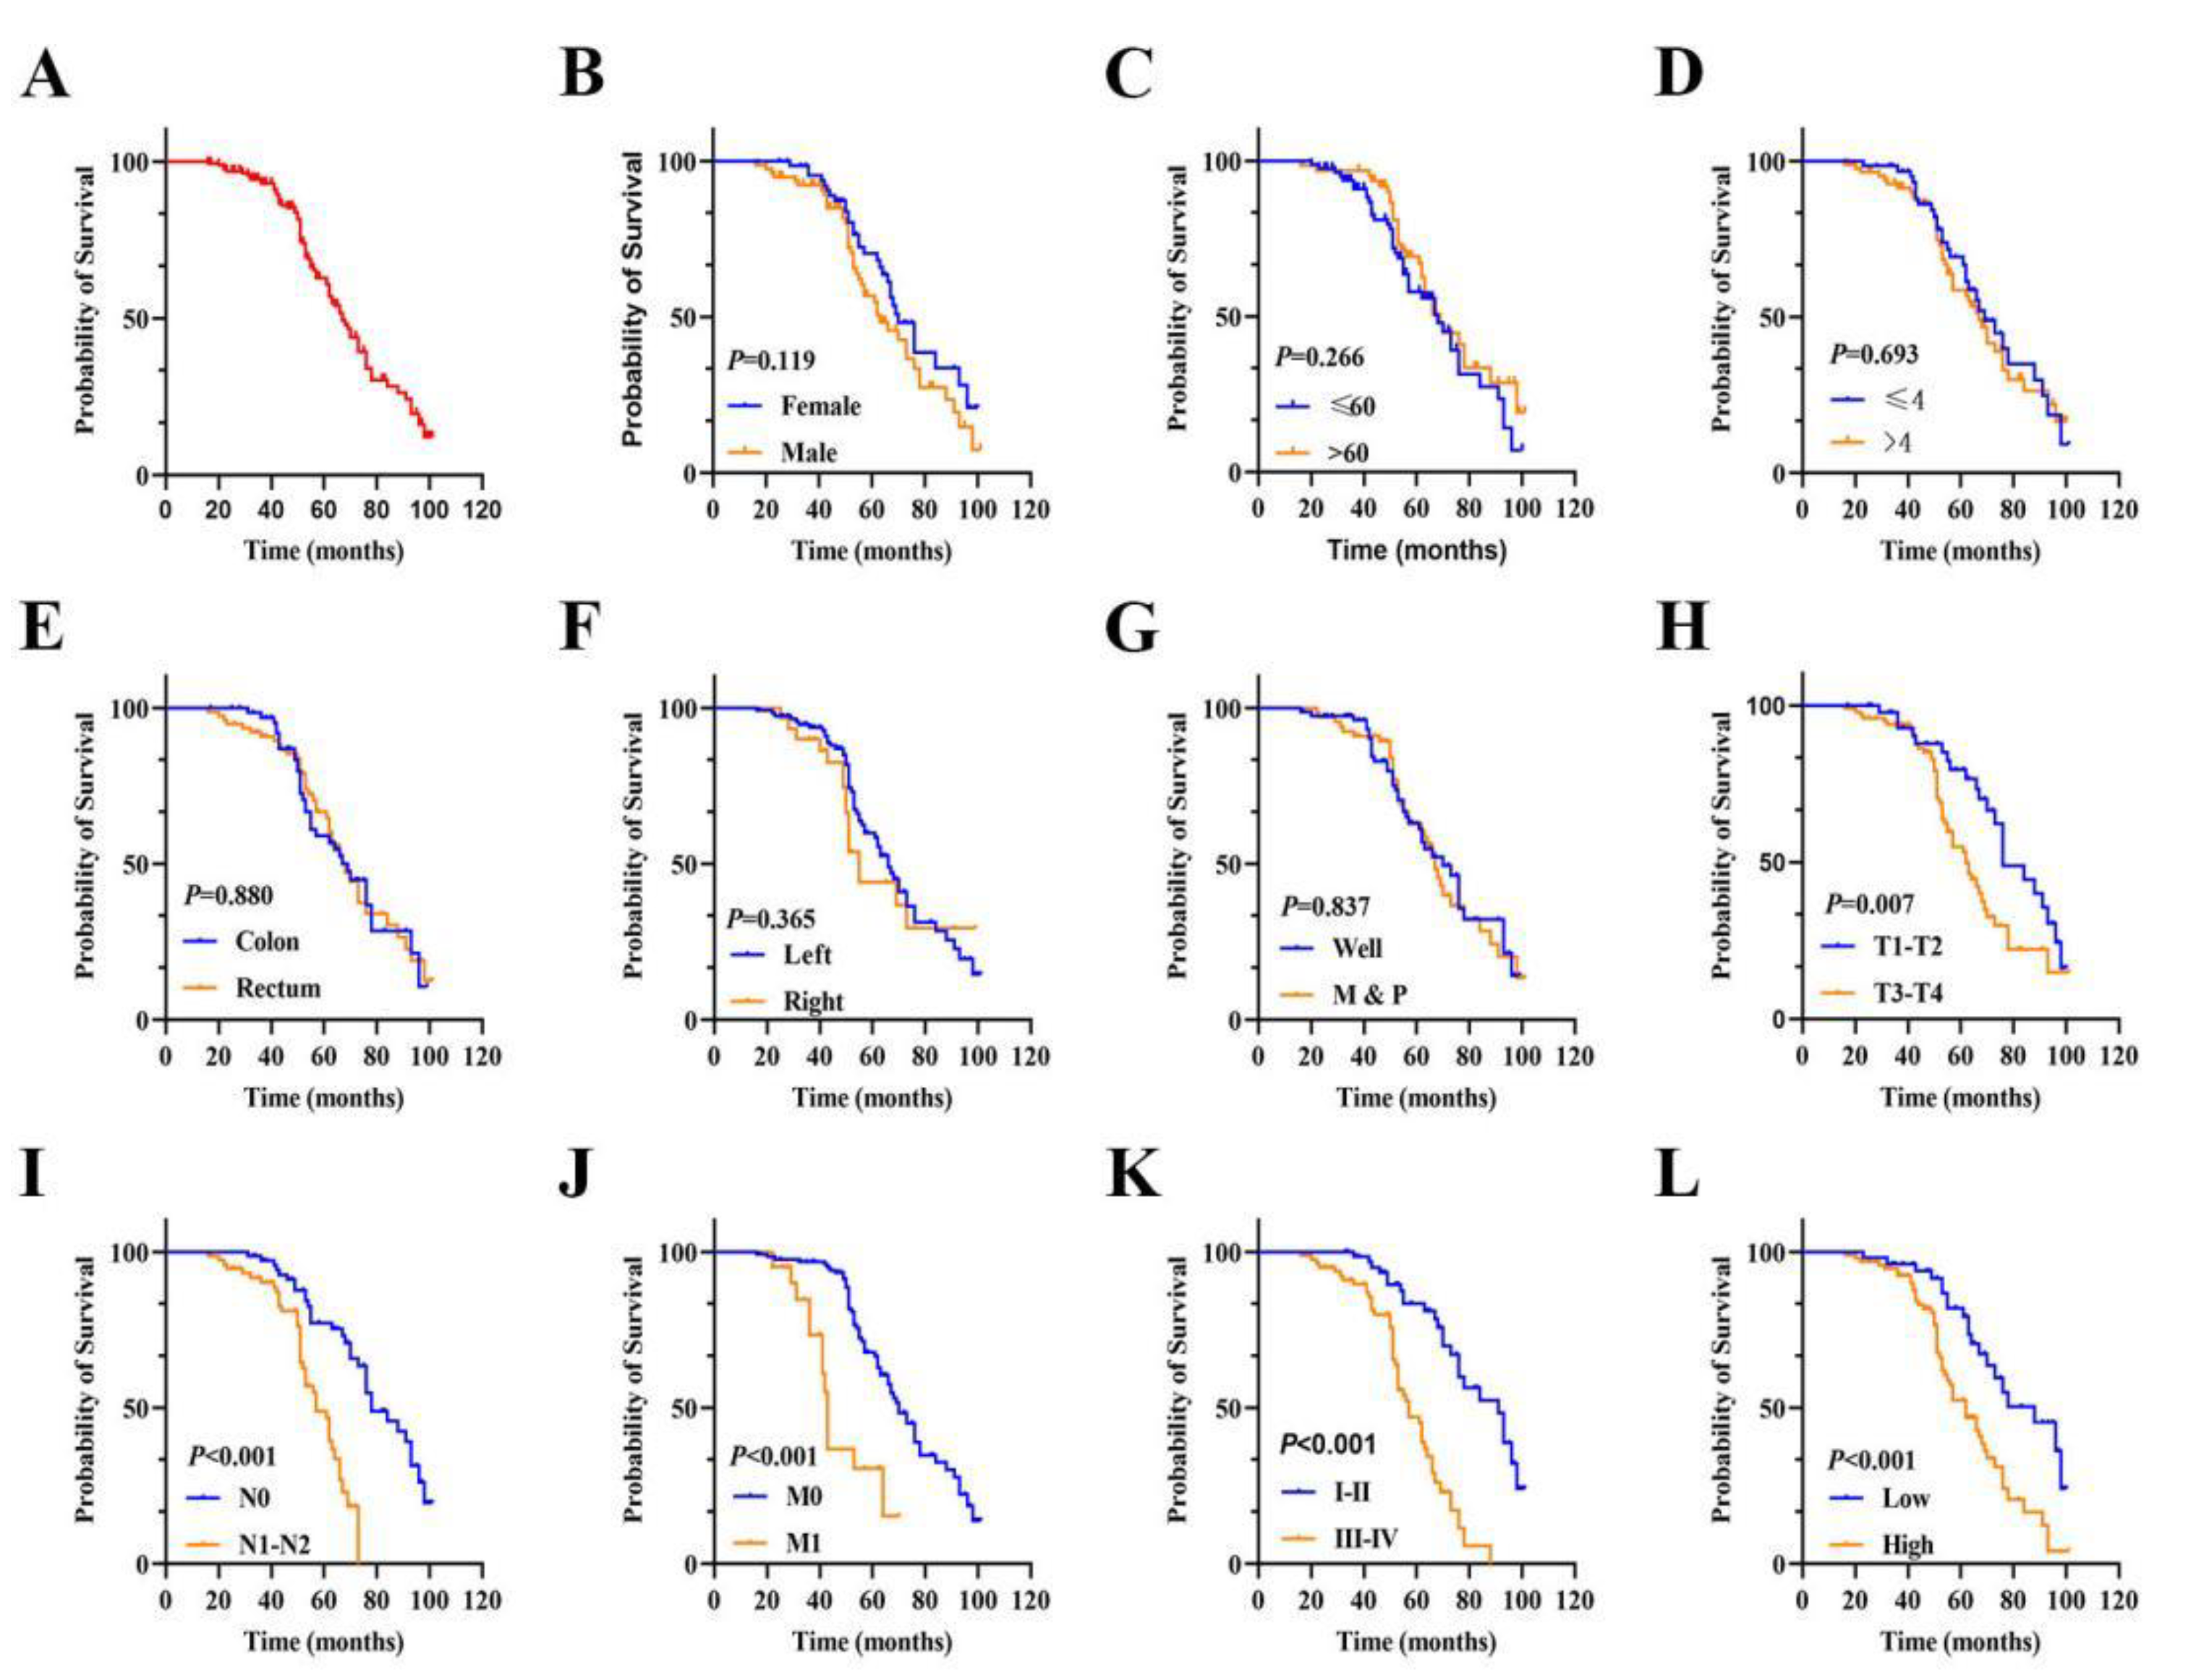
Figure 4.
Forest plot of prognostic risk factors for CRC. (A) Univariate Cox regression analysis forest plot. (B) Multivariate Cox regression analysis forest plot.
Figure 4.
Forest plot of prognostic risk factors for CRC. (A) Univariate Cox regression analysis forest plot. (B) Multivariate Cox regression analysis forest plot.
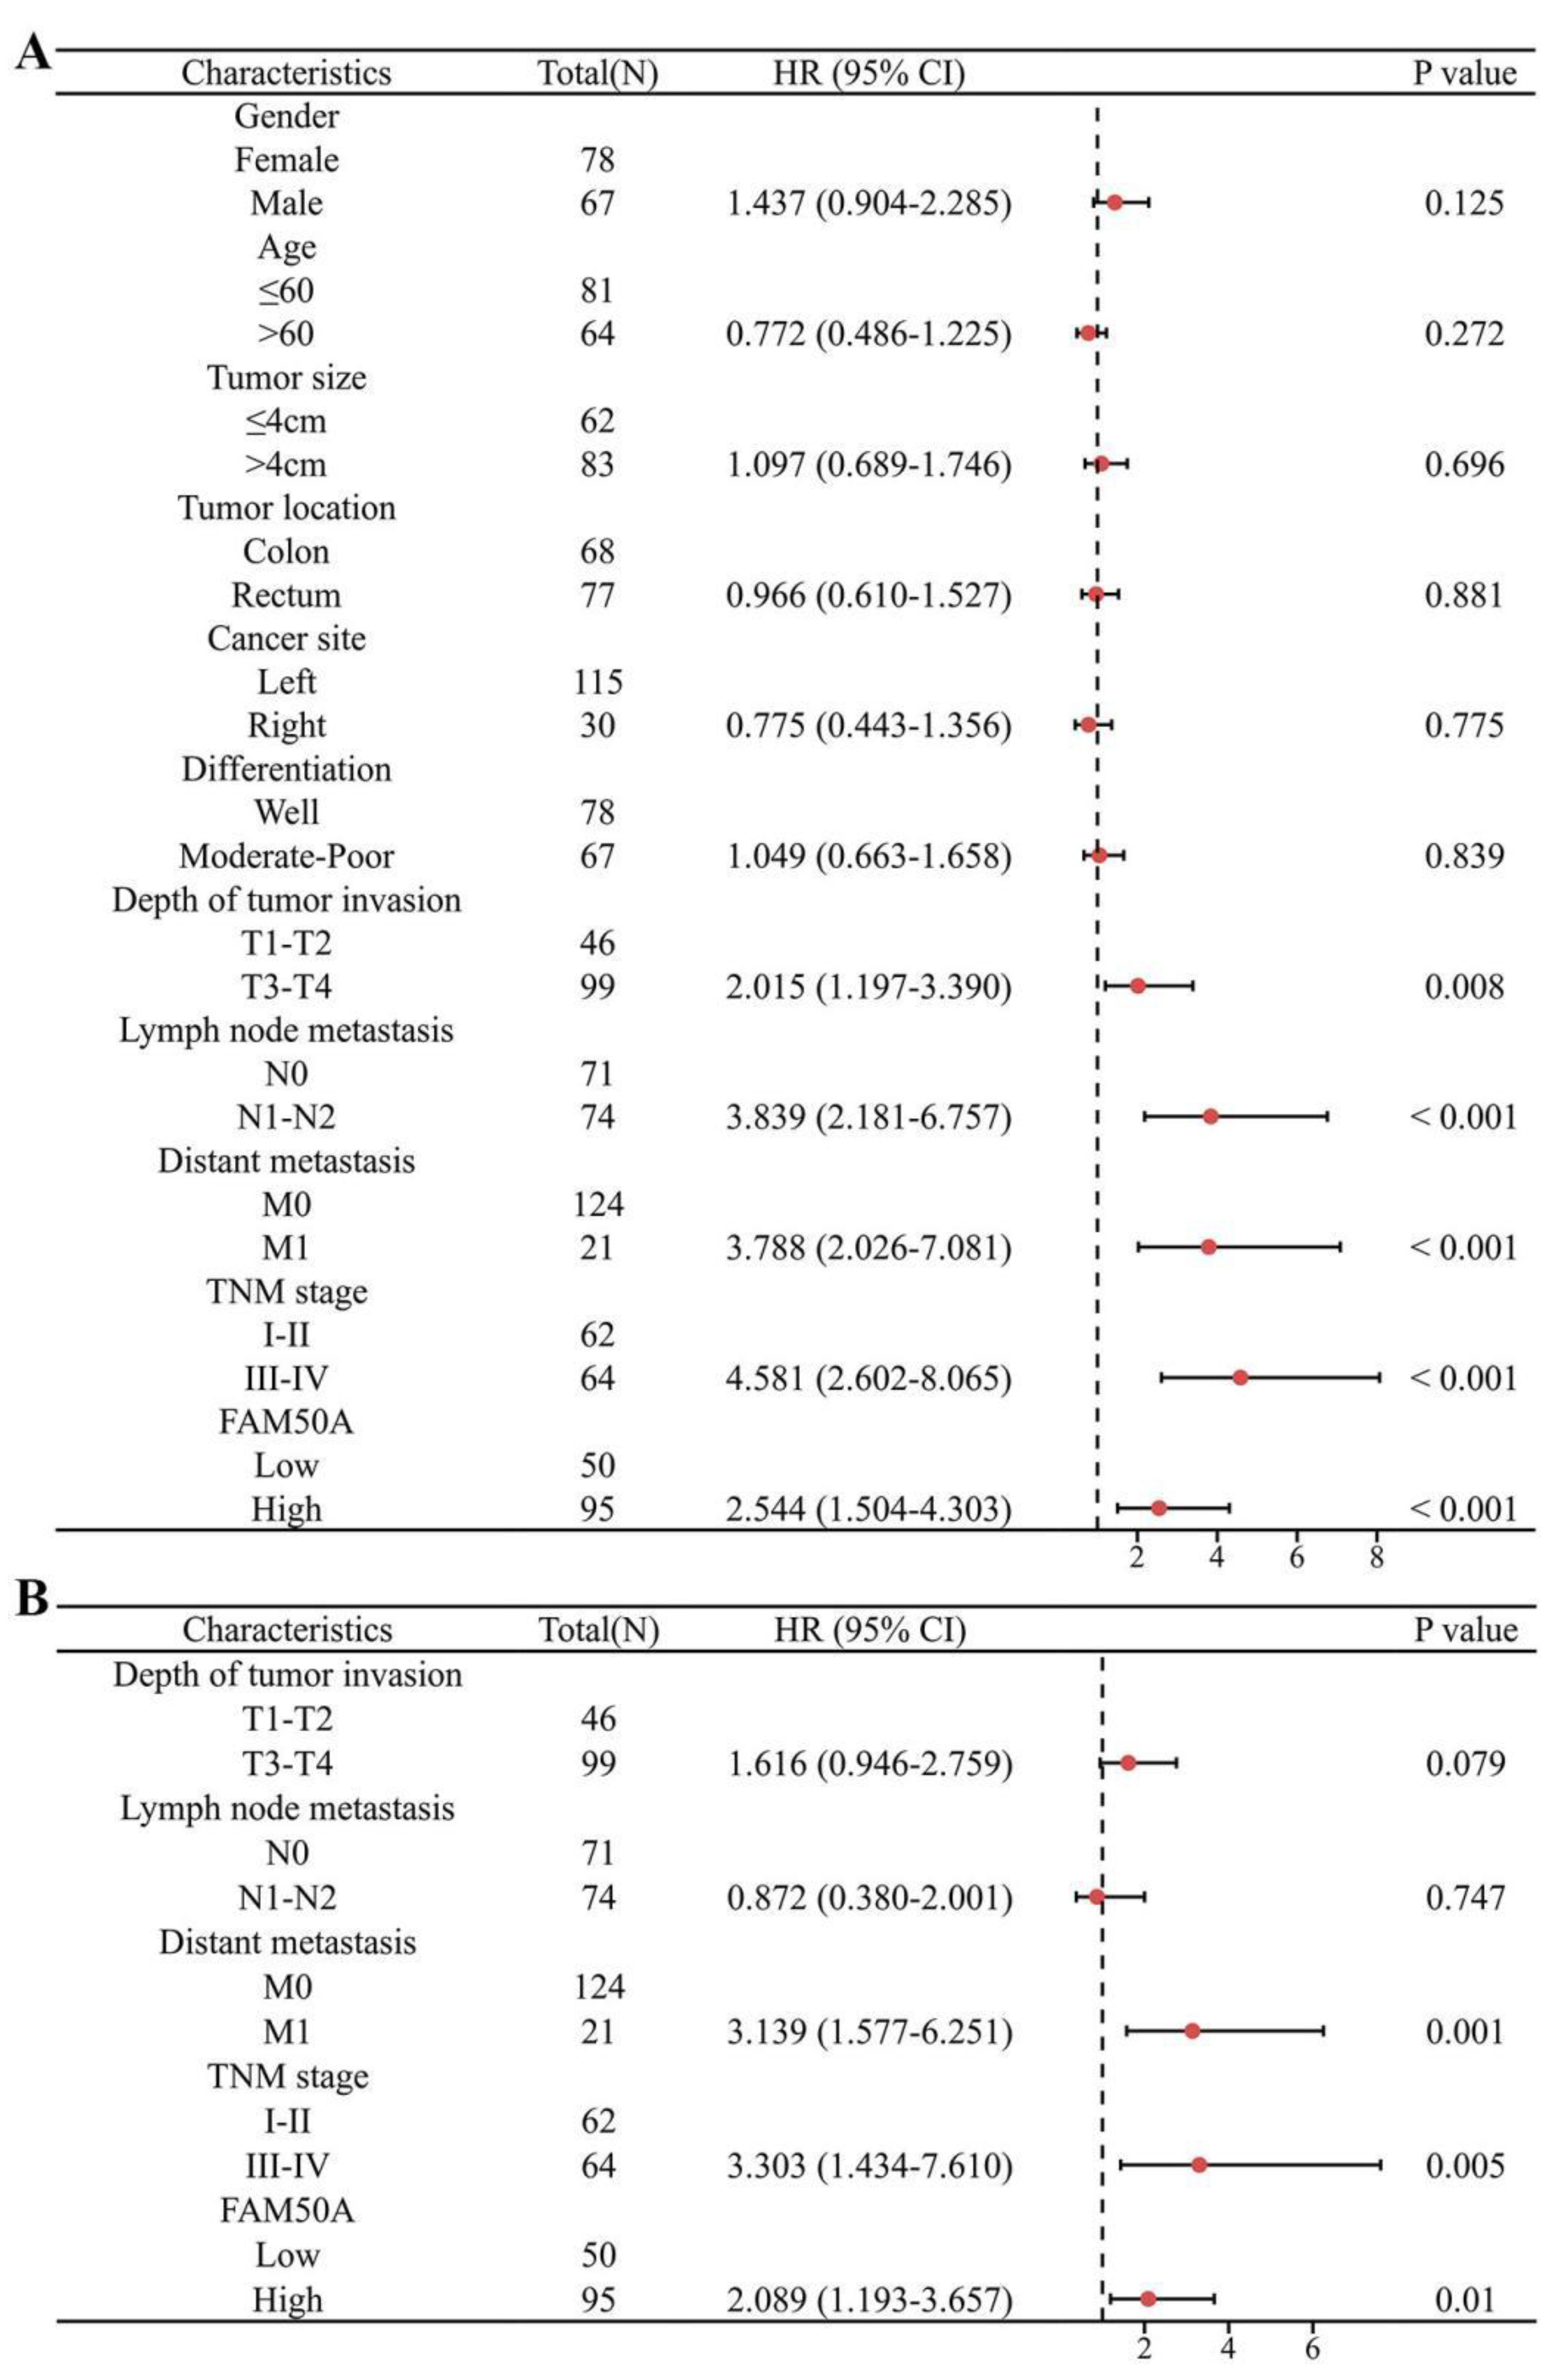
Figure 5.
Nomogram to display the prognosis value of FAM50A in CRC. (A-E) represent the results of prognostic proportional risk analysis in T, N, M and TNM stages and FM50A expression. (F) Nomogram constructed with different variables. (G) Calibration curve of nomogram. *P ≤ 0.05, **P ≤ 0.01, ***P ≤ 0.001 and ns: no significance.
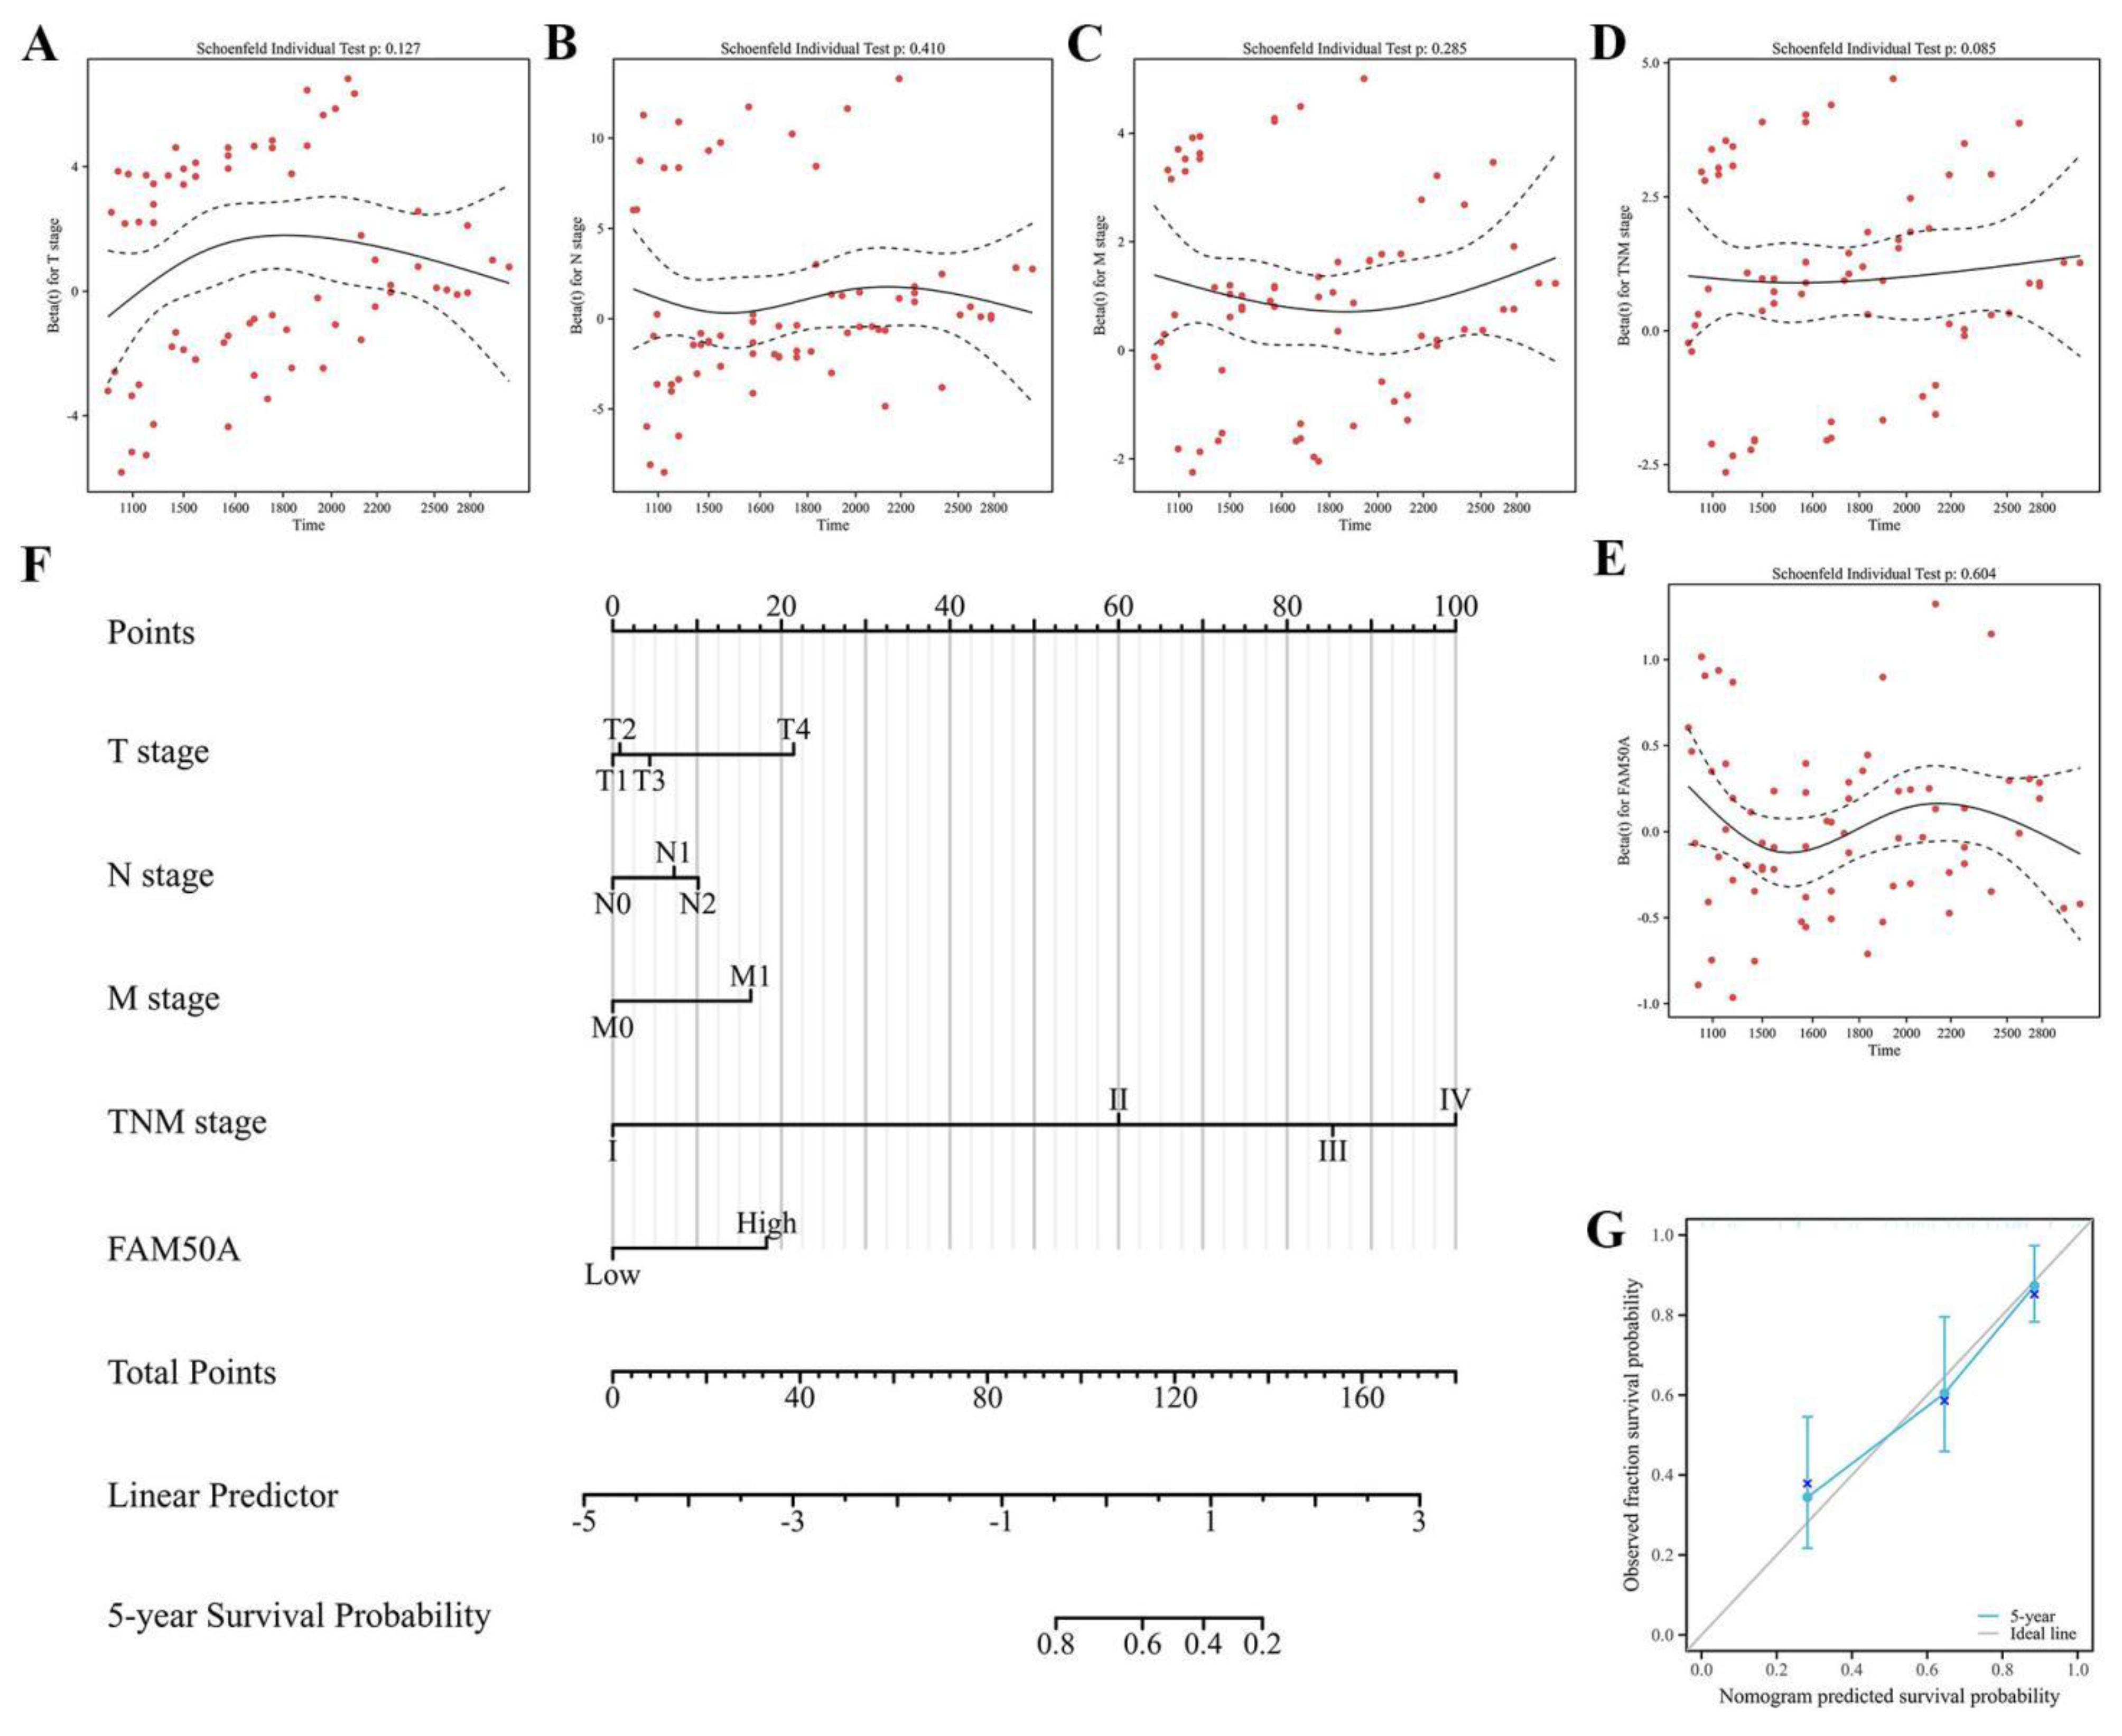
Figure 6.
Knockdown of FAM50A inhibited CRC cells proliferation ability in vitro. (A) Detection of FAM50A expression in CRC tumor cell lines and normal cell by using RT-qPCR and WB. (B) Verification of knockdown efficiency in SW480. (C) Verification of knockdown efficiency in HCT-8. (D) Detection of cell proliferation ability by CCK-8 assays in SW480. (E) CCK-8 assays in HCT-8. (F) EdU staining to identify the changes in cell proliferation after FAM50A knockdown in SW480 and HCT-8. (G) Plate colony formation assay to identify changes in cell proliferation in FAM50A knockdown cells. sh means knockdown, *P ≤ 0.05, **P ≤ 0.01, ***P ≤ 0.001 and ns: no significance.
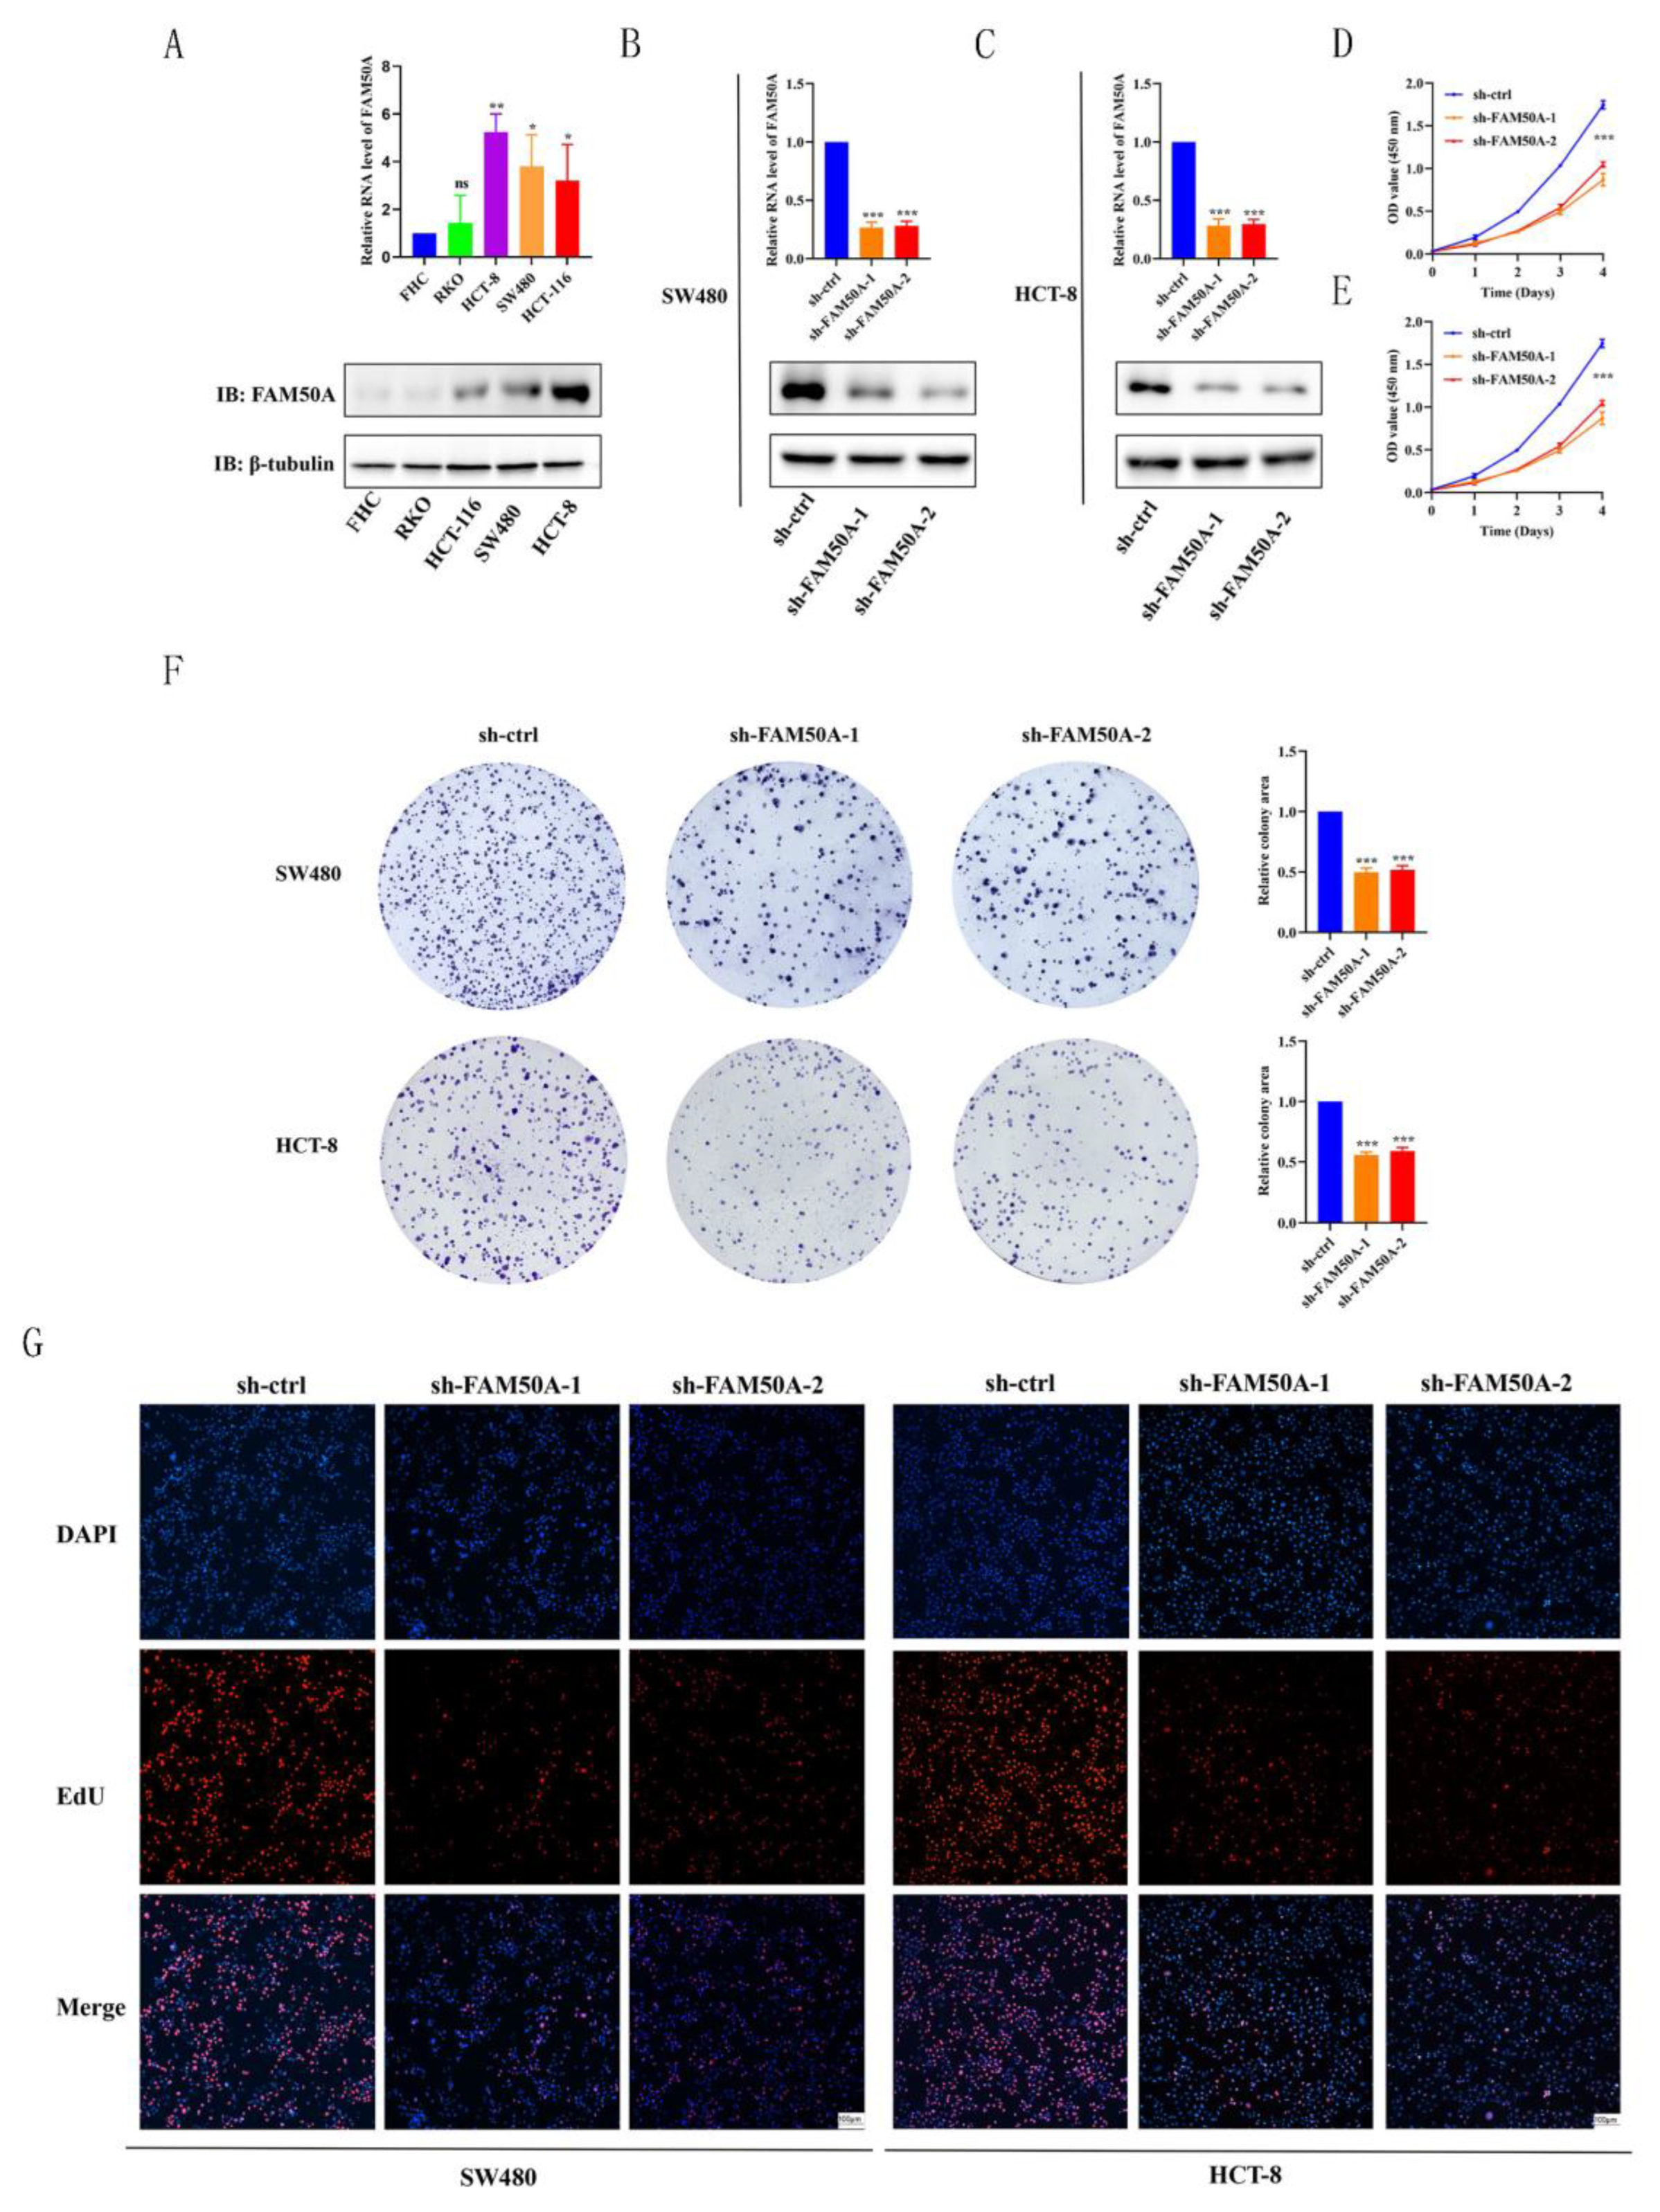
Figure 7.
Overexpression of FAM50A promoted cell proliferation ability in RKO. (A) Evaluation of the high expression efficiency for FAM50A. (B) CCK-8 assays in RKO. (C) EdU stained cells in overexpression cell compared with control RKO cell. (D) The colony forming ability assay of RKO.
Figure 7.
Overexpression of FAM50A promoted cell proliferation ability in RKO. (A) Evaluation of the high expression efficiency for FAM50A. (B) CCK-8 assays in RKO. (C) EdU stained cells in overexpression cell compared with control RKO cell. (D) The colony forming ability assay of RKO.
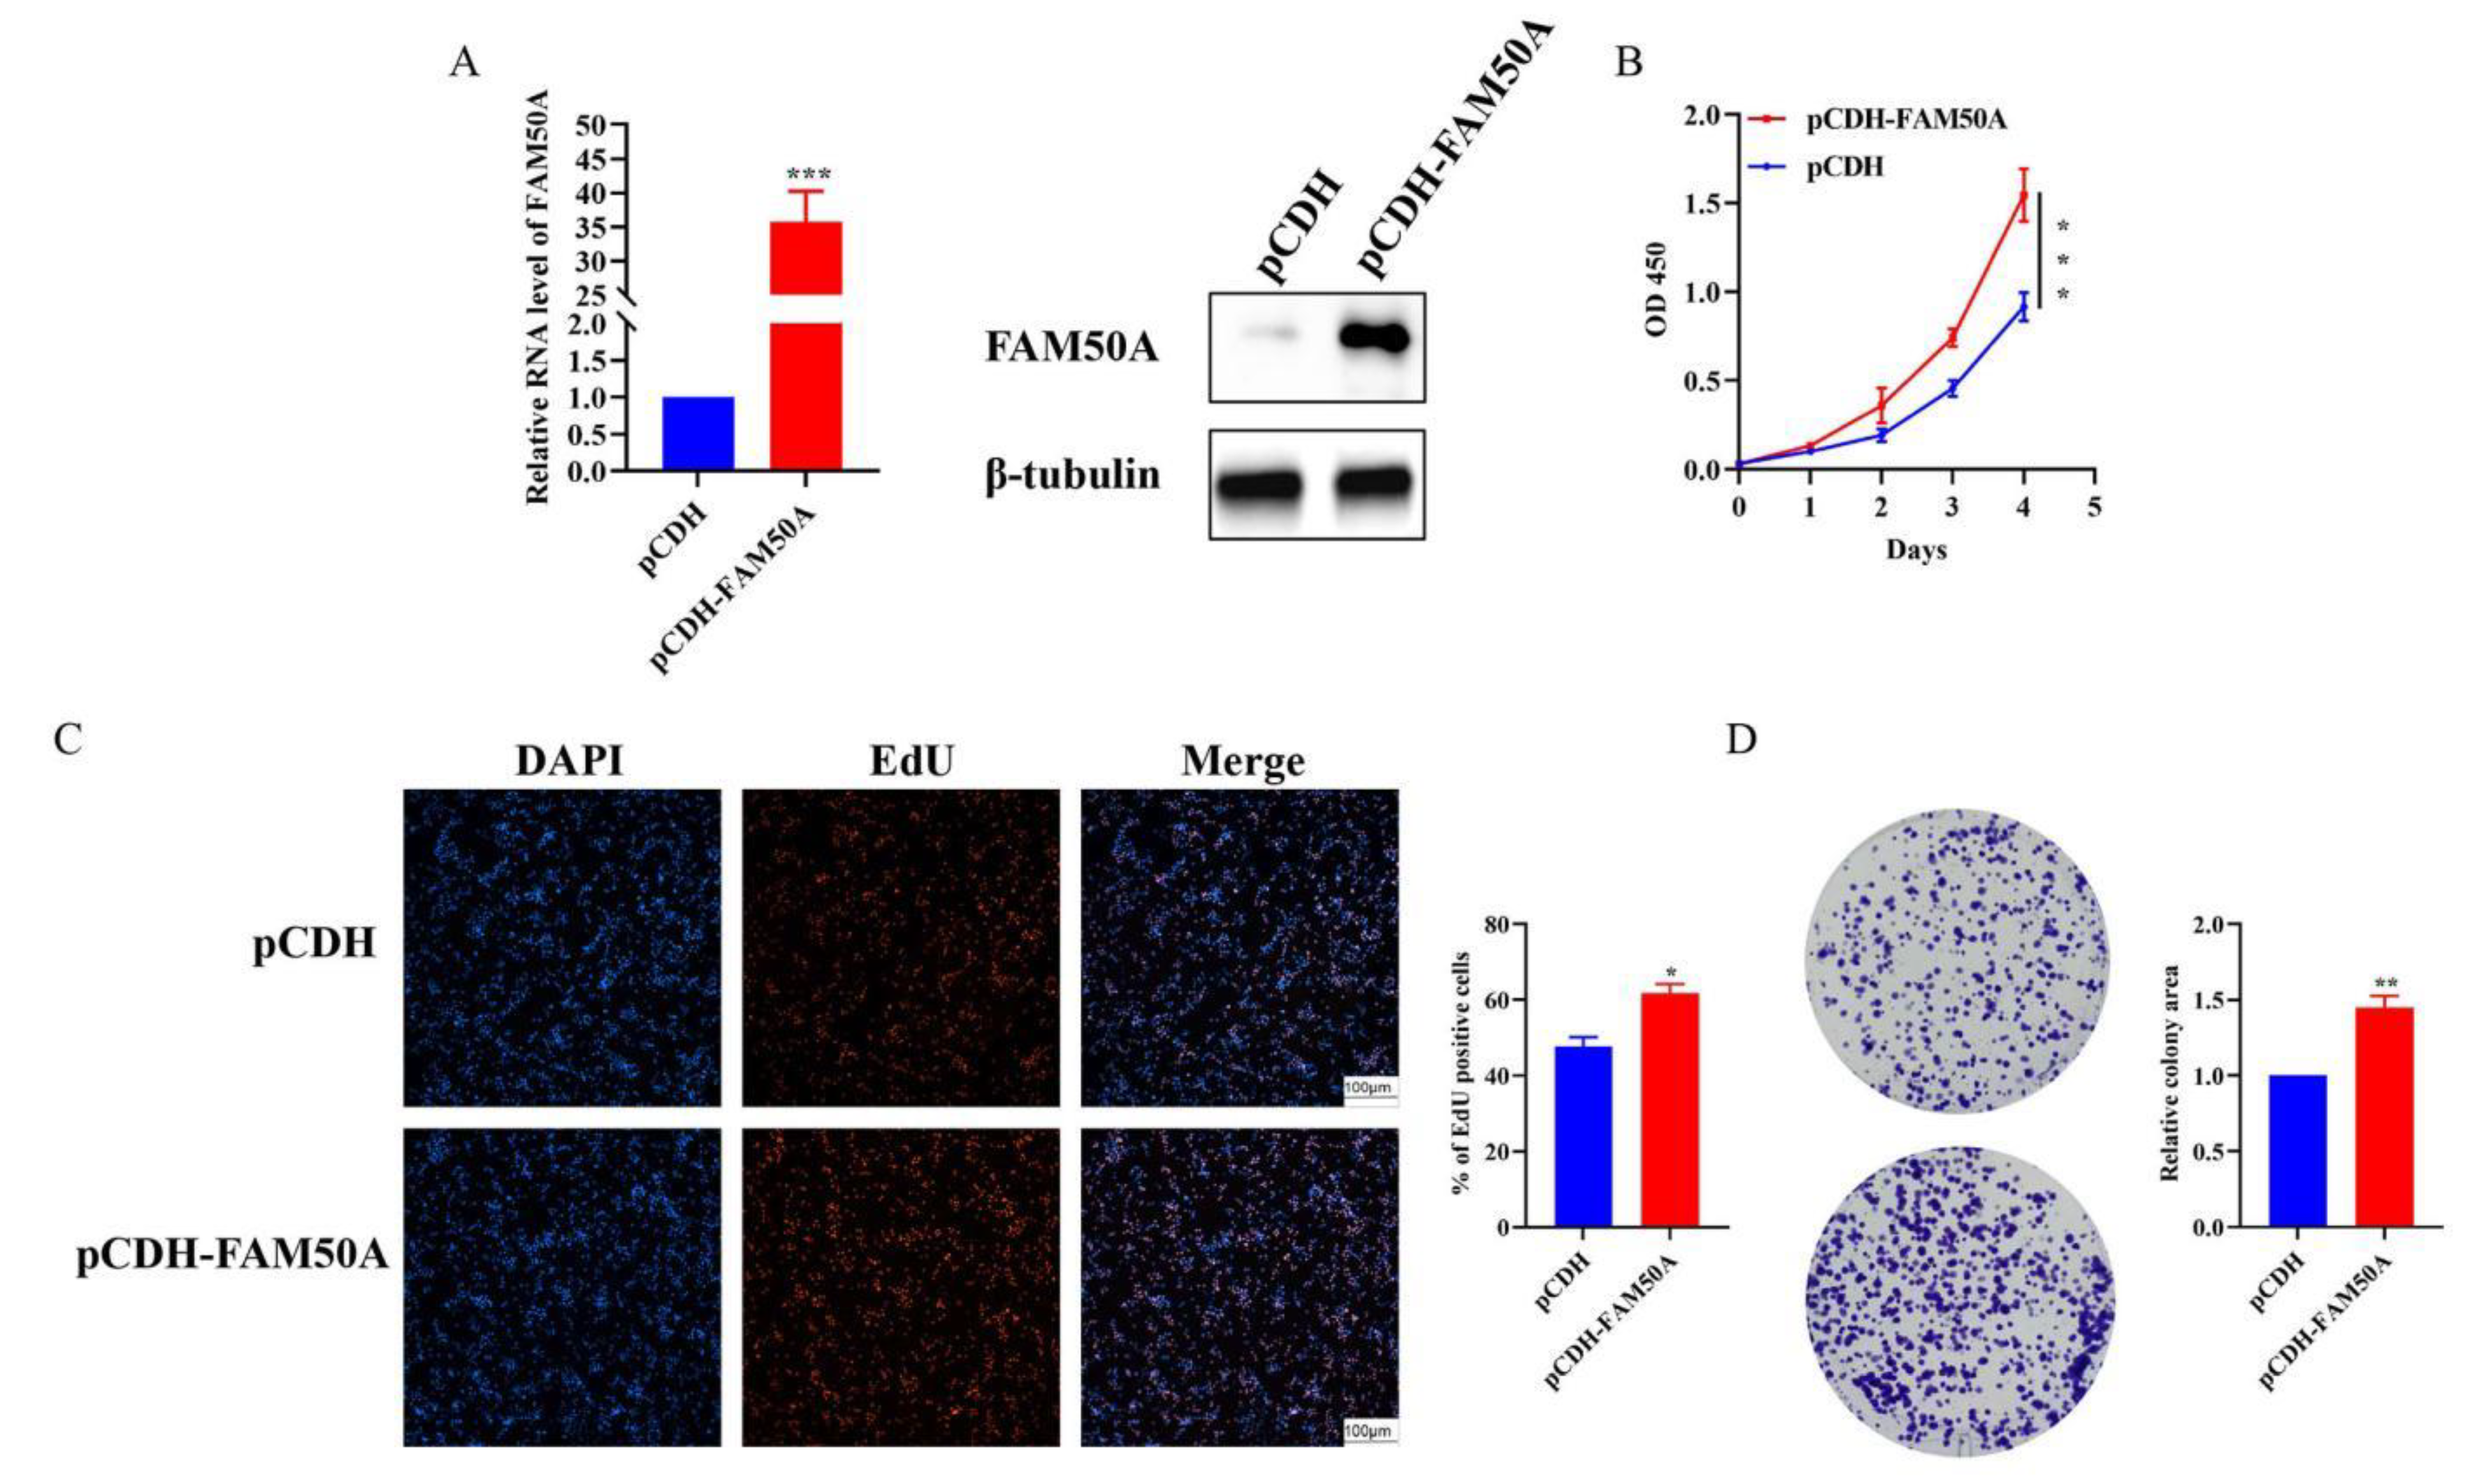
Figure 8.
Numerous molecular significantly correlated with FAM50A. (A) Co expression heat map of FAM50A. (B) Correlation heat map of 21 genes correlated with FAM50A. (C-E) Scatter plot of negative correlation of RO60, CDC42SE2 and NRIP1. (F-W) were positive correlation scatter plot of 18 molecule respectively.
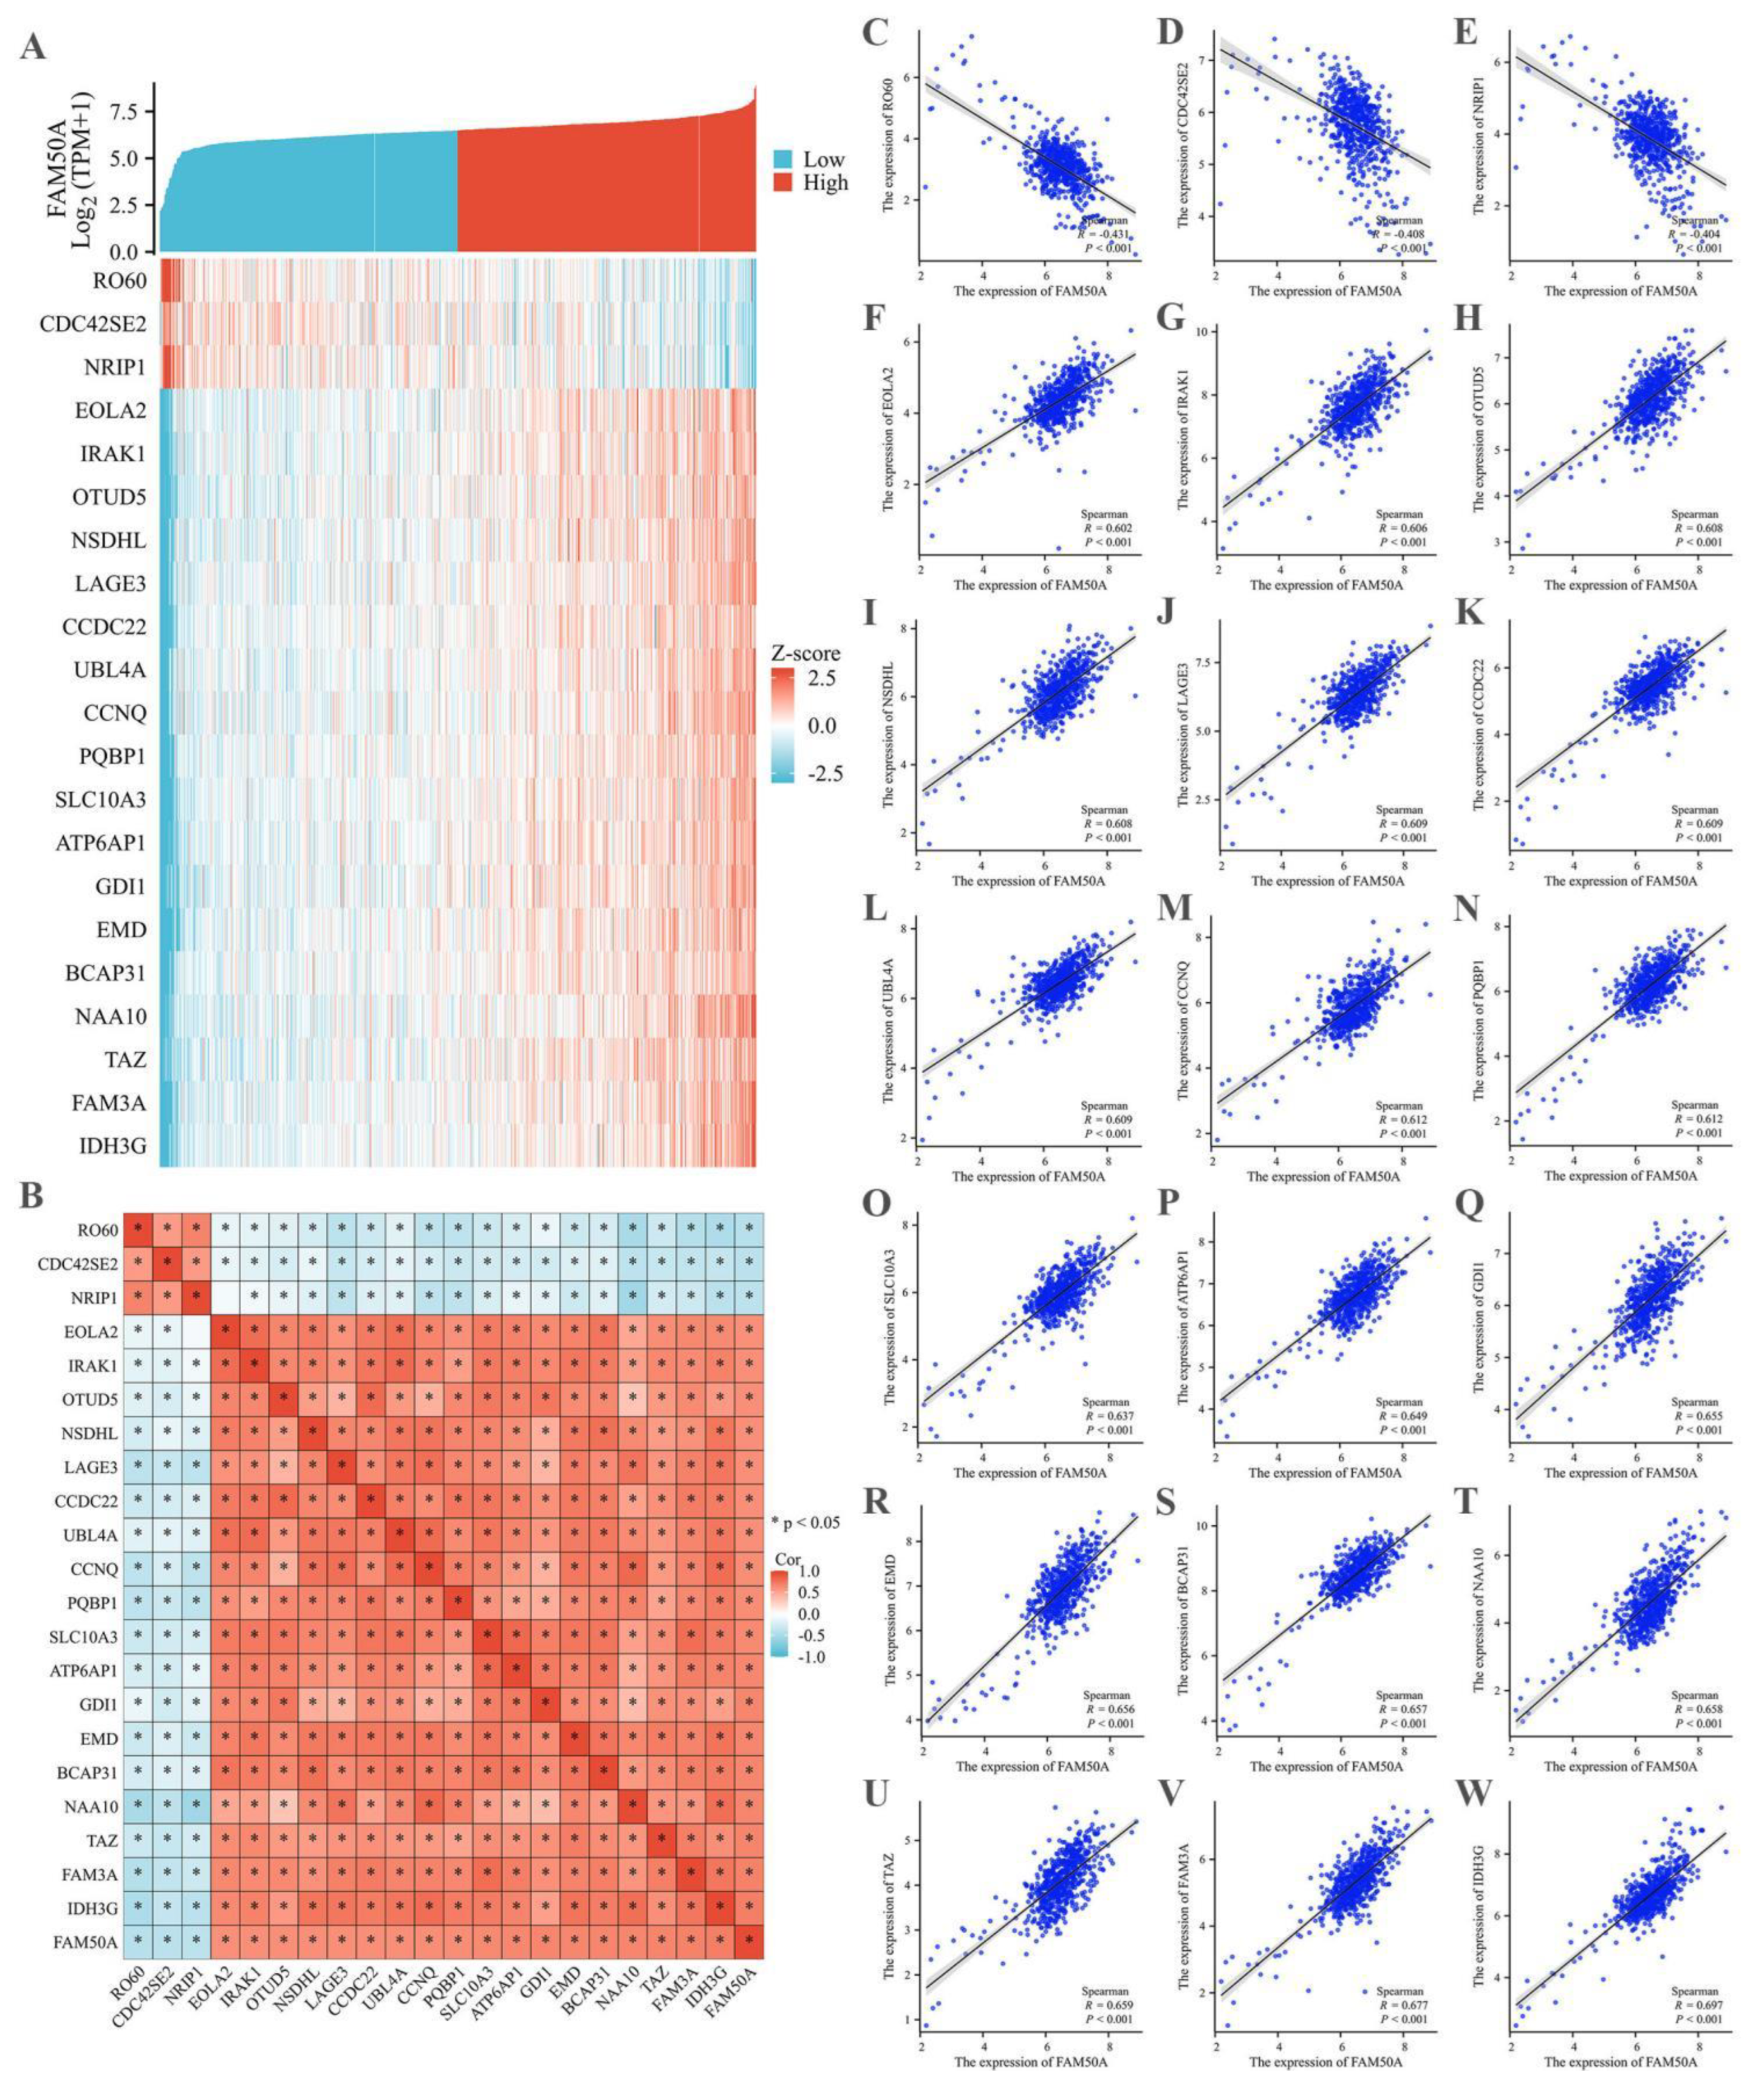

Table 1.
Patient baseline data involving correlation between the clinical characteristics and pathological staging in CRC patients.
Table 1.
Patient baseline data involving correlation between the clinical characteristics and pathological staging in CRC patients.
| Characteristics | Case (n=136) | FAM50A expression | P-value | |
| Low | High | |||
| Total | 145 | 50 | 95 | |
| Gender | 0.971 | |||
| Male | 78 | 27 | 51 | |
| Female | 67 | 23 | 44 | |
| Age | 0.302 | |||
| ≤60 | 81 | 25 | 56 | |
| >60 | 64 | 25 | 39 | |
| Tumor size | 0.626 | |||
| ≤4cm | 62 | 20 | 42 | |
| >4cm | 83 | 30 | 53 | |
| Tumor location | 0.572 | |||
| Colon | 68 | 25 | 43 | |
| Rectum | 77 | 25 | 52 | |
| Cancer site | 0.475 | |||
| Left | 115 | 38 | 77 | |
| Right | 30 | 12 | 18 | |
| Differentiation | 0.277 | |||
| Well | 78 | 30 | 48 | |
| Moderate & Poor | 67 | 20 | 47 | |
| Depth of tumor invasion | 0.239 | |||
| T1-T2 | 46 | 19 | 27 | |
| T3-T4 | 99 | 31 | 68 | |
| Lymph node metastasis | < 0.001 | |||
| N0 | 71 | 35 | 36 | |
| N1-N2 | 74 | 36 | 59 | |
| Distant metastasis | 0.001 | |||
| M0 | 124 | 61 | 63 | |
| M1 | 21 | 2 | 19 | |
| TNM stage | < 0.001 | |||
| I-II | 62 | 33 | 29 | |
| III-IV | 64 | 16 | 58 | |
Table 2.
Univariate and multivariate Cox proportional hazards regression analysis in CRC patients.
| Clinicopathologic parameters | Median of OS (95% CI ) | 5-year OS (%) | Univariate analysis | Multivariate analysis | |||
| HR (95 % CI) | P-value | HR (95 % CI) | P-value | ||||
| Total | 69.50 (65.24-73.75) | 63.00 | |||||
| Gender | Female | 72.97 (66.84-79.09) | 70.00 | 1.437 (0.904-2.285) | 0.125 | ||
| Male | 66.51 (60.73-72.29) | 56.70 | |||||
| Age | ≤60 | 67.32 (61.69-72.96) | 57.70 | 0.772 (0.486-1.225) | 0.272 | ||
| >60 | 72.07 (65.79-78.34) | 69.20 | |||||
| Tumor size | ≤4cm | 71.07 (64.15-77.40) | 69.00 | 1.097 (0.689-1.746) | 0.696 | ||
| >4cm | 68.06 (62.41-73.71) | 56.80 | |||||
| Tumor location | Colon | 69.16 (63.37-74.94) | 58.70 | 0.966 (0.610-1.527) | 0.881 | ||
| Rectum | 69.16 (63.13-75.19) | 66.60 | |||||
| Cancer site | Left | 66.00 (59.85-72.15) | 58.70 | 0.775 (0.443-1.356) | 0.775 | ||
| Right | 76.00 (66.90-85.10) | 70.20 | |||||
| Differentiation | Well | 69.75 (63.92-75.59) | 64.90 | 1.049(0.663-1.658) | 0.839 | ||
| M-P | 69.05 (62.94-75.15) | 62.60 | |||||
| Depth of tumor invasion | T1-T2 | 77.51 (70.60-84.42) | 79.50 | 2.015 (1.197-3.390) | 0.008 | 1.616 (0.946-2.759) | 0.079 |
| T3-T4 | 65.17 (59.97-70.36) | 53.00 | |||||
| Lymph node metastasis | N0 | 78.46 (72.99-83.93) | 77.00 | 3.839 (2.181-6.757) | < 0.001 | 0.872 (0.380-2.001) | 0.747 |
| N1-N2 | 56.50 (52.98-60.02) | 48.50 | |||||
| Distant metastasis | M0 | 72.11 (67.73-76.49) | 67.60 | 3.788 (2.026-7.081) | < 0.001 | 3.139 (1.577-6.251) | 0.001 |
| M1 | 47.44 (40.60-54.29) | 30.60 | |||||
| TNM stage | I-II | 81.88 (76.19-87.57) | 80.90 | 4.581 (2.602-8.065) | < 0.001 | 3.303 (1.434-7.610) | 0.005 |
| III-IV | 57.14 (53.69-61.78) | 46.80 | |||||
| FAM50A | Low | 79.37 (72.58-86.16) | 79.00 | 2.544 (1.504-4.303) | < 0.001 | 2.089 (1.193-3.657) | 0.010 |
| High | 63.33 (58.59-68.08) | 52.20 | |||||
Disclaimer/Publisher’s Note: The statements, opinions and data contained in all publications are solely those of the individual author(s) and contributor(s) and not of MDPI and/or the editor(s). MDPI and/or the editor(s) disclaim responsibility for any injury to people or property resulting from any ideas, methods, instructions or products referred to in the content. |
© 2024 by the authors. Licensee MDPI, Basel, Switzerland. This article is an open access article distributed under the terms and conditions of the Creative Commons Attribution (CC BY) license (http://creativecommons.org/licenses/by/4.0/).
Copyright: This open access article is published under a Creative Commons CC BY 4.0 license, which permit the free download, distribution, and reuse, provided that the author and preprint are cited in any reuse.


