Submitted:
14 October 2024
Posted:
15 October 2024
You are already at the latest version
Abstract
Recently, the introduction of Environmental, Social, and Governance (ESG) scores has become crucial for investment decisions and in minimizing portfolio risk. This study aims to understand the relationship between ESG scores and Value-at-Risk (VaR), computed by using a Vine copula-GARCH based approach, chosen for its reliability in detecting interdependencies among multiple stocks. In fact, one of the main challenges in estimating VaR for a stock portfolio is capturing the dependence structure among a large number of assets. The dataset consists of 16 companies listed on the FTSE100 index. The corresponding ESG scores were collected over a comprehensive period of five years, from 2018 to 2022, covering both normal and stressed market conditions. Additionally, a focused analysis was conducted for the period from 2020 to 2022 to isolate the specific effects of the COVID crisis. The results indicate that an increase in assets with the highest ESG scores reduces potential losses in the portfolio. This finding underscores the importance of integrating high-level ESG scores into portfolios to mitigate market risk. Additionally, during periods characterized by stressed market conditions, the impact of ESG scores on VaR is even more pronounced, demonstrating that sustainable assets are more resilient in times of crisis.
Keywords:
ESG
; VaR
; Kendall’s tau
; equity risk
; Vine copulas
1. Introduction
In recent years, dependence patterns among various stocks have become increasingly complex, particularly following the global financial crisis. Numerous methodologies have been developed to capture this complexity with increased flexibility. A significant body of literature has focused on multivariate copulas as models for capturing dependence due to their ability to offer flexibility in selecting marginal distributions. According to [28], any multivariate distribution can be decomposed into its marginal distributions and a copula that models the dependence structure. This foundational result allows copulas to model complex dependence structures separately from the marginal behavior of individual assets, making them powerful tools in finance and risk management. This is especially valuable in the financial context, where assets often exhibit asymmetric and tail-dependent behavior that standard correlation measures fail to capture.
Despite their advantages, traditional multivariate copulas, including both elliptical copulas (such as Gaussian and Student’s t copulas) and Archimedean copulas, have limitations. They often imply uniform dependence structures across all pairs of variables, which does not always align with the intricacies of financial markets. This uniformity can result in an inadequate representation of symmetry and tail dependence in multivariate data. Additionally, while there is a vast selection of bivariate copulas, the set of available higher-dimensional copulas is relatively limited, restricting the ability to model more complex dependencies in multivariate settings.
To address these limitations, Vine copulas have been proposed. Regular Vines, initially constructed by [16] using mixtures of conditional distribution functions, were later given a graphical structure by [2] to better understand the sequence of conditioning variables. [7] discuss how Vine copulas offer a flexible approach to modeling multivariate dependencies by constructing higher-dimensional copulas from bivariate building blocks. In fact, Vine copulas allow for the combination of copulas from different families, such as the t-copula (elliptical) and the Clayton copula (Archimedean), each of which is particularly suited for modeling specific aspects of dependency between financial variables. This allows for a more accurate representation of the dependencies between variables, particularly in cases where pairwise dependencies vary significantly.
Elliptical copulas, like the t-copula, are effective in capturing symmetric dependencies and handling heavy tails, i.e., situations with extreme events that have low probabilities but significant impacts. This is crucial in the context of Value-at-Risk (VaR), where accurately considering the possibility of extreme losses is essential. On the other hand, Archimedean copulas, such as the Clayton copula, provide excellent representation of asymmetric dependencies, especially useful in scenarios with unidirectional heavy tails. This allows for modeling situations where the dependence between variables is stronger in one tail compared to the other. The integration of these heterogeneous copulas within vine structures enables the construction of highly customized models that better reflect the reality of complex dependence structures.
There are two main types of Vine copulas: Regular Vine (R-Vine) and Canonical Vine (C-Vine). R-Vine copulas offer the most flexibility, allowing for the specification of complex dependence structures through a sequence of linked trees, as discussed by [17] and further developed by [19]. Each tree level corresponds to conditional dependencies, enabling the model to capture intricate interactions between variables. C-Vine copulas, on the other hand, are more structured, with one central variable at each level of the Vine acting as a hub that connects to other variables. This structure is useful when one variable is expected to have a dominant influence over the others, but may be less flexible in other scenarios. [6] provides a step-by-step introduction to Vines, serving as a practical guide.
Given the increasing complexity of stock return dependencies, integrating copulas with GARCH models has become a popular approach. GARCH models are widely used to model the conditional heteroskedasticity of financial time series, capturing the dynamic nature of volatility over time. By integrating GARCH models with Vine copulas, one can account for both the time-varying volatility of individual assets and the complex, potentially non-linear dependencies between them. This integration provides a more comprehensive framework for risk management, particularly for the estimation of risk measures such as VaR.
The work of [26] first introduced copula-based GARCH modeling, and [20] highlighted the benefits of using these models over dynamic conditional correlation models. The univariate GARCH model can filter the univariate serial dependence in each marginal time series, while the Vine copula model captures the cross-sectional dependence across residuals. This combined approach was used by [3] in risk management and further explored by [21] for non-parametric estimation of the marginal residual distribution. In the context of sustainable finance, [8] studied the dependence between Environmental, Social, and Governance (ESG) indices and the market, marking a significant application of Vine copulas in the ESG context.
This integration of advanced modeling techniques, such as copula-based GARCH models, with ESG considerations highlights the increasing need for holistic risk management frameworks that account not only for financial dependencies but also for sustainability factors. ESG criteria enable investors to assess both the financial and non-financial risks associated with companies by evaluating their long-term impact on ESG practices [14]. Companies with strong ESG profiles tend to demonstrate greater resilience during periods of financial stress [30]. Such developments gained significant momentum as regulatory bodies, particularly within the European Union, have introduced frameworks like the Sustainable Finance Disclosure Regulation (SFDR) [12] to enhance transparency and consistency in ESG disclosures, promoting a more comprehensive risk management approach.
Building on this literature, this paper aims to investigate the use of the Vine copula approach for estimating the one-year VaR of a stock portfolio, focusing on the relationship between VaR and ESG scores. By applying the model to the daily log-returns of multiple stocks in the London financial market, we seek to detect interdependencies among them. Specifically, the VaR is computed for an equal-weighted portfolio and compared with results obtained by increasing the proportion of the best ESG stocks while reducing the proportion of the worst ESG stocks.
Preliminary results indicate that increasing the proportion of top-performing ESG stocks in a portfolio can lead to a reduction in overall market risk, particularly during periods of market stress. This suggests that sustainable investments not only align with ethical considerations but also contribute to enhanced portfolio stability and risk mitigation. In particular, the VaR is calibrated over a one-year period with a confidence level of 99.5%, in accordance with the Solvency II Directive. This research can serve as a basis for future works, considering the GARCH-Vine copula as a possible internal model to calculate the Solvency Capital Requirement (SCR) for equity risk.
2. Research Methods
This study focuses on VaR as a measure of the total risk to which a stock portfolio is exposed. For a given portfolio, VaR is defined as the maximum loss that is likely to occur over a given period with a specified confidence level of . In other words, there is a probability equal to of experiencing losses greater than the VaR prediction. Formally, the one-step-ahead VaR at the level is expressed as:
where represents the one-period return from time to time t, denotes the quantile level, and is the information set at time t. Thus, VaR can be interpreted as the quantile of the conditional distribution of returns.
The VaR forecasting can be enhanced using a copula approach, which captures the complex dependencies among assets and provides more accurate VaR estimates than traditional methods. While it is established that copulas generally outperform conventional methods, our approach employs Vine copulas to further refine this accuracy. Vine copulas offer superior flexibility and precision by enabling the combination of copulas from different families, which improves both the prediction and calculation of VaR beyond the capabilities of standard multivariate copulas.
This approach not only improves the accuracy of VaR estimates but also enhances the overall robustness of risk predictions, overcoming the limitations of multivariate copulas and providing more reliable financial risk management [22]. Specifically, Vine copula models are widely employed in finance to capture cross-sectional dependence among residuals obtained from applying univariate time series models to financial returns, as will be detailed in the following sections.
2.1. GARCH Model Estimation and Standardization of Residuals
A significant body of literature has established the effectiveness of GARCH models in capturing volatility dynamics in financial markets. [11] introduced the ARCH model, which [2] extended to the GARCH framework, allowing for more flexible modeling of time-varying volatility. These models have become fundamental in the analysis of return series and the forecasting of conditional volatility, playing a crucial role in risk management and the estimation of VaR [4,18].
Further applications of GARCH models have been explored in various contexts, including portfolio optimization [29], asset pricing [5], and the assessment of market risk [10]. These models have proven particularly effective in capturing the volatility clustering and heavy-tailed behavior often observed in financial time series.
To implement the GARCH-Vine approach, the first step is to fit a GARCH model to the return series of each asset, estimating the parameters using Maximum Likelihood Estimation. The GARCH model for asset i is defined as:
where denotes the conditional variance of asset i’s return at time t, with representing the return , denoting the residual and is a realization of an independent and identically distributed (i.i.d.) random variable with mean zero and unit variance, often assumed to follow a standard normal or t-Student distribution. The process is weakly stationary if and only if . Specifically, in this study, we will utilize the GARCH(1,1) model in the numerical application, as it is particularly effective for capturing the volatility clustering commonly observed in financial time series data, while also ensuring that we do not complicate the model beyond what is necessary for our analysis.
Once the GARCH model is estimated, the next step involves standardizing the residuals of the univariate return series by dividing the residuals by the estimated conditional volatilities:
where represents the residual of asset i at time t, and is the estimated conditional volatility at time t.
Subsequently, these standardized residuals are transformed into a series of univariate pseudo copula values using the Probability Integral Transform (PIT) [13]. This step is crucial, as (Vine-)copula models require variables to be uniformly distributed to effectively model and analyze dependencies among multiple assets, in accordance with [28], which will be explained further below. The PIT is a fundamental concept in probability theory and statistics that ensures the uniformity of transformed variables. Specifically, if X is a continuous random variable with cumulative distribution function (CDF) , the transformation results in U being uniformly distributed on the interval [0,1]. This result is due to the fact that the CDF maps values of X to probabilities, which are uniformly distributed over the interval [0,1].
In our context, the standardized residuals (3) are transformed into uniform variables using their empirical CDF , such that:
Here, represents the pseudo copula values. However, if there is a justified reason to believe that the residuals follow a specific theoretical distribution, it is possible to use a non-empirical CDF, such as that of the standard normal distribution or another distribution chosen based on the characteristics of the data. As we will discuss further below, by converting the standardized residuals into uniformly distributed variables, we ensure that the dependency structure between the assets can be captured and analyzed effectively using copula models.
2.2. Vine Copula and Dependency Modeling
The strength of copulas comes from Sklar’s theorem, which demonstrates that the structure of a multivariate distribution is independent of the univariate marginals, with this structure being defined by the copula function. Specifically, the theorem states that:
Theorem 1
(Sklar’s Theorem). Let F be the CDF of the vector , and let be the marginal CDFs for . Then, there exists a copula C such that for all :
with the associated density:
for some d-dimensional copula C with copula density c. If the marginals are continuous, then C is the unique copula associated with F. Conversely, if C is a copula and are univariate distribution functions, then F is the joint distribution function for .
Sklar’s theorem states that any multivariate distribution can be expressed in terms of its marginals and a copula that captures the dependency structure between the variables. The proof of Sklar’s theorem can be found in [24] (pages 45-60).
To understand how copulas capture these dependencies, it is essential to understand Kendall’s and its interpretation. Given two pairs and drawn from a random vector , Kendall’s is defined as:
Here, denotes the probability of concordance, while denotes the probability of discordance. Therefore, Kendall’s measures the relative difference between the probability of concordance and discordance, providing insights into the strength and direction of the association between the variables.
However, while there is a wide range of parametric copula families, they tend to lack flexibility as the dimensionality of the vector increases. Moreover, they do not allow for different dependence structures between subgroups of random variables. In order to overcome the limitations of traditional multivariate copulas, Vine Copulas extend the concept of capturing dependencies in multivariate distributions by offering flexibility through a sequence of linked bivariate copulas arranged in a tree structure.
Fundamentally, the concept underlying Vine copulas is the Pair Copula Construction introduced by [16] which allows for the factorization of the multivariate density using bivariate copulas. Specifically, this approach begins with the decomposition of the multivariate density into conditional densities:
For the bivariate case, the previous equation simplifies to:
The second factor of the equation above can be further expressed by applying the definition of conditional density in conjunction with equation (6):
where is the pair-copula density. This leads to the formulation of the joint density in terms of pair-copulas and marginal densities:
Next, we consider the case where , to better understand how to decompose more complex joint density within the multivariate framework. The trivariate joint density is given by:
We factorize this formula by considering each part separately. In particular, the conditional density follows the structure of equation (10) presented earlier:
Additionally, the factor is the conditional density of given that and and it can be expressed as:
which results from a recursive process (see [6]).
Thus, the joint density function (12) can be expressed in terms of bivariate copulas as follows:
However, this decomposition is not unique. There are two other possible copula constructions in three dimensions by changing the order of the variables. For a large number of variables, the decomposition can become intricate and challenging to interpret. For this reason, [2] extended Joe’s work [16] by representing these decompositions as interconnected tree structures within the context of graph theory, providing a more comprehensible understanding.
Following [2], we define a parametric R-Vine distribution as follows:
Definition 1.(Parametric R-Vine distribution). A parametric R-Vine distribution for a random vector ( ) consists of three main components:
- Tree Structure: A set of linked trees , where j ranges from 1 to , that is defined as .
- Parametric Bivariate Copulas: A set of bivariate copulas assigned to each edge in the tree structure. These copulas, known as pair copulas, model the pairwise dependencies between the variables connected by the respective edges.
- Corresponding Parameters: The parameters associated with the corresponding copulas in . These parameters define the specific dependency structure captured by each copula.
The density of an R-Vine for a random vector ( ) is given by:
where is the marginal density; is the bivariate copulas modeling the dependence between the variables and conditionally on a set D; and represent the conditional distribution functions of the variables and , respectively, conditioned on the set D; is the set of pairs corresponding to the edges in the k-th tree of the R-Vine structure.
Building on this foundation, the selection of the R-Vine model involves three key choices: determining the structure of all its trees, selecting the copula family for each of the pair copulas, and specifying the parameters for each pair copula. The selection strategy employed here is heuristic and bottom-up. For further details, please refer to the paper by [9].
However, the generality of R-Vines can make them complex to specify and interpret, especially as the number of variables increases. To address this complexity, more structured Vine copulas, such as the C-Vine, have been introduced to simplify the specification of the dependency structure. The C-Vine imposes a specific structure where, at each level, there is a central variable. This structure reduces complexity and facilitates the interpretation of dependencies, particularly when some variables are thought to play a more significant role in determining the overall dependence. Graphically, as illustrated in the Figure 1 for the case , each tree in the C-Vine has a unique node that is connected to edges, where j denotes the level of the tree.
2.3. Forecasting and VaR Calculation
With the dependency structure in place, the next stage involves forecasting returns and computing the VaR for the portfolio over the chosen time horizon. This process can be broken down into key steps:
1) The first step involves fitting the R-Vine copula to the standardized residuals obtained from the GARCH model. Before fitting the copula, the residuals are standardized and then transformed into uniform pseudo copula values using the chosen CDF, which can be either empirical or theoretical, as discussed above. This fitting process is crucial for accurately capturing the dependency structure among the assets.
2) Using the fitted R-Vine model, we generate a random sample of pseudo copula values , simulating joint realizations over the chosen time horizon to estimate the cumulative returns.
3) The simulated pseudo copula values are then transformed into standardized residuals by applying the inverse CDFs of the residual series. This step ensures that the simulated values match the distributional properties (e.g., t-distribution) of the original residuals. Mathematically, for each asset, this transformation is expressed as:
where is the inverse CDF corresponding to the distribution of the standardized residuals in the context of one-step-ahead forecasting.
4) After transforming the pseudo copula values into standardized residuals, the estimated GARCH model is employed to forecast the returns for each asset. The return forecast for asset i is given by:
where is the forecasted conditional volatility from the GARCH model. The model simulates a number of time steps based on the chosen time horizon.
5) The cumulative return of the portfolio is then derived from the simulated returns for each component. This simulation process is repeated multiple times, producing a distribution of potential portfolio returns over the specified time horizon. From this distribution, the VaR is calculated, representing the maximum expected loss over the chosen period at a given confidence level.
3. Numerical application
In this section, the previously described methodology is applied to an empirical dataset. The aim is to compute the one-year VaR for different compositions of the porfolio by using the GARCH-Vine copula model. The R-Vine model is implemented using the VineCopula package developed by [27]. The forecasted conditional volatility is derived from the GARCH(1,1) model, and the simulation process is executed over 252 steps to estimate cumulative returns for the one-year time horizon. By generating 10,000 simulations, we obtain a distribution of simulated one-year cumulative returns. From this distribution, the VaR is calculated with a confidence level of , in linee with the requirements of the Solvency II framework for determining the SCR for equity risk.
3.1. Data and Descriptive Statistics
The analysis is conducted on close-to-close daily log-returns of sixteen companies listed on the London Stock Exchange. Raw stock data was sourced from finance.yahoo.com website for the period spanning from January 1, 2018, to December 31, 2022. Relative ESG scores were obtained from Bloomberg to select the top eight companies and the bottom eight companies based on their average ESG scores over the five-year period considered.
Table 1 presents the ESG scores and sector classifications of the portfolio’s components. The data reveals a diverse range of industries, from Beverages and Real Estate Investment Trusts to Oil & Gas Producers and Mining. Notably, companies like Diageo (7.20) and British Land Company (7.10) exhibit high ESG scores, indicating strong sustainability practices. In contrast, companies such as Frasers Group (1.96) and Howden Joinery Group (2.45) have lower scores, reflecting more significant ESG challenges. In addition, it is worth noting that the Financial Services sector exhibits a wide range of ESG scores, reflecting diverse approaches to sustainability within the industry. For example, the London Stock Exchange Group, with an ESG score of 6.38, demonstrates a strong commitment to ESG practices. In contrast, Beazley Group, with a significantly lower ESG score of 2.58, highlights the sector’s variability and suggests that some companies may have more significant ESG-related challenges. Overall, Table 1 underscores the significant variability in ESG scores across different industries, offering valuable insights for investors and stakeholders interested in sector-specific ESG practices.
To complement this analysis, Table 2 reports the descriptive statistics for all return series associated with the portfolio.
As depicted in Figure 2, it is evident that all close-to-close daily log-returns exhibit sufficient stationarity, fluctuating around a common level.
Notably, significant return changes are followed by larger changes, while smaller changes are followed by smaller ones, indicating volatility clustering, a characteristic captured by GARCH models. In essence, the series display conditional heteroskedasticity.
Moreover, Table 2 highlights heavy tails, high kurtosis, and serial correlation across the series. The skewness values differ from zero, implying asymmetric distribution. Specifically, many series exhibit negative skewness, suggesting longer left tails than right tails. The exceptionally high kurtosis values indicate leptokurtosis, signifying heavier tails compared to a normal distribution. Consistent with these statistics, the high Jarque-Bera test statistics and low p-values reject the null hypothesis of normality for all analyzed series.
Furthermore, considering the validity of the GARCH process with correlated squared residuals, the Box-Pierce test on squared returns at lag 5 rejects the null hypothesis of no serial autocorrelation due to very low p-values, indicating non-zero autocorrelations up to the tested lags. Lastly, the Augmented Dickey-Fuller test confirms stationarity, rejecting the unit root hypothesis and confirming no need for differentiation. In the next section, the serial correlation identified in the previous test is modeled through the GARCH model, which assumes autoregressive behavior in conditional variance.
3.2. Model Estimation and Results
Firstly, the optimal time series model needs to be identified and selected. A GARCH(1,1) model is applied across all series due to the statistical significance of all coefficients, aiming to maintain model simplicity. Consistent with earlier findings, the errors are assumed to follow a t-distribution.
Following the calculation process, as described in Section 2.3, the GARCH model was calibrated in order to obtain standardized residuals, subsequently transformed into pseudo copula values. Figure 3 shows the corresponding pairwise normalized contour plots for the sixteen assets.
The bivariate correlations are measured in terms of Kendall’s tau, which is a non-linear measure of dependence that ranges between [-1,1]. The correlation among series is not very strong, except for the correlation between Shell (SHEL) and Bp plc (BP), which is 0.71. This is not surprising since they belong to the same sector of oil and gas. Most of the series do not hold independence but only an imperfect positive dependence. Additionally, bivariate distributions tend to exhibit elliptical shapes with varying tail dependence structures and central symmetry, underscoring the suitability of the t-copula in pair copula constructions.
The R-Vine model is used to describe the joint distribution among univariate residual time series. Although our fitted model includes 15 estimated trees, we limit the presentation to the first two because of space limitations. The initial trees are more representative as they describe the strongest direct dependencies between the variables, capturing the primary relationships within the system. In fact, the R-Vine model builds a hierarchy of dependencies, where the first tree captures the fundamental relationships and the subsequent trees refine these connections by adding conditional levels.
The estimation results of pairwise copula families for Tree 1 and Tree 2 are provided in Table 3 and Table 4, respectively, while Figure 4 and Figure 5 show the corresponding graphical representations, along with the fitted Kendall’s tau.
In Table 3, the "conditioned" column presents the variables directly involved in each copula pair. For our portfolio stocks, the t-student copula consistently emerges as the optimal choice, indicating symmetric dependency patterns within the British financial market. The "parameters" column provides the estimated coefficients, offering insights into the strength and nature of these dependencies. The first coefficient represents the correlation parameter, while the second corresponds to the degrees of freedom, which vary considerably, ranging from 4.06 to 14.29. This wide range suggests diverse tail behaviors among the pairs, a variability that can not be fully captured by a single t-student copula, which only allows for one parameter of degrees of freedom.
In Figure 4, the St James’s Place (STJ) stock emerges as a significant node within the dependence network. This observation is also supported by the C-Vine structure analysis, which identifies STJ as the root node. It is important to note that the selection of the root node is optimized to maximize the sum of pairwise dependencies. Therefore, STJ plays a crucial role in driving the performance of our stock portfolio, which aligns with the prominent position of the banking sector in the British economy. A comparison of Figure 1 with Figure 4 and Figure 5 reveals the differences in the tree structures arising from the application of C-Vine and R-Vine copulas.
Furthermore, Table 4 includes a "conditioning" column, representing the variables acting as conditioning factors within the Vine structure and appearing only from the second tree onward. These variables have already established a relationship at the previous level of the tree structure and are now conditioning the dependence between the "conditioned" variables. As shown in Table 4, Tree 2 includes non-elliptical pair copula families, yet the dependency strength, as indicated by Kendall’s tau values, is relatively weak and diminishes further in subsequent trees. Specifically, we observe Gaussian, Clayton, and Gumbel copulas, each of which presents a single parameter value. For the Gaussian copula, this value represents the correlation coefficient, which varies between , allowing it to capture a wide range of dependence, from perfect negative correlation to perfect positive correlation. Similarly, for the Clayton and Gumbel copulas, the single parameter reflects the dependence structure’s specific characteristics: in the case of the Clayton copula, which has a parameter , the value indicates the degree of lower tail dependence. For the Gumbel copula, with a parameter constrained to , it characterizes the upper tail dependence. Despite the presence of these alternative copula families, even in the second tree, the t-student copula remains the most frequently selected option across the conditional pairs, with corresponding degrees of freedom reaching up to 24.83. In subsequent trees (), even larger estimated degrees of freedom are observed, indicating a reduction in tail dependence for these conditional pairs.
The fitted R-vine model is then utilized to simulate cumulative returns in order to forecast the one-year VaR for four different portfolio compositions, following the procedure outlined in Section 2.3. The initial total value of the portfolio at the start of forecasting is assumed to be £100 million. Portfolio 1 consists of an equal-weighted selection of 16 stocks: the top 8 and bottom 8 companies ranked by ESG scores within the FTSE 100 (London Stock Exchange). Portfolio 2 increases investments in stocks with the highest ESG scores by 10%, while decreasing investments in stocks with the lowest ESG scores by 10%. Portfolio 3 follows the same strategy but with a 20% adjustment, and Portfolio 4 with a 30% adjustment. In addition, the same procedure is computed for the sub-period that goes from January 31, 2020 to the end of 2022. It allows to isolate the effects of the COVID crisis.
Table 5 shows the VaR values for the different portfolios, along with their respective percentage changes. The latter are computed using the VaR of Portfolio 1 as the baseline. As per convention, VaR is reported as a positive value. It can be observed that an increase in green assets, at the expense of those with a low ESG level, results in a reduction of the one-year VaR. It is easy to see from the last column how, during periods of crisis, investors should direct their choices towards sustainable investments, which are more resilient to market variations. In fact, when the period is characterized by stressed market conditions, an increment in the portion of the highest ESG assets implies a stronger reduction in the VaR compared to the period that also includes normal market conditions (2018-2022). For example, by looking at Portfolio 2, an increase of 10 % of the best ESG stocks (and a corresponding decrease in the share invested in the worst ESG stocks) allows a decrease in the VaR of 3.16 % for the period from 2018 to 2022. The same change in the portfolio composition results in a reduction of 5.89% in the VaR for the period from 2020 to 2022.
4. Conclusions
This study is intended to serve as a foundational exploration of the relationship between ESG scores and VaR within a Vine copula framework. While numerous articles have demonstrated the efficacy of the Vine model in predicting VaR, few have explored its potential for reducing the latter through sustainable investments.
Specifically, this paper emphasizes that increasing investments in top-performing ESG stocks can reduce overall portfolio market risk. This effect is particularly pronounced during periods of market stress, when investors should consider sustainable options that enhance portfolio resilience.
Moreover, the portfolio’s VaR is calibrated as required by the Solvency II Directive for the calculation of the SCR. It paves the way for using the GARCH-Vine as an internal model and anticipating the possible relationship between ESG scores and solvency.
In light of these results, future research could build on this study by incorporating a time-varying covariate, enabling the use of a "conditional copula" approach. This would introduce an innovative dimension to the analysis, offering deeper insights into how dynamic factors influence the relationship between ESG scores and VaR. Furthermore, expanding the analysis to include a larger dataset of stocks or financial instruments would bolster the evidence supporting the proposed thesis and provide a more comprehensive understanding of how ESG investments impact portfolio risk management.
Author Contributions
Conceptualization: S.D. and R.B.; Methodology: S.D.; Formal analysis: S.D.; Investigation: S.D.; Writing—original draft preparation: S.D. and B.R.; Writing—review and editing: S.D. and B.R.; supervision: B.R. All authors have read and agreed to the published version of the manuscript.
Funding
This research received no external funding.
Data Availability Statement
The financial market data are available from finance.yahoo.com website. The ESG data are available for download from Bloomberg.
Conflicts of Interest
The author declares no conflicts of interest.
References
- Bedford, T.; Cooke, R.M. 2002. A new graphical model for dependent random variables. Annals of Statistics 30: 1031–1068.
- Bollerslev, T. 1986. Generalized Autoregressive Conditional Heteroskedasticity. Journal of Econometrics 31: 307–327.
- Brechmann, E.C., and Czado, C. 2013. Risk Management with High-Dimensional Vine Copulas: An Analysis of the Euro Stoxx 50. Statistics & Risk Modeling 30: 307–342. [CrossRef]
- Christoffersen, P. 1998. Evaluating Interval Forecasts. International Economic Review 39: 841–862.
- Cochrane, J.H. 2001. Asset Pricing. New York: Princeton University Press.
- Czado, C. Analyzing Dependent Data with Vine Copulas: A Practical Guide with R.. Cham: Springer.
- Czado, C., and Nagler, T. Vine Copula Based Modeling. 2022. Annual Review of Statistics and Its Application 9: 453–477.
- Czado, C., Bax, K., Sahin, O., Nagler, T., Min, A., and Paterlini, S. Vine copula based dependence modeling in sustainable finance. 2023. The Journal of Finance and Data Science 8: 309–330.
- Dißmann, J., Brechmann, E.C., and Czado, C. 2013. Selecting and estimating regular vine copulae and application to financial returns. Computational Statistics & Data Analysis 59: 52–69.
- Engle, R.F., and Manganelli, J. 2004. CAViaR: Conditional Value-at-Risk by Regression Quantiles. Journal of Banking & Finance 28: 1587–1605.
- Engle, R.F. 1982. Autoregressive Conditional Heteroscedasticity with Estimates of the Variance of United Kingdom Inflation. Econometrica 50: 987–1007.
- European Commission. Sustainable Finance Disclosures Regulation. Available online: https://finance.ec.europa.eu/regulation-and-supervision/financial-services-legislation/implementing-and-delegated-acts/sustainable-finance-disclosures-regulation_en (accessed on 29 September 2024).
- Freedman, D.A. 1981. Conditional Probability and the Probability Integral Transform. The Annals of Statistics 9: 121–13.
- Friede, G., Busch, T., and Bassen, A. 2015. ESG and financial performance: aggregated evidence from more than 2000 empirical studies. Journal of Sustainable Finance & Investment 5: 210–233. [CrossRef]
- McNeil, A.J., and Frey, R. 2000. Estimation of Tail-Related Risk Measures for Heteroskedastic Financial Time Series: An Application to Risk Management. Journal of Risk 2: 31–55.
- Joe, H. 1996. Families of m-variate distributions with given margins and m (m-1)/2 bivariate dependence parameters. Lecture Notes-Monograph Series: 120–141.
- Joe, H. 2014. Dependence Modeling with Copulas. Boca Raton, FL: Chapman and Hall/CRC.
- Jorion, P. 2009. Value at Risk: The New Benchmark for Managing Financial Risk (3rd ed). New York: McGraw-Hill.
- Kurowicka, D., and Cooke, R.M. 2006. Uncertainty Analysis with High Dimensional Dependence Modelling. Chichester: John Wiley.
- Lee, T.H., and Long, X. 2009. Copula-Based Multivariate GARCH Model: Specification, Estimation and Goodness of Fit. Econometric Reviews 28: 88–111.
- Min, A., and Czado, C. 2014. Bayesian Inference for Multivariate Copulas Using Pair-Copula Constructions with Applications to Financial Returns. Journal of Financial Econometrics 12: 599–654.
- McNeil, A.J., Frey, R., and Embrechts, P. 2015. Quantitative Risk Management: Concepts, Techniques, and Tools. Princeton: Princeton University Press.
- Nagler, T., Krüger, D., and Min, A. 2022. Stationary vine copula models for multivariate time series. Journal of Econometrics 227: 305–324.
- Nelsen, R.B. 1999. An introduction to copulas. New York: Springer.
- Patton, A.J. A review of copula models for economic time series. 2012. Journal of Multivariate Analysis 110: 4–18.
- Rockinger, M., and Jondeau, E. 2002. Conditional Dependency of Financial Series: An Application of Copulas. Journal of International Money and Finance 21: 827–853.
- Schepsmeier, U., Stoeber, J., Brechmann, E.C., Gräler, B., Nagler, T., and Erhardt, T. 2018. VineCopula: Statistical Inference of Vine Copulas. Version 2.1.6. https://cran.r-project.org/package=VineCopula.
- Sklar, A. 1959. Fonctions de répartition à n dimensions et leurs marges. Publications de l’Institut de Statistique de l’Université de Paris 8: 229–231. [CrossRef]
- Tsay, R.S. 2005. Analysis of Financial Time Series (2nd ed.). Hoboken: Wiley.
- Zhou, K. 2024. The relationship between financial performance and ESG: Evidence from Bloomberg. Highlights in Business, Economics and Management 37: 297–305. [CrossRef]
Figure 1.
Example of C-Vine structures for .
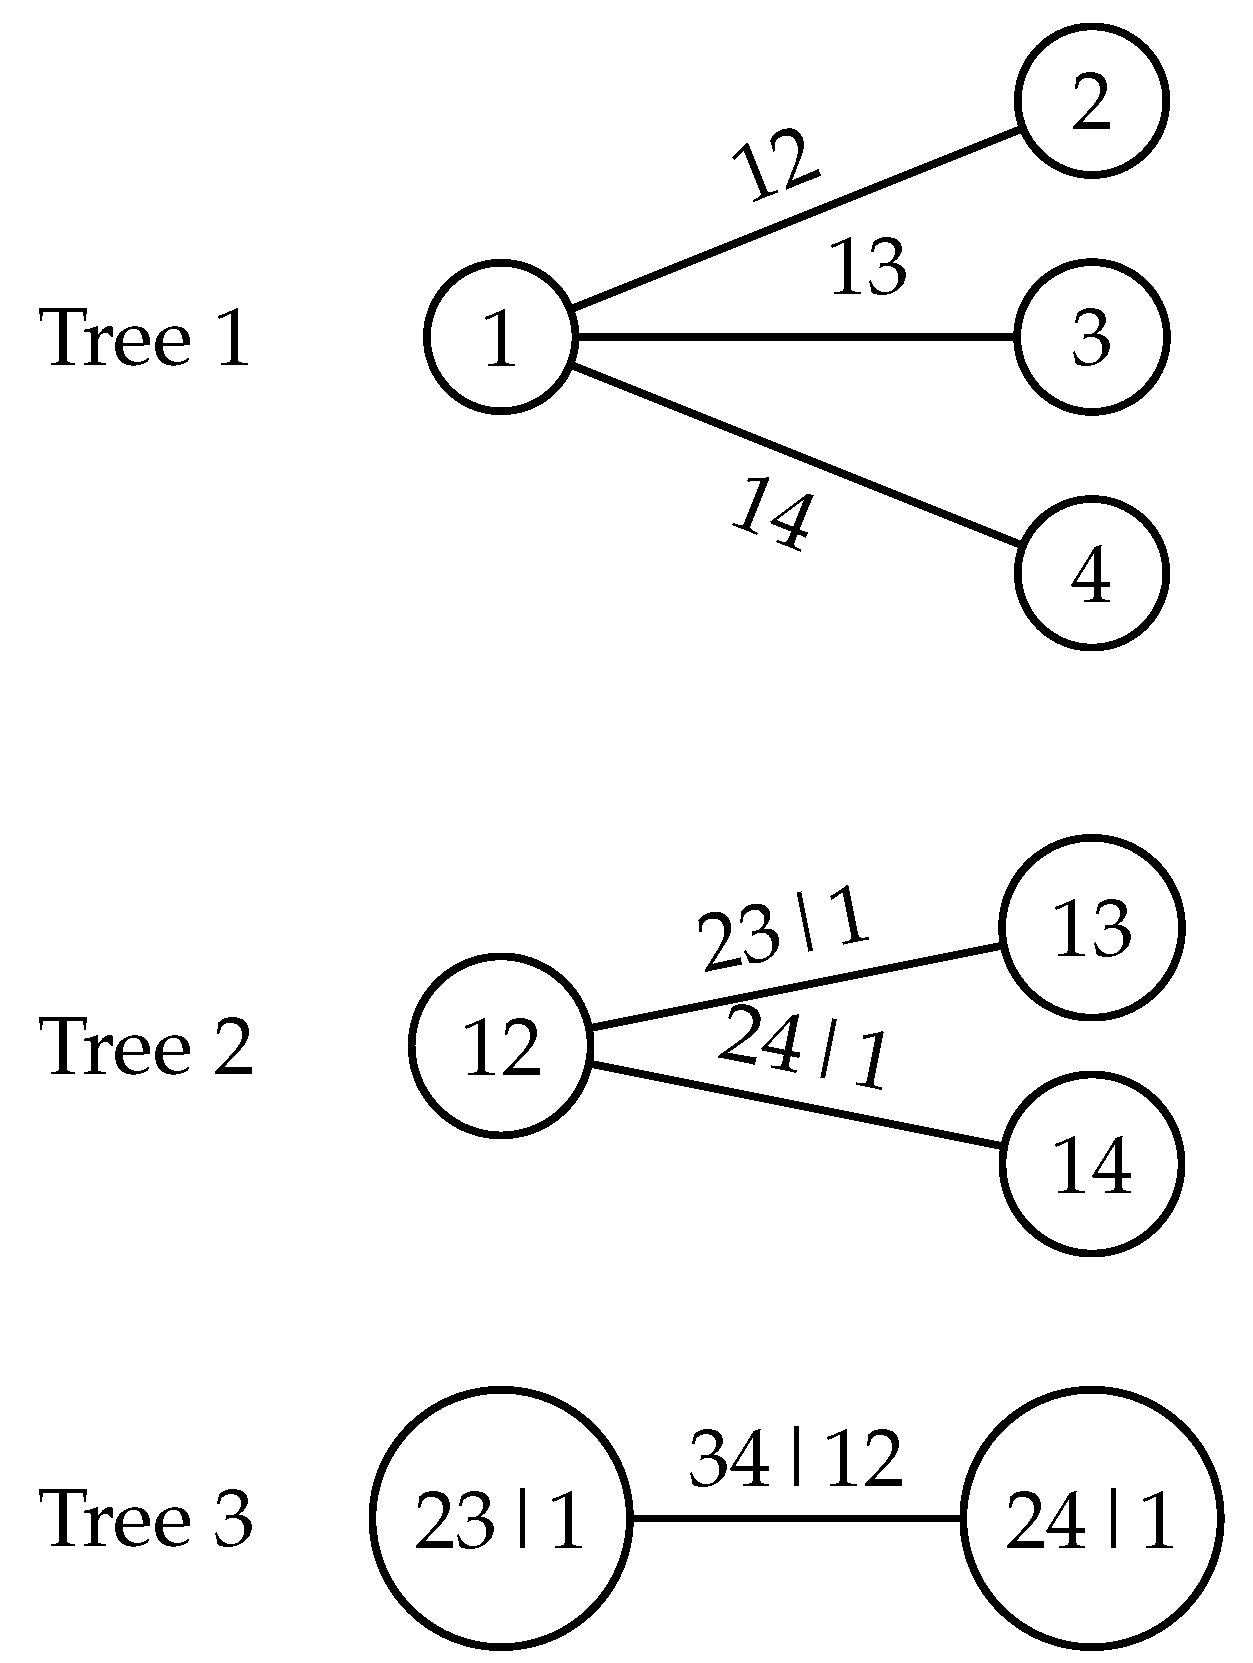
Figure 2.
Daily log-returns.
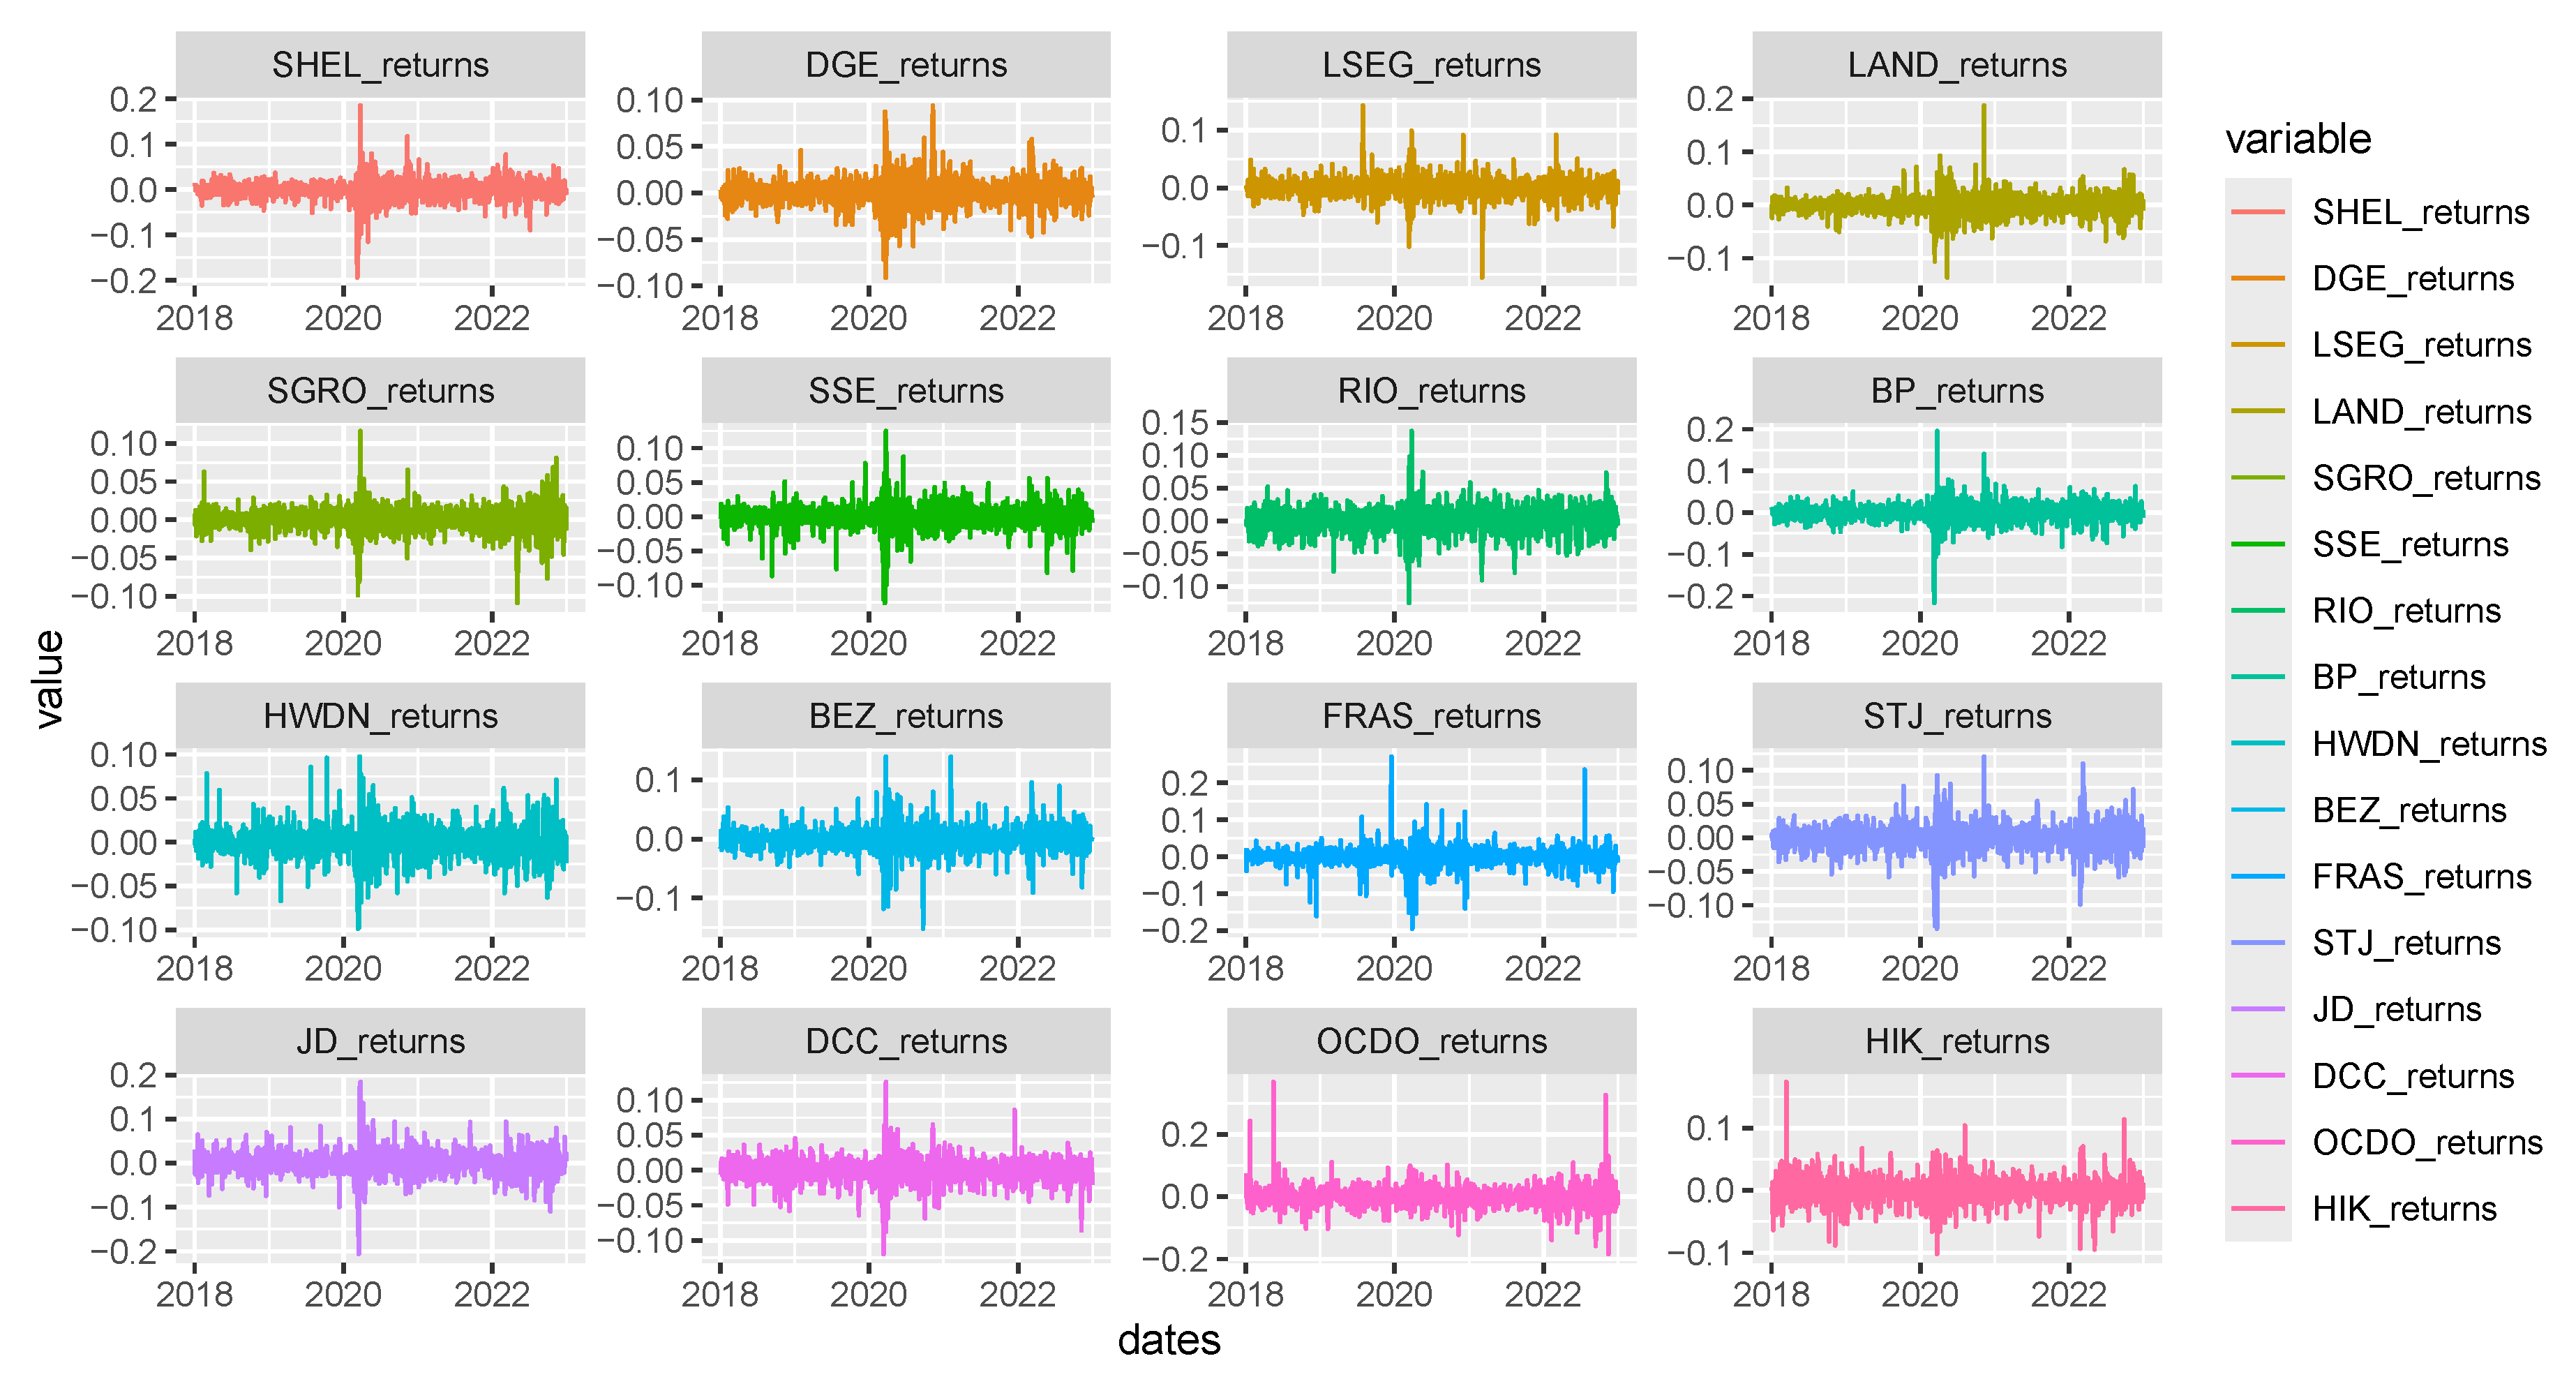
Figure 3.
Pairwise normalized contour plots.
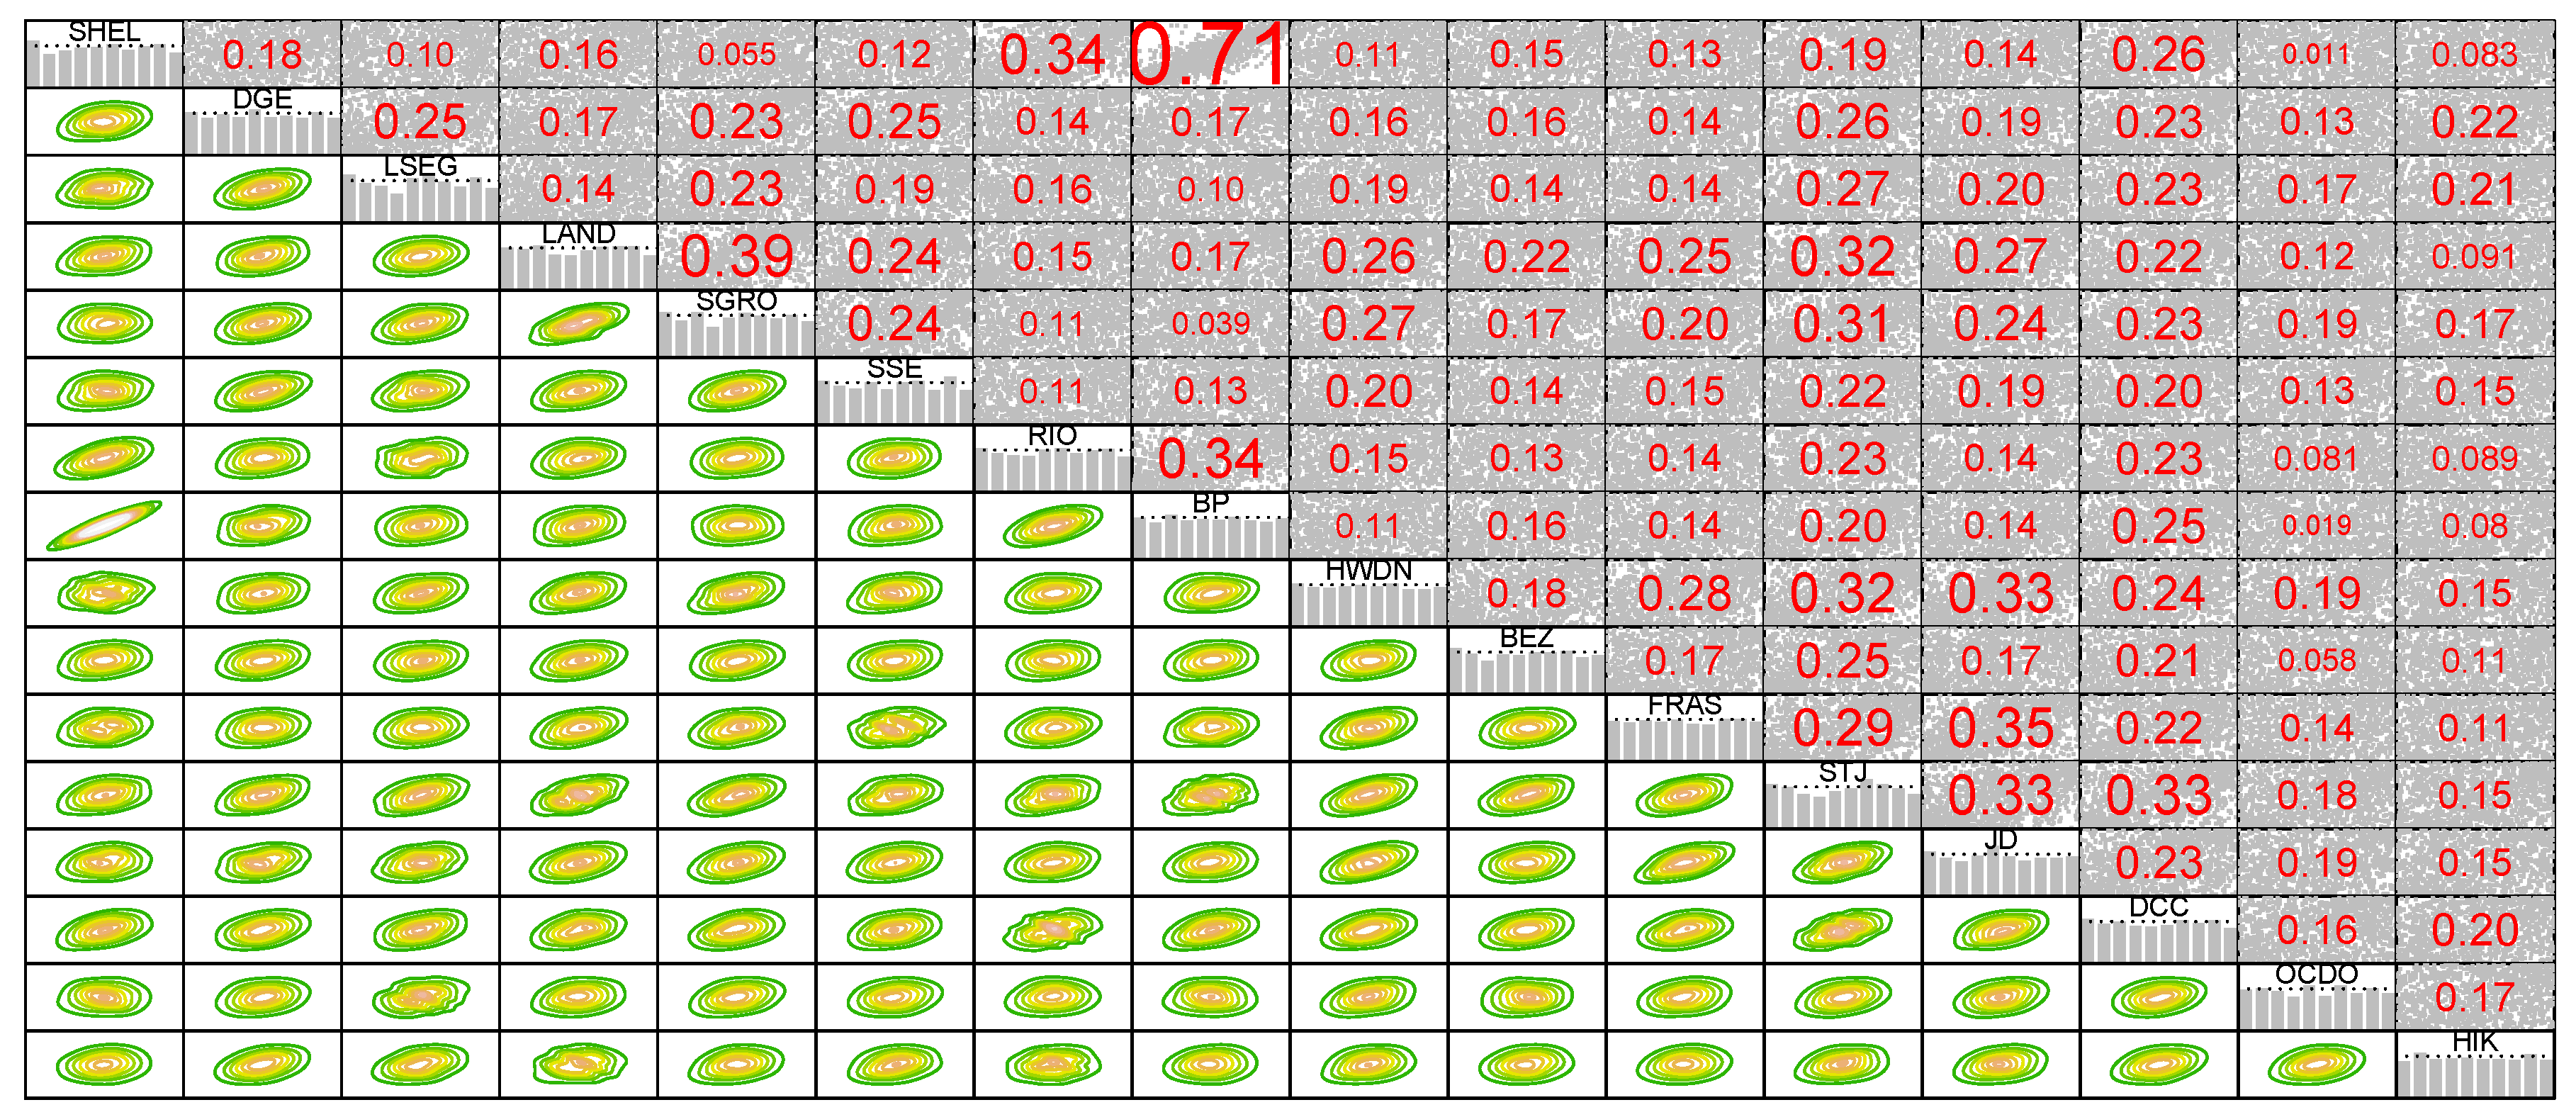
Figure 4.
The first tree structure of estimated R-Vine and Kendall’s tau values for each connected pair of stocks.
Figure 4.
The first tree structure of estimated R-Vine and Kendall’s tau values for each connected pair of stocks.
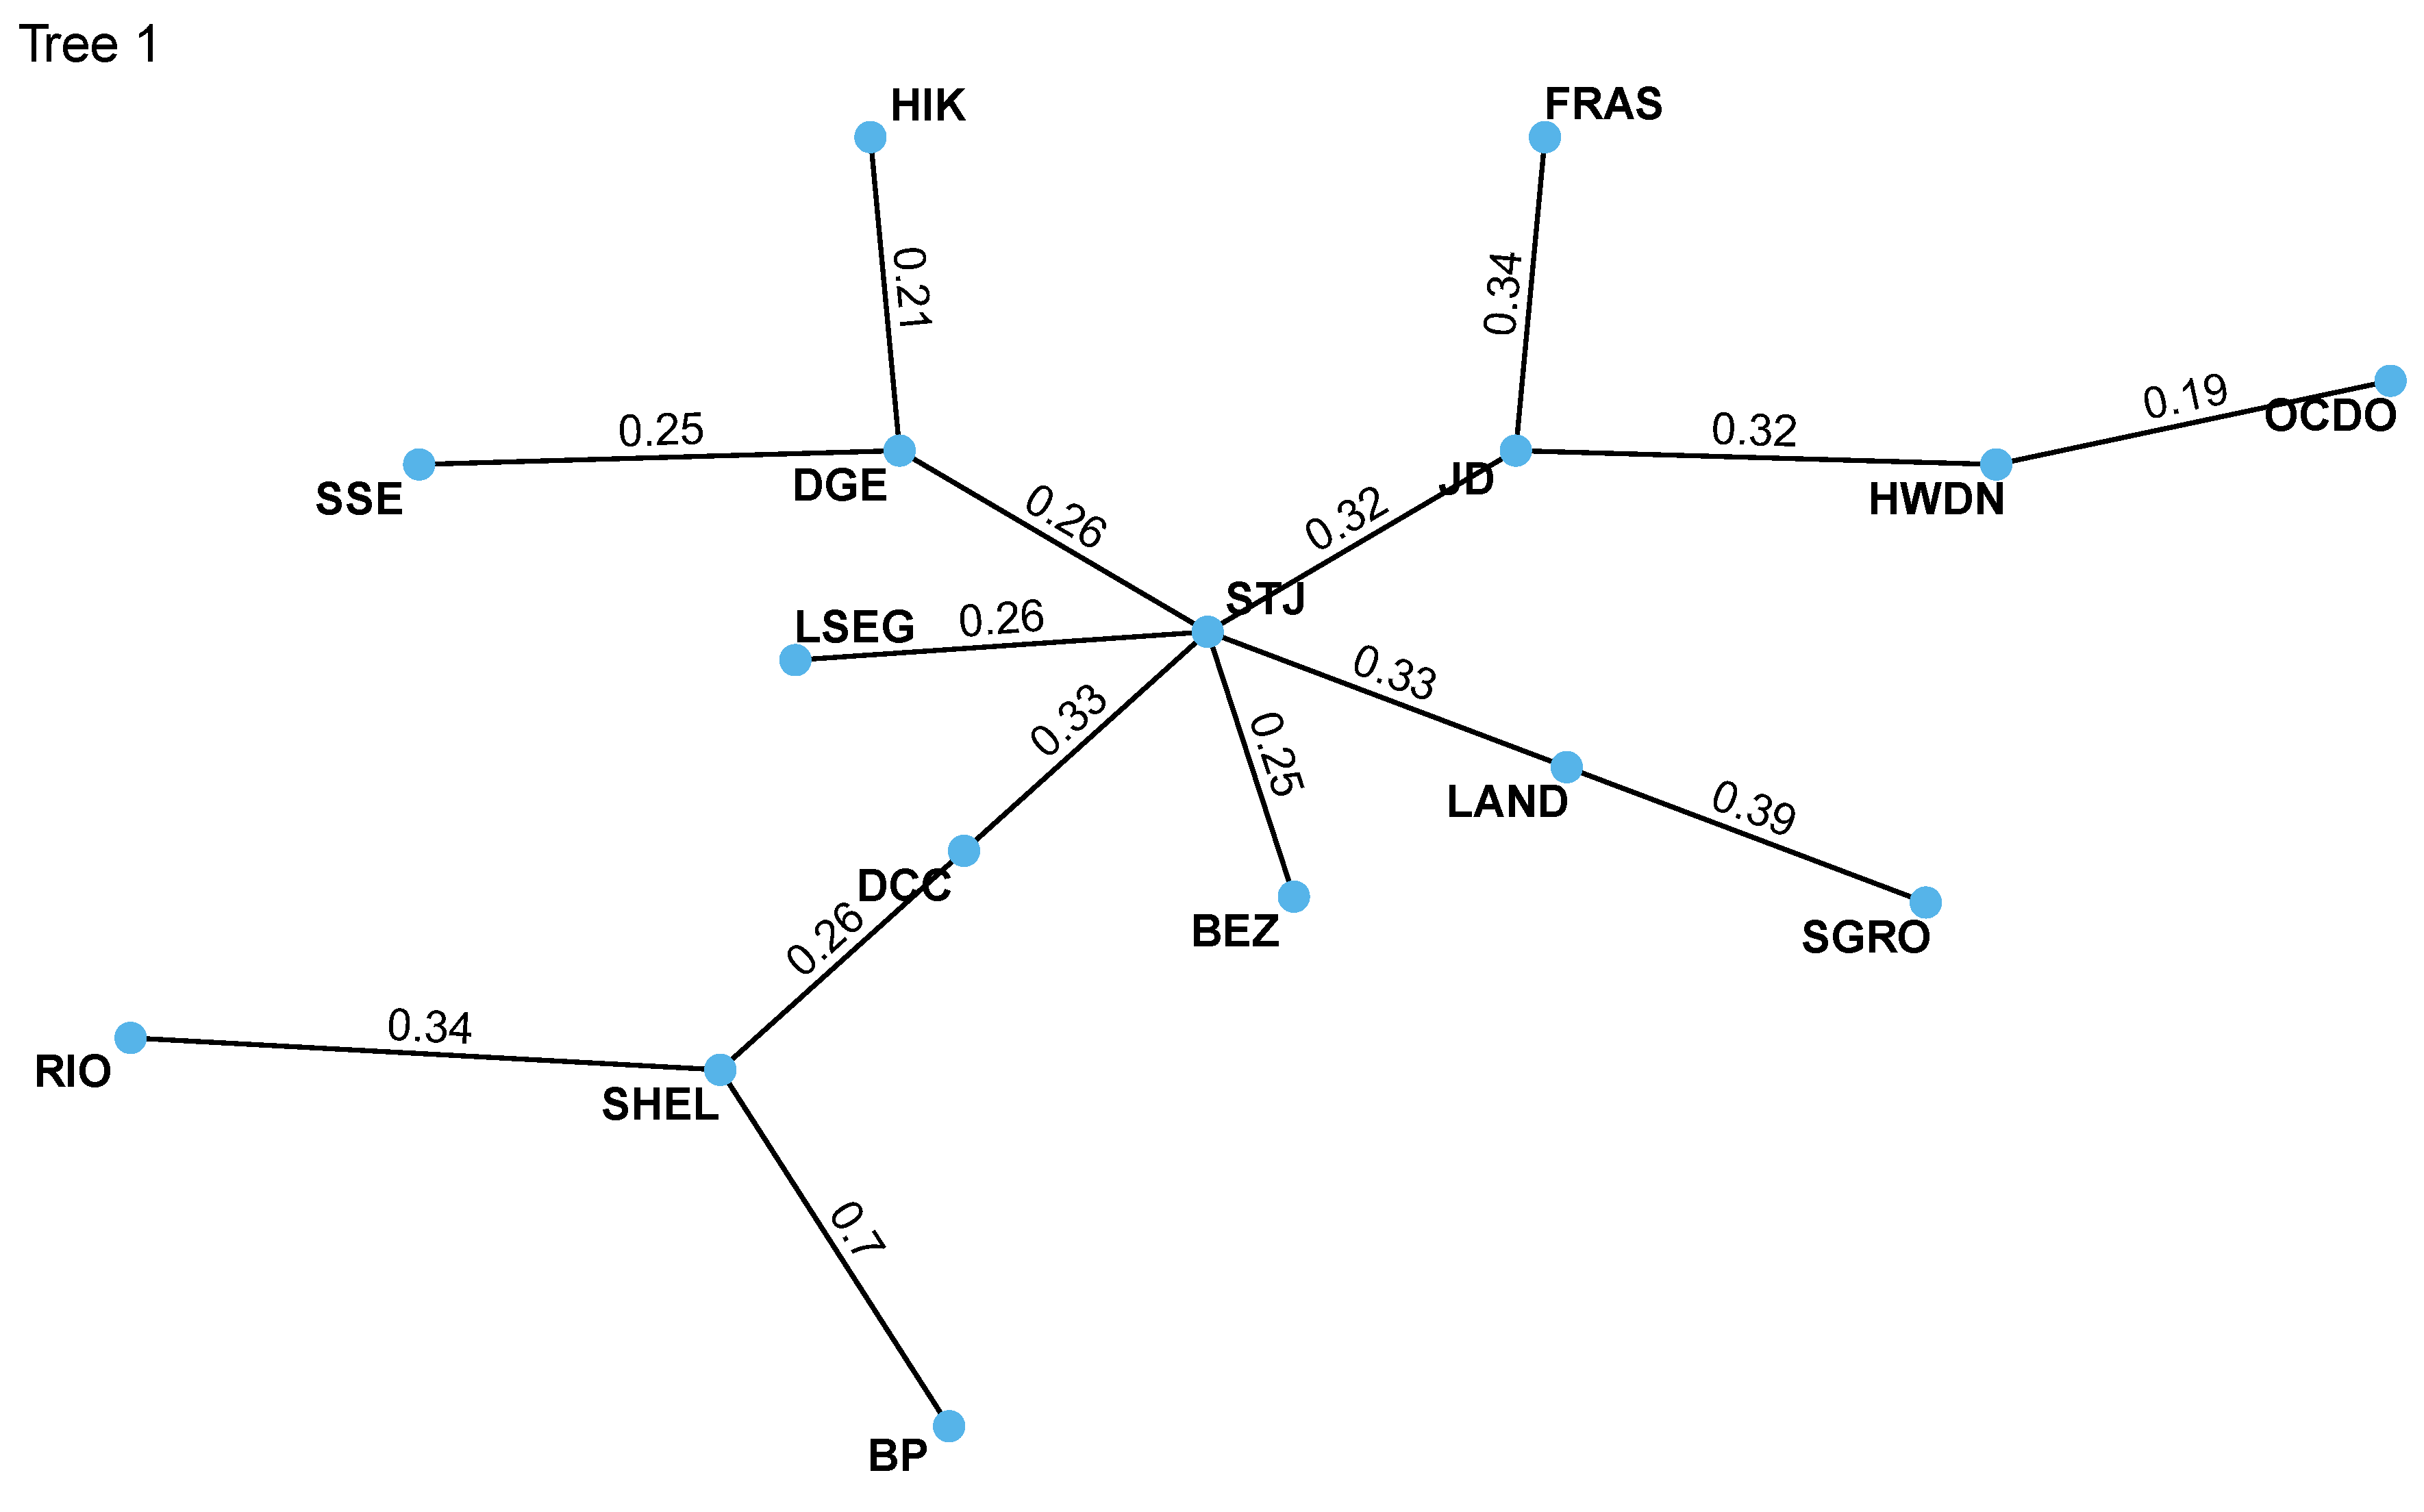
Figure 5.
The second tree structure of estimated R-Vine and Kendall’s tau values for each connected pair of stocks.
Figure 5.
The second tree structure of estimated R-Vine and Kendall’s tau values for each connected pair of stocks.
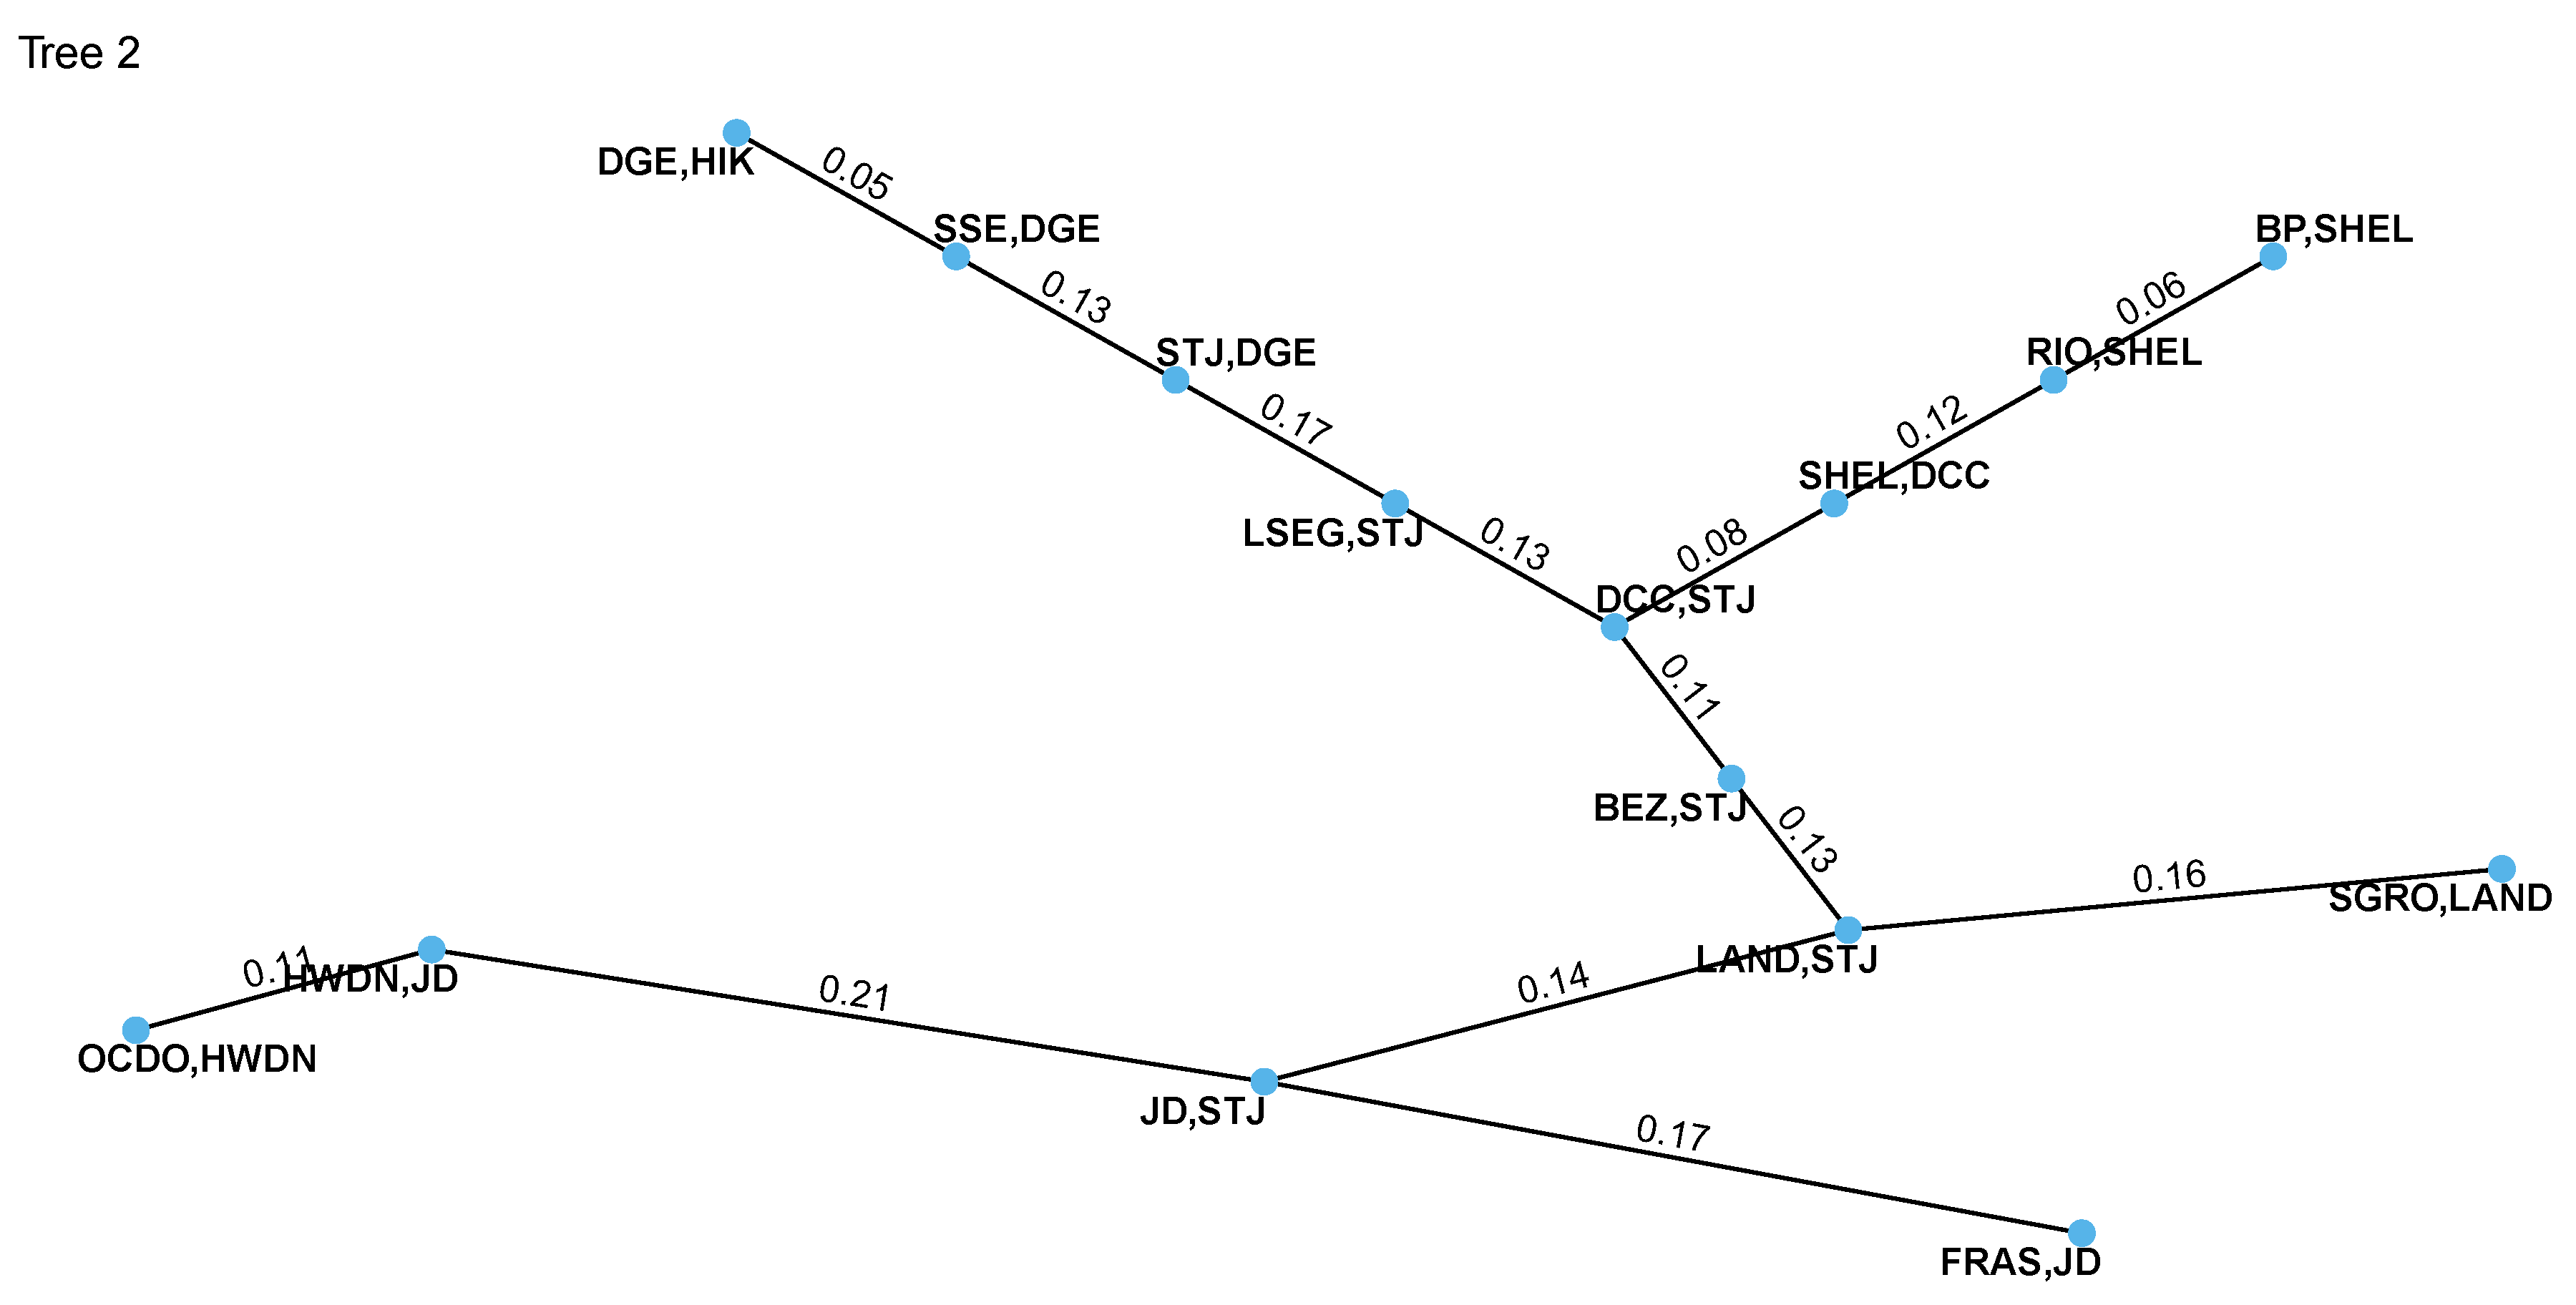

Table 1.
Companies included in our dataset and the corresponding ESG scores.
| Company | Sector | ESG Score |
|---|---|---|
| Top 8 Companies by ESG Score | ||
| Diageo | Beverages | 7.20 |
| British Land Company | Real Estate Investment Trusts | 7.10 |
| Shell | Oil & Gas Producers | 6.80 |
| London Stock Exchange Group | Financial Services | 6.38 |
| Segro | Real Estate Investment Trusts | 6.12 |
| Rio Tinto Group | Mining | 6.16 |
| Scottish and Southern Energy | Electricity | 6.04 |
| BP plc | Oil & Gas Producers | 6.03 |
| Bottom 8 Companies by ESG Score | ||
| Hikma Pharmaceuticals | Pharmaceuticals | 2.70 |
| Ocado | Food Retailers | 2.68 |
| St James’s Place | Life Insurance | 2.61 |
| Beazley Group | Financial Services | 2.58 |
| JD Sports | General Retailers | 2.57 |
| DCC plc | Support Services | 2.49 |
| Howden Joinery Group | Supplier Company | 2.45 |
| Frasers Group | General Retailers | 1.96 |
Table 2.
Summary statistics of the daily log-returns.
| Mean | SD | Skewness | Kurtosis | J-B | ADF | Box-Pierce | |
|---|---|---|---|---|---|---|---|
| DGE | 0.0003 | 0.0143 | 0.1267 | 6.7194 | 2350.8* | -11.08** | 567.71* |
| LAND | -0.0004 | 0.0195 | 0.4340 | 10.7262 | 6017.7* | -10.28** | 50.79* |
| SHEL | -0.0001 | 0.0218 | -0.5397 | 13.9875 | 10225* | -10.64** | 269.34* |
| LSEG | 0.0005 | 0.0181 | -0.1246 | 10.4447 | 5672.2* | -10.32** | 69.51* |
| SGRO | 0.0002 | 0.0159 | -0.3711 | 7.6982 | 3109.2* | -10.55** | 229.77* |
| RIO | 0.0003 | 0.0200 | -0.1805 | 4.2049 | 926.84* | -10.48** | 127.79* |
| SSE | 0.0003 | 0.0180 | -0.6395 | 8.6053 | 3933.7* | -10.43** | 606.97* |
| BP | -0.0001 | 0.0227 | -0.2400 | 13.9384 | 10105* | -11.27** | 149.48* |
| HIK | 0.0003 | 0.0209 | 0.3462 | 6.4563 | 2192.2* | -10.26** | 28.77* |
| OCDO | 0.0006 | 0.0343 | 1.6759 | 20.1201 | 21610* | -10.83** | 5.50* |
| STJ | 3.258e-05 | 0.0197 | -0.2129 | 6.6809 | 2330.1* | -10.24** | 170.21* |
| BEZ | 0.0002 | 0.0218 | -0.1289 | 7.6376 | 3035.8* | -10.70** | 163.2* |
| JD | 0.0007 | 0.0278 | -0.1095 | 9.8970 | 5092.8* | -10.56** | 931.81* |
| DCC | -0.0004 | 0.0172 | -0.2778 | 6.9216 | 2506.8* | -10.64** | 299.63* |
| HWDN | 0.0002 | 0.0190 | 0.0183 | 3.9096 | 795.62* | -10.57** | 361.97* |
| FRAS | 0.0005 | 0.0279 | 0.2923 | 17.8594 | 16586* | -8.96** | 14.85* |
Note: p-value less than 2.2e-16 *, p-value less than 0.01 **.
Table 3.
Tree 1: Vine structure results.
| conditioned | copula’s family | parameters | Kendall’s tau | loglik |
|---|---|---|---|---|
| 5, 4 | t-student | 0.57, 6.30 | 0.3854 | 251.76 |
| 15, 9 | t-student | 0.29, 11.66 | 0.1863 | 52.82 |
| 11, 13 | t-student | 0.51, 7.65 | 0.3431 | 192.31 |
| 9, 13 | t-student | 0.48, 7.92 | 0.3212 | 164.49 |
| 13, 12 | t-student | 0.49, 11.10 | 0.3234 | 168.32 |
| 4, 12 | t-student | 0.49, 6.81 | 0.3262 | 183.81 |
| 8, 1 | t-student | 0.89, 4.06 | 0.7038 | 998.48 |
| 7, 1 | t-student | 0.51, 14.29 | 0.3414 | 187.09 |
| 1, 14 | t-student | 0.4, 10.1 | 0.2649 | 117.72 |
| 10, 12 | t-student | 0.38, 6.66 | 0.2464 | 101.06 |
| 14, 12 | t-student | 0.5, 7.5 | 0.3319 | 183.41 |
| 3, 12 | t-student | 0.39, 10.50 | 0.2585 | 102.64 |
| 12, 2 | t-student | 0.39, 4.00 | 0.2553 | 138.16 |
| 6, 2 | t-student | 0.38, 6.25 | 0.2516 | 105.83 |
| 2, 16 | t-student | 0.33, 8.15 | 0.2135 | 74.74 |
Note: SHEL=1, DGE=2, LSEG=3, LAND=4, SGRO=5, SSE=6, RIO=7, BP=8, HWDN=9, BEZ=10, FRAS=11, STJ=12,
Table 4.
Tree 2: Vine structure results.
| conditioned | conditioning | copula’s family | parameters | Kendall’s tau | loglik |
|---|---|---|---|---|---|
| 5, 12 | 4 | t-student | 0.25, 24.33 | 0.1632 | 40.28 |
| 15, 13 | 9 | gaussian | 0.17 | 0.1081 | 18.44 |
| 11, 12 | 13 | gaussian | 0.26 | 0.1694 | 44.92 |
| 9, 12 | 13 | t-student | 0.33, 7.28 | 0.2129 | 80.48 |
| 13, 4 | 12 | t-student | 0.21, 22.89 | 0.1355 | 29.05 |
| 4, 10 | 12 | gaussian | 0.20 | 0.1305 | 26.38 |
| 8, 7 | 1 | clayton | 0.13 | 0.0621 | 10.20 |
| 7, 14 | 1 | t-student | 0.19, 17.94 | 0.1245 | 24.48 |
| 1, 12 | 14 | clayton | 0.18 | 0.0813 | 13.21 |
| 10, 14 | 12 | t-student | 0.18, 16.99 | 0.1122 | 20.91 |
| 14, 3 | 12 | t-student | 0.20, 14.70 | 0.1273 | 26.08 |
| 3, 2 | 12 | t-student | 0.27, 12.41 | 0.1723 | 47.18 |
| 12, 6 | 2 | t-student | 0.21, 22.17 | 0.1319 | 27.09 |
| 6, 16 | 2 | gumbel | 1.1 | 0.0539 | 6.02 |
Table 5.
VaR over a one-year horizon at a 99.5% confidence level for different portfolio compositions.
Table 5.
VaR over a one-year horizon at a 99.5% confidence level for different portfolio compositions.
| 2018-2022 VaR | 2018-2022 VaR changes | 2020-2022 VaR | 2020-2022 VaR changes | |
|---|---|---|---|---|
| Portfolio 1 | 29.73 | - | 32.25 | - |
| Portfolio 2 | 28.78 | -3.16% | 30.35 | -5.89% |
| Portfolio 3 | 27.84 | -8.24% | 29.13 | -9.67% |
| Portfolio 4 | 26.89 | -9.55% | 27.93 | -13.4% |
Disclaimer/Publisher’s Note: The statements, opinions and data contained in all publications are solely those of the individual author(s) and contributor(s) and not of MDPI and/or the editor(s). MDPI and/or the editor(s) disclaim responsibility for any injury to people or property resulting from any ideas, methods, instructions or products referred to in the content. |
© 2024 by the authors. Licensee MDPI, Basel, Switzerland. This article is an open access article distributed under the terms and conditions of the Creative Commons Attribution (CC BY) license (http://creativecommons.org/licenses/by/4.0/).
Copyright: This open access article is published under a Creative Commons CC BY 4.0 license, which permit the free download, distribution, and reuse, provided that the author and preprint are cited in any reuse.


