Submitted:
07 October 2024
Posted:
08 October 2024
Read the latest preprint version here
Abstract
Background/Objectives: Prospective cohort studies are useful for studying how biomolecular status affects risk of adverse health outcomes. Less well known is that the longer the follow-up time, the lower the apparent effect due to “regression dilution.” Here we evaluate how follow-up time affects the relationship between serum 25-hydroxyvitamin D [25(OH)D] concentration and incidence of stroke and major cardiovascular events (MCEs). Methods: Findings regarding the relative risk (RR) of stroke and MCEs with respect to serum 25(OH)D concentrations at baseline from prospective cohort studies were plotted against mean follow-up time. Fifteen studies from mainly European countries and the United States were used for stroke, with nine studies for MCEs. Linear regression analyses were performed for follow-up periods of up to 10 years. Results: For stroke, the linear regression fit for 1–10 years is RR = 0.34 + (0.065 × follow-up [years]), r = 0.84, adjusted r2 = 0.67, p 20 ng/mL should be recommended for everyone likely to be at risk for stroke or MCE and indeed in the general population.
Keywords:
Cardiovascular disease
; causality
; follow-up period/time
; heart failure
; hemorrhagic
; hypertension
; ischemic
; prospective cohort study
; stroke
; vitamin D
1. Introduction
A type of observational study commonly used to assess the effect of dietary and lifestyle factors and biological parameters on health outcomes is the prospective cohort study. In this approach, participants are recruited and enrolled, information relevant to the study is obtained from each participant, the participants are followed for some period, and health outcomes are recorded. Afterwards, the health outcomes are compared statistically with respect to data obtained at the time of enrollment. Most such studies do not remeasure any of the parameters during the follow-up period. As a consequence, there is generally an underestimation of risk associations due to “regression dilution” in long-term follow-up of prospective studies as outlined by Clarke et al. in 1999 [1]. In that article, they reported repeated measurements over 25 years for systolic and diastolic blood pressure and blood cholesterol for participants in the Framingham Study. They demonstrated that the range from high to low for the first and fifth quantile shrunk by 65%,75%, and 57%, respectively. While this article had 897 citations by August 31, 2024 according to Google Scholar, it seems not to have had much impact on conduct of prospective cohort studies or, more importantly, meta-analyses of such studies. The effect of changes in serum 25-hydroxyvitamin D [25(OH)D] has been known for cancer since 2011 [2] and all-cause mortality rate since 2012 [3]. Yet the effect was overlooked in a highly-cited meta-analysis of risk of colorectal cancer with respect to serum 25(OH)D concentration in 2019 [4], as pointed out in 2022 [5].
Recently, it was demonstrated that the same effect is found for risk of cognitive impairment, dementia, and Alzheimer’s disease. The 2024 meta-analyses included 15 prospective studies regarding dementia and/or Alzheimer’s disease and nine regarding cognitive impairment [6]. As shown in plots of risk ratio for low vs. high 25(OH)D concentration vs. follow-up period, there were linear decreases in the regression fit to the data from near 2.0 for the shortest follow-up periods (near four-to-five years) to near 1.0 for follow-up periods near 13 years (Grant, submitted).
2. Materials and Methods
The data used in this article are the prospective cohort studies in Su et al. [7]. Table 1 lists the studies in ascending order of follow-up period. The table includes the OR/RR from Su et al. [7] and the follow-up period and 25(OH)D concentration comparison obtained from each article. Two studies did not have enough information on follow-up period and how 25(OH)D concentrations were compared. Two studies were based on dietary vitamin D intake. None of those four studies were included in the analysis reported here.

| Follow-up (years) |
Type of stroke |
Inc or Mor |
OR/RR (95% CI) |
25(OH)D comparison (ng/mL) |
Reference |
| -- | 1.41 (0.64‒3.13) | (Guo, 2017*) [9] | |||
| -- | 1.19 (0.79‒1.79) | (Leu Agelii, 2017*) [10] | |||
| 1 | inc | 0.42 (0.14‒1.28) | >10 vs. <10 | (Zittermann, 2016) [11] | |
| 1.3 | inc | 0.56 (0.38‒0.84) | >30 vs. <15 | (Anderson, 2010) [12] | |
| 3.1 | inc | 0.54 (0.34‒0.85) | >30 vs. <20 | (Judd, 2016) [13] | |
| 4 | inc | 0.33 (0.15‒0.73) | >30 vs. <10 | (Drechsler, 2010) [14] | |
| 5 | inc | 0.71 (0.40‒1.25) | >20 vs. <20 | (Bolland, 2010) [15] | |
| 6.8 | inc + mor | 0.91 (0.81‒1.02) | per +10 | (Perna, 2013) [16] | |
| 6.8 | inc + mor | 0.76 (0.55‒1.05) | <12 vs. >20 | ||
| 7.6 | inc | 0.60 (0.59‒1.09) | Q4 (27 median) vs. Q1 (12 median) |
(Kuhn, 2013) [17] | |
| 7.6 | inc | 0.65 (0.49‒0.95) | >20 vs. <10 | ||
| 8.0 | inc | 0.93 (0.46‒1.85) | >20 vs. <20 | (Welles, 2014) [18] | |
| 9.3 | I | inc | 0.81 (0.70‒0.94) | >20 vs. <10 | (Afzal, 2017) [19] |
| 10 | inc + mor | 1.00 (0.51‒1.94) | High vs. low tertile | (Marniemi, 2005) [20] | |
| 10 | 0.88 (0.49‒1.61) | Middle vs. low tertile | |||
| 10 | inc | 1.13 (0.80‒1.59) | Fourth vs. first quartile | (Skaaby, 2013[21] | |
| 10.3 | All | inc | 0.56 (0.36‒0.86) | Lowest vs. highest quintile | (Leung, 2017[22] |
| 10.3 | I | 0.55 (0.35‒0.86) | Lowest vs. highest quintile | ||
| 10.6 | inc | 0.91 (0.75‒1.11) | One 25(OH)D SD increase | (Berghout, 2019) [23] | |
| 14.1 | All, W | mor | 0.47 (0.22‒0.99) | >15 vs. <15 | (Michos, 2012) [24] |
| 14.1 | All, B | mor | 1.07 (0.56‒2.04) | >15 vs. <15 | |
| 14.1 | mor | 0.57 (0.31‒1.06) | >15 vs. <15 | ||
| 16 | inc or mor | 0.60 (0.39‒0.91) | >20 vs. <20 | (Schierbeck, 2012) [25] | |
| 19.3 | 0.66 (0.49‒0.89) | >440 vs. <110 IU/day vitamin D |
(Sheerah, 2018*) [26] | ||
| 20 | inc | 0.75 (0.58‒0.94) | >31 vs. <17 | (Schneider, 2015) [27] | |
| 34 | 0.82 (0.68‒0.99) | >4 vs. <1.1 µg/day | (Kojima, 2012*) [28] |
(*) omitted from the graph; B, Black; I, ischemic; Inc, incidence; mor, mortality; W, White.
| Country | Patient characteristics | Mean Age (± SD) or range (years) |
BMI (± SD) (kg/m2) |
M, F (%) |
Type of Stroke |
NS | NC | Reference |
| Germany | Left ventricular assist device implants | 62 (37‒81) | 23 ± 3 | 100, 0 | All | 25 | (Zittermann, 2016) [11] | |
| 57 (49‒66) | 26 ± 5 | 85, 15 | 129 | |||||
| USA | Community hospital | 55 ± 21 | NA | 25, 75 | All | 208 | 25,818 | (Anderson, 2010) [12] |
| USA | B and W community-dwelling | I | 536 | 1069 | (Judd, 2016) [13] | |||
| Germany | Diabetic haemodialysis | 66 ± 8 | 60, 40 | All | 89 | 1019 | (Drechsler, 2010) [14] | |
| New Zealand | Healthy community-dwelling | 74 ± 4 | NA | 0, 100 | All | 59 | 1412 | (Bolland, 2010) [15] |
| Germany | Population-based | 65% 50‒65; 35% 65‒74 | 27 ± 5 | 41, 59 | All | 353 | 7356 | (Perna, 2013) [16] |
| Germany | Population-based | 51 | NA | 42, 58 | All | 471 | 1661 | (Kuhn, 2013) [17] |
| USA | Stable CVD disease | 66 ± 11 | 29 | 81, 19 | All | 49 | 897 | (Welles, 2014) [18] |
| Denmark | General population | 58 (48‒68) | 26 ± 3 | 48, 52 | I | 960 | ~115,000 | (Afzal, 2017) [19] |
| Finland | Population-based | 65-99 | NA | 48, 52 | All | 70 | 685 | (Marniemi, 2005) [20] |
| Denmark | General population | 49 (41-73) | 26 | 50, 50 | All | 316 | 8830 | (Skaaby, 2013[21] |
| Hong Kong | Osteoporosis study, Chinese | 63 ± 10 | 37, 63 | All | 244 | 3214 | (Leung, 2017[22] | |
| 63 ± 10 | 37, 63 | I | 205 | 3253 | ||||
| The Netherlands | Population-based | 65 ± 10 | 27 ± 4 | 43, 57 | All | 735 | 8603 | (Berghout, 2019) [23] |
| USA | Population-based, W* | 73 (SE, 1) | 27 (SE, 0.5) | 35, 65 | All | 116 | 4885 | (Michos, 2012) [24] |
| USA | Population-based, B* | 68 (SE, 2) | 28 (SE, 0.8) | 34, 66 | All | 60 | 2920 | (Michos, 2012) [24] |
| Denmark | Osteoporosis study | 50 ± 2 | 25 ± 5 | 0, 100 | All | 89 | 1924 | (Schierbeck, 2012) [25] |
| USA | Population-based | 57 | NA | 43, 57 | All | 804 | 11,354 | (Schneider, 2015) [27] |
(*), data for those with incident stroke: B, Black; CVD, cardiovascular disease; I, ischemic; NA, not available; NC, number of controls; NS, number with incident stroke; SE, standard error; W, White.
Table 3.
Major cardiovascular disease event in prospective cohort studies based on studies in Grandi, 2010 [29] and Zhang, 2022 [30].
| Follow-up (years) |
RR (95% CI) | 25(OH)D comparison (ng/mL) |
Reference |
| 1.0 | 1.85 (1.25‒2.75) | <9 vs. >9 | (de Metrio, 2015) [31] |
| 1.0 | 1.20 (0.72‒2.00) | <12 vs. >12 | (Beska, 2019) [32] |
| 1.25 | 7.24 (0.99‒53.50) | <30 vs. >30 | (Siasos, 2013) [33] |
| 1.5 | 1.61 (1.15‒2.27) | <7.3 vs. >7.3 | (Ng, 2013) [34] |
| 2.2 | 1.30 (1.04‒1.64) | <20 vs. >20 | (Aleksova, 2020) [35] |
| 2.7 | 1.32 (1.07‒1.63) | <12.7; 12.7-21.59; ≥21.6 | (Verdoia, 2021) [36] |
| 5 | 1.2 (0.7‒2.2) | <20 vs. >20 | (Bolland, 2010) [15] |
| 5.8 | 1.84 (1.36‒2.50) | (Gerling, 2016) [37] | |
| 6.7 | 1.36 (0.88‒2.12) | (Yu, 2018) [38] | |
| 7.0 | 1.27 (0.92‒1.75) | (Naesgaard, 2015) [39] | |
| 7.6 | 1.62 (1.11‒2.36) | <15 vs. >15 | (Wang, 2008) [40] |
| 7.7 | 1.77 (1.47‒2.13) | (Lerchbaum, 2012) [41] | |
| 8.0 | 1.11 (0.85‒1.44) | >20 vs. <20 | (Welles, 2014) [18] |
| 8.1 | 0.83 (0.37‒1.86) | Quartiles | (Grandi, 2010) [42] |
| 10 | (Giovannucci, | ||
| 10 | (Marniemi | ||
| 11.9 | 1.94 (1.66‒2.27) | (Degerud, 2018) [43] |
Note: Studies highlighted in gray will be omitted since they relate to mortality.
Table 4.
Major cardiovascular disease event in prospective cohort studies based on studies in Grandi, 2010 [29] and Zhang, 2022 [30].
| Country | Patient characteristics |
Mean Age (± SD) or range (years) |
BMI (± SD) (kg/m2) |
M, F (%) |
Type of event | NMCDE | NC | Reference |
| Italy | Acute coronary syndrome | 67 ± 12 | 27 ± 4 | 72, 28 | MACE | 125 | 689 | (de Metrio, 2015) [31] |
| UK | After non-ST elevation acute coronary syndrome | 81 ± 5 | 27 ± 5 | 62, 38 | MACE | 76 | 224 | (Beska, 2019) [32] |
| UK | Acute myocardial infarction | 66 ± 13 | NA | 72, 28 | non-fatal MACE | 224 | 1035 | (Ng, 2013) [34] |
| Italy | Myocardial infarction | 67 ± 12 | 27 ± 4 | 71, 29 | all-cause mortality, angina/MI, HF | 391 | 690 | (Aleksova, 2020) [35] |
| Italy | CAD undergoing percutaneous coronary intervention | 68 ± 11 | 28 ± 5 | 73, 27 | MACE | 174 | 531 | (Verdoia, 2021) [36] |
| New Zealand | Healthy community-dwelling | 74 ± 4 | NA | 0, 100 | MI | 52 | 1419 | (Bolland, 2010) [15] |
| Death | (Gerling, 2016) [37] | |||||||
| Death | (Yu, 2018) [38] | |||||||
| Death | (Naesgaard, 2015) [39] | |||||||
| Incident CVD | (Wang, 2008) [40] | |||||||
| Death | (Lerchbaum, 2012) [41] | |||||||
| USA | Stable CVD disease | 66 ± 11 | 29 | 81, 19 | CVD events | 49 | 897 | (Welles, 2014) [18] |
| CVD events | 148 | 977 | (Grandi, 2010) [42] | |||||
| (Giovannucci, | ||||||||
| Death | (Marniemi, 2005) | |||||||
| Death | (Degerud, 2018) [43] |
CAD, coronary artery disease; HF, heath failure; MACE, major adverse cardiovascular event; MI, myocardial infarction; NA, not available; NMCDE, number with a major cardiovascular disease event; NC, number of controls;.
Data were analyzed using SigmaStat 4.0 (Grafiti, Palo Alto, CA, USA). Data plots were made using KaleidaGraph 4.5.4 (Synergy Software, Reading, PA, USA).
3. Results
Figure 1 is a plot of the data from Table 1 along with the linear regression fits to the data. The data were divided into two groups, one to ten years and greater than ten years. The division was determined by inspection of the data plot. As can be seen, there is a good linear fit to the data for follow-up period one-to-ten years. The regression fit to those data is RR = 0.34 + (0.067 × Follow-up [years]), r = 0.87, adjusted r2 = 0.73, p <0.001. The regression fit to the data with follow-up period >10 years is nearly flat with respect to follow-up period.
4. Discussion
The meta-analysis by Su et al. [7] found an average value of 0.78 (95% CI, 0.70‒0.86). That is approximately half the reduction for the study with the one-year follow up and 44% as large as the regression fit to zero follow-up period. This finding provides more evidence that not considering the effect of follow-up period in doing meta-analyses of observational studies with long follow-up times can greatly underestimate the effect of the parameter studied. As a result, public policy recommendations are not as strong as they could be.
A 2020 article calculated the dose-response relationship for 25(OH)D concentration and risk of stroke (Shi, 2020) [44]. It used mostly the same observational studies as Su et al. [7]. The result, shown in Figure 2 in [44], was that risk decreased from near zero 25(OH)D concentration to about 20 ng/ml, then was flat out to 40 ng/mL with a reduction in risk of about 20%. However, due to not accounting for follow-up period, this analysis underestimates the reduction that can actually be achieved with vitamin D. On the other hand, it does show that the main change in risk is between very low and 10 to 15 ng/mL. Very few RCTs would enroll participants with mean 25(OH)D concentrations that low unless it was conducted in a country with low 25(OH)D concentrations. Such a country is Iran. Results of a stratified randomized field trial of vitamin D supplementation in pregnant women reported that the mean baseline 25(OH)D concentration was 11 ng/mL [45]. By supplementing the women at one hospital with enough vitamin D to raise 25(OH)D concentration above 20 ng/mL, significant reductions were found for gestational diabetes, preeclampsia, and pre-term birth compared with outcomes in a similar but untreated hospital.
Will add a section on why the present knowledge is strong enough to say that 20 ng/mL reduces risk of stroke and CVD events.
An interesting question is how rapidly does vitamin D reduce risk of adverse brain and other health outcomes. As discussed in the analysis of follow-up period for cognitive function, an RCT demonstrated significant beneficial effects in improving cognitive function during one year of vitamin D supplementation [46]. To examine this question, Google Scholar was searched for representative RCTs that found a beneficial effect on brain health in less than one year. The findings are given in Table 2. As can be seen, significant benefits were found for depression and cognitive function. These studies provide evidence that raising serum 25(OH)D concentrations can produce significant improvements in brain health in less than a year. Interestingly, three of the papers dealt with studies from China, India, and/or Iran. In countries such as Iran, serum 25(OH)D concentrations are generally low, thus RCTs conducted there are more likely to show health benefits than studies done in countries with higher mean 25(OH)D concentrations.
There are many reasons why serum 25(OH)D concentrations change with time over time scales from months to years. Table 3 lists a number of these reasons along with references that provide more information
Reviews
| Topic | Reason |
| Vitamin D mechanisms | (Yarlagadda, 2020) [64] |
| Post-stroke, 25(OH)D at time of stroke | (Marek, 2022) [65] |
| Risk of recurrent stoke | (Vergatti, 2023) [66] |
| Review, association, mechanisms, 25(OH)D, oral intake | (Cui, 2024) [67] |
Mechanisms whereby vitamin D reduces risk of stroke
RCTs have not supported the role of vitamin D in reducing risk of stroke. A 2020 systematic review and meta-analysis of vitamin D supplementation and incidence of stroke included 13 RCTs [68]. The mean age was 66 years and the mean follow-up time was 3.1 years. The mean baseline 25(OH)D concentration for studies that reported values was 19.4 ng/mL (range: 8.8‒25.4 ng/mL). The percentage of participants in these 13 trials was 2.1% in both treatment and control arm, resulting RR for stroke = 1.00 (95% CI, 0.91‒1.10). Inspection of the baseline characteristics of participants in these trials in Table 1 in Nudy [68] finds that participants were being studied regarding various adverse health effects including arthritis index pain, asthma exacerbations, progression to type 2 diabetes mellitus, falls and fractures, insulin sensitivity, or renal function. In other words, none of the trials was established specifically to evaluate the role of vitamin D supplementation in the risk of stroke incidence.
A 2024 review included a different set of five vitamin D RCTs regarding ischemic stroke risk [67]. Mean baseline 25(OH)D concentrations were from 66 ± 23 ng/mL to 77 ± 25 ng/mL in four trials and 38 ± 16 ng/mL in one trial. Follow-up duration ranged from 3.3 to 5.3 years. All of these trials had cardiovascular disease outcome as a primary outcome. Again, no significant difference in stroke risk was found between the vitamin D treatment and control arms.
Even if the trials had been set up to test for stroke incidence, it is unlikely that they would have found a beneficial effect. There are two reasons. First, nearly all vitamin D RCTs have been based on guidelines for pharmaceutical drugs. In such trials, the control arm does not receive any of the drug. That is not the case for vitamin D trials since vitamin D is a naturally occurring substance required for life. Robert Heaney outlined guidelines for trials regarding nutrients in 2014 [69]. The main steps appropriate for vitamin D [70] are: 1, measure 25(OH)D concentrations and include those with low concentrations appropriate for the outcome of interest; 2, give a vitamin D dose large enough to raise 25(OH)D concentrations to where beneficial effects are expected; 3, measure achieved 25(OH)D concentrations; 4, analyze results with respect to achieved vitamin D concentrations. The second reason for poor results from vitamin D RCTs is that the enroll people with relatively high 25(OH)D concentrations, give relatively low doses and permit participants in the control arm to take moderate vitamin D supplements, and analyze with respect to intention to treat. These failures have been discussed in two 2022 reviews [71,72].
Funding
This research received no external funding.
Institutional Review Board Statement
Not applicable.
Data Availability Statement
The original contributions presented in the study are included in the article or in the references provided. Further inquiries can be directed to the corresponding author.
Conflicts of Interest
W.B.G. has had funding from Bio-Tech Pharmacal, Inc., (Fayetteville, AR, USA). The funder had no role in the design of the study; in the collection, analyses, or interpretation of data; in the writing of the manuscript; or in the decision to publish the results. P.M. has no conflicts of interest to declare.
References
- Clarke, R.; Shipley, M.; Lewington, S.; Youngman, L.; Collins, R.; Marmot, M.; Peto, R. Underestimation of risk associations due to regression dilution in long-term follow-up of prospective studies. Am J Epidemiol 1999, 150, 341–353. [Google Scholar] [CrossRef] [PubMed]
- Grant, W.B. Effect of interval between serum draw and follow-up period on relative risk of cancer incidence with respect to 25-hydroxyvitamin D level: Implications for meta-analyses and setting vitamin D guidelines. Dermatoendocrinol 2011, 3, 199–204. [Google Scholar] [CrossRef]
- Grant, W.B. Effect of follow-up time on the relation between prediagnostic serum 25-hydroxyvitamin D and all-cause mortality rate. Dermatoendocrinol 2012, 4, 198–202. [Google Scholar] [CrossRef]
- McCullough, M.L.; Zoltick, E.S.; Weinstein, S.J.; Fedirko, V.; Wang, M.; Cook, N.R.; Eliassen, A.H.; Zeleniuch-Jacquotte, A.; Agnoli, C.; Albanes, D. , et al. Circulating Vitamin D and Colorectal Cancer Risk: An International Pooling Project of 17 Cohorts. J Natl Cancer Inst 2019, 111, 158–169. [Google Scholar] [CrossRef]
- Munoz, A.; Grant, W.B. Vitamin D and Cancer: An Historical Overview of the Epidemiology and Mechanisms. Nutrients 2022, 14, 1448. [Google Scholar] [CrossRef] [PubMed]
- Zhang, X.X.; Wang, H.R.; Meng, W.; Hu, Y.Z.; Sun, H.M.; Feng, Y.X.; Jia, J.J. Association of Vitamin D Levels with Risk of Cognitive Impairment and Dementia: A Systematic Review and Meta-Analysis of Prospective Studies. J Alzheimers Dis 2024, 98, 373–385. [Google Scholar] [CrossRef]
- Su, C.; Jin, B.; Xia, H.; Zhao, K. Association between Vitamin D and Risk of Stroke: A PRISMA-Compliant Systematic Review and Meta-Analysis. Eur Neurol 2021, 84, 399–408. [Google Scholar] [CrossRef] [PubMed]
- Xiong, J.; Zhao, C.; Li, J.; Li, Y. A systematic review and meta-analysis of the linkage between low vitamin D and the risk as well as the prognosis of stroke. Brain Behav 2024, 14, e3577. [Google Scholar] [CrossRef]
- Guo, J.; Cockcroft, J.R.; Elwood, P.C.; Pickering, J.E.; Lovegrove, J.A.; Givens, D.I. Vitamin D intake and risk of CVD and all-cause mortality: evidence from the Caerphilly Prospective Cohort Study. Public Health Nutr 2017, 20, 2744–2753. [Google Scholar] [CrossRef]
- Leu Agelii, M.; Lehtinen-Jacks, S.; Zetterberg, H.; Sundh, V.; Bjorkelund, C.; Lissner, L. Low vitamin D status in relation to cardiovascular disease and mortality in Swedish women - Effect of extended follow-up. Nutr Metab Cardiovasc Dis 2017, 27, 1143–1151. [Google Scholar] [CrossRef]
- Zittermann, A.; Morshuis, M.; Kuhn, J.; Pilz, S.; Ernst, J.B.; Oezpeker, C.; Dreier, J.; Knabbe, C.; Gummert, J.F.; Milting, H. Vitamin D metabolites and fibroblast growth factor-23 in patients with left ventricular assist device implants: association with stroke and mortality risk. Eur J Nutr 2016, 55, 305–313. [Google Scholar] [CrossRef] [PubMed]
- Anderson, J.L.; May, H.T.; Horne, B.D.; Bair, T.L.; Hall, N.L.; Carlquist, J.F.; Lappe, D.L.; Muhlestein, J.B.; Intermountain Heart Collaborative Study, G. Relation of vitamin D deficiency to cardiovascular risk factors, disease status, and incident events in a general healthcare population. Am J Cardiol 2010, 106, 963–968. [Google Scholar] [CrossRef] [PubMed]
- Judd, S.E.; Morgan, C.J.; Panwar, B.; Howard, V.J.; Wadley, V.G.; Jenny, N.S.; Kissela, B.M.; Gutierrez, O.M. Vitamin D deficiency and incident stroke risk in community-living black and white adults. Int J Stroke 2016, 11, 93–102. [Google Scholar] [CrossRef]
- Drechsler, C.; Pilz, S.; Obermayer-Pietsch, B.; Verduijn, M.; Tomaschitz, A.; Krane, V.; Espe, K.; Dekker, F.; Brandenburg, V.; Marz, W. , et al. Vitamin D deficiency is associated with sudden cardiac death, combined cardiovascular events, and mortality in haemodialysis patients. Eur Heart J 2010, 31, 2253–2261. [Google Scholar] [CrossRef]
- Bolland, M.J.; Bacon, C.J.; Horne, A.M.; Mason, B.H.; Ames, R.W.; Wang, T.K.; Grey, A.B.; Gamble, G.D.; Reid, I.R. Vitamin D insufficiency and health outcomes over 5 y in older women. Am J Clin Nutr 2010, 91, 82–89. [Google Scholar] [CrossRef] [PubMed]
- Perna, L.; Schottker, B.; Holleczek, B.; Brenner, H. Serum 25-hydroxyvitamin D and incidence of fatal and nonfatal cardiovascular events: a prospective study with repeated measurements. J Clin Endocrinol Metab 2013, 98, 4908–4915. [Google Scholar] [CrossRef]
- Kuhn, T.; Kaaks, R.; Teucher, B.; Hirche, F.; Dierkes, J.; Weikert, C.; Katzke, V.; Boeing, H.; Stangl, G.I.; Buijsse, B. Plasma 25-hydroxyvitamin D and its genetic determinants in relation to incident myocardial infarction and stroke in the European prospective investigation into cancer and nutrition (EPIC)-Germany study. PLoS One 2013, 8, e69080. [Google Scholar] [CrossRef]
- Welles, C.C.; Whooley, M.A.; Karumanchi, S.A.; Hod, T.; Thadhani, R.; Berg, A.H.; Ix, J.H.; Mukamal, K.J. Vitamin D deficiency and cardiovascular events in patients with coronary heart disease: data from the Heart and Soul Study. Am J Epidemiol 2014, 179, 1279–1287. [Google Scholar] [CrossRef]
- Afzal, S.; Nordestgaard, B.G. Vitamin D, Hypertension, and Ischemic Stroke in 116 655 Individuals From the General Population: A Genetic Study. Hypertension 2017, 10.1161/HYPERTENSIONAHA.117.09411. [Google Scholar] [CrossRef]
- Marniemi, J.; Alanen, E.; Impivaara, O.; Seppanen, R.; Hakala, P.; Rajala, T.; Ronnemaa, T. Dietary and serum vitamins and minerals as predictors of myocardial infarction and stroke in elderly subjects. Nutr Metab Cardiovasc Dis 2005, 15, 188–197. [Google Scholar] [CrossRef]
- Skaaby, T.; Husemoen, L.L.; Pisinger, C.; Jorgensen, T.; Thuesen, B.H.; Fenger, M.; Linneberg, A. Vitamin D status and incident cardiovascular disease and all-cause mortality: a general population study. Endocrine 2013, 43, 618–625. [Google Scholar] [CrossRef] [PubMed]
- Leung, R.Y.; Han, Y.; Sing, C.W.; Cheung, B.M.; Wong, I.C.; Tan, K.C.; Kung, A.W.; Cheung, C.L. Serum 25-hydroxyvitamin D and the risk of stroke in Hong Kong Chinese. Thromb Haemost 2017, 117, 158–163. [Google Scholar] [CrossRef]
- Berghout, B.P.; Fani, L.; Heshmatollah, A.; Koudstaal, P.J.; Ikram, M.A.; Zillikens, M.C.; Ikram, M.K. Vitamin D Status and Risk of Stroke: The Rotterdam Study. Stroke 2019, 50, 2293–2298. [Google Scholar] [CrossRef]
- Michos, E.D.; Reis, J.P.; Post, W.S.; Lutsey, P.L.; Gottesman, R.F.; Mosley, T.H.; Sharrett, A.R.; Melamed, M.L. 25-Hydroxyvitamin D deficiency is associated with fatal stroke among whites but not blacks: The NHANES-III linked mortality files. Nutrition 2012, 28, 367–371. [Google Scholar] [CrossRef]
- Schierbeck, L.L.; Rejnmark, L.; Tofteng, C.L.; Stilgren, L.; Eiken, P.; Mosekilde, L.; Kober, L.; Jensen, J.E. Vitamin D deficiency in postmenopausal, healthy women predicts increased cardiovascular events: a 16-year follow-up study. Eur J Endocrinol 2012, 167, 553–560. [Google Scholar] [CrossRef] [PubMed]
- Sheerah, H.A.; Eshak, E.S.; Cui, R.; Imano, H.; Iso, H.; Tamakoshi, A.; Japan Collaborative Cohort Study, G. Relationship Between Dietary Vitamin D and Deaths From Stroke and Coronary Heart Disease: The Japan Collaborative Cohort Study. Stroke 2018, 49, 454–457. [Google Scholar] [CrossRef]
- Schneider, A.L.; Lutsey, P.L.; Selvin, E.; Mosley, T.H.; Sharrett, A.R.; Carson, K.A.; Post, W.S.; Pankow, J.S.; Folsom, A.R.; Gottesman, R.F. , et al. Vitamin D, vitamin D binding protein gene polymorphisms, race and risk of incident stroke: the Atherosclerosis Risk in Communities (ARIC) study. Eur J Neurol 2015, 22, 1220–1227. [Google Scholar] [CrossRef] [PubMed]
- Kojima, G.; Bell, C.; Abbott, R.D.; Launer, L.; Chen, R.; Motonaga, H.; Ross, G.W.; Curb, J.D.; Masaki, K. Low dietary vitamin D predicts 34-year incident stroke: the Honolulu Heart Program. Stroke 2012, 43, 2163–2167. [Google Scholar] [CrossRef]
- Grandi, N.C.; Breitling, L.P.; Brenner, H. Vitamin D and cardiovascular disease: systematic review and meta-analysis of prospective studies. Prev Med 2010, 51, 228–233. [Google Scholar] [CrossRef]
- Zhang, H.; Wang, P.; Jie, Y.; Sun, Y.; Wang, X.; Fan, Y. Predictive value of 25-hydroxyvitamin D level in patients with coronary artery disease: A meta-analysis. Front Nutr 2022, 9, 984487. [Google Scholar] [CrossRef]
- De Metrio, M.; Milazzo, V.; Rubino, M.; Cabiati, A.; Moltrasio, M.; Marana, I.; Campodonico, J.; Cosentino, N.; Veglia, F.; Bonomi, A. , et al. Vitamin D plasma levels and in-hospital and 1-year outcomes in acute coronary syndromes: a prospective study. Medicine (Baltimore) 2015, 94, e857. [Google Scholar] [CrossRef] [PubMed]
- Beska, B.; Chan, D.; Gu, S.; Qiu, W.; Mossop, H.; Neely, D.; Kunadian, V. The association between vitamin D status and clinical events in high-risk older patients with non-ST elevation acute coronary syndrome undergoing invasive management. PLoS One 2019, 14, e0217476. [Google Scholar] [CrossRef] [PubMed]
- Siasos, G.; Tousoulis, D.; Oikonomou, E.; Maniatis, K.; Kioufis, S.; Kokkou, E.; Miliou, A.; Zaromitidou, M.; Kassi, E.; Stefanadis, C. Vitamin D serum levels are associated with cardiovascular outcome in coronary artery disease. Int J Cardiol 2013, 168, 4445–4447. [Google Scholar] [CrossRef]
- Ng, L.L.; Sandhu, J.K.; Squire, I.B.; Davies, J.E.; Jones, D.J. Vitamin D and prognosis in acute myocardial infarction. Int J Cardiol 2013, 168, 2341–2346. [Google Scholar] [CrossRef] [PubMed]
- Aleksova, A.; Ferro, F.; Gagno, G.; Padoan, L.; Saro, R.; Santon, D.; Stenner, E.; Barbati, G.; Cappelletto, C.; Rossi, M. , et al. Diabetes Mellitus and Vitamin D Deficiency:Comparable Effect on Survival and a DeadlyAssociation after a Myocardial Infarction. J Clin Med 2020, 9. [Google Scholar] [CrossRef] [PubMed]
- Verdoia, M.; Nardin, M.; Rolla, R.; Negro, F.; Gioscia, R.; Afifeh, A.M.S.; Viglione, F.; Suryapranata, H.; Marcolongo, M.; De Luca, G. , et al. Prognostic impact of Vitamin D deficiency in patients with coronary artery disease undergoing percutaneous coronary intervention. Eur J Intern Med 2021, 83, 62–67. [Google Scholar] [CrossRef]
- Gerling, M.E.; James, M.T.; Wilton, S.B.; Naugler, C.; Southern, D.A.; Galbraith, P.D.; Knudtson, M.; de Koning, L. Serum Total 25-OH Vitamin D Adds Little Prognostic Value in Patients Undergoing Coronary Catheterization. J Am Heart Assoc 2016, 5. [Google Scholar] [CrossRef]
- Yu, C.; Xue, H.; Wang, L.; Chen, Q.; Chen, X.; Zhang, Y.; Hu, G.; Ling, W. Serum Bioavailable and Free 25-Hydroxyvitamin D Levels, but Not Its Total Level, Are Associated With the Risk of Mortality in Patients With Coronary Artery Disease. Circ Res 2018, 123, 996–1007. [Google Scholar] [CrossRef]
- Naesgaard, P.A.; Ponitz, V.; Aarsetoey, H.; Brugger-Andersen, T.; Grundt, H.; Harris, W.S.; Staines, H.; Nilsen, D.W. Prognostic utility of vitamin D in acute coronary syndrome patients in coastal Norway. Dis Markers 2015, 2015, 283178. [Google Scholar] [CrossRef]
- Wang, T.J.; Pencina, M.J.; Booth, S.L.; Jacques, P.F.; Ingelsson, E.; Lanier, K.; Benjamin, E.J.; D'Agostino, R.B.; Wolf, M.; Vasan, R.S. Vitamin D deficiency and risk of cardiovascular disease. Circulation 2008, 117, 503–511. [Google Scholar] [CrossRef]
- Lerchbaum, E.; Pilz, S.; Boehm, B.O.; Grammer, T.B.; Obermayer-Pietsch, B.; Marz, W. Combination of low free testosterone and low vitamin D predicts mortality in older men referred for coronary angiography. Clin Endocrinol (Oxf) 2012, 77, 475–483. [Google Scholar] [CrossRef] [PubMed]
- Grandi, N.C.; Breitling, L.P.; Vossen, C.Y.; Hahmann, H.; Wusten, B.; Marz, W.; Rothenbacher, D.; Brenner, H. Serum vitamin D and risk of secondary cardiovascular disease events in patients with stable coronary heart disease. Am Heart J 2010, 159, 1044–1051. [Google Scholar] [CrossRef] [PubMed]
- Degerud, E.; Nygard, O.; de Vogel, S.; Hoff, R.; Svingen, G.F.T.; Pedersen, E.R.; Nilsen, D.W.T.; Nordrehaug, J.E.; Midttun, O.; Ueland, P.M. , et al. Plasma 25-Hydroxyvitamin D and Mortality in Patients With Suspected Stable Angina Pectoris. J Clin Endocrinol Metab 2018, 103, 1161–1170. [Google Scholar] [CrossRef] [PubMed]
- Shi, H.; Chen, H.; Zhang, Y.; Li, J.; Fu, K.; Xue, W.; Teng, W.; Tian, L. 25-Hydroxyvitamin D level, vitamin D intake, and risk of stroke: A dose-response meta-analysis. Clin Nutr 2020, 39, 2025–2034. [Google Scholar] [CrossRef]
- Rostami, M.; Tehrani, F.R.; Simbar, M.; Bidhendi Yarandi, R.; Minooee, S.; Hollis, B.W.; Hosseinpanah, F. Effectiveness of Prenatal Vitamin D Deficiency Screening and Treatment Program: A Stratified Randomized Field Trial. J Clin Endocrinol Metab 2018, 103, 2936–2948. [Google Scholar] [CrossRef]
- Jia, J.; Hu, J.; Huo, X.; Miao, R.; Zhang, Y.; Ma, F. Effects of vitamin D supplementation on cognitive function and blood Abeta-related biomarkers in older adults with Alzheimer's disease: a randomised, double-blind, placebo-controlled trial. J Neurol Neurosurg Psychiatry 2019, 90, 1347–1352. [Google Scholar] [CrossRef]
- Jamilian, H.; Amirani, E.; Milajerdi, A.; Kolahdooz, F.; Mirzaei, H.; Zaroudi, M.; Ghaderi, A.; Asemi, Z. The effects of vitamin D supplementation on mental health, and biomarkers of inflammation and oxidative stress in patients with psychiatric disorders: A systematic review and meta-analysis of randomized controlled trials. Prog Neuropsychopharmacol Biol Psychiatry 2019, 94, 109651. [Google Scholar] [CrossRef] [PubMed]
- Vellekkatt, F.; Menon, V.; Rajappa, M.; Sahoo, J. Effect of adjunctive single dose parenteral Vitamin D supplementation in major depressive disorder with concurrent vitamin D deficiency: A double-blind randomized placebo-controlled trial. J Psychiatr Res 2020, 129, 250–256. [Google Scholar] [CrossRef]
- Ghaderi, A.; Rasouli-Azad, M.; Farhadi, M.H.; Mirhosseini, N.; Motmaen, M.; Pishyareh, E.; Omidi, A.; Asemi, Z. Exploring the Effects of Vitamin D Supplementation on Cognitive Functions and Mental Health Status in Subjects Under Methadone Maintenance Treatment. J Addict Med 2020, 14, 18–25. [Google Scholar] [CrossRef]
- Castle, M.; Fiedler, N.; Pop, L.C.; Schneider, S.J.; Schlussel, Y.; Sukumar, D.; Hao, L.; Shapses, S.A. Three Doses of Vitamin D and Cognitive Outcomes in Older Women: A Double-Blind Randomized Controlled Trial. J Gerontol A Biol Sci Med Sci 2020, 75, 835–842. [Google Scholar] [CrossRef]
- Chalcraft, J.R.; Cardinal, L.M.; Wechsler, P.J.; Hollis, B.W.; Gerow, K.G.; Alexander, B.M.; Keith, J.F.; Larson-Meyer, D.E. Vitamin D Synthesis Following a Single Bout of Sun Exposure in Older and Younger Men and Women. Nutrients 2020, 12. [Google Scholar] [CrossRef] [PubMed]
- Rooney, M.R.; Harnack, L.; Michos, E.D.; Ogilvie, R.P.; Sempos, C.T.; Lutsey, P.L. Trends in Use of High-Dose Vitamin D Supplements Exceeding 1000 or 4000 International Units Daily, 1999-2014. JAMA 2017, 317, 2448–2450. [Google Scholar] [CrossRef] [PubMed]
- Alhabeeb, H.; Kord-Varkaneh, H.; Tan, S.C.; Gaman, M.A.; Otayf, B.Y.; Qadri, A.A.; Alomar, O.; Salem, H.; Al-Badawi, I.A.; Abu-Zaid, A. The influence of omega-3 supplementation on vitamin D levels in humans: a systematic review and dose-response meta-analysis of randomized controlled trials. Crit Rev Food Sci Nutr 2022, 62, 3116–3123. [Google Scholar] [CrossRef]
- Engelsen, O. The relationship between ultraviolet radiation exposure and vitamin D status. Nutrients 2010, 2, 482–495. [Google Scholar] [CrossRef]
- Crowe, F.L.; Steur, M.; Allen, N.E.; Appleby, P.N.; Travis, R.C.; Key, T.J. Plasma concentrations of 25-hydroxyvitamin D in meat eaters, fish eaters, vegetarians and vegans: results from the EPIC-Oxford study. Public Health Nutr 2011, 14, 340–346. [Google Scholar] [CrossRef]
- Jorde, R.; Sneve, M.; Emaus, N.; Figenschau, Y.; Grimnes, G. Cross-sectional and longitudinal relation between serum 25-hydroxyvitamin D and body mass index: the Tromso study. Eur J Nutr 2010, 49, 401–407. [Google Scholar] [CrossRef]
- Jorde, R.; Sneve, M.; Hutchinson, M.; Emaus, N.; Figenschau, Y.; Grimnes, G. Tracking of serum 25-hydroxyvitamin D levels during 14 years in a population-based study and during 12 months in an intervention study. Am J Epidemiol 2010, 171, 903–908. [Google Scholar] [CrossRef] [PubMed]
- Maghfour, J.; Boothby-Shoemaker, W.; Lim, H.W. Evaluating the USA population's interest in sunscreen: a Google Trends analysis. Clin Exp Dermatol 2022, 47, 757–759. [Google Scholar] [CrossRef]
- Ngoc, L.T.N.; Tan, V.V.; Moon, J.Y.; Chae, M.; Park, D.; Lee, Y.-C. Recent Trends of Sunscreen Cosmetic: An Update Review. Cosmetics 2019, 6, 64. [Google Scholar] [CrossRef]
- Hypponen, E.; Power, C. Hypovitaminosis D in British adults at age 45 y: nationwide cohort study of dietary and lifestyle predictors. Am J Clin Nutr 2007, 85, 860–868. [Google Scholar] [CrossRef]
- Kroll, M.H.; Bi, C.; Garber, C.C.; Kaufman, H.W.; Liu, D.; Caston-Balderrama, A.; Zhang, K.; Clarke, N.; Xie, M.; Reitz, R.E. , et al. Temporal relationship between vitamin D status and parathyroid hormone in the United States. PLoS One 2015, 10, e0118108. [Google Scholar] [CrossRef] [PubMed]
- Perez-Lopez, F.R.; Chedraui, P.; Pilz, S. Vitamin D supplementation after the menopause. Ther Adv Endocrinol Metab 2020, 11, 2042018820931291. [Google Scholar] [CrossRef] [PubMed]
- Ikonen, H.; Lumme, J.; Seppala, J.; Pesonen, P.; Piltonen, T.; Jarvelin, M.R.; Herzig, K.H.; Miettunen, J.; Niinimaki, M.; Palaniswamy, S. , et al. The determinants and longitudinal changes in vitamin D status in middle-age: a Northern Finland Birth Cohort 1966 study. Eur J Nutr 2021, 60, 4541–4553. [Google Scholar] [CrossRef]
- Yarlagadda, K.; Ma, N.; Dore, S. Vitamin D and Stroke: Effects on Incidence, Severity, and Outcome and the Potential Benefits of Supplementation. Front Neurol 2020, 11, 384. [Google Scholar] [CrossRef]
- Marek, K.; Cichon, N.; Saluk-Bijak, J.; Bijak, M.; Miller, E. The Role of Vitamin D in Stroke Prevention and the Effects of Its Supplementation for Post-Stroke Rehabilitation: A Narrative Review. Nutrients 2022, 14. [Google Scholar] [CrossRef] [PubMed]
- Vergatti, A.; Abate, V.; Zarrella, A.F.; Manganelli, F.; Tozza, S.; Iodice, R.; De Filippo, G.; D'Elia, L.; Strazzullo, P.; Rendina, D. 25-Hydroxy-Vitamin D and Risk of Recurrent Stroke: A Dose Response Meta-Analysis. Nutrients 2023, 15. [Google Scholar] [CrossRef] [PubMed]
- Cui, P.; Hou, H.; Song, B.; Xia, Z.; Xu, Y. Vitamin D and ischemic stroke - Association, mechanisms, and therapeutics. Ageing Res Rev 2024, 96, 102244. [Google Scholar] [CrossRef]
- Nudy, M.; Krakowski, G.; Ghahramani, M.; Ruzieh, M.; Foy, A.J. Vitamin D supplementation, cardiac events and stroke: A systematic review and meta-regression analysis. Int J Cardiol Heart Vasc 2020, 28, 100537. [Google Scholar] [CrossRef]
- Heaney, R.P. Guidelines for optimizing design and analysis of clinical studies of nutrient effects. Nutr Rev 2014, 72, 48–54. [Google Scholar] [CrossRef]
- Grant, W.B.; Boucher, B.J.; Bhattoa, H.P.; Lahore, H. Why vitamin D clinical trials should be based on 25-hydroxyvitamin D concentrations. J Steroid Biochem Mol Biol 2018, 177, 266–269. [Google Scholar] [CrossRef]
- Pilz, S.; Trummer, C.; Theiler-Schwetz, V.; Grubler, M.R.; Verheyen, N.D.; Odler, B.; Karras, S.N.; Zittermann, A.; Marz, W. Critical Appraisal of Large Vitamin D Randomized Controlled Trials. Nutrients 2022, 14. [Google Scholar] [CrossRef] [PubMed]
- Grant, W.B.; Boucher, B.J.; Al Anouti, F.; Pilz, S. Comparing the Evidence from Observational Studies and Randomized Controlled Trials for Nonskeletal Health Effects of Vitamin D. Nutrients 2022, 14. [Google Scholar] [CrossRef] [PubMed]
Figure 1.
Plot of RR for ischemic stroke for high vs. low 25(OH)D concentration as a function of mean follow-up period in prospective cohort studies.
Figure 1.
Plot of RR for ischemic stroke for high vs. low 25(OH)D concentration as a function of mean follow-up period in prospective cohort studies.
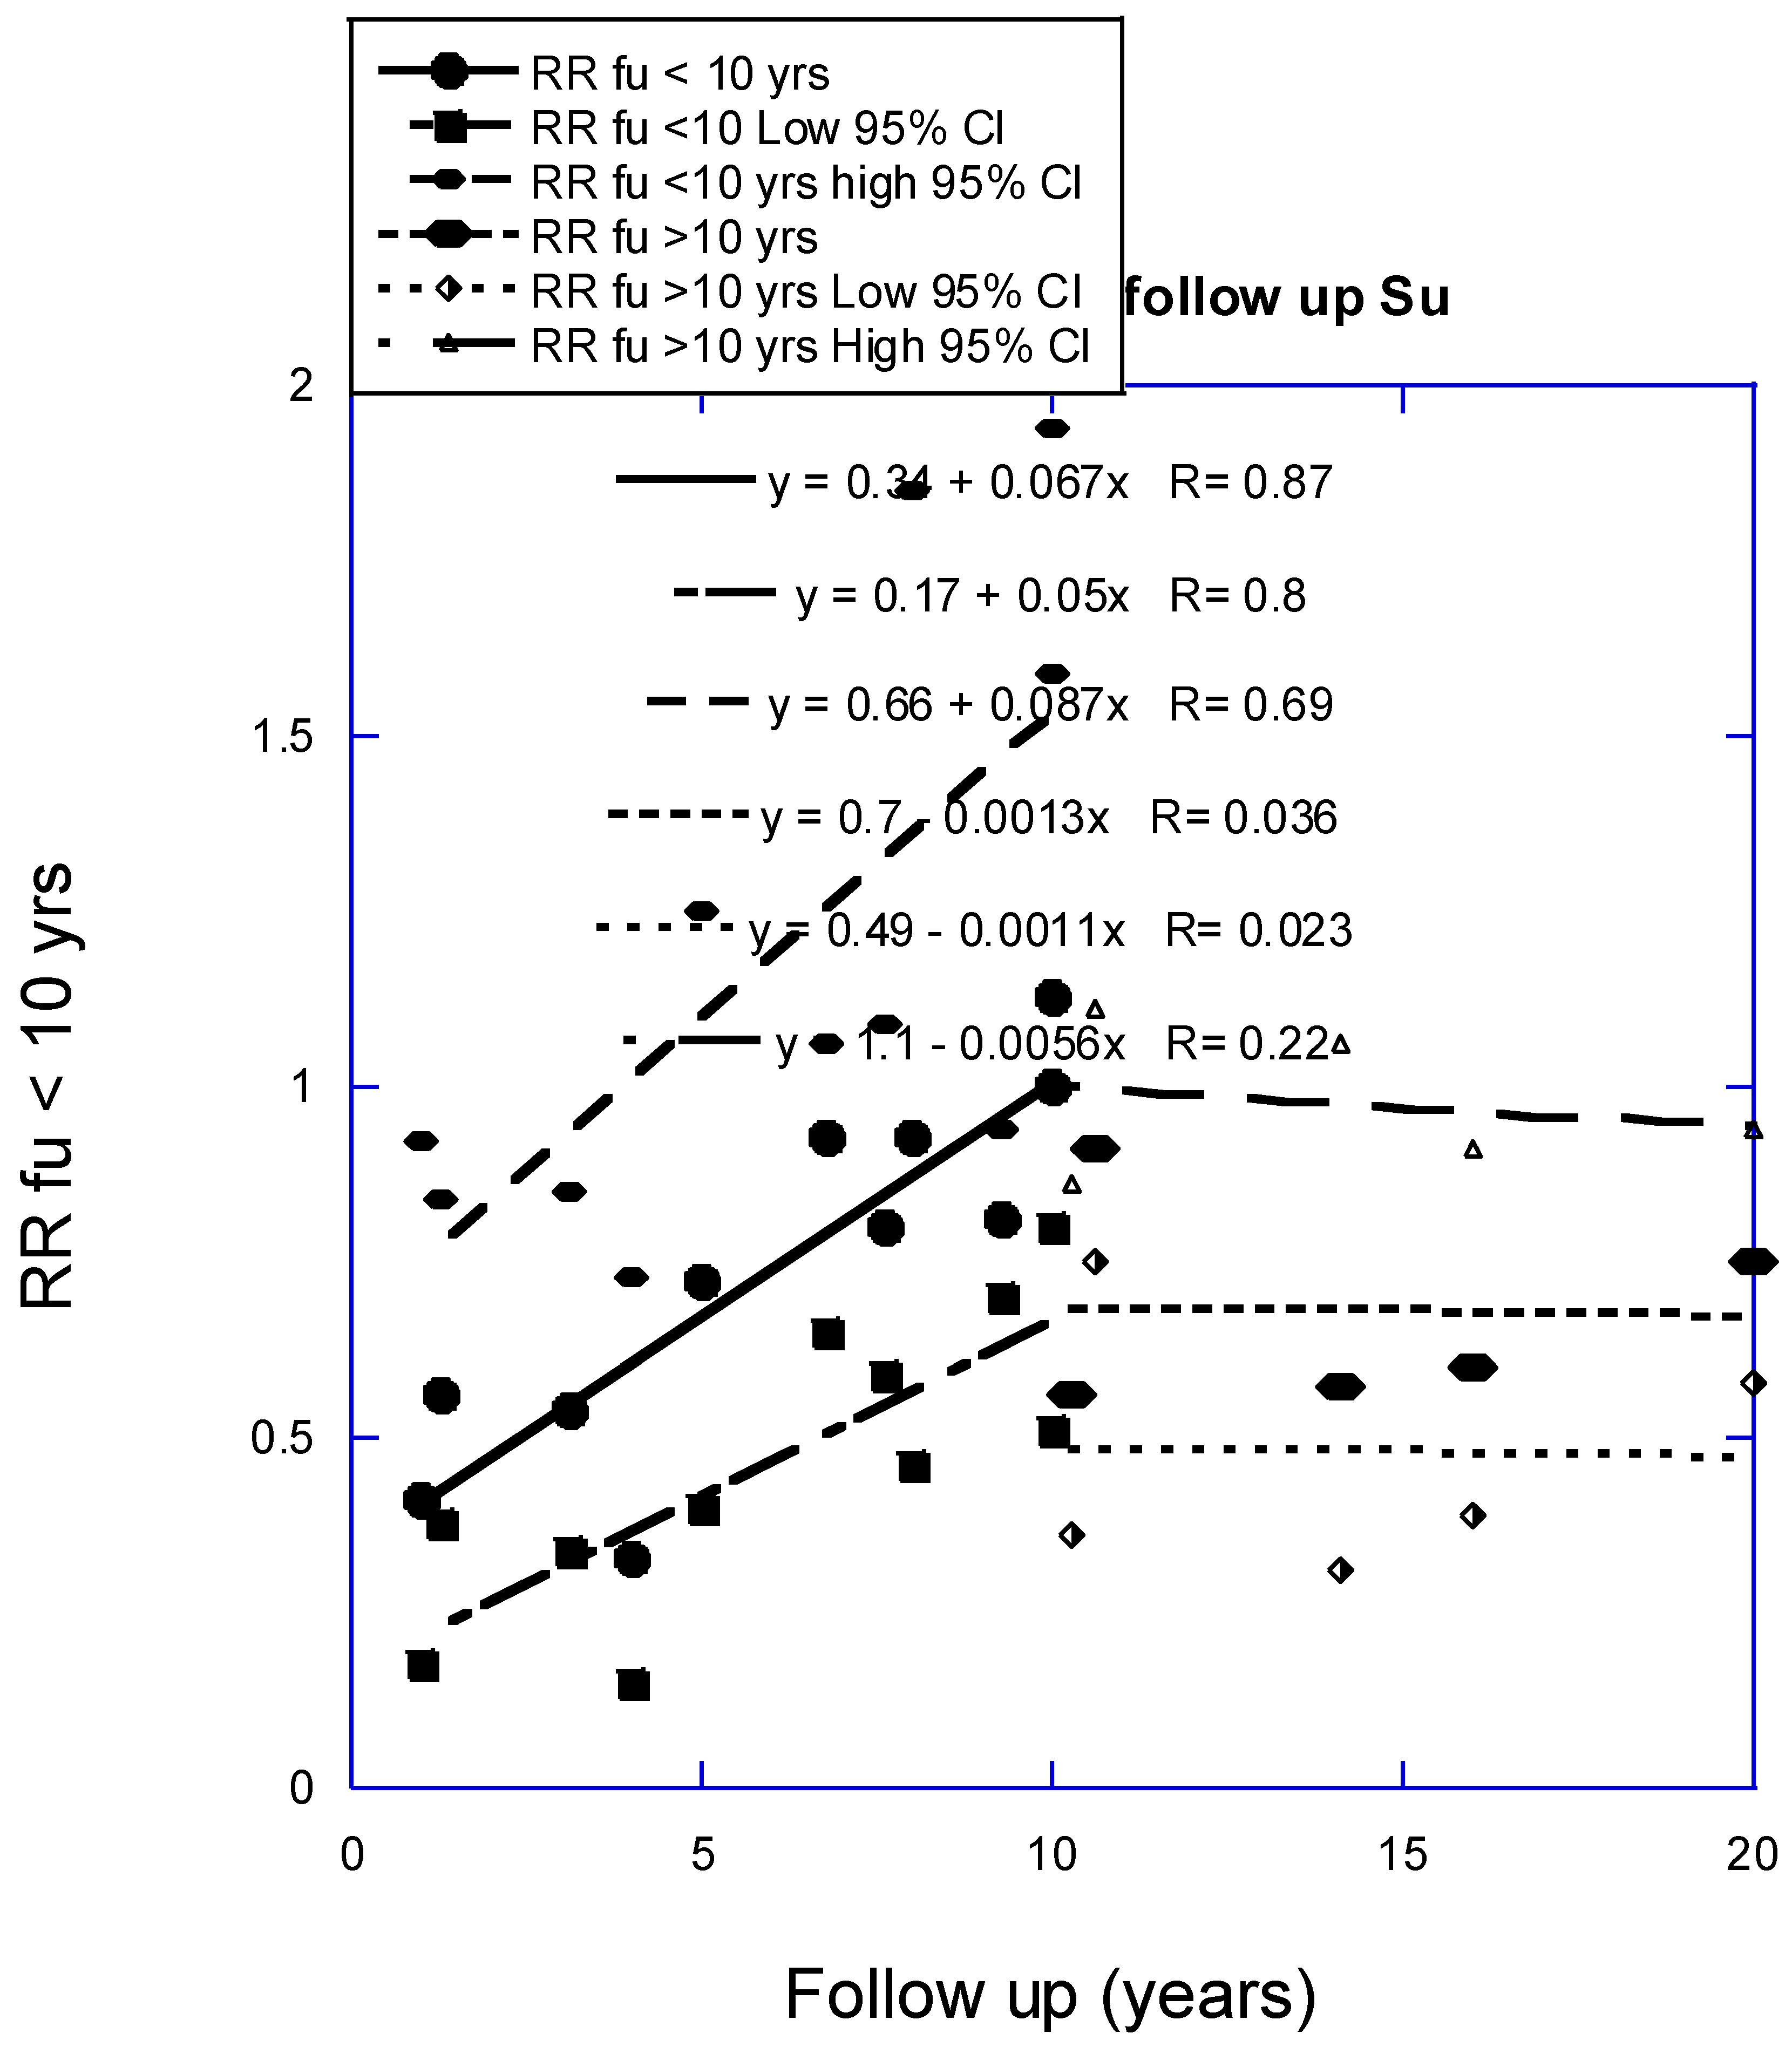
Figure 2.
Plot of relative risk of major CVD event vs. mean follow-up period.
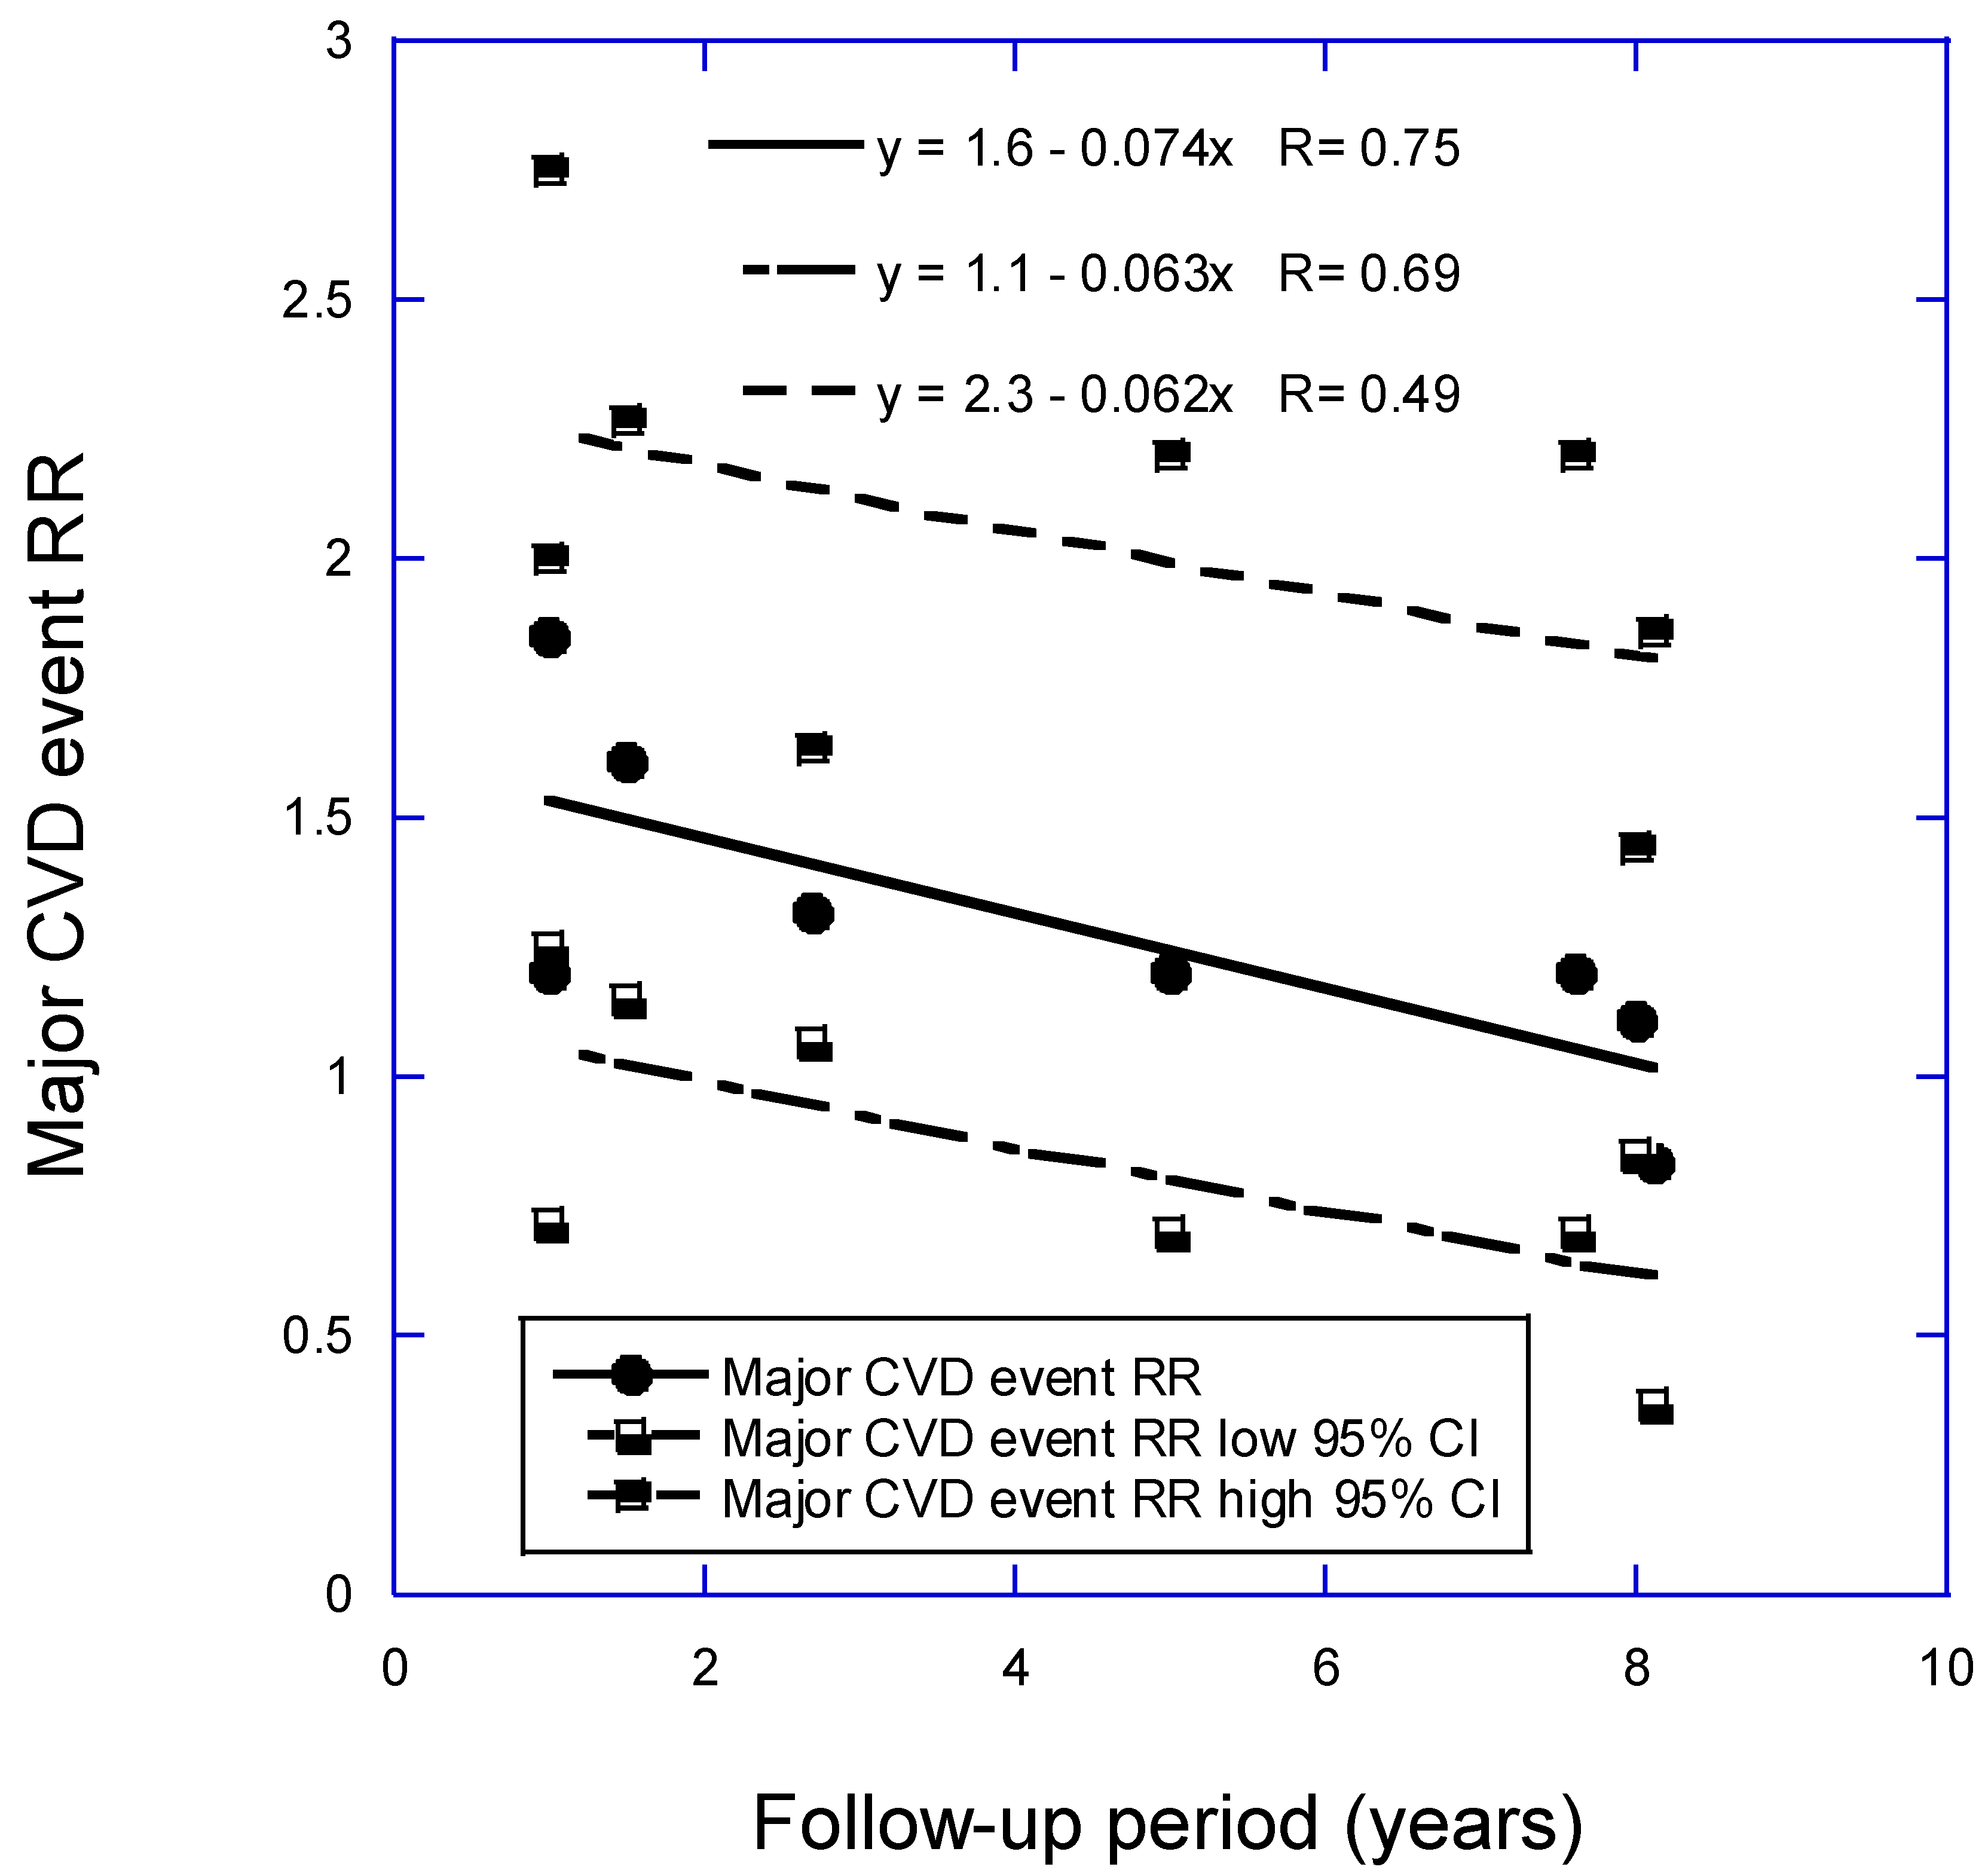
Table 2.
Results of short-term vitamin D supplementation on brain health.
| Participants | Duration (weeks) |
Condition | Intervention | Outcomes | Reference |
| Meta-analysis of nine clinical trials, China and Iran | 8‒52 | Mental health | 50,000 IU per week or two weeks or higher single dose | Beck Depression Inventory, weighted mean difference, -3.9 (95% CI, -5.2‒ -2.7) | [47] |
| 46 patients, India Baseline 25(OH)D: N/A |
12 | Major depressive disorder | usual treatment or usual treatment plus 3 million IU vitamin D | Significantly greater improvement in depression score with vitamin D than placebo; also quality of life. | [48] |
| 64 patients under methadone maintenance treatment, Iran. Baseline 25(OH)D: 14 ± 4 ng/mL |
24 | Cognitive function | 50,000 IU or placebo every two weeks | Vitamin D treatment resulted in significant improvement in Iowa Gambling Task, Verbal Fluency Test, Reverse Digit Span, and visual working memory. | [49] |
| 42 women, USA mean age 58 ± 6 years, BMI, 30.0 ± 3.5 kg/m2, Baseline 25(OH)D: 23 ± 6 ng/mL |
52 | Cognitive outcome | 600, 2000, or 4000 IU/d vitamin D3 | 2000 IU/d group had improved visual and working memory and learning; the 4000 IU/d group had slower attention reaction time | [50] |
There are many reasons why serum 25(OH)D concentrations change with time over time scales from months to years. Table 3 lists a number of these reasons along with references that provide more information.
Table 3.
Why 25(OH)D concentrations may change over time (should order be changed?).
| Reason | Reference | |
| Decline with age due to reduced production from solar UVB | [51] | |
| Increased awareness of the overall benefits of vitamin D | [52] | |
| Change amount of omega-3 fatty acid supplementation | [53] | |
| Change geographic location | [54] | |
| Retire from work | ||
| Change in diet with reduced meat, fish consumption | [55] | |
| Change in body mass | [56] | |
| Change in physical activity | [57] | |
| Change in use of sunscreen/sunblock, clothing when in sunlight | [58] | |
| Increased use of sunscreen in cosmetics | [59] | |
| Season | [60,61] | |
| Increased vitamin D supplementation after menopause | [62] | |
| Vitamin D fortification of food instituted country wide | [63] |
Disclaimer/Publisher’s Note: The statements, opinions and data contained in all publications are solely those of the individual author(s) and contributor(s) and not of MDPI and/or the editor(s). MDPI and/or the editor(s) disclaim responsibility for any injury to people or property resulting from any ideas, methods, instructions or products referred to in the content. |
© 2024 by the authors. Licensee MDPI, Basel, Switzerland. This article is an open access article distributed under the terms and conditions of the Creative Commons Attribution (CC BY) license (http://creativecommons.org/licenses/by/4.0/).
Copyright: This open access article is published under a Creative Commons CC BY 4.0 license, which permit the free download, distribution, and reuse, provided that the author and preprint are cited in any reuse.


