Submitted:
03 October 2024
Posted:
04 October 2024
You are already at the latest version
Abstract
The mining industry is a fundamental pillar of economic development in Peru, but mine tailings can generate contamination by toxic heavy metals such as Hg, As, Pb, Cd, and Zn, affecting health, flora, and fauna. This research aimed to characterize the physical, chemical, mineralogical, and toxicological properties of active and passive tailings in the Arequipa region of Peru to identify and quantify the presence of these heavy metals. Analytical techniques, such as granulometry, ICP, TCLP, SEM, and EDS were used to obtain detailed information about the characteristics of the tailings. The results showed significant variability in particle size distribution, as well as differences in mineralogical composition, including the presence of valuable and potentially toxic minerals. This study will allow corrective actions to be taken to prevent, minimize, or remediate potential negative impacts in the region.
Keywords:
Mine tailings
; heavy metals
; characterization
1. Introduction
The mining industry is a fundamental pillar of economic development in Peru. Arequipa is located in the southern region of Peru and represents a significant portion of the country's total metal production, including copper (Cu), gold (Au), zinc (Zn), lead (Pb), and molybdenum (Mo), with great growth potential [1,2].
Mine tailings generated during the extraction and processing of minerals become sources of contamination by toxic heavy metals if they are not managed properly [3]. These toxic heavy metals, such as mercury (Hg), lead (Pb), cadmium (Cd), arsenic (As), and zinc (Zn), can impact human health, flora, fauna, and ecosystems [4,5]. This issue has not only affected Peru, but has also represented a global environmental challenge [6].
The Inductively Coupled Plasma Optical Emission Spectroscopy (ICP-OES) is used to measure the concentration of heavy metals. In Romania, ICP-OES analysis has identified that concentrations of chromium (Cr), nickel (Ni), and cobalt (Co) have exceeded their normal values. Additionally, the Cd has exceeded its normal value (1 mg/kg), surpassed the alert threshold (5 mg/kg), and some samples have exceeded the intervention threshold (10 mg/kg). Zn has also surpassed its normal value (100 mg/kg), and part of the samples have exceeded the alert threshold (700 mg/kg). These results highlighted the need to implement environmental strategies to remediate the affected area [7].
In Brazil, a mineralogical study has been carried out using Scanning Electron Microscopy (SEM) on two types of tailings from one of the most gold-producing regions, Minas Gerais. The old tailings have consisted mainly of quartz (55.8%), carbonates (20.7%), iron oxides (8.86%), muscovite (5.56%), and chlorite (6.12%). Differing from the ongoing tailings, which have consisted of a high content of iron oxides (56.8%), gypsum (7%), and silicates (mainly quartz, 15.6%). Au values of up to 2.4 mg/kg in recent tailings are interesting as they have suggested the possibility of reprocessing [8].
The toxicity characteristic leaching procedure (TCLP) is employed to determine whether wastes are hazardous or not [9,10]. In China, concentrations of Cd were found in TCLP leachates from mine tailings of 1.30, 0.81, and 0.90 mg/L which were above or near the value of 1.0 mg/L, a criterion used to identify a hazardous waste [7]. It should be noted that particle size has affected many of the physical and chemical properties. Additionally, particles of different sizes have had different mineralogy, which has caused different leaching behaviors [11]. Furthermore, it is important to observe the shape of mine tailing’s particles, which are angular and irregular due to the grinding and crushing processes during mineral processing [12].
Numerous studies carried out in different parts of the world have suggested that mine tailings can be used as raw material for the manufacture of environmentally friendly and respectful construction materials [13]. This is achieved through geopolymerization technology, taking advantage of the aluminosilicates present in the mine tailings. Therefore, this technology could contribute to corrective actions for the encapsulation of heavy metals that are generally found in all mine tailings [14].
Thus, this research aims to physically, chemically, mineralogically, and toxicologically characterize active and inactive tailings in the Arequipa region, Peru, to identify and quantify the presence of the toxic heavy metals Hg, As, Pb, Cd, and Zn. This study will allow corrective actions to be taken to help prevent, minimize, or remediate possible negative impacts.
2. Materials and Methods
2.1. Location and Sampling of Tailing
Mine tailings are currently generating an environmental impact on nearby communities, as well as on the surrounding flora and fauna. In addition, they are affecting water bodies, soil, and air in the environment.
Figure 1 illustrates that among the active tailings that have been evaluated are Paraíso-Chala, Century-San Juan de Chorunga, Secocha-Secocha, and Galenos-Mollehuaca. All of them representing medium-scale mining, small-scale mining, artisanal mining, and informal mining in Arequipa.
Likewise, in Figure 1, it is shown that within the old tailings as environmental liabilities, Kiowa (Au, Cu)-Quequeña, Topacio-San Antonio de Chuca, Coriminas-Caylloma, Madrigal-Madrigal and Otapara-Acarí have been studied.
Table 1 provides a detailed classification of the various environmental liabilities and active tailings studied in the Arequipa region, Peru. Each sample has been identified and categorized based on its geographical location.
Environmental liabilities include abandoned mines and areas affected by previous mining activities, while active tailings are those currently in operation. This classification is essential for assessing environmental impact and planning mitigation and recovery strategies in the affected areas.
Historically, the Arequipa region has been significant in mining, with the extraction of minerals such as gold, silver, and copper. Furthermore, the discovery of zinc and iron deposits during the republican era led to the creation of new mining companies.
Mines K1 and K2, abandoned a decade ago, were exploited on a small and medium scale, with gold as the primary mineralization. C1, a significant mining area during the Viceroyalty of Peru, experienced a drastic reduction in activity during independence, severely affecting the local economy.
T1 left hazardous tailings exposed for 20 years, causing intoxication in local fauna. M1, operated until 1991, has tailings with toxic metals in precarious conditions. O1 faces risks of tailings dam collapse, affecting 500 families. P1 implemented advanced leaching technologies for gold processing but was relocated due to adverse climatic conditions. Arequipa has a temperate and dry climate, with temperatures ranging from 23.2°C to 6.9°C and scarce rainfall, more common and intense in winter when problems arise.
C2 and M2 contribute to environmental contamination through traditional and artisanal processes, respectively. S1 suffers from mercury contamination due to informal mining, severely affecting health, especially of children.
3. Results
This section is structured to precisely and concisely present the experimental results obtained through various analytical techniques, such as granulometry, ICP, TCLP, SEM, and EDS. Each of these techniques provides detailed information on the physical, chemical, mineralogical, and toxicological characteristics of the mining tailings under study.
These results suggest significant variability in particle size distribution across the different study sites, which may have important implications for soil stability and nutrient availability in the region.
3.1. Physical Characterization
3.1.1. Particle Size Distribution
The granulometric analysis revealed a varied particle size distribution in soil samples from the Arequipa region, Peru. For the identification of soil types, ASTM D2487 standards were used, which establish criteria for classifying soils based on their grain size distribution and plasticity.
The results obtained are presented in Table 2. It was observed that the K1 sample presented a higher proportion of medium to coarse particles, with 22.06% of material passing through sieve #200. This indicates that approximately 45 grams of the sample have a size of less than 0.075 mm, which suggests a predominance of particles corresponding to the sand fraction, according to the soil classification.
The K2 sample showed a more uniform particle size distribution, with a higher proportion of fine particles corresponding to the silt fraction. The analysis showed that 47.78% of the material passes through sieve #200, which means that approximately 99 grams of the sample are less than 0.075 mm. This behavior classifies the soil as predominantly fine, with a marked presence of silts.
On the other hand, the T1 sample showed a particle size distribution similar to the K1 sample, with medium to coarse particles predominance. The analysis revealed that 16.75% of the material passes through sieve #200, which indicates that approximately 35 grams of the sample are less than 0.075 mm, suggesting a soil with characteristics of mostly fine sand with clay.
Finally, the O1 sample presented a high proportion of fine particles, with 49.67% of the material passing through the #200 sieve, which corresponds to particles smaller than 0.075 mm. This high content of fines indicates a predominance of elastic silt-type particles.
3.2. Mineralogical Characterization
An oxidation zone was identified at the top of the tailings deposit during the preliminary evaluation, as shown in Figure 2(a). This zone was characterized by brown and gray soils, as shown in Figure 2(b), which corresponds to the environmental liability at Madrigal (M1).
The brown soils, present in loose and dense masses, suggest the predominant presence of secondary sulfates belonging to the jarosite group. The formation of these sulfates is attributed to acidic water conditions (pH < 3) and a high oxidative potential during the oxidation of iron sulfides such as pyrite, pyrrhotite, marcasite, among others [10].
On the other hand, the gray soils exhibit mineral forms characteristic of the intermediate oxidation process of sulfides, manifested in secondary sulfates of the melanterite group, as shown in Figure 2c.
3.2.1. Optical Microscope Analyses
The mineralogical analysis of mine tailings is crucial to understand the composition and distribution of the actual minerals, as well as to assess the environmental and economic impacts of mining activities. The following section presents the symbols used to identify the minerals and their overall mineralogical composition by sample. This information is fundamental for the characterization of the tailings and the identification of valuable or potentially toxic minerals.
Table 3 provides the abbreviations used for the identified minerals, facilitating the interpretation of the results.
Table 4 summarizes the overall mineralogical composition of each sample, expressed in percentages. The differences in the presence of primary minerals such as pyrite, rutile, magnetite, and goethite are highlighted, as well as the identification of secondary minerals of interest such as galena, chalcopyrite, arsenopyrite, hematite, sphalerite, and gray copper. These variations suggest the diversity of mineral contents and the potential exploitation of different resources. Figure 3 show photographs of these minerals.
Samples T1, M1, P1, C2, S1, and M2 exhibit a high concentration of pyrite as the predominant mineral. Differences are highlighted with the additional content of goethite in T1, as well as traces of hematite, chalcopyrite, covellite, chalcocite, and marcasite. For M1, traces of minerals such as hematite, goethite, magnetite, and chalcopyrite. For P1, percentages of goethite, rutile, chalcopyrite, galena, and arsenopyrite. For C2, goethite, rutile, and chalcopyrite. For S1, chalcopyrite along with minerals containing bismuth, lead, zinc, copper, gold, and silver. And for M2, which complementarily contains rutile, chalcopyrite, and arsenopyrite.
On the other hand, sample K1 contains hematite and goethite as the main minerals, and additionally magnetite, pyrite, and rutile, as well as the presence of native gold. Similarly, samples K2 and O1 contain magnetite and pyrite as the main minerals. K2 is notable for having additional rutile, suggesting the presence of titanium. While O1 presents traces of hematite, goethite, and chalcopyrite.
Regarding samples C1, they contain goethite as the main mineral and also present small amounts of pyrite.
Figure 3 illustrates various samples of environmental liabilities and active tailings. Figure 3(a) shows a photograph of the environmental liability K1, where free grains of GGs and native gold are observed. Figure 3(b) corresponds to K2, with free grains of cp, rt, and GGs. Figure 3(c) pertains to the environmental liability C1, where free grains of goe, hm, and GGs are visible. Figure 3(d) presents T1, which displays a lateral intergrowth of goe and hm, along with free grains of cp. Figure 3(e) provides a low-magnification view of sample M1, where py can be observed. Figure 3(f) corresponds to the environmental liability O1, where the primary metallic mineral is mt, with free grains of py and GGs. Figure 3(g) shows the photograph of the active tailings P1, which features apy included in cp, and free grains of GGs, apy, and py. Figure 3(h) corresponds to C2, showing hm with included goe, as well as py laterally associated with goe, rt, and free GGs. Figure 3(i) presents a photograph of M2, where the primary metallic mineral is free py, along with inclusions of GGs. Finally, Figure 3(j) corresponds to sample S1, which displays an intergrowth of pyrite laterally associated with a silver-gold solid solution (Ag, Au), as well as an intergrowth of cp with inclusions of copper-silver sulfide (SULs_AgCu), cv, and goe at its edges
3.2.2. Scanning Electron Microscope Analyses and EDS X-ray Energy Dispersive Spectroscopy
Scanning electron microscopy (SEM) detects mineral-bearing elements in the examined samples. The comparative analysis of results obtained through scanning electron microscopy across various mineral samples has facilitated the identification of significant similarities and differences in their overall mineralogical composition.
The combined analysis of scanning electron microscopy (SEM) images and energy dispersive spectroscopy (EDS) spectra was essential in this study for the comprehensive characterization of the composition and structure of elements present in the tailings.
Table 5 presents the main metallic minerals and the elemental distribution across the 10 samples under study. The analysis reveals that lead (Pb) is the most prevalent element in the samples K1, K2, T1, C1, S1, M2, and P1, as shown in Table 5. Arsenic (As) is present in the samples C1, M2, and P1; zinc (Zn) is found in the samples S1 and P1; mercury (Hg) is detected in sample M2; and no presence of cadmium (Cd) is observed in any of the samples.
Regarding valuable elements such as Au, it is present in the K1 and S1 samples; Silver (Ag) is found in the K1, C1, and S1 samples; and Cu is present in the K1, K2, T1, C1, M1, S1, C2, P1, and O1 samples, which can be recovered with further in-depth study. On the other hand, Uranium (U) was found in the O1 sample, which is a radioactive element that should be taken into consideration due to its unstable nucleus, easy disintegration, and energy emission. It is also known to be a health hazard.
Figure 4 and Figure 6 present the SEM micrographs and EDS spectra of the environmental liabilities. In K1, the presence of native gold (Figures 4(a) and 6(a)); and in K2, chalcopyrite as a source of copper (Figures 4(b) and 6(b)). Galena is found in both samples, indicating a potential source of lead and other associated elements that can be highly toxic in Arequipa. Arsenopyrite (Figures 4(c) and 6(c)), contains arsenic, a highly toxic metalloid for the environment and human health. Covellite (Figures 4(d) and 6(d)) is found in C1 and T1 in Caylloma, suggesting oxidation and sulfidation processes that may influence the mobility of heavy metals. The identification of pyrite and chalcopyrite (Figures 4(e) and 6(e)) in Madrigal is significant due to their role in the generation of acid mine drainage (AMD), a phenomenon that can release toxic metals into the environment. The presence of tetrahedrite (Figures 4(f) and 6(f)) in Paraíso indicates the potential release of zinc, a highly toxic metal for the environment and human health. These are illustrated in Figure 4 and Figure 6.
In addition, Figure 5 and Figure 7 show the SEM micrographs and EDS spectra obtained for assets C2, M2, S1 and O1. Goethite (Figures 5(a) and 7(a)), identified in Century is indicative of oxidation processes that may affect the mobility of heavy metals present in the tailings. The presence of cinnabar (Figures 5(b) and 7(b)) in Mollehuaca suggests the presence of mercury, a metal with significant implications for public health and the environment. Conversely, the detection of argentocuproite (Figures 5(c) and 7(c)) in Secocha indicates the presence of economically valuable minerals. Finally, (Figures 5(d) and 7(d)) in Otapara features the mineral uraninite, which contains uranium radioactive element that requires special handling due to its unstable nucleus.
Figure 4 displays SEM micrographs. Photograph (a) of sample K1 at a magnification of 3850x shows free Au particles. Photograph (b) of sample K2 at a magnification of 2240x displays free cp grains, a mineral containing Cu. Photograph (c) of sample C1 at a magnification of 1050x shows free apy grains. Photograph (d) of sample T1 at a magnification of 1030x presents free cv grains. Photograph (e) of sample M1 at a magnification of 853x shows free cp grains. Finally, Photograph (f) of sample P1 at a magnification of 972x displays free particles of py, goe, cp, apy, and td.
Figure 5 displays SEM micrographs. Photograph (a) of sample C2 at a magnification of 313x shows free particles of goe and py. Photograph (b) of sample M2 at a magnification of 4195x reveals free particles of cnn. Photograph (c) of sample S1 at a magnification of 1480x shows intergrowths of goe, bn, cv, and cp; free hm particles; and free AgCu_cos particles. Finally, Photograph (d) of sample O1 at a magnification of 1130x presents lateral intergrowths of mt and urt.
The importance of SEM lies in its ability to detect trace minerals not visible with optical microscopy, such as small grains of barite, wolframite, phosphates, and uraninite, providing greater accuracy in identifying metallic minerals and revealing additional crucial details about the composition of the samples. This method complemented and validated the results obtained from optical microscopy, offering a more comprehensive and precise view of the mineralogical composition of the samples, which is essential for assessing their economic potential and developing exploitation strategies.
In summary, SEM not only confirmed the previous findings of optical microscopy but also significantly enhanced the precision and depth of mineralogical analysis, revealing additional important details for the evaluation and exploitation of mineral resources.
Figure 6 and Figure 7 display the EDS spectra for the 6 environmental liability samples (K1, K2, C1, T1, M1, and P1) and 4 active tailings samples (C2, M2, S1, and O1). The position of the peaks in the spectra identifies the elements present in the material under study, while the intensity of the peaks corresponds to the concentration of each element. Both Figure 6 and Figure 7 corroborate the values tabulated in Table 5 regarding the valuable elements.
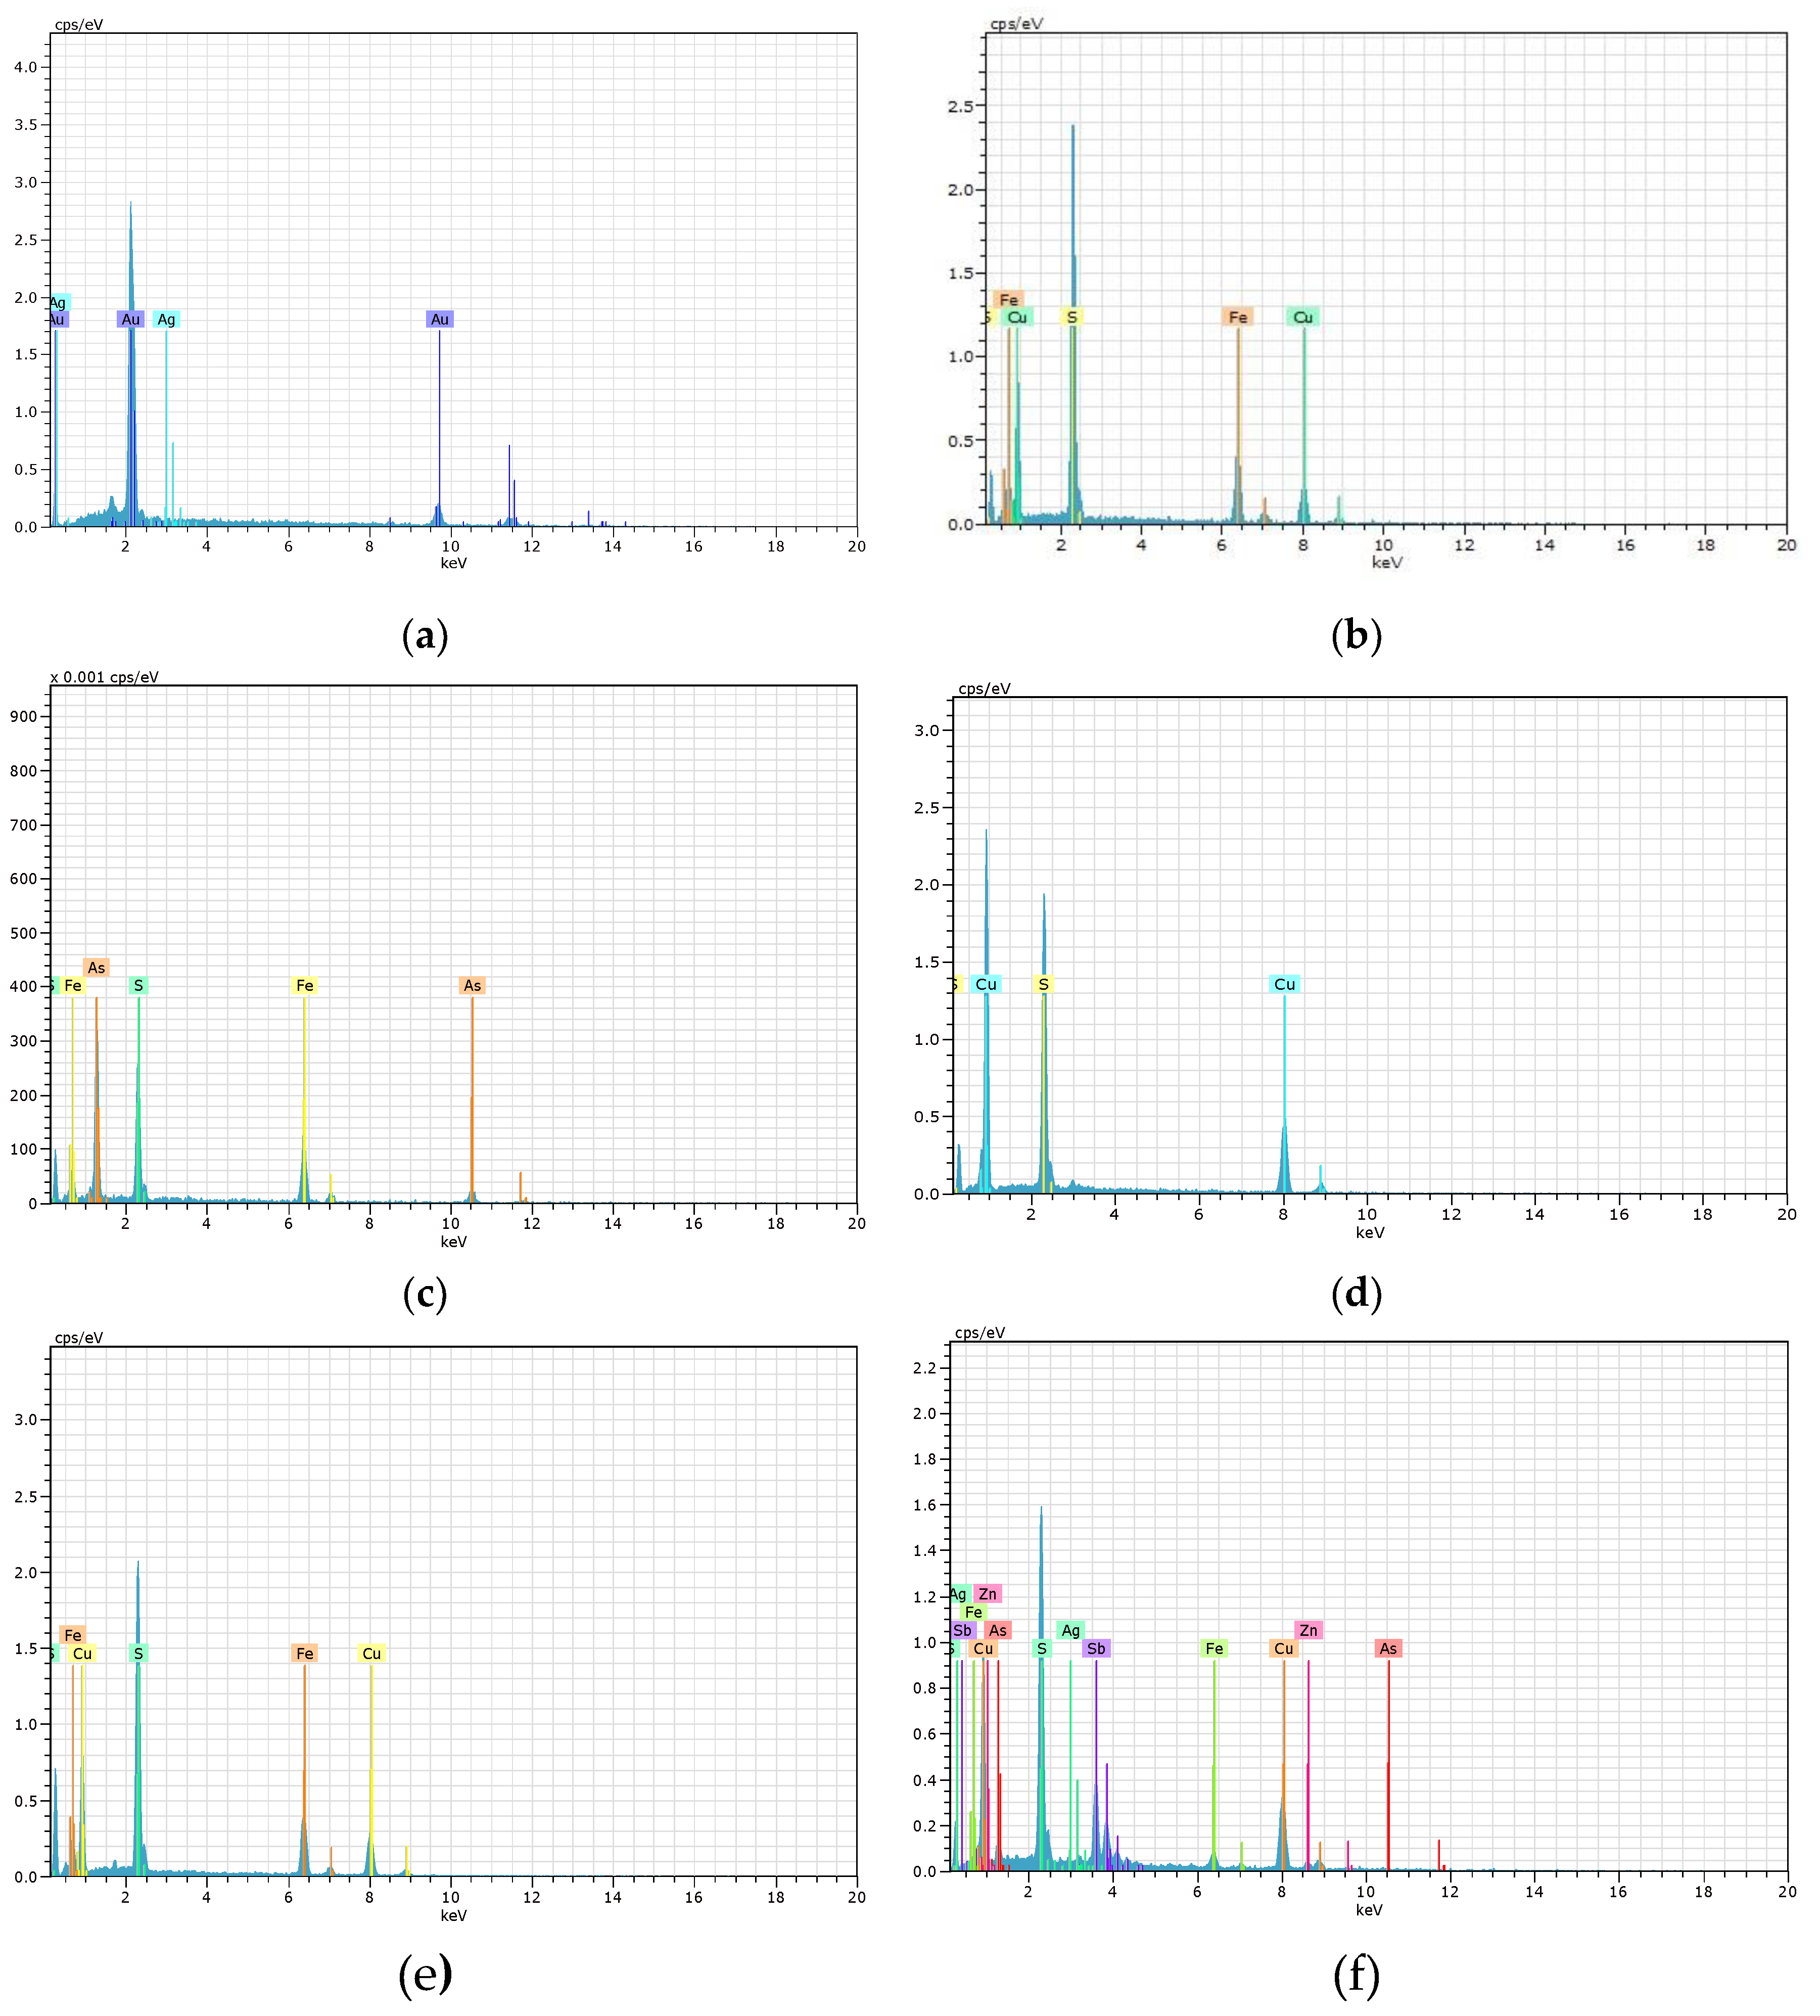
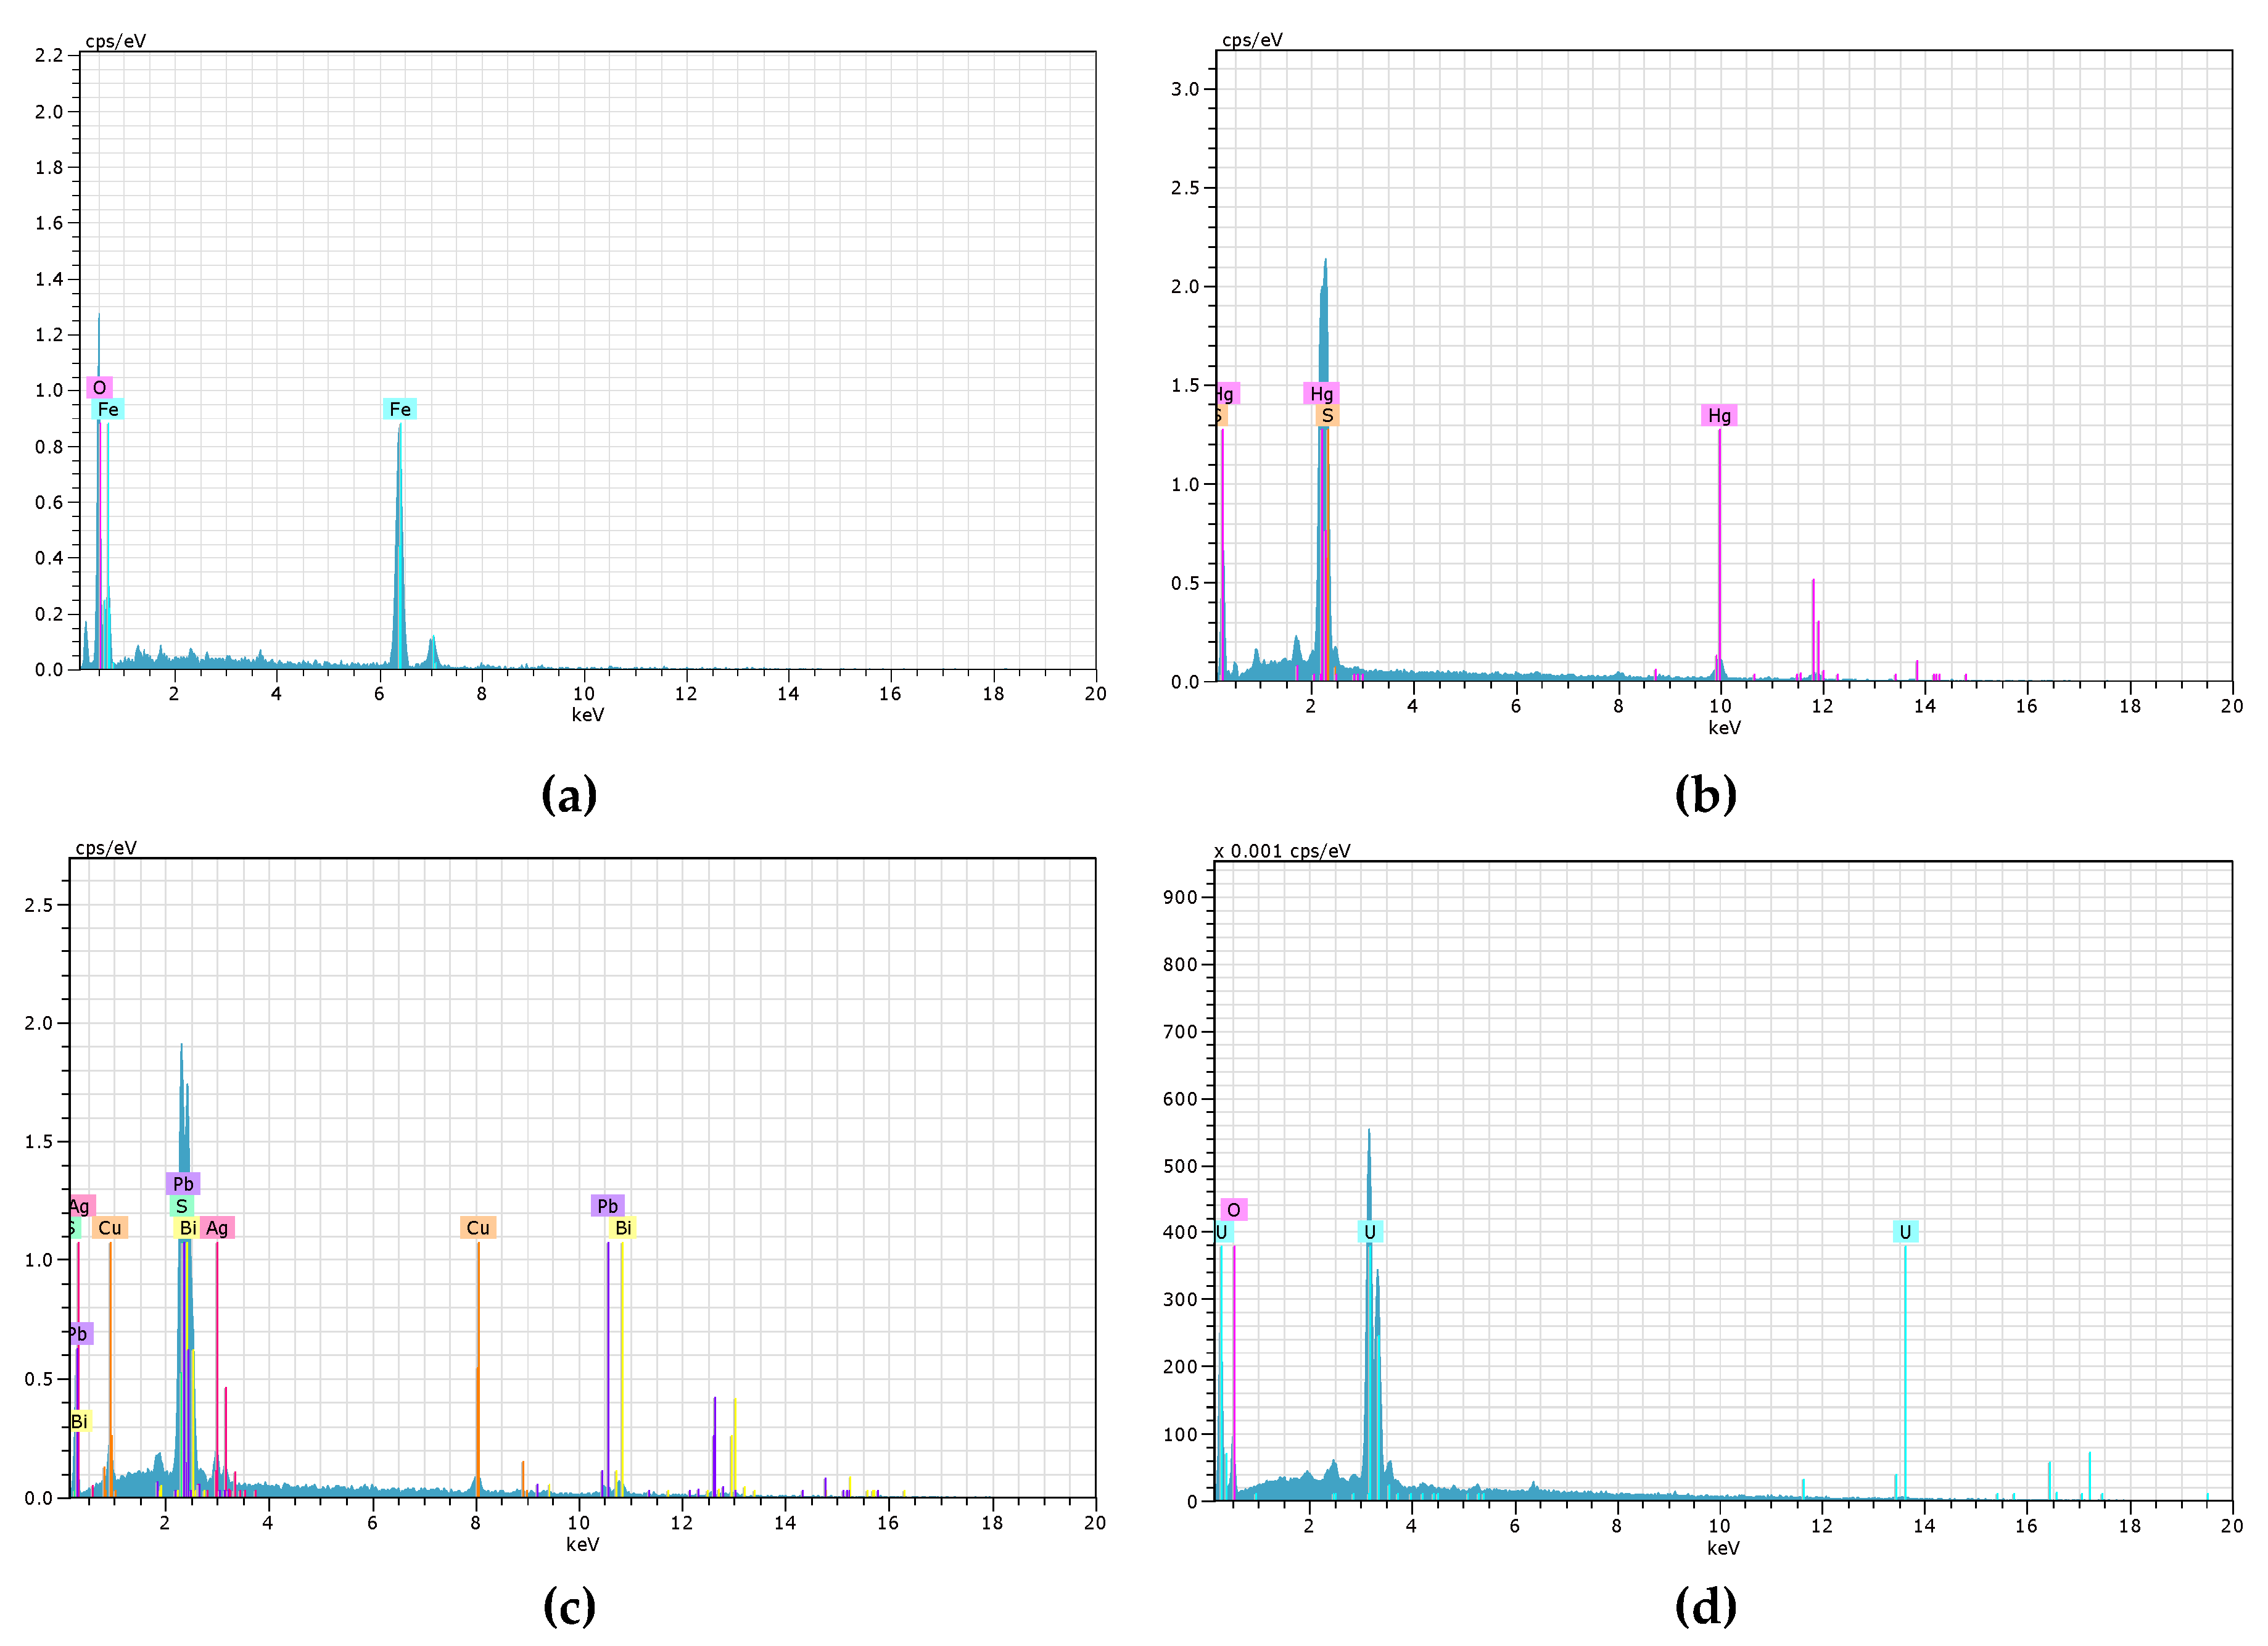
Figure 6.
EDS spectra of various minerals studied in the environmental liabilities: (a) Native gold (K1), (b) Chalcopyrite (K2), (c) Arsenopyrite (C1), (d) Covellite (T1), (e) Chalcopyrite (M1), (f) Tetrahedrite (P1).
Figure 6.
EDS spectra of various minerals studied in the environmental liabilities: (a) Native gold (K1), (b) Chalcopyrite (K2), (c) Arsenopyrite (C1), (d) Covellite (T1), (e) Chalcopyrite (M1), (f) Tetrahedrite (P1).
Figure 7.
EDS spectra of various minerals studied in the active tailings: (a) Goethite (C2), (b) Cinnabar (M2), (c) Argentocuproite (S1), and (d) Uraninite (O1).
Figure 7.
EDS spectra of various minerals studied in the active tailings: (a) Goethite (C2), (b) Cinnabar (M2), (c) Argentocuproite (S1), and (d) Uraninite (O1).
The application of SEM combined with EDS in the analysis of mine tailings provides a detailed characterization of the elemental composition of the minerals present. This approach enables a comprehensive evaluation of the mineralogy of the tailings and helps to understand the geochemical processes that may affect the mobility of contaminants in the environment.
3.2. Chemical and Toxicological Characterization
Table 6 present the results of the toxicological analysis of environmental liabilities, detailing the levels of heavy metals such as arsenic (As), cadmium (Cd), mercury (Hg), lead (Pb), and zinc (Zn). These tables show the concentrations of these toxic metals identified through TCLP analysis in the ten samples studied, using ICP for their determination.
The table 6 reveal that lead concentrations in some samples, such as M1 and P1, exceed 2,000 mg/kg. Several samples, including K2, T1, P1, M2, and S1, show elevated arsenic concentrations, exceeding 200 mg/kg. Additionally, some samples like T1, P1, and S1 exhibit cadmium levels exceeding 20 mg/kg. Notably, sample S1 has a significant mercury concentration, reaching values of >275.0 mg/kg, standing out compared to the other samples.
On the other hand, samples P1 and S1 also show significant mercury presence, with values of 35.0 mg/kg and 193.1 mg/kg, respectively. Sample P1 has a considerable concentration of zinc, at 2,309 mg/kg. Additionally, samples such as T1, M1, and S1 exhibit notable concentrations of zinc, with values of 1,221.0 mg/kg, 323.3 mg/kg, and 375.3 mg/kg, respectively.
The toxicological analyses performed on these soil samples specifically focus on measuring the levels of heavy metals such as arsenic, cadmium, mercury, lead, and zinc.
Table 7 shows that the concentrations of arsenic in the T1 and P1 samples exceed 0.3 mg/L; cadmium concentrations in the K2, T1, M1, and P1 samples exceed 0.04 mg/L; mercury concentrations in the P1 and S1 samples exceed 0.02 mg/L; lead concentrations in the K1, T1, P1, M2, and S1 samples exceed 0.07 mg/L; and zinc concentrations in the K2, T1, and M1 samples exceed 2.5 mg/L.
4. Discussion
The results of this study reveal significant variability in particle size distribution and mineralogical composition of the mine tailings samples analyzed in the Arequipa region, Peru.
The detailed characterization of mine tailings in Arequipa, Peru, aligns with observations made on an old sulfide tailings deposit in Siberia, Russia [17]. Both studies identify significant variability in the physical, chemical, and mineralogical properties of mining waste, underscoring its importance in understanding the stability and transport of contaminants in the environment.
For example, sample K1 exhibited a predominance of medium to coarse particles, with 22.06% of the sample having a particle size of #-200. In contrast, sample K2 displayed a more uniform distribution, with a higher proportion of silt-sized particles, totaling 47.78% of the sample with a particle size of #-200.
The detailed mineralogical characterization of rare earth tailings from Bayan Obo [18], serves as a valuable point of comparison for the results obtained in the investigation of tailings in Arequipa. Both studies employed advanced analytical techniques such as ICP, XRD, SEM-EDS, and EPMA to determine chemical composition, mineral phases, element distribution, and trace occurrences like scandium (Sc). Comparing these results enhances the comprehensive understanding of the characteristics and recovery potential of valuable resources (REE, Nb, Sc, etc.) from mine tailings in both regions, which is crucial for developing effective processing and treatment strategies.
Significant mineralogical differences were identified between the samples. Sample K1 was distinguished by the presence of native gold, highlighting its economic potential. Meanwhile, sample S1 contained bismuth-bearing minerals such as argentocuprocosalite, aikinite, and wittichenite, along with a silver-gold solid solution, unique characteristics not observed in other samples.
The potential of mine tailings from the Montevecchio district in Sardinia, Italy, is also explored [19] as sources of critical and strategic materials (SRM and CRM). Using techniques such as XRD, SEM, and ICP-MS, it was determined that tailings from the Sanna processing plant contain significant amounts of lead (1.2% by weight), zinc (2.6% by weight), and approximately 600 mg/kg of Rare Earth Elements (REE). Additionally, the white crusts (patinas) formed in the riverbed, primarily composed of zinc minerals, contain up to 2,900 mg/kg of REE.
The analyses of the 10 samples confirm the presence of the heavy metals under study (arsenic, cadmium, mercury, lead, and zinc) in significant amounts. Therefore, further treatment is necessary, which should be studied in greater depth (encapsulation studies, phytoremediation studies, etc.) according to the predominant metal, due to its toxicity and impact on health and the environment.
5. Conclusions
The main conclusions of this characterization study are summarized below:
- The physical, chemical, mineralogical, and toxicological characterization of active and passive mine tailings in the Arequipa region, Peru, allowed the identification and quantification of toxic heavy metals such as mercury, arsenic, lead, cadmium, and zinc. The analyses revealed significant variability in particle size distribution among the different tailing samples, which has important implications for the stability and transport of these contaminants in the environment.
- The mineralogical composition of the tailings also showed notable differences, with the presence of valuable minerals such as native gold, as well as potentially toxic minerals carrying mercury, arsenic, lead, cadmium, and zinc. The results indicate an urgent need to implement comprehensive environmental strategies to prevent, minimize, or remediate the negative impacts of heavy metal contamination on human health, flora, fauna, and regional ecosystems.
- This detailed characterization of mine tailings provides valuable information to guide corrective and remediation actions. Fostering the development of future research lines that delve deeper into the dynamics and transport of these contaminants at local and regional levels.
Author Contributions
For research articles with several authors, a short paragraph specifying their individual contributions must be provided. Conceptualization, D.C., G.P. HB and K.P.; methodology, D.C. and L.S.; software, G.P.; validation, HB and P.N.; formal analysis, D.C. and HB; investigation, D.C., KP and L.S.; resources, K.P.; data curation, G.P.; writing - original draft, D.C.; writing - review and editing, K.P., G.P. HB and P.N.; visualization, G.P.; supervision, P.N. and G.P.; project administration, K.P.; funding acquisition, G.P and HB. All authors have read and approved the published version of the manuscript.
Funding
This research was funded by the Basic or Applied Research Project in Biomedical Engineering and Sciences 2018-2B with grant numbers. IBAIB-10-2019-UNSA, from the Universidad Nacional de San Agustín de Arequipa—Peru.
Data Availability Statement
The data presented in this study are available upon request from the corresponding author. The data are not publicly available as they are part of a larger ongoing project for mapping heavy metals and geopolymer applications.
Acknowledgments
The authors gratefully acknowledge the financial assistance provided by the Universidad Nacional de San Agustín de Arequipa—Perú to carry out this research [grant numbers: IBAIB-10- 2019-UNSA]. As well as Oscar Jesús Flores Avendaño, Lic Miguel Ángel Alarcón García, y Andrea Del Pilar Machaca Arcana for their valuable support in the administrative and logistical aspects.
Conflicts of Interest
The authors declare no conflicts of interest.
References
- Julca, D. La economía circular en la minería peruana [Internet]. Comisión Económica para América Latina y el Caribe; 2022. Available from: www.cepal.org/es/publications.
- Arcos, F.; Loaiza, E.; Calderón, C. Actividad Minera Artesanal En La Región Arequipa, INGEMMET.; Boletín, Serie E: Minería. 2022, 1–112. https://hdl.handle.net/20.500.12544/3600.
- Chen T, Wen X, Zhang L, Tu S, Zhang J, Sun R, et al. The geochemical and mineralogical controls on the release characteristics of potentially toxic elements from lead/zinc (Pb/Zn) mine tailings. Environ Pollut. 2022 Oct;120328. [CrossRef]
- Gitari MW, Akinyemi SA, Thobakgale R, Ngoejana PC, Ramugondo L, Matidza, M., et al. Physicochemical and mineralogical characterization of Musina mine copper and New Union gold mine tailings: Implications for fabrication of beneficial geopolymeric construction materials. J Afr Earth Sci. 2018 Jan;137:218–28. [CrossRef]
- Canales-Gutiérrez, Á. Las Cuencas Hidrográficas y Los Relaves Mineros. Selva Andina Biosphere 2021, 9, 2, 67–68. https://doi.org/10.36610/j.jsab.2021.090200067. [CrossRef]
- Llacza Ladera, H.; Castellanos Sánchez, P. Hongos Filamentos de Relave Minero Contaminado Con Plomo y Zinc. Revista del Instituto de investigación de la Facultad de minas, metalurgia y ciencias geográficas 2020, 23, 45, 37–42. https://doi.org/10.15381/iigeo.v23i45.18046. [CrossRef]
- Petrean, I.A.; Micle, V.; Sur, I.M.; Șenilă, M. Characterization of Sterile Mining Dumps by the ICP-OES Analytical Method: A Case Study from Baia Mare Mining Area (Maramures, Romania). Sustainability 2023, 15, 1158. https://doi.org/10.3390/su15021158. [CrossRef]
- Lemos, M.; Valente, T.; Marinho, P.; Fonseca, R.; Delbem, I.; Ventura, J.; Magalhães, M. Mineralogical and Geochemical Characterization of Gold Mining Tailings and Their Potential to Generate Acid Mine Drainage (Minas Gerais, Brazil). Minerals 2021, 11 ,39. https://doi.org/10.3390/min11010039. [CrossRef]
- Xu DM, Fu RB. A comparative assessment of metal bioavailability using various universal extractants for smelter contaminated soils: Novel insights from mineralogy analysis. J Clean Prod. 2022 Sep;367:132936. [CrossRef]
- Akhavan, A.; Golchin, A. Estimation of Arsenic Leaching from Zn–Pb Mine Tailings under Environmental Conditions. J Clean Prod 2021, 295, 126477. https://doi.org/10.1016/j.jclepro.2021.126477. [CrossRef]
- Wang, P.; Sun, Z.; Hu, Y.; Cheng, H. Leaching of Heavy Metals from Abandoned Mine Tailings Brought by Precipitation and the Associated Environmental Impact. Science of the Total Environment 2019, 695, 133893. https://doi.org/10.1016/j.scitotenv.2019.133893. [CrossRef]
- Cao G, Wang W, Yin G, Wei, Z. Experimental study of shear wave velocity in unsaturated tailings soil with variant grain size distribution. Constr Build Mater. 2019 Dec;228:116744. [CrossRef]
- Ilieva D, Angelova L, Radoykova T, Surleva A, Chernev, G., Vizureanu, P., et al. Characterization of Bulgarian Copper Mine Tailing as a Precursor for Obtaining Geopolymers. Materials. 2024 Jan 23;17(3):542. [CrossRef]
- Akeed MH. Mine tailings-based geopolymers: Physical and mechanical properties [Internet]. 2022 Aug [cited 2023 Feb 16]. Available from: https://preprints.scielo.org/index.php/scielo/preprint/view/4509/version/4773.
- Pye, K., Blott SJ. Particle size analysis of sediments, soils and related particulate materials for forensic purposes using laser granulometry. Forensic Sci Int. 2004 Aug;144(1):19–27. [CrossRef]
- Hillel, D. Introduction to environmental soil physics. Amsterdam ; Boston: Elsevier Academic Press; 2004. 494 p.
- Muravyov, M.; Radchenko, D.; Tsupkina, M.; Babenko, V.; Panyushkina, A. Old Sulfidic Ore Tailing Dump: Ground Features, Mineralogy, Biodiversity—A Case Study from Sibay, Russia. Minerals 2024, 14, 23. https://doi.org/10.3390/min14010023. [CrossRef]
- Shao, D.; Du, X.; Deng, Y.; Yan, Z.; Duan, W.; Yu, H.; Qi, T. The Process Mineralogical Characterization of Bayan Obo Rare-Earth Tailings and Density Functional Theory Study of the Occurrence State of Sc. Minerals 2023, 13, 1287. https://doi.org/10.3390/min13101287. [CrossRef]
- Sedda, L.; De Giudici, G.; Fancello, D.; Podda, F.; Naitza, S. Desbloqueo de Materias Primas Estratégicas y Críticas: Evaluación del Enriquecimiento de Zinc y REEs en Relaves y Zn-Carbonato en un Área Minera Histórica (Montevecchio, SW Cerdeña). Minerales 2024, 14, 3, 3. https://doi.org/10.3390/min14010003. [CrossRef]
Figure 1.
Map of the Arequipa region, showing the location of various active and inactive tailings.
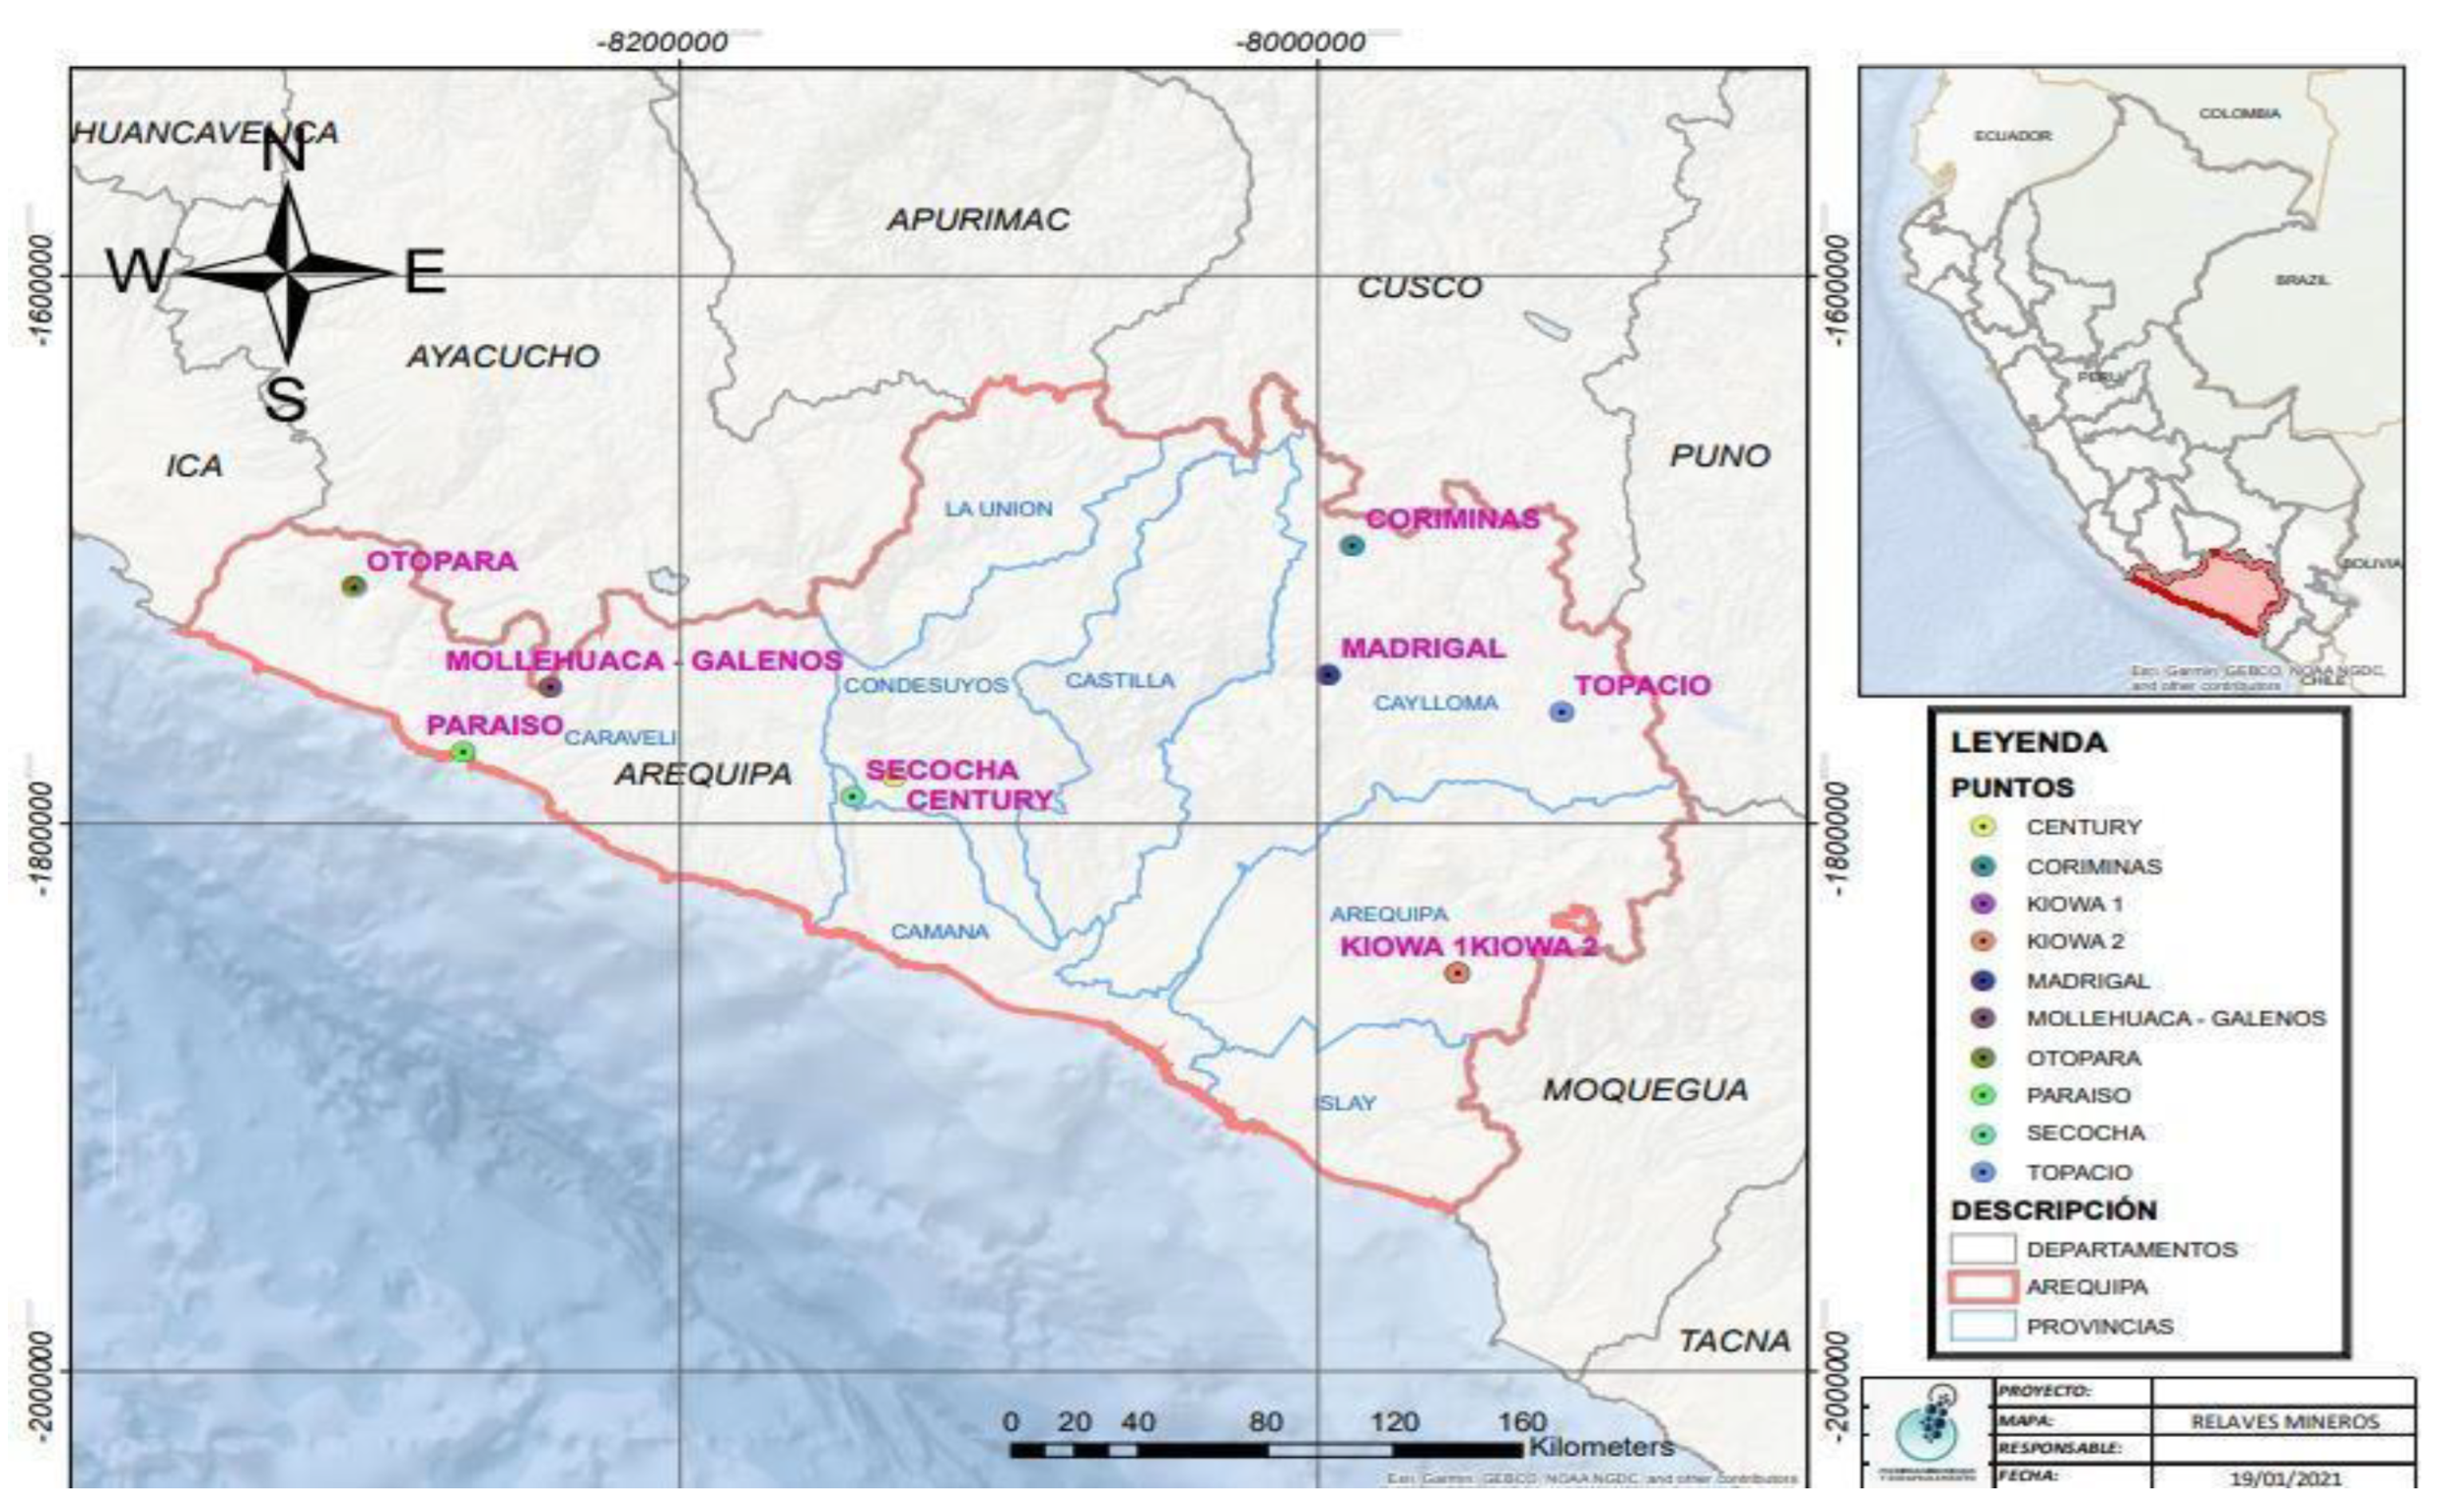
Figure 2.
Tailings deposits (a) Coriminas; (b) Madrigal; (c) Secocha.
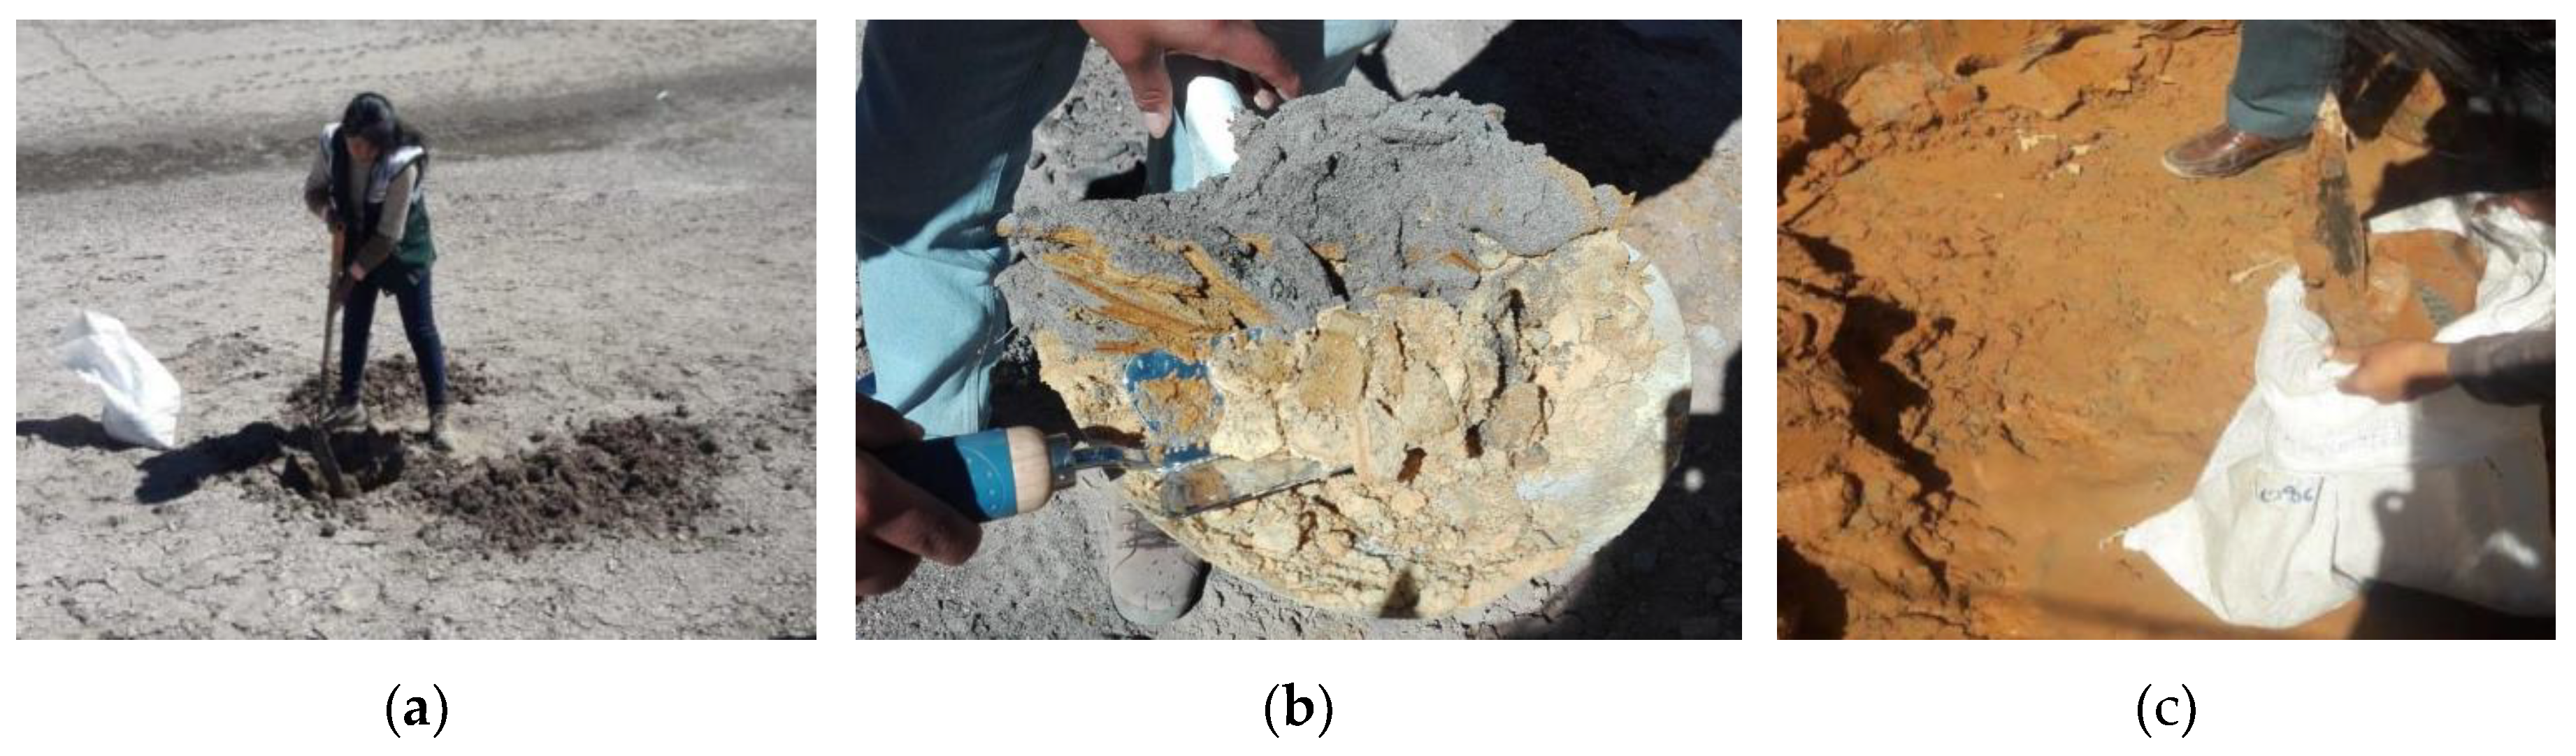
Figure 3.
Optical Microscope Analyses of environmental liabilities and active tailings at 20 µm: (a) K1; (b) K2; (c) C1; (d) T1; (e) M1; (f) O1; (g) P1; (h) C2; (i) M2; and (j) S1.
Figure 3.
Optical Microscope Analyses of environmental liabilities and active tailings at 20 µm: (a) K1; (b) K2; (c) C1; (d) T1; (e) M1; (f) O1; (g) P1; (h) C2; (i) M2; and (j) S1.
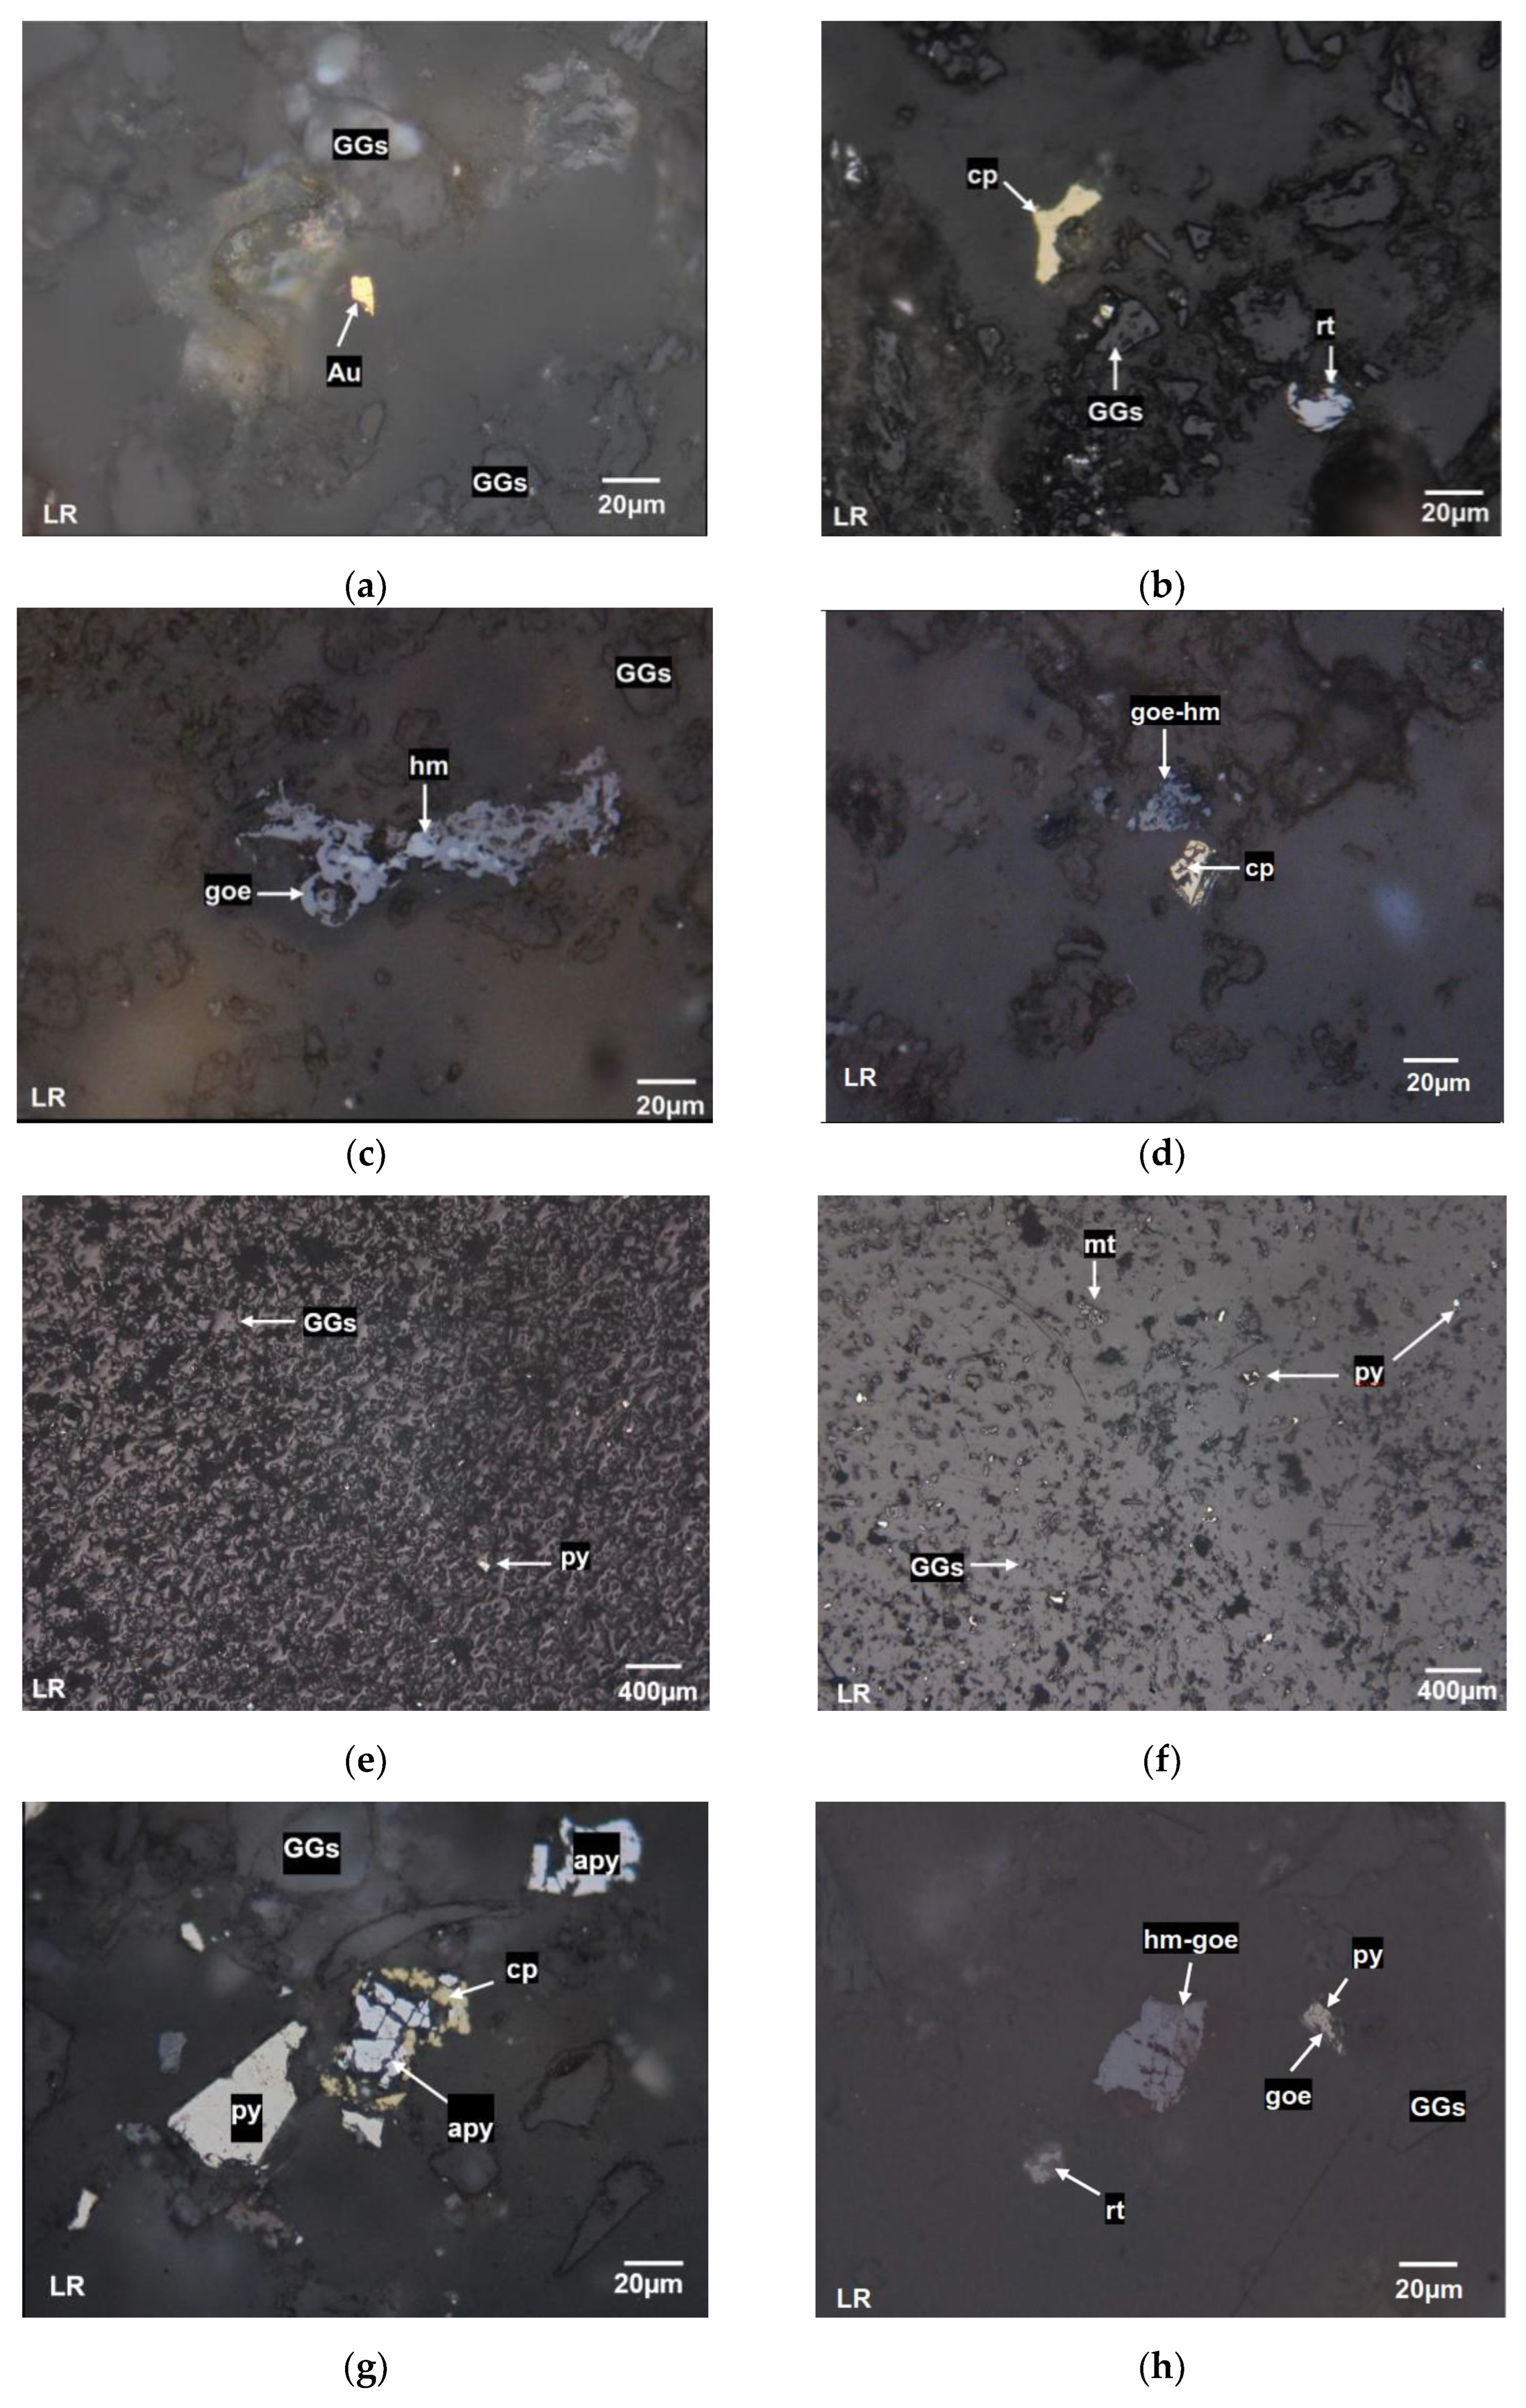
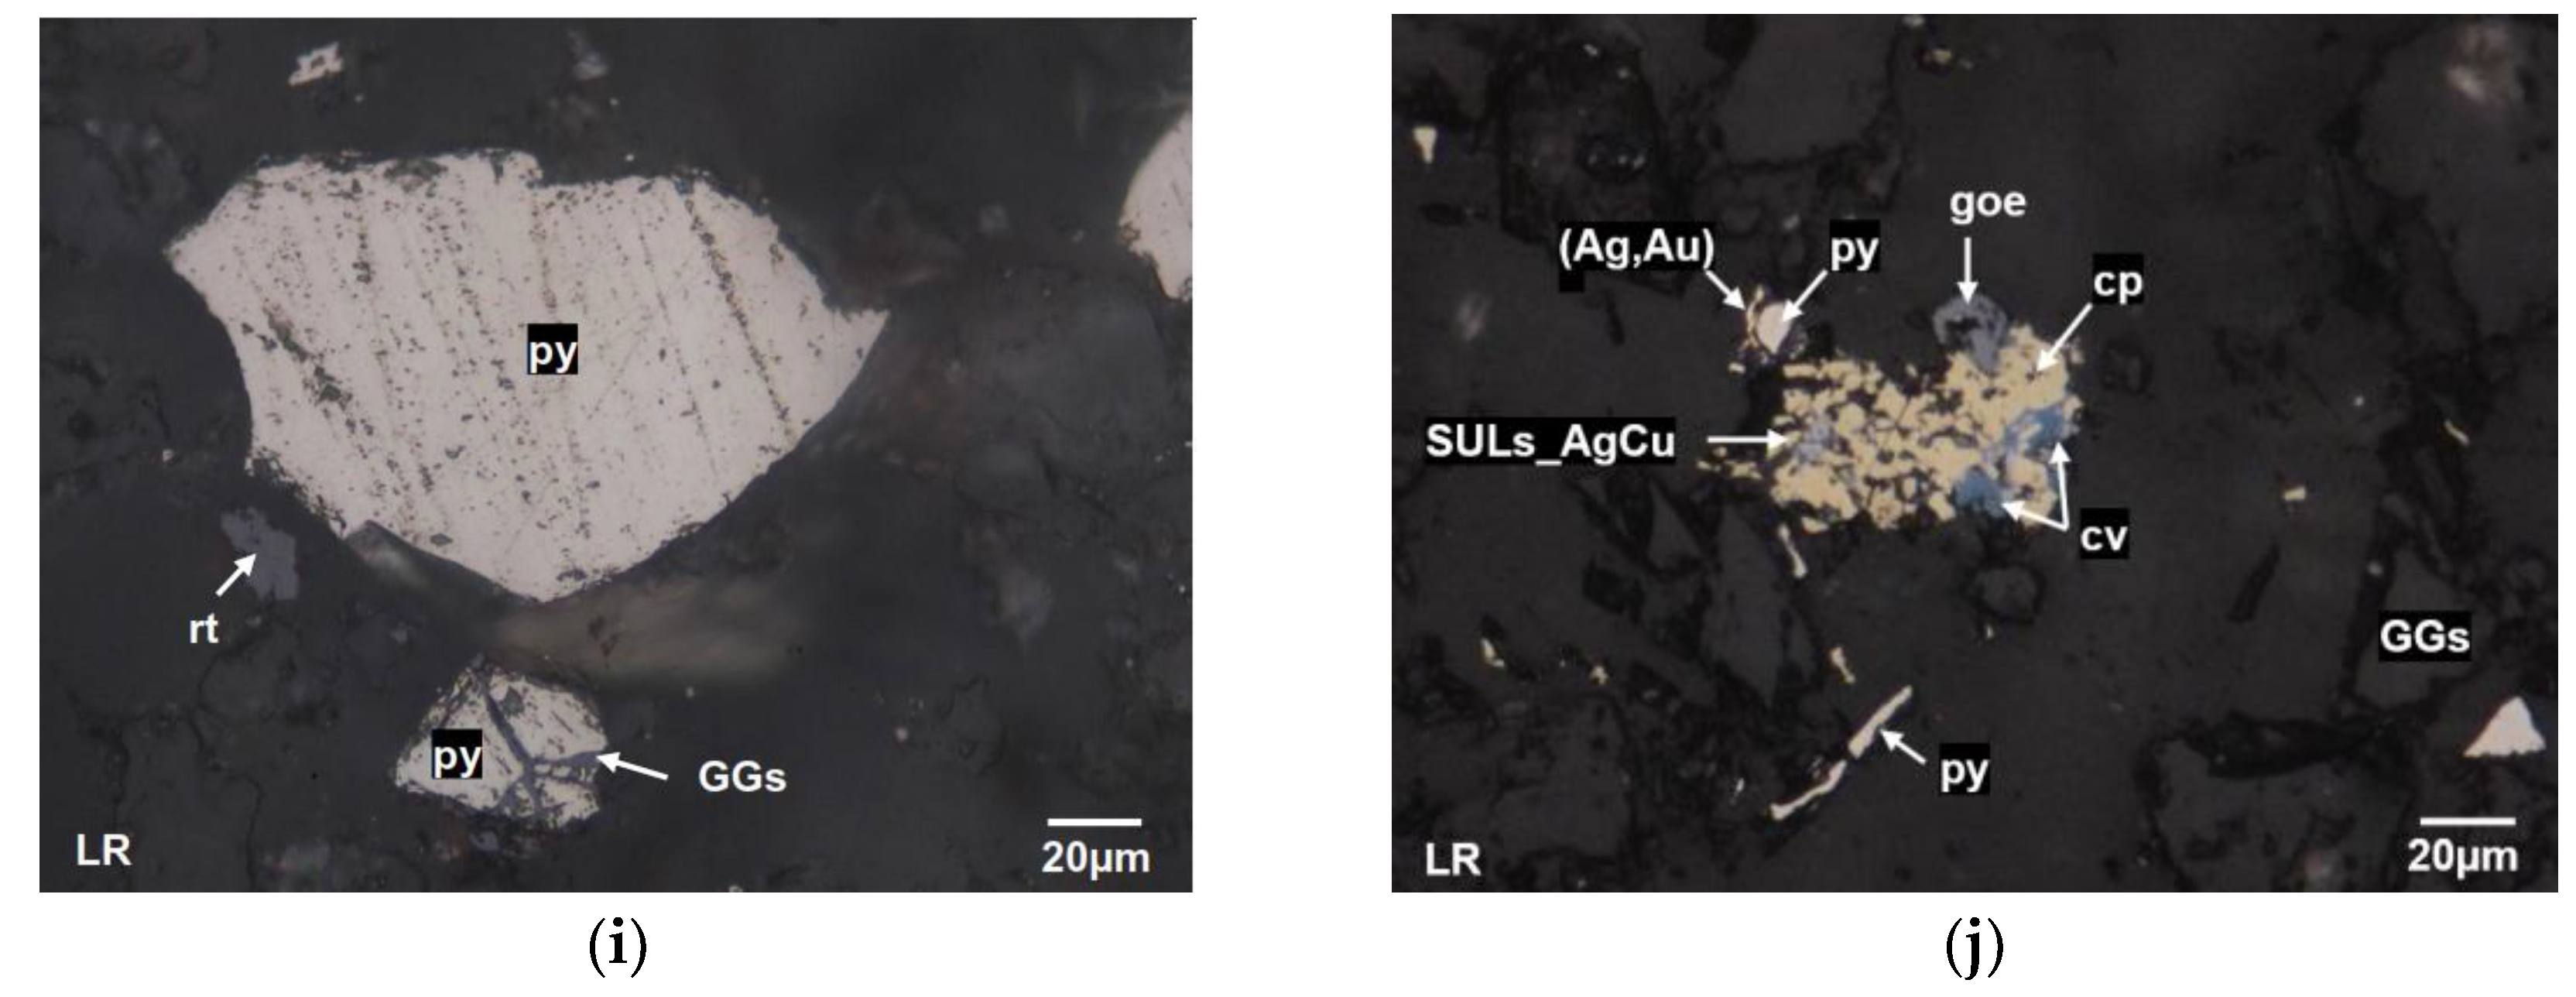
Figure 4.
Scanning Elecron Microscope Analyses: (a) K1, (b) K2, (c) C1, (d) T1, (e) M1 y (f)P1.
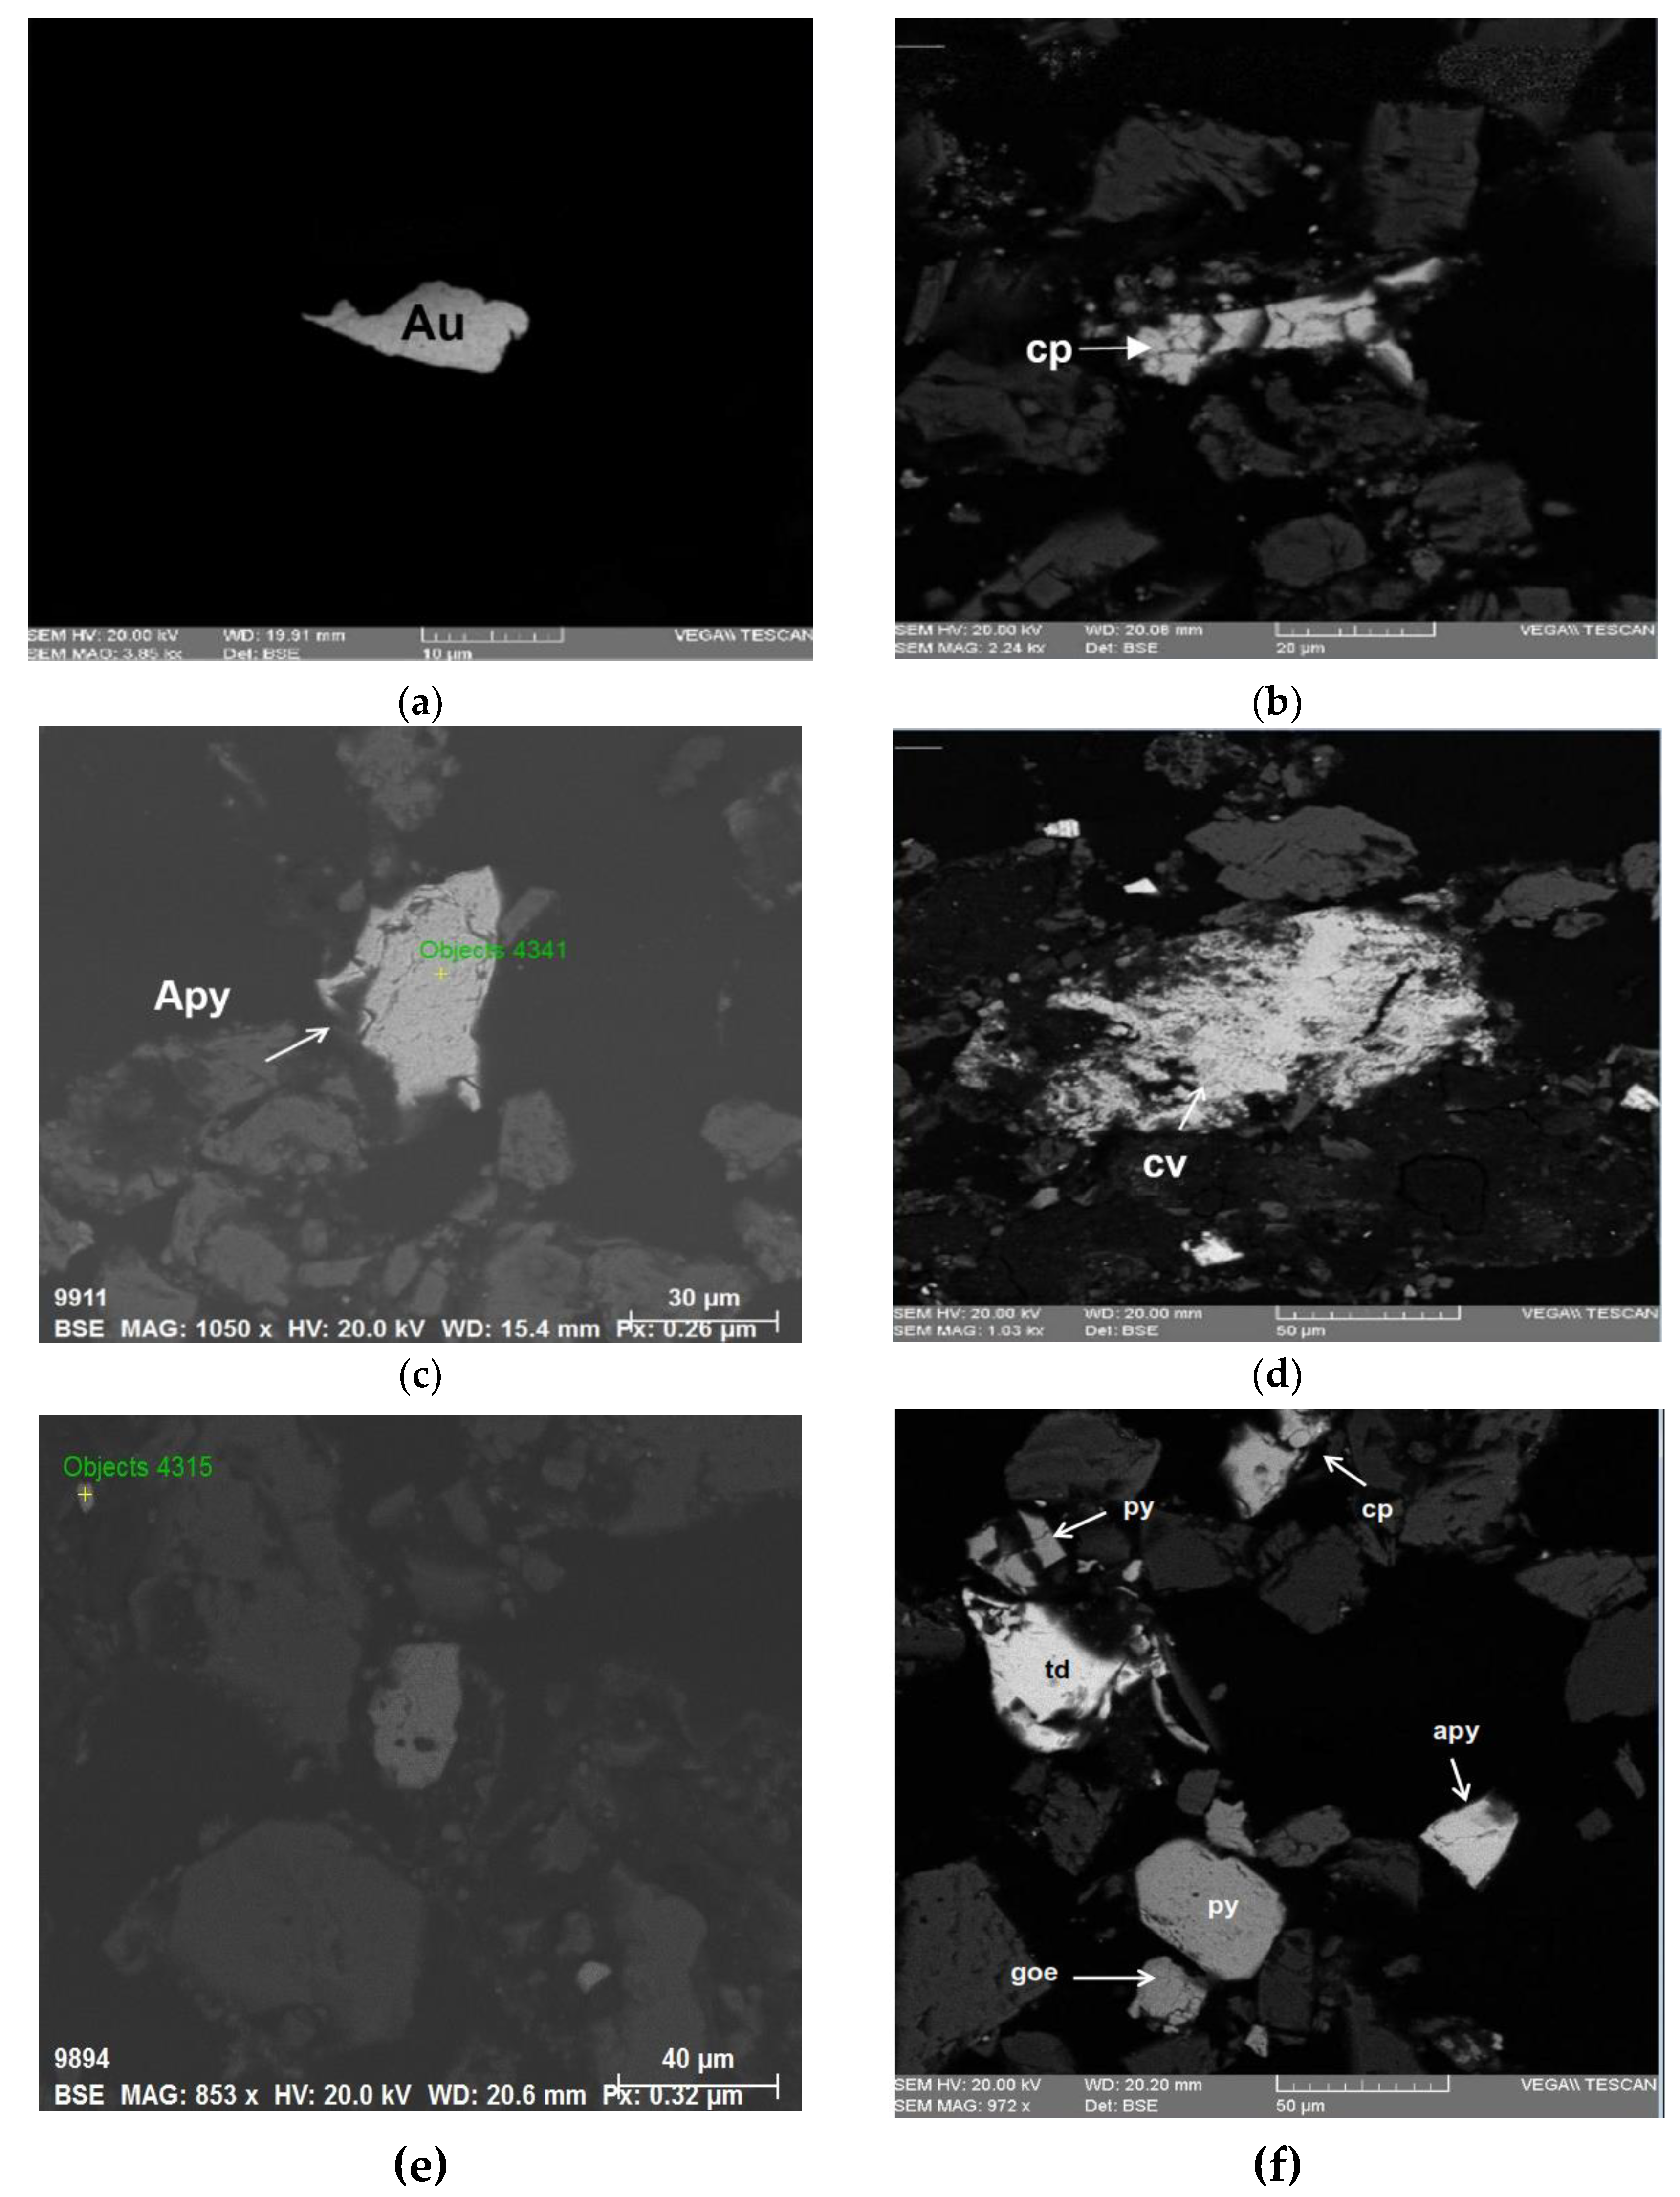
Figure 5.
Scanning Elecron Microscope Analyses: (a) C2, (b) M2, (c) S1 y (d) O1.
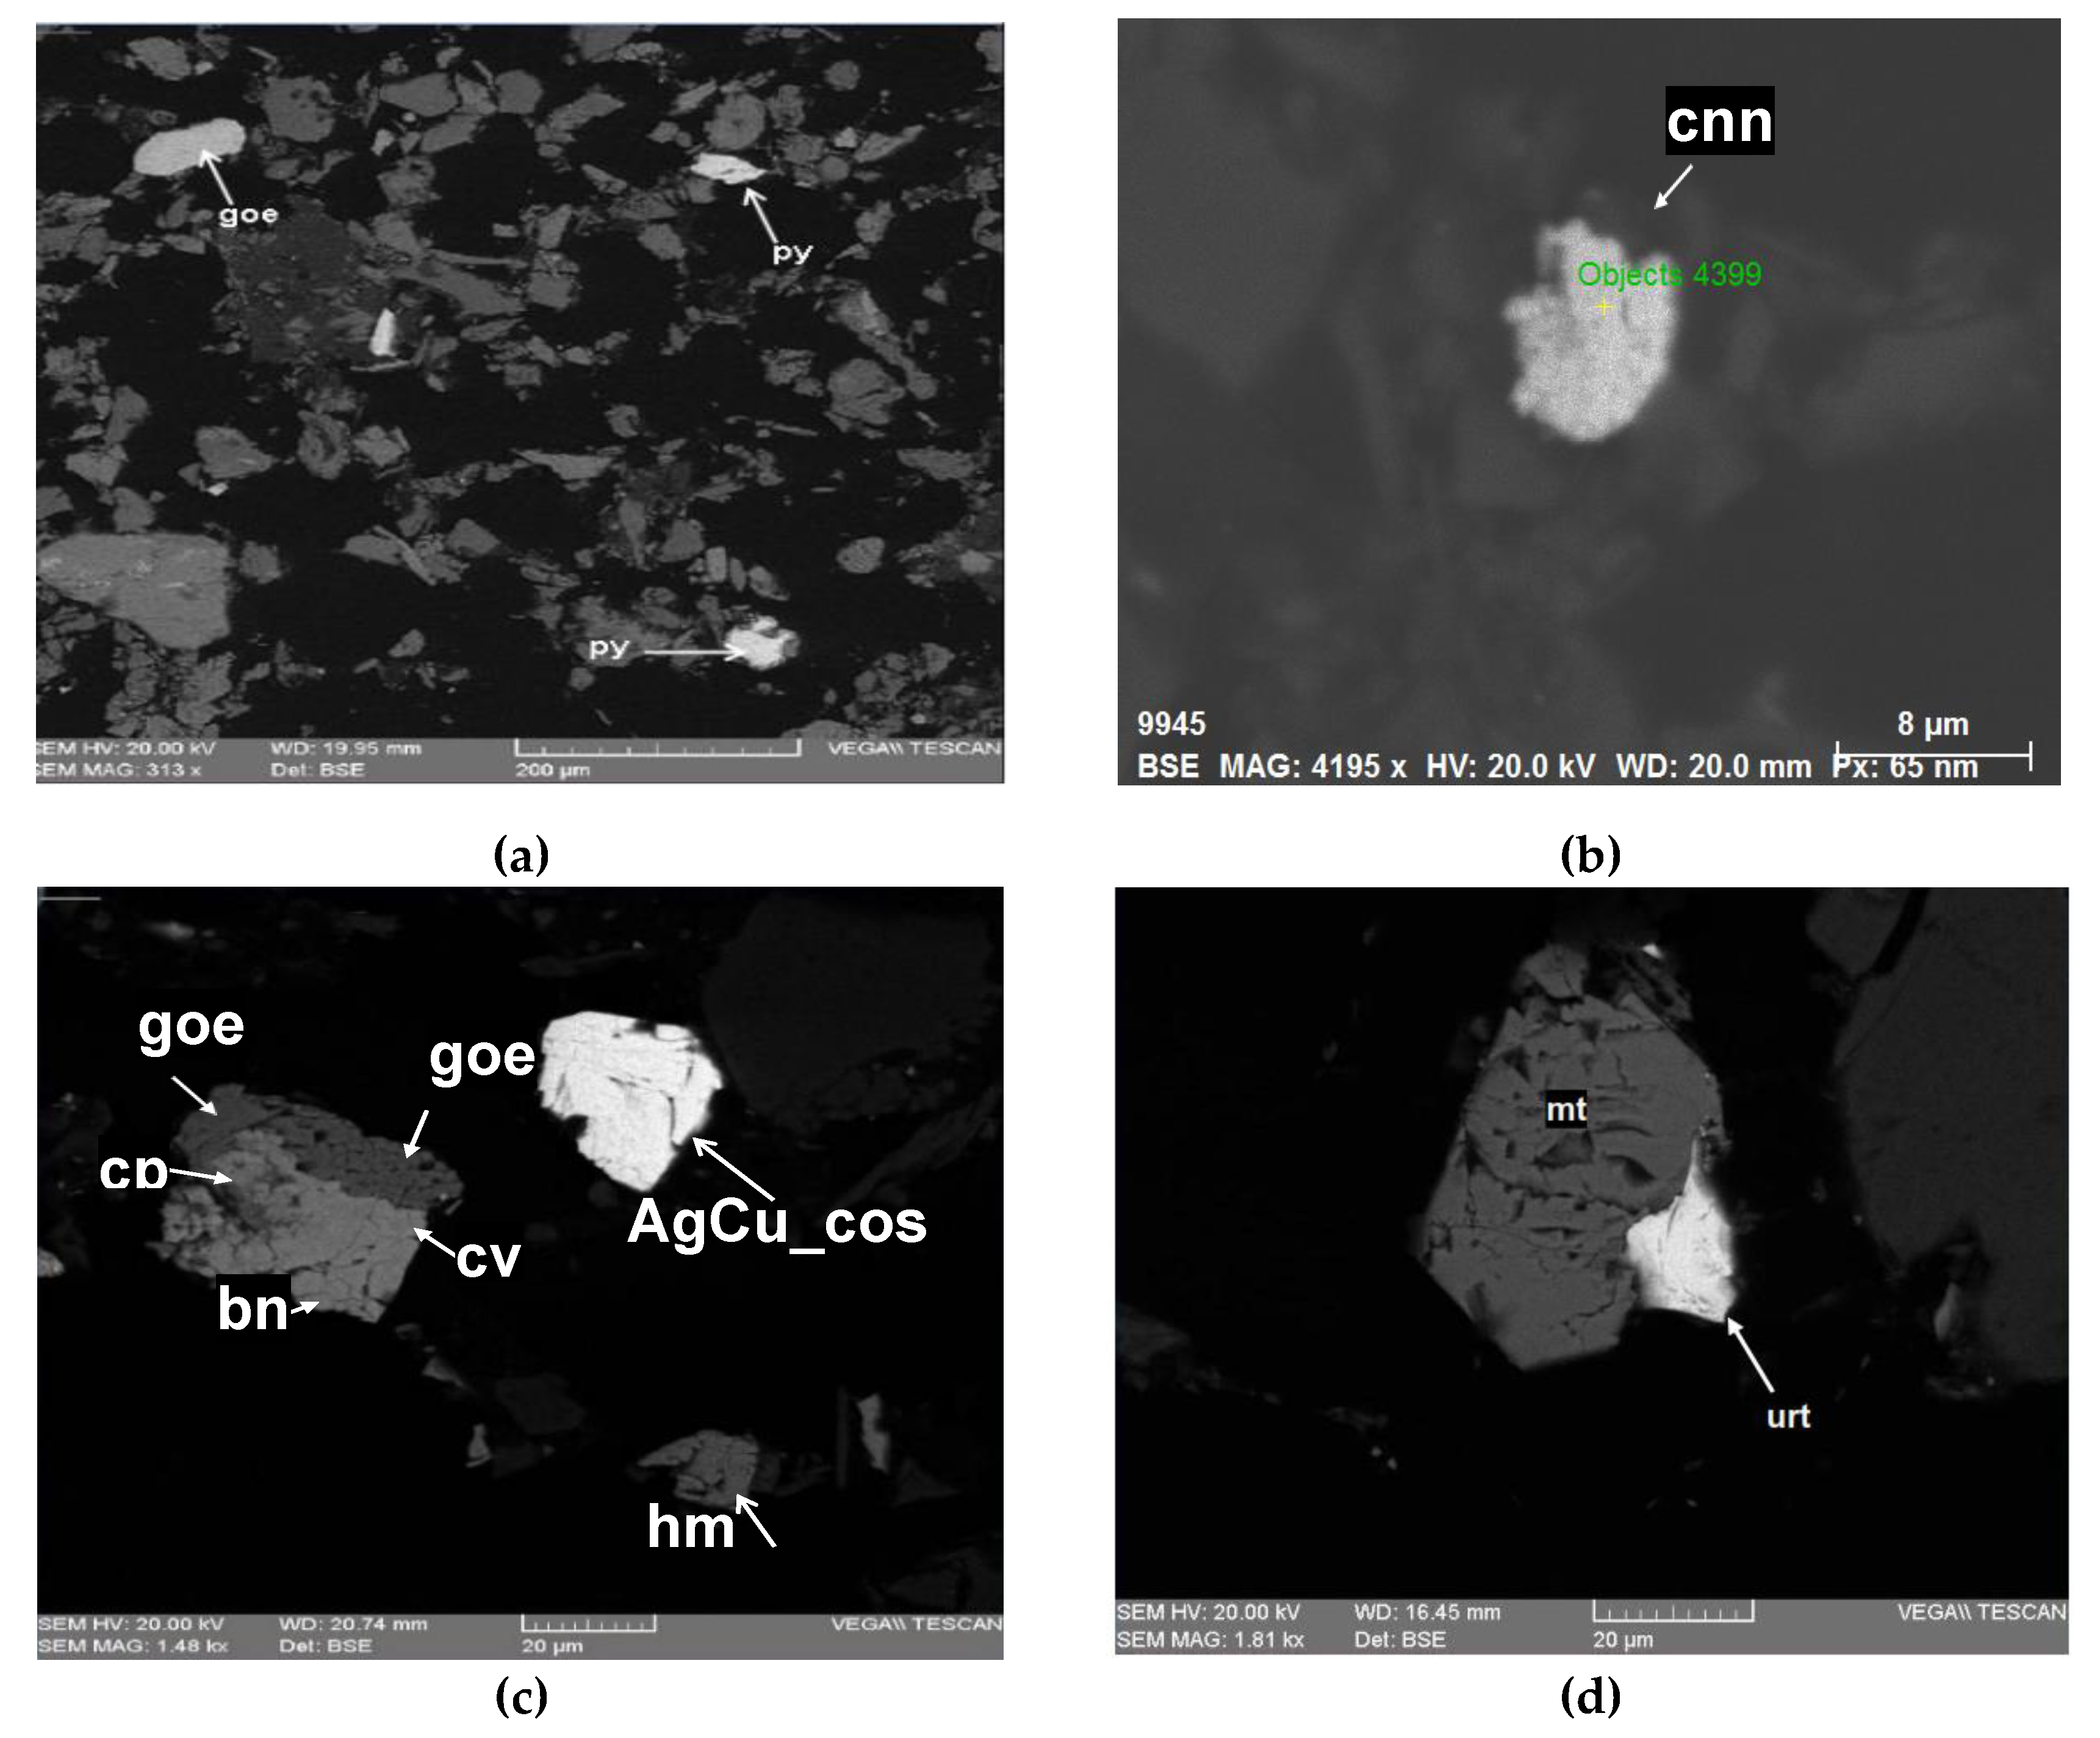

Table 1.
Classification of Environmental Liabilities and Active Tailings in Arequipa Region, Peru.
| No | Sample | Name | Province | District |
|---|---|---|---|---|
| Environmental Liability | ||||
| 1 | K1 | Kiowa de Au | Arequipa | Quequeña |
| 2 | K2 | Kiowa de Cu | Arequipa | Quequeña |
| 3 | C1 | Coriminas | Caylloma | Caylloma |
| 4 | T1 | Topacio | Caylloma | San Antonio de Chuca |
| 5 | M1 | Madrigal | Caylloma | Madrigal |
| 6 | O1 | Otapara | Caraveli | Acarí |
| Active Tailings | ||||
| 7 | P1 | Paraiso | Caraveli | Chala |
| 8 | C2 | Century | Condesuyos | Rio Grande |
| 9 | M2 | Mollehuaca | Huanuhuanu | Mollehuaca |
| 10 | S1 | Secocha | Camaná | Nicolas Valcárcel |
Table 2.
Particle Size Distribution of soil from Arequipa (g).
| No | Sample | Name | #12 | #16 | #25 | #35 | #48 | #65 | #100 | #170 | #200 | #-200 | Soil Type |
|---|---|---|---|---|---|---|---|---|---|---|---|---|---|
| 1 | K1 | Kiowa – Au | 0 | 1 | 1 | 3 | 25 | 15 | 60 | 11 | 43 | 45 | Fine sand with clay |
| 2 | K2 | Kiowa - Cu | 0 | 0.1 | 0.2 | 0.9 | 9 | 4 | 22 | 24 | 48 | 99 | Elastic silt |
| 3 | C1 | Coriminas | 0 | 0 | 0 | 0.2 | 5 | 6 | 41 | 26 | 29 | 102 | |
| 4 | T1 | Topacio | 1 | 9 | 12 | 10 | 43 | 12 | 34 | 33 | 20 | 35 | Fine sand with clay |
| 5 | M1 | Madrigal | 0 | 0.3 | 0 | 2 | 17 | 15 | 44 | 38 | 29 | 57 | |
| 6 | O1 | Otapara | 0.2 | 0.9 | 0.2 | 2 | 11 | 8 | 29 | 14 | 35 | 99 | Elastic silt |
| 7 | P1 | Paraiso | 0.3 | 0.8 | 0.9 | 2.5 | 8.5 | 11 | 68.2 | 52.1 | 22.2 | 42.1 | Fine sand with clay |
| 8 | C2 | Century | 0.5 | 2 | 1.6 | 3.9 | 7.7 | 6.8 | 53.3 | 54.9 | 20.6 | 51.4 | |
| 9 | M2 | Mollehuaca | 0 | 0 | 0 | 0.7 | 1.1 | 5.4 | 43.5 | 45.1 | 35.8 | 78.6 | Elastic silt |
| 10 | S1 | Secocha | 2 | 3 | 0 | 0.6 | 1 | 0.2 | 10 | 1 | 47 | 145 | Silty clay |
Table 3.
Abbreviations of Mineralogical Composition.
| Symbology | Mineral |
|---|---|
| GGs | Gangue |
| hm | Hematite |
| goe | Goethite |
| mt | Magnetite |
| py | Pyrite |
| rt | Rutile |
| cp | Chalcopyrite |
| Au | Native Gold |
| gn | Galena |
| sp | Sphalerite |
| cv | Covellite |
| CGRs | Gray Copper |
| akt | Aikinite |
| wtc | Wittichenite |
| apy | Arsenopyrite |
| bar | Barite |
| php | Phosphate |
| php1 | Phosphate 1 |
| php2 | Phosphate 2 |
| wolf | Wolframite |
| act | Acanthite |
| AgCu_cos | Argentocuprocosalite |
| SS_AgAu | Solid Solution (Ag, Au) |
| SULs_AgCu | Sulfide Cu-Ag |
| bor | Bornite |
| ttd | Tetrahedrite |
| sch | Scheelite |
| AlSi | Aluminosilicate |
| cnn | Cinnabar |
| urt | Uraninite |
* The abbreviations for each specific mineral are indicated.
Table 4.
Overall Mineralogical Composition by Sample (%).
| No | Sample | GGs | hm | goe | mt | py | rt | cp | Au | gn | sf | cv | CGRs | akt | wtc | apy |
|---|---|---|---|---|---|---|---|---|---|---|---|---|---|---|---|---|
| 1 | K1 | 90 | 2.82 | 2.58 | 1.9 | 0.93 | 0.78 | T | T | - | - | - | - | - | - | - |
| 2 | K2 | 91.72 | T | T | 3.82 | 1.88 | 1.58 | T | - | T | - | - | - | - | - | - |
| 3 | C1 | 94.15 | T | 2.82 | T | 2.03 | - | T | - | T | - | - | - | - | - | - |
| 4 | T1 | 95.79 | T | 1.32 | - | 1.9 | - | T | - | - | - | T | - | - | - | - |
| 5 | M1 | 97.08 | T | T | T | 1.92 | - | T | - | - | - | - | - | - | - | - |
| 6 | O1 | 87.95 | T | T | 7.41 | 3.63 | - | T | - | - | - | - | - | - | - | - |
| 7 | P1 | 60.07 | - | 4.27 | - | 15.39 | 1.3 | 6.4 | - | 2.29 | T | T | T | - | - | 9.3 |
| 8 | C2 | 91.86 | T | 1.25 | T | 3.62 | 1.52 | 0.75 | - | - | T | - | - | - | - | - |
| 9 | M2 | 89.43 | - | 1.25 | - | 5.4 | 0.76 | 0.75 | - | T | - | - | - | - | - | 2.17 |
| 10 | S1 | 86.93 | T | T | - | 10.6 | - | 1.47 | - | T | T | T | T | T | T | - |
* Where T represents the abbreviation for traces.
Table 5.
Elemental composition of the metals under study and element of value according to the overall sample minerals. (%).
Table 5.
Elemental composition of the metals under study and element of value according to the overall sample minerals. (%).
| Sample | Compounds | Hg | As | Pb | Cd | Zn | Au | Ag | Cu | U | |
|---|---|---|---|---|---|---|---|---|---|---|---|
| K1 | Gn, Au, bar, cp, cv, goe | S | 85.33 | 99.19 | 0.81 | 65.64 | |||||
| P | 14.22 | 16.53 | 0.14 | 10.94 | |||||||
| K2 | Php 1, cp, wolf, bar, php 2, gn | S | 86.18 | 30.81 | |||||||
| P | 14.36 | 5.14 | |||||||||
| T1 | Cv, gn, bar and py | S | 80.03 | 64.30 | |||||||
| P | 20.01 | 16.08 | |||||||||
| C1 | Goe, py, gn, act, apy and cp | S | 39.71 | 85.18 | 83.99 | 32.05 | |||||
| P | 6.62 | 14.20 | 14.00 | 5.34 | |||||||
| M1 | Py, goe, bar and cpy | S | 37.82 | ||||||||
| P | 9.46 | ||||||||||
| S1 | Py, AgCu_cos, akt, wtc, solid solution (Ag, Au), Cu-Ag sulfide, goe, bor, cpy, cv, sp, gn, ttd | S | 145.27 | 69.02 | 54.67 | 89.65 | 264.38 | ||||
| P | 11.17 | 5.31 | 4.21 | 6.90 | 20.34 | ||||||
| C2 | Goe, py, bar, cpy, sch, php, AlSi | S | 32.88 | ||||||||
| P | 4.70 | ||||||||||
| M2 | Gn, py, apy, goe, cnn | S | 86.59 | 46.03 | 86.34 | ||||||
| P | 17.32 | 9.21 | 17.27 | ||||||||
| P1 | Apy, py, goe, ttd, cpy, gn | S | 44.45 | 86.55 | 3.51 | 74.65 | |||||
| P | 7.41 | 14.43 | 0.59 | 12.44 | |||||||
| O1 | Cpy, urt, goe, py, mt, hm and bar | S | 33.78 | 89.42 | |||||||
| P | 4.83 | 12.77 |
*Where S indicates the sum of the percentages of the element based on the compounds, and P indicates the percentage of the element relative to the total sample.
Table 6.
Results of the concentration of total metals in environmental liability and active tailings samples analyzed by ICP (mg/kg).
Table 6.
Results of the concentration of total metals in environmental liability and active tailings samples analyzed by ICP (mg/kg).
| No | Sample | Name | As | Cd | Hg | Pb | Zn |
|---|---|---|---|---|---|---|---|
| 1 | K1 | Kiowa | 49.9 | 1.47 | <0.1 | 168.22 | 21 |
| 2 | K2 | Kiowa | 291.9 | 2.42 | 0.2 | 1585.8 | 161.90 |
| 3 | C1 | Coriminas | 145.0 | 4.17 | 0.6 | 191.47 | 205.20 |
| 4 | T1 | Topacio | 609.6 | 29.75 | 8.1 | 828.72 | 1221.00 |
| 5 | M1 | Madrigal | 195.0 | 6.03 | 0.4 | 2290.49 | 323.30 |
| 6 | O1 | Otapara | 26.3 | 9.29 | 0.8 | 12.71 | 23.4 |
| 7 | P1 | Paraiso | >6000 | 32.54 | 35 | 2081.87 | 2309 |
| 8 | C2 | Century | 28 | 2.25 | <0.1 | 21.27 | 21.1 |
| 9 | M2 | Mollehuaca | 2052.2 | 7.96 | 193.1 | 875.74 | 41.3 |
| 10 | S1 | Secocha | 160.1 | 21.95 | >275 | 1028.8 | 375.3 |
Table 7.
Results of the toxicological analysis of environmental liability and active tailings samples analyzed by ICP (ml/L).
Table 7.
Results of the toxicological analysis of environmental liability and active tailings samples analyzed by ICP (ml/L).
| No | Sample | Nombre | As | Cd | Hg | Pb | Zn |
|---|---|---|---|---|---|---|---|
| 1 | K1 | Kiowa | 0.011 | <0.004 | <0.003 | 0.237 | 0.051 |
| 2 | K2 | Kiowa | 0.023 | 0.063 | <0.003 | 0.010 | 9.286 |
| 3 | C1 | Coriminas | 0.051 | 0.005 | <0.003 | <0.005 | 0.317 |
| 4 | T1 | Topacio | 0.587 | 0.201 | <0.003 | 0.34 | 2.612 |
| 5 | M1 | Madrigal | <0.006 | 0.072 | <0.003 | 0.020 | 6.162 |
| 6 | O1 | Otapara | <0.006 | <0.004 | <0.003 | 0.006 | 0.105 |
| 7 | P1 | Paraiso | 0.393 | 0.046 | 0.401 | 0.590 | 1.828 |
| 8 | C2 | Century | <0.006 | <0.004 | <0.003 | 0.008 | 0.093 |
| 9 | M2 | Mollehuaca | 0.020 | 0.004 | <0.003 | 0.071 | 0.071 |
| 10 | S1 | Secocha | <0.006 | 0.005 | 0.026 | 0.403 | 0.139 |
Disclaimer/Publisher’s Note: The statements, opinions and data contained in all publications are solely those of the individual author(s) and contributor(s) and not of MDPI and/or the editor(s). MDPI and/or the editor(s) disclaim responsibility for any injury to people or property resulting from any ideas, methods, instructions or products referred to in the content. |
© 2024 by the authors. Licensee MDPI, Basel, Switzerland. This article is an open access article distributed under the terms and conditions of the Creative Commons Attribution (CC BY) license (http://creativecommons.org/licenses/by/4.0/).
Copyright: This open access article is published under a Creative Commons CC BY 4.0 license, which permit the free download, distribution, and reuse, provided that the author and preprint are cited in any reuse.


