Submitted:
01 October 2024
Posted:
04 October 2024
You are already at the latest version
Abstract
This article presents a method for detecting P, QRS, T, and U waves in electrocardiogram (ECG) signals through advanced signal processing techniques, including a Butterworth bandpass filter and peak finding algo- rithms. The results are evaluated against the voltage ranges recommended in the literature, underscoring the importance of accurate wave detection for the diagnosis of various cardiac conditions.
Keywords:
ECG
; Butterworth filter
; peak detection
; signal processing
; cardiac diagnosis
1. Introduction
The electrocardiogram (ECG) serves as a vital tool for monitoring cardiac health and diagnosing various heart conditions. Accurate detection of ECG waves—specifically P, QRS, T, and U waves—is crucial for effective analysis and diagnosis. Each wave corresponds to specific electrical activities of the heart, and their morphology can indicate different cardiac states or abnormalities. This study utilizes data from Greenwald’s thesis [1] and implements a systematic signal processing method to reliably identify these waves.
2. Method
The proposed method consists of a systematic approach involving several key steps:
2.1. Signal Filtering
The initial step involves the application of a Butterworth bandpass filter to the ECG signal to eliminate noise and unwanted frequencies. The transfer function of the Butterworth filter is expressed as follows:
where denotes the cutoff frequency, n is the order of the filter, and s represents the complex frequency variable.
The filter parameters for the ECG signal are defined as follows:
- Sampling frequency: 250 Hz, which ensures adequate representation of the ECG signal.
- Low cutoff frequency: 0.5 Hz, facilitating the passage of relevant low-frequency components.
- High cutoff frequency: 50 Hz, restricting high-frequency noise.
The selection of these cutoff frequencies is based on the standard frequency range for ECG signals, ensuring that critical components of the cardiac cycle are preserved.
2.2. Wave Identification
The identification of P, QRS, T, and U waves is performed through peak detection using the find_peaks function from the SciPy library. The conditions for detection are based on specific voltage ranges supported by literature:
Peak Detection Equation The peak detection algorithm identifies local maxima in the filtered ECG signal, mathematically expressed as follows:
Signal-to-Noise Ratio (SNR) The performance of the detection can be quantified using the Signal-to-Noise Ratio (SNR), defined as follows:
where represents the power of the signal and denotes the power of the noise.
Additional Techniques If applicable, additional techniques such as:
1. **Moving Average Filter**:
where M indicates the number of samples in the averaging window.
2. **Differentiation** (for QRS detection):
to enhance the steepness of the QRS complex.
3. Results
The results for each segment of ECG signals are evaluated against the specified voltage ranges to determine the validity of the detected waves. The identified peaks are displayed alongside the filtered ECG signal for visual verification, which is critical for validating the performance of the detection algorithm.
Figure 1.
ECG Signal with Detected Waves for Signal 1
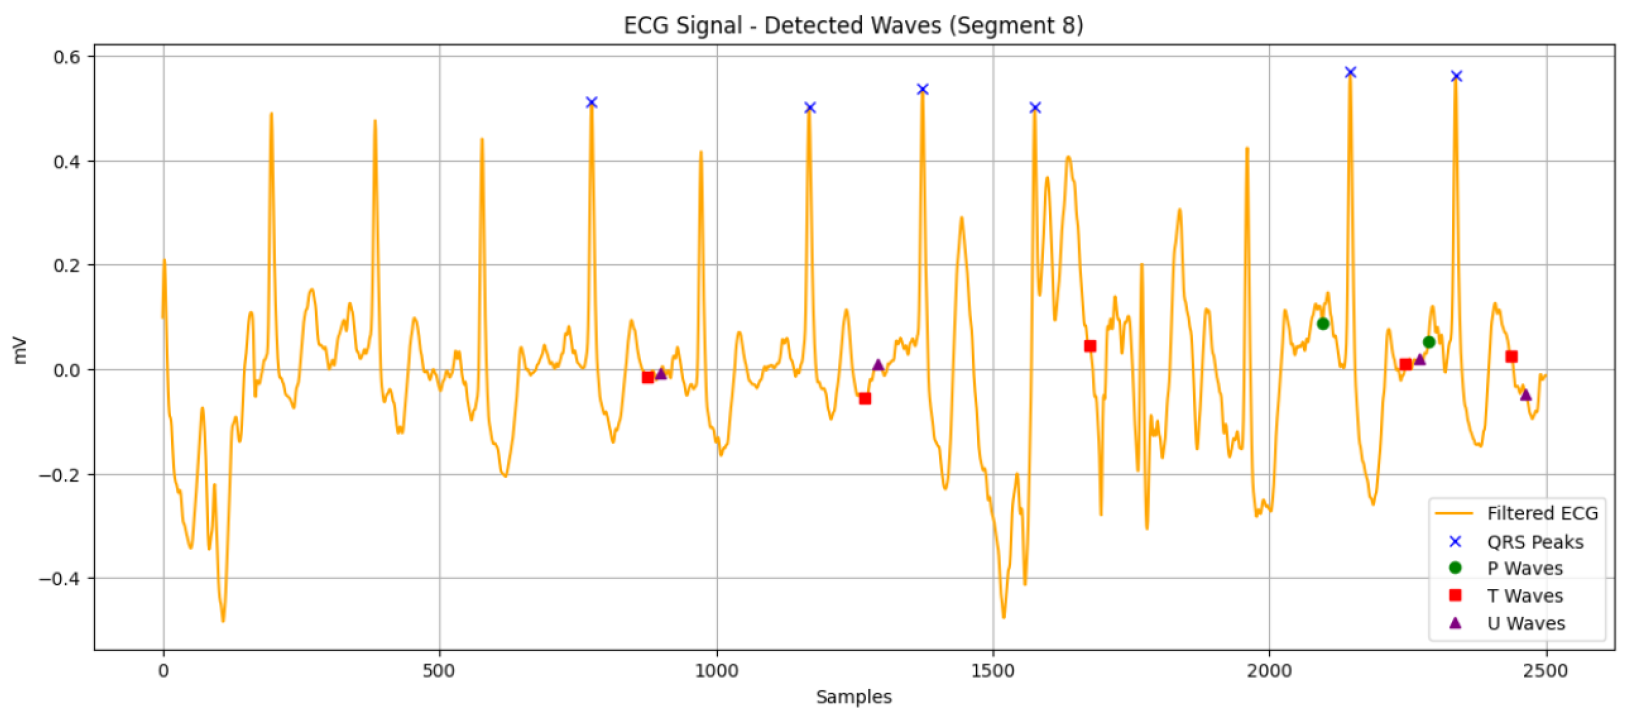
Figure 2.
ECG Signal with Detected Waves for Signal 2
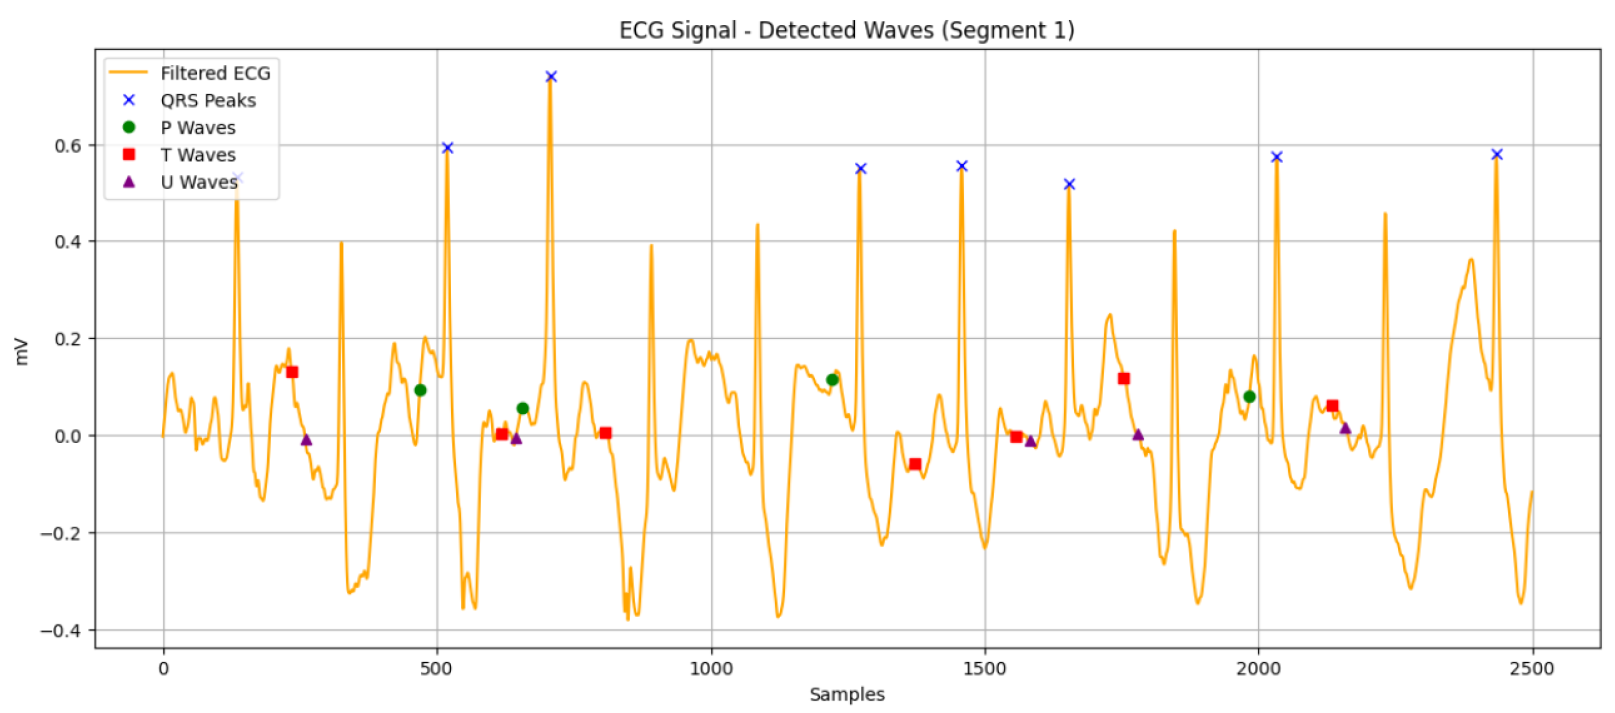
The figures illustrate how the method successfully identifies the relevant waves within the noise-filtered ECG signal. This visual validation serves as an essential part of the methodology, ensuring that the algorithm’s performance aligns with clinical expectations.
4. Conclusions
This study demonstrates a systematic approach for detecting ECG waves, ensuring that only those meeting the criteria established by the literature are reported. The utilization of a Butterworth bandpass filter effectively reduces noise, and the peak detection methodology accurately identifies key cardiac features. Future work will focus on enhancing detection accuracy, optimizing the algorithm for real-time applications, and expanding the method to accommodate a wider variety of ECG signals.
References
- Greenwald, S. D. (1986). Development and analysis of a ventricular fibrillation detector. M.S. thesis, MIT Dept. of Electrical Engineering and Computer Science.
- Goldberger, A., Amaral, L., Glass, L., Hausdorff, J., Ivanov, P. C., Mark, R., & Stanley, H. E. (2000). PhysioBank, PhysioToolkit, and PhysioNet: Components of a new research resource for complex physiologic signals. Circulation, 101(23), e215–e220. [CrossRef]
- Klein, H., & Neuman, J. (1965). The electrocardiogram. In Clinical Electrocardiography (pp. 56-77). Grune & Stratton.
Disclaimer/Publisher’s Note: The statements, opinions and data contained in all publications are solely those of the individual author(s) and contributor(s) and not of MDPI and/or the editor(s). MDPI and/or the editor(s) disclaim responsibility for any injury to people or property resulting from any ideas, methods, instructions or products referred to in the content. |
© 2024 by the authors. Licensee MDPI, Basel, Switzerland. This article is an open access article distributed under the terms and conditions of the Creative Commons Attribution (CC BY) license (http://creativecommons.org/licenses/by/4.0/).
Copyright: This open access article is published under a Creative Commons CC BY 4.0 license, which permit the free download, distribution, and reuse, provided that the author and preprint are cited in any reuse.


