Submitted:
02 October 2024
Posted:
07 October 2024
You are already at the latest version
Abstract
This study examines the impact of foreign direct investment (FDI) on economic growth using panel data from 84 countries between 2010 and 2019. We utilized a two-step system generalized method of moments (GMM) to analyze how FDI affects economic growth through productivity gains and the role of economic freedom in attracting FDI. The findings suggest that FDI has a positive impact on productivity and benefits both OECD and non-OECD countries. Economic freedom plays a significant role in attracting FDI, particularly in OECD countries, and contributes to economic growth in non-OECD countries. However, economic freedom alone does not guarantee strong economic growth in OECD countries, but it significantly enhances growth in non-OECD countries. The results also highlight that only economies with robust economic infrastructure and development levels benefit more from FDI.
Keywords:
Economic freedom
; economic growth
; foreign direct investment
; productivity spillovers
; system GMM
1. Introduction
Economic
openness attracts foreign direct investment (FDI), which not only brings in
capital but also transfers knowledge and technology to host countries that
would not otherwise have access to it. As investment from other countries
links FDI host countries to the global market, global value chains provide
opportunities for the countries to diversify their exports and expedite their
integration into the global economy, as noted by Dollar (2017) in his Brookings
feature article.1
Through global value chains, host countries are exposed to broader economic
activities in widely separated locations that are interconnected. Local firms
may benefit from substantial economies of scale, strengthening their
competitive global market positions. The World Bank (2021) underscores the
crucial role of policies that attract and facilitate FDI entry in enhancing
investment promotion capacity. These policies lead to spillover effects through
supply chain linkages, which bring new capital, technology, and knowledge into
business practices, enabling local firms to better withstand the onslaught of
global, scalable firms. Serpa and Krishnan (2018) indicate that firms
interacting within a supply chain affect each other’s productivity, and
productivity spillovers are more pronounced when the supply chain is more
concentrated. Thus, countries that gain from productivity improvements accrued
from FDI inflow are more likely to pursue policies favoring economic openness.
Productivity spillovers from multinational
activities to local firms come with knowledge and technology to an extent that
is non-excludable and non-rival in production. Blomstrom and Kokko (1998)
identify three main channels where productivity spillovers occur from FDI
inflows to host countries, including demonstration effects through imitation of
newer technologies, competition effects through competitive pressure forcing
local firms to improve their production efficiency, and knowledge spillover
effects through skilled labor mobility. Developing countries tend to attract a
sizeable share of FDI through comparative advantage mechanisms and more
substantial capabilities to pursue economic growth. For these countries to
achieve productivity spillover gains, FDI inflows need to be stable and
complementary to the labor force structure within the local economy, where FDI
inflows would bring the capital formation to an extent
sufficient to absorb the growth in the labor force, adjusting labor and
capital to the equilibrium where productivity spillover effects can be
prevalent. Consequently, countries that better capture the effect of
demonstration or contagion are more likely to benefit from FDI inflows.
One aspect of low wages in developing countries can
be attributed to the lack of productive capital, which is the primary factor
driving structural unemployment. For wages in these countries to rise, capital
investments need to be sufficient to reach the steady state growth rate of
labor supply to boost labor productivity, and FDI can be a source for capital
investment to expand to the level where productivity will grow, rendering in
terms of skill development and productivity spillover. Consequently, many developing
countries turn to FDI attraction seeking foreign capital to mitigate capital
constraints and fill the resource gap in their quest for economic development. In
their empirical studies, Lipsey and Sjoholm (2004) and Hijzen et al. (2013) put
forth a view that multinational corporations (MNCs) tend to offer wage premia
compared to their domestic counterparts with which the gap between wages in
local firms and MNCs forces domestic firms to face competitive pressure in the
labor markets for higher wages. MNCs share knowledge or technology with their
suppliers, which they then implement to increase productivity. In return, MNCs
would demand higher-quality goods and resources from suppliers, forcing local
firms to be more productive. Thus, productivity spillovers occur as FDI creates
benefits that local suppliers and other firms share in the local markets.
This study investigates how FDI inflows can foster
economic growth among countries at distinct stages of development, specifically
tracing the productivity spillover effects of FDI inflows with different
degrees of economic freedom and growth rates. We emphasize that FDI’s effects
on productivity spillovers depend positively on labor market concentration in
the host country and attempt to measure the effects of productivity spillovers
by exploring the ratio of capital to the stock of labor efficiency rather than
focusing on horizontal or vertical productivity spillovers as is commonly done.
Our approach to productivity spillovers from a macroeconomic perspective allows
us to examine the overall effects of FDI inflows for an economy rather than
within a specific sector or the level of the economy where the viewpoints would
be relatively segmented.
We apply the system generalized method of moments
(GMM) approach proposed by Arellano and Bover (1995) and Blundell and Bond
(1998) to estimate the impact of FDI inflows on economic growth through
productivity spillover effects. Based on a panel of 84 countries over the
period 2010-2019, the results suggest that productivity spillovers occur as FDI
inflows increase labor productivity, leading to growth in real output. Economic
freedom plays a pivotal role in promoting FDI inflows and productivity.
However, economic freedom alone does not guarantee strong economic growth in
OECD countries; it is more pronounced in enhancing economic growth in non-OECD
countries. Population growth positively contributes to economic growth in OECD
countries but could impede economic growth in non-OECD countries. Our results
show that only economies with specific infrastructure and development would
benefit more significantly from FDI inflows.
The remaining sections of the paper are organized
as follows. Section 2 provides an
overview of relevant literature. Section 3
describes the data and econometric methodology applied in the study. Section 4 presents a preliminary finding
explaining why system GMM estimates are superior to difference GMM estimates in
this study, followed by our empirical findings of the GMM estimates with
interaction terms and data segmented into transition and OECD economies. The
main findings are summarized with a concluding remark in the final section.
2. Literature Review
Despite extensive research on the connection
between FDI inflows and economic growth, the empirical literature provides
conflicting evidence regarding the existence of the productivity spillover
effect of FDI inflows. Demena and van Bergeijk (2017) investigate 1450
spillover estimates from 69 empirical studies published in 1986-2013 and note
the inconsistency of reported spillover findings caused by publication bias,
characteristics of data, and model misspecification. This can be traced back to
Blomström, Kokko, and Mucchielli (2003), who also address the empirical
interpretation of the evidence that fails to explain the occurrence and essence
of spillovers.
To disentangle the FDI-growth nexus, the varying
results of studies have called forth a series of meta-analyses, attempting to
discern the effect of productivity spillovers. A meta-analysis study by Gorg
and Strobl (2001) shows evidence of publication bias and that the type of data
used (industrial- or plant-level data, developing or developed country data
sets, or whether the data is recent) is irrelevant. Meyer and Sinani (2009)
suggest that the relationship between a country’s stage of economic development
and spillovers is curvilinear. Countries with low and high levels of GDP per
capita experience spillovers from FDI, but transition economies in between see
a declining effect. Wooster and Diebel (2010) also present weak evidence of
horizontal spillovers in developing countries, contrasting prior studies.
However, the research is comparatively limited in examining spillovers to
domestic firms in the same sector. Iršová and Havránek (2013) find similar
results to Wooster and Diebel (2010) with no evidence of horizontal spillovers.
They argued that past levels of FDI do not affect current spillovers, implying
a linear effect, wherein a country saturated with FDI may still reap spillover
benefits.
The extant body of literature mainly supports the
idea that FDI positively impacts economic growth, with productivity spillovers
primarily seen as beneficial to domestic firms through the transfer of
technology and knowledge from MNCs. Amann and Virmani (2014) analyze the
feedback effect of FDI on productivity and find that the impact of FDI
enhancing productivity growth is greater for R&D-intensive developed
countries to invest in emerging economies. Gorodnichenko, Svejnar, and Terrell
(2014) present evidence to partially support Blomstrom and Kokko (1998),
suggesting that domestic firms experience a faster increase in efficiency after
supplying to MNCs. However, domestic firms purchasing from or competing with
MNCs in the same industry do not appear to gain positive spillovers. This could
be due to the cost of implementing new technology to compete with MNCs in the
short run. Based on a sample of 17,625 Chinese manufacturing firms, Liu (2008)
shows that FDI spillovers lower domestic firms’ productivity levels in the
short run and that backward linkages are the most statistically significant
channel for technology spillovers to occur, potentially due to the demand for
high-quality goods supplied to MNCs by domestic firms. The result suggests that
productivity spillovers from FDI are still positive and substantial overall.
Building on the channels by Blomstrom and Kokko
(1998), Azman-Saini et al. (2010) examine 85 countries and generate evidence of
productivity spillovers from FDI conditioning on high levels of economic
freedom. They highlight how economic freedom and FDI jointly positively and
significantly affect growth. However, FDI alone does not impact growth,
concluding that this occurs because economic freedom facilitates FDI
spillovers. Naanwaab and Diarrassouba (2016) also contend that economic freedom
is a positive determinant of FDI but also note that this occurs only when
economic freedom is sufficiently high, and the most critical components of
economic freedom are legal structure and property rights, regulation, and
freedom to trade. This is similar to Iamsiraroj and
Ulubaşoğlu (2015) who find that financial development and trade openness
are essential for a country to have the absorptive capacity for FDI to impact
growth.2
However, the effect subsides once the economic development and trade openness
reach certain levels. Sambharya and Rasheed (2015) posit that economic and
political freedom affects countries’ institutional environments, which can
influence a firm’s decisions to enter markets. Higher economic freedom overall
leads to increased FDI inflows. However, only four out of five of the Heritage
Foundation’s economic freedom index components influence FDI inflows. The
exception being trade and investment freedom contrasts
Azman-Saini et al. (2010), who find that freedom to trade is essential.
Naanwaab and Diarrassouba (2016) show that economic
freedom alone cannot attract FDI inflows in developing countries; human capital
and economic freedom are jointly substantial. Human capital is critical in
enhancing absorptive capacity so domestic firms can maximize productivity
spillovers by utilizing foreign knowledge and technology (Blomström et al.,
2003). Balasubramanyam, Sapsford, and Salisu (1999) also find that for human
capital to act as a conduit for FDI to affect growth, a threshold of human
capital is necessary. Similarly, Bengoa and Sanchez-Robles (2003) argue that
FDI positively correlates with economic growth conditioned upon adequate levels
of human capital. Fukase (2010) infers that FDI affects growth through human
capital differently depending on the channel, industry, and institutions. Wooster
and Diebel (2010) note that labor quality is inversely associated with
spillover absorption, where higher labor quality leads to decreased
productivity spillover benefits from FDI. Kristjánsdóttir (2010) implies that
MNCs are less attracted by human capital and labor education levels as they
originate from highly skilled labor countries. The labor cost difference
between countries was a more significant determinant of FDI, as MNCs are more
likely to take advantage of cost-saving labor.
Restrictive labor laws could inhibit knowledge
transfer between MNCs and domestic firms through the labor movement. Using data
from Vietnam and China, Vu, Gangnes, and Noy (2008) analyze the impact of FDI
inflows on growth through labor in different economic sectors. They find that
FDI inflows significantly and positively affect growth through indirect
interaction with labor in both countries. However, the effect is not equally
distributed among sectors. Higher levels of regulation could also impede the
efficient allocation of resources, giving less opportunity for domestic firms
to acquire funding to adopt new technologies; strong protection of property
rights would entice more technology-oriented FDI to develop their R&D
domestically; and freedom to trade would allow MNCs to export easily while
producing goods at a lower cost in developing countries, creating competition
and relationships with domestic firms in the process.
3. Data and Methodology
This study focuses on countries in distinct stages
of economic development. In parts of the analysis, the distinction is made
between OECD and non-OECD countries. A panel of 84 countries includes 34 OECD
countries and 50 non-OECD countries over the 2010-2019 period. The variables
included in the analysis are real GDP per capita, FDI inflows, economic freedom
index, gross capital formation, population growth rate, labor force
participation rate, and labor productivity. FDI inflows are the net inflow as a
percentage of real GDP. Real GDP and gross capital formation are in constant
2015 US dollars. Labor productivity is output per employed person in constant
2015 US dollars. The population growth rate is the ratio between the annual
increase in the population size and the total population. The labor force
participation rate is the percentage of a country’s working-age population
actively engaged in the labor market. Economic freedom is an index measuring
the degree of freedom in a country comprised of five major components: 1) size
of government, 2) legal structure and security of property rights, 3) access to
sound money, 4) exchange with foreigners, and 5) regulation of capital, labor,
and business.
Real GDP and gross capital formation were drawn
from the World Bank World Development Indicator. The data on FDI inflows was
obtained from the United Nations Conference on Trade and Development data
center (UNCTAD). Economic freedom is the index compiled by the Fraser
Institute. Population growth rate is compiled by the World Health Organization
(WHO). Labor productivity and labor force participation rates were obtained
from the International Labor Organization Statistics Database (ILOSTAT). Table 1 reports summary statistics for GDP
growth rate, FDI inflows, and domestic capital formation in percentage of GDP,
population growth rate, labor force participation rate, and labor productivity
changes over the sample period based on the respective full sample, OECD, and
non-OECD countries.3
Non-OECD countries appear to have higher GDP and population growth rates than
OECD countries, while average labor productivity in the former is notably lower
than in the latter. In terms of GDP size, transition economies also receive
approximately twice the FDI inflows as a percentage of GDP than OECD economies.

Table 1.
Summary Statistics for The Period 2010-2019.
| Variable | Mean | Std. dev. | Minimum | Maximum |
|---|---|---|---|---|
| Full Sample | ||||
| GDP Growth (%) | 3.14 | 2.66 | -12.09 | 20.11 |
| FDI (% of GDP) | 5.46 | 18.70 | -40.29 | 280.13 |
| Economic Freedom | 7.16 | 0.81 | 4.45 | 8.62 |
| Capital Cumulation (% of GDP) | 18.32 | 20.30 | -263.56 | 71.16 |
| Population Growth (%) | 1.18 | 1.37 | -1.319 | 12.25 |
| Labor Force Participation Rate (%) | 61.99 | 8.912 | 39.25 | 89.05 |
| Labor Productivity | 38557.87 | 39987.14 | 928.9 | 181776 |
| Non-OECD Countries | ||||
| GDP Growth (%) | 3.75 | 2.72 | -12.09 | 10.19 |
| FDI (% of GDP) | 6.64 | 22.87 | -24.90 | 280.13 |
| Economic Freedom | 6.78 | 0.80 | 4.45 | 8.25 |
| Capital Cumulation (% of GDP) | 18.32 | 24.87 | -263.56 | 71.16 |
| Population Growth | 1.65 | 1.50 | -0.92 | 12.25 |
| Labor Force Participation Rate (%) | 62.66 | 10.71 | 39.25 | 89.05 |
| Labor Productivity | 14119.7 | 13082.98 | 928.9 | 68993 |
| OECD Countries | ||||
| GDP Growth (%) | 2.22 | 2.29 | -11.30 | 20.11 |
| FDI (% of GDP) | 3.73 | 9.52 | -40.29 | 81.33 |
| Economic Freedom | 7.73 | 0.40 | 6.56 | 8.62 |
| Capital Cumulation (% of GDP) | 18.34 | 10.46 | -55.55 | 66.08 |
| Population Growth | 0.50 | 0.74 | -1.32 | 2.94 |
| Labor Force Participation Rate (%) | 61.00 | 5.12 | 47.97 | 77.75 |
| Labor Productivity | 74496.36 | 39103.87 | 14338 | 181776 |
Figure 1 displays the average annual real GDP growth rate, FDI inflows, and economic freedom for the sampled countries over the entire period (2010-2019). The fitted line in Figure 1(a) shows a weak positive relationship between FDI and economic growth (R2 = 0.038). Meanwhile, the fitted line in Figure 1(b) illustrates a negative correlation between output growth and economic freedom (R2 = 0.092). The economic freedom of high-growth transition economies appears to cluster around the lower end of the index, while FDI inflows contribute positively to economic growth. However, the correlations do not imply the causation of FDI to economic growth. If economic freedom is vital in fostering economic growth, one would expect that FDI inflows and economic freedom are complements.
The model specification is broadly consistent with
other panel data approaches that use FDI to estimate economic growth (for
instance, Caselli et al., 1996 and Alfaro et al., 2004). Our model also
includes labor productivity and economic freedom index to measure the effect of
productivity spillover and economic openness. Three conditional variables,
gross capital formation, population growth rate, and labor force participation
rate, are vital factors of production. The former measures the investment
levels of countries, and both latter variables are used to gauge labor force
growth in the countries. The economic freedom index will likely capture most
other pertinent variables, such as trade openness and government policies.
We first specify a growth level equation as
where yit denotes the
logarithm of real GDP in country i in year t; FDIit
is foreign direct investment, EFit is economic
freedom, CFit is gross capital formation, PGit
is the population growth rate, LFit is the labor force
participation rate, and LPit is labor
productivity. ηi is an unobserved country-specific effect
reflecting differences in the initial level of efficiency. The period-specific
intercept γt captures real income changes that are
common to all countries, and εit is the error term. Equation
(1) can be rewritten as a dynamic model in the level of GDP by adding yit-1
to both sides as follows.
where α = (1+β1). Equation
(2) explicates the dynamic structure of the growth equation. However, the OLS
estimate of the coefficient on the lagged dependent variable could bias upward
as is positively correlated with the country-specific
effects ηi. As proposed by Arellano and Bond (1991), one
approach to address this issue is to employ lagged levels of the regressors as
instruments, given that the error term is not serially correlated, and the
lagged explanatory variables are weakly exogenous. This alternative approach
addresses the presence of the lagged endogenous variable by first differencing
equation (2) to eliminate country-specific effects as
where the first difference equation removes
omitted-variable bias and country-specific effects. Then, following Arellano
and Bond (1991), we set the following moment conditions:
Despite being able to control country-specific
effects and simultaneity bias, difference GMM estimates potentially suffer from
instrumental problems with small samples. If the dependent variable was
persistent and close to being a random walk, applying difference GMM estimation
would yield both a biased and inefficient estimate of α1 in
finite samples, particularly acute with a relatively shorter estimation period.
Moreover, economic growth is dynamic and dependent
on past levels, and the independent variables are not strictly exogenous, given
that FDI and domestic investment may be correlated with past and current
realizations of the error. Empirical research in
international economics acknowledges that FDI, a dynamic process strongly
dependent on past observations, could also potentially lead to disturbances
that are likely heteroskedastic and serially correlated. One source of
endogeneity arises from the possibility that current values of FDI are a
function of past economic performance. Blundell and Bond (1998) attribute
the poor precision and significant finite sample bias of the difference GMM
estimator to lagged levels of the independent variables being weak instruments
and propose using system GMM to address the simultaneity bias in the
independent variables. The system dynamic panel GMM estimator effectively
avoids the deviation caused by this endogeneity problem by utilizing equations
(1) and (3) to provide more consistent estimates as a second condition for
utilizing system GMM. The approach reduces the biases and imprecision by using
additional moment conditions wherein difference equations use level
instruments, and level equations use difference instruments. The estimated
data, which includes a short period and a large number of countries, meets the
requirements of a small period and a large number of countries to be estimated
by GMM empirically.
Following Arellano and Bover (1995), we include the
additional moment conditions for the second part of the system, the level
equation.
The GMM estimators are applied with two-step
variants using the optimal weighting matrices, in which the moment conditions
are weighted by a consistent estimate of their covariance matrix. This would be
asymptotically more efficient, as explained in Arellano and Bond (1991). However, using the two-step estimator in small
samples would potentially result in the proliferation of instruments, leading
to biased standard errors and parameter estimates. To solve this problem, Windmeijer
(2005) proposed a finite sample bias-corrected standard error formula for the
two-step linear GMM. Following Roodman (2009), we use the above moment
conditions and employ the two-step estimator.
4. Empirical Results
Before conducting the GMM tests, we apply four
panel unit root tests to examine the stationary properties of the data series:
Levin, Lin, and Chu (2002, henceforth LLC), Im, Pesaran, and Shin (2003,
henceforth IPS), and the Fisher-ADF and Fisher-PP tests defined by Maddala and
Wu (1999) and Choi (2001). Table 2
presents the results of these tests. At the 5 percent significance level, the
LLC, IPS, and both Fisher tests provide strong evidence that the six series, GDP,
FDI, EF, CF, LF, and LP, are stationary,
while only two statistics LLC and IPS show that population growth is of the I
(1) process.
Table 2.
Panel Data Unit Root Test Result.
| Chi-Squared Test | ||||
| Variable | Levin, Lin & Chu | Im, Pesaran & Shin | ADF-Fisher | PP-Fisher |
| GDP | -20.6888* | -3.1327* | 764.4010* | 32.5363* |
| FDI | -51.2237* | -24.3951* | 808.5611* | 34.9455* |
| Economic Freedom (EF) | -31.0783* | -15.7595* | 940.1037* | 42.1217* |
| Capital Cumulation (CF) | -10.7141* | -17.6577* | 716.8125* | 29.9402* |
| Population Growth | -0.00042 | -0.0083 | 310.1695* | 7.7560* |
| Labor Force Participation Rate (LF) | -77.5358* | -41.1428* | 1246.3047* | 56.2808* |
| Labor Productivity (LP) | -36.9462* | -4.9398* | 720.6632* | 30.1502* |
Notes: * rejects the null hypothesis of unit root; lags in each test were defined by the Akaike information criterion.
Growth regressions are outlined with a series of models: pooled OLS, fixed effects, difference GMM, and system GMM. To apply dynamic panel data models with robust properties, we utilize both two-step difference GMM and system GMM to deal with heteroskedasticity and simultaneity biases likely to exist among the variables.4 According to Nickell (1981), consistent regression coefficients resulting from difference GMM and system GMM should lie within the coefficients stemming from pooled OLS (upper bound; upward bias) and fixed effects estimators (lower bound; downward bias).
Table 3 demonstrates regression results using pooled OLS, fixed effects, difference GMM, and system GMM estimators. We use Hansen’s (1982) J-test to verify GMM consistency that the instruments are valid. The null hypothesis assumes that the instrumental variables satisfy the conditions, and the alternative hypothesis means that the instruments are not entirely exogenous or have been incorrectly excluded from the model (Baum et al., 2003). The Hansen test results suggest that the null hypothesis is not rejected, thus allowing the use of the GMM models. We also consider the test of second-order serial correlation of the error term suggested by Arellano and Bond (1991), in which the null hypothesis of no serial correlation of the error term is not rejected, implying the GMM estimator is valid.
The coefficients on the lagged dependent variables in all four models have a value of less than or close to one, providing strong evidence of conditional convergence. The difference GMM estimate coefficient for the lagged dependent variable is close to the fixed effects estimator, which implies that the difference GMM estimate is somewhat downward biased. The system GMM estimator with the coefficient of the lagged dependent variable falling between pooled OLS and difference GMM estimators is much closer to the upper bound of the pooled OLS estimate, provides consistent and efficient estimates, overcomes the endogeneity problem, and is a better fit for the selected panel data.
The coefficient generated by the system GMM estimator shows that economic freedom estimates are positive and significant, confirming the positive relationship between economic freedom and growth. Capital investment from FDI inflows and domestic accumulation also drive economic growth, and both sources of capital formation are equally effective in explaining economic growth. While the evidence shows that FDI leads to economic growth, a multitude of factors can still affect this relationship. Hall and Jones (1999) find that social infrastructure drives productivity and growth success through high physical and human capital investment. Differences in social infrastructure across countries can cause differences in capital accumulation, educational attainment, and productivity, which leads to differences in income between countries, thus affecting long-run economic performance concerning productivity and investment.5
The coefficients of population growth and labor force participation rate are negative but not statistically significant, while the coefficient on labor productivity is negative and statistically significant with system GMM estimates. This could be partially explained by Meyer and Sinani (2009) who find a curvilinear relationship between productivity spillovers and the level of economic development. The sample comprises developed, developing, and less developed countries, so the link between productivity and growth could thus be negative or positive.
We then examine the role of FDI on growth through productivity spillover and economic freedom. Following the model developed in section 3, we interact FDI with respective labor productivity and economic freedom and use each interaction term as a regressor. To ensure that the interaction term does not proxy for FDI or the level of labor productivity and economic freedom, both latter variables were included in the regression independently. Thus, we run the following regressions:
As shown in Table 4, each regression uses a different indicator for the FDI effect: column (1) uses labor productivity, and column (2) uses economic freedom. The main result is that the coefficients of both the interaction terms are statistically significant with or without including FDI inflows separately as a regressor.6 This implies that the marginal effect of FDI on economic growth depends on the level of productivity and economic freedom. FDI inflows alone appear to be significant but negative in general. This may be because, without progress in economic freedom, FDI inflows do not affect growth.7 Without productivity improvement, it is also possible that FDI inflows are not channeled efficiently and can even negatively affect growth. The results suggest a productivity spillover effect and economic freedom play an enhancing role in driving FDI inflow to growth. A caveat regarding this inference is that the interaction terms in our main specification force the impact of FDI on growth to increase monotonically with the level of LP and EF.8 However, a certain level of LP and EF may be required before the effect of FDI prevails in host countries. Only countries with an extent of absorptive capacity and adopting more progressive and transparent economic policies will likely benefit from the presence of FDI inflows.
We further evaluate the data by the subsets of OECD and non-OECD countries. Tables 5(a) and 5(b) give the results of models estimated by system GMM. When the regressions exclude interaction terms, the coefficients on FDI are positive and statistically significant, and the FDI coefficient turns out to be approximately twice as great for OECD than non-OECD countries. The coefficients on domestic capital formation are also significant and approximately equal for both groups.
Table 5.
(a). Regression Results with Alternative Specifications: non-OECD Countries. (b). Regression Results with Alternative Specifications: OECD Countries.
Table 5.
(a). Regression Results with Alternative Specifications: non-OECD Countries. (b). Regression Results with Alternative Specifications: OECD Countries.
| (1) | (2) | (3) | ||||
|---|---|---|---|---|---|---|
| Lagged GDP (log) | 0.9975*** | 0.9926*** | 0.9981*** | |||
| (0.0059) | (0.0064) | (0.0039) | ||||
| FDI as % of GDP | 0.0015* | -0.0156* | -0.0111* | |||
| (0.0009) | (0.0090) | (0.0067) | ||||
| Economic Freedom (log) | 0.1392*** | 0.1575* | 0.0697 | |||
| (0.0480) | (0.0879) | (0.1066 | ||||
| Capital Cumulation as % of GDP | 0.0016* | 0.0020* | 0.0034** | |||
| (0.0008) | (0.0011) | (0.0014) | ||||
| Population Growth (%) | -0.0003 | -0.0004 | -0.0004 | |||
| (0.0040) | (0.0029) | (0.0032) | ||||
| Labor Force Participation Rate (log) | -0.0590 | -0.0402 | -0.0040 | |||
| (0.0439) | (0.0397) | (0.0547) | ||||
| Labor Productivity (log) | -0.0275** | -0.0350*** | -0.0168 | |||
| (0.0121) | (0.0122) | (0.0110) | ||||
| FDI x LP | 0.0017** | |||||
| (0.0008) | ||||||
| FDI x EF | 0.0071* | |||||
| (0.0037) | ||||||
| AR(1) Test (p-value) | 0.017 | 0.039 | 0.049 | |||
| AR(2) Test (p-value) | 0.147 | 0.120 | 0.101 | |||
| Hansen Test (p-value) | 0.251 | 0.349 | 0.167 | |||
| Number of Observations | 500 | 500 | 500 | |||
| Number of Countries | 50 | 50 | 50 | |||
| Number of Instruments | 47 | 49 | 38 | |||
| Notes: The dependent variable is the log of GDP. Robust standard errors are in parentheses. Time dummies are included in all the regressions (not reported). *, **, and *** indicate that the coefficients are significant at respective 10, 5, and 1 percent levels. Both columns report two-step Blundell and Bond (1998) system-GMM estimator with Windmeijer finite-sample correction. Labor productivity, labor force participation rate, and population growth are predetermined variables; foreign direct investment and capital accumulation are treated as endogenous in the estimation and are instrumented with their lagged values. The number of instruments is collapsed by dropping deeper lags as instruments to avoid the problem of instrument proliferation and overfitting of the endogenous explanatory variables (Roodman, 2009) | ||||||
| (1) | (2) | (3) | ||||
| Lagged GDP (log) | 0.9879*** | 0.9885*** | 0.9928*** | |||
| (0.0063) | (0.0082) | (0.0055) | ||||
| FDI as % of GDP | 0.0028** | -0.0143** | -0.0343*** | |||
| (0.0011) | (0.0067) | (0.0124) | ||||
| Economic Freedom (log) | 0.2943 | 0.0831 | -0.0538 | |||
| (0.3695) | (0.1487) | (0.1928) | ||||
| Capital Cumulation as % of GDP | 0.0015* | 0.0012* | 0.0014* | |||
| (0.0008) | (0.0007) | (0.0007) | ||||
| Population Growth | 0.0117* | 0.0118** | 0.0073* | |||
| (0.0063) | (0.0062) | (0.0042) | ||||
| Labor Force Participation Rate (log) | -0.1018 | -0.0574 | -0.0072 | |||
| (0.0913) | (0.0555) | (0.0384) | ||||
| Labor Productivity (log) | -0.0066 | -0.0063 | -0.0080 | |||
| (0.0131) | (0.0091) | (0.0097) | ||||
| FDI x LP | 0.0014** | |||||
| (0.0006) | ||||||
| FDI x EF | 0.0176*** | |||||
| (0.0060) | ||||||
| AR(1) Test (p-value) | 0.038 | 0.031 | 0.064 | |||
| AR(2) Test (p-value) | 0.141 | 0.174 | 0.102 | |||
| Hansen Test (p-value) | 0.291 | 0.240 | 0.123 | |||
| Number of Observations | 340 | 340 | 340 | |||
| Number of Countries | 34 | 34 | 34 | |||
| Number of Instruments | 34 | 27 | 29 | |||
| Notes: The dependent variable is the log of GDP. Robust standard errors are in parentheses. Time dummies are included in all the regressions (not reported). *, **, and *** indicate that the coefficients are significant at respective 10, 5, and 1 percent levels. Both columns report two-step Blundell and Bond (1998) system-GMM estimator with Windmeijer finite-sample correction. Labor productivity, labor force participation rate, and population growth are predetermined variables; foreign direct investment and capital accumulation are treated as endogenous in the estimation and are instrumented with their lagged values. The number of instruments is collapsed by dropping deeper lags as instruments to avoid the problem of instrument proliferation and overfitting of the endogenous explanatory variables (Roodman, 2009) | ||||||
The interaction terms reveal a positive, robust link between FDI inflows and productivity and between FDI inflows and economic freedom for both groups of transition and OECD economies. While the coefficient estimates are similar for the variables of the FDI-productivity interaction term, the interaction of FDI inflows and economic freedom is more substantial for OECD than for non-OECD countries. A potential explanation is that the interaction term may have captured an overall tendency for FDI to contribute to transition and OECD countries with a minimum threshold of economic infrastructure. The absorptive capacity for OECD countries with greater economic freedom appears to be the critical improvement for economic growth ascribing to FDI inflows.
Economic freedom alone drives economic growth only in non-OECD countries, and FDI inflows affect growth negatively when interaction terms are included in the regression. FDI inflows are valuable in terms of productivity spillover benefits in general, and the spillover benefits for OECD and transition economies appear to be similar. OECD economies tend to explore a greater absorptive capacity in FDI spillovers through improved economic freedom. However, economic freedom alone does not guarantee strong economic growth in OECD countries yet is more pronounced in enhancing economic growth in non-OECD countries.
The average population growth rate in non-OECD countries is three times greater than the growth rate in OECD countries. A larger population could drive economic growth in OECD countries but could be a substantial economic burden in non-OECD countries. The effects of the labor force participation rate on growth are adverse but statistically insignificant for OECD and non-OECD countries. The estimated labor productivity results are also mixed for both groups but seem to play a more antagonistic role in the economic growth of non-OECD countries.
To investigate how economic growth and FDI inflows are correlated in separate groups of OECD and transition economies, Figure 2 plots the relationship between these variables for the observations from 2010 to 2019. The fitted lines show a significantly more positive relationship between the FDI and economic growth for OECD countries than non-OECD countries. While the economies of most non-OECD countries are in transition with relatively higher economic growth, OECD countries stand to gain more from FDI inflows. Figure 3 plots the correlation between economic growth and economic freedom separated into OECD and transition economies. The fitted lines depict a weak positive correlation between output growth and economic freedom for non-OECD countries but a negative correlation for OECD countries. OECD countries are substantially more conducive to higher economic freedom despite output growth responding to economic freedom slightly inversely.
Note: economic growth (in percentage) was computed using real GDP per capita downloaded from the World Bank World Development Indicators, Foreign direct investments are the net inflows of investment to acquire a lasting management interest and the economic freedom index was taken from the Fraser Institute.
5. Conclusion
There is a shared view among policymakers across the globe that FDI inflows are a significant source of external financing for developing countries, emerging economies, and countries in transition (UNCTAD, 2019). FDI inflows are essential for transferring capital and technology, improving productivity, and growing economies. FDI inflows provide the capital needed for economic development, a substantive impetus for employment gains, especially in economies transitioning towards higher development. For economies transitioning from one level of development to the next, economic openness provides fertile ground for the effective allocation of capital, leading to higher productivity and economic growth. As productivity spillovers can occur with FDI inflows bringing along capital and technology, many factors could explain why FDI inflows contribute to higher productivity.
Applying the GMM system estimator to a panel of 84 countries over the period 2010-2019, we examine the productivity spillover effect of FDI inflows and the extent to which economic freedom attracts foreign investment. By separating the data into respective groups of transition and OECD economies, we focus on the effect of FDI inflows on economic growth and the channels through which the effect takes place for countries in different stages of development. The empirical results suggest that FDI inflows are valuable in terms of productivity spillover benefits in general, and the spillover benefits are relatively comparable for OECD and transition economies. Economic freedom is a substantial element for FDI inflows, and OECD economies with more economic freedom tend to explore greater absorptive capacity in FDI spillovers. However, economic freedom alone does not guarantee strong economic growth in OECD countries yet is more pronounced in enhancing economic growth in non-OECD countries. Our results confirm from previous studies that only economies with a certain level of economic infrastructure and economic development would benefit more from FDI inflows.
In addition to examining FDI spillover effects in general, this paper contributes to the existing literature on the effect of FDI presence along with productivity and economic freedom, concentrating explicitly in separate groups of transition and OECD economies. Despite policies in effect that explicitly aim to attract foreign investment, empirical evidence on the growth effect of FDI inflows is still subject to the specific factors underlying countries. When multiple definitions of the spillover variables are used, the results could vary across countries. This is a potential area for further study to discern how the level of economic freedom and country development affects this overall relationship and its progression over time.
Appendix A
Data Sources and Descriptions for Empirical Analysis
Gross Domestic Product (GDP) The World Bank World Development Indicator in its Data Bank compiles GDPs in various countries. GDP at purchaser’s prices is the sum of gross value added by all resident producers in the economy plus any product taxes and minus any subsidies not included in the value of the products. It is calculated without making deductions for the depreciation of fabricated assets or for the depletion and degradation of natural resources. Data are in constant 2015 prices, expressed in U.S. dollars. Dollar figures for GDP are converted from domestic currencies using 2015 official exchange rates. For a few countries where the official exchange rate does not reflect the rate effectively applied to actual foreign exchange transactions, an alternative conversion factor is used.
Foreign Domestic Investments (FDIs) Foreign direct investments are the net inflows of investment to acquire a lasting management interest (10 percent or more of voting stock) in an enterprise operating in an economy other than that of the investor. It is the sum of equity capital, reinvestment of earnings, other long-term capital, and short-term capital as shown in the balance of payments. This series shows net inflows (new investment inflows less disinvestment) in the reporting economy from foreign investors and is divided by GDP.
Economic Freedom Index (EFI) The Fraser Institute compiles and publishes an annual index of economic freedom in each country. The degree of economic freedom is measured in five broad areas: size of government, legal system and property rights, sound money, freedom to trade internationally, and regulation.
Gross Capital Formation (GCF) World Bank national accounts data and OECD National Accounts compile these data files. Gross capital formation consists of outlays on additions to the fixed assets of the economy plus net changes in the level of inventories. Fixed assets include land improvements (fences, ditches, drains, and so on); plant, machinery, and equipment purchases; and the construction of roads, railways, and the like, including schools, offices, hospitals, private residential dwellings, and commercial and industrial buildings. Inventories are stocks of goods held by firms to meet temporary or unexpected fluctuations in production or sales, and “work in progress.” According to the 2008 SNA, net acquisitions of valuables are also considered capital formation. Data are in constant 2015 prices, expressed in U.S. dollars.
Population Growth (PG) The World Health Organization (WHO) publishes the annual average rate of change of population size for each of the given countries in the world. The growth rate expresses the ratio between the annual increase in the population size and the total population for a given year multiplied by 100. The annual increase in the population size is defined as a sum of differences: the difference between births and deaths and the difference between immigrants and emigrants in a given country over a given year.
Labor Force Participation Rate (LFP) The International Labor Organization Statistics Database (ILOSTAT) is a global reference for international labor statistics, providing a comprehensive database and resources for producing labor statistics. The labor force participation rate is the proportion of the population ages 15 and older that is economically active: all people who supply labor for producing goods and services during a specified period.
Labor Productivity (LP) The International Labor Organization Statistics Database (ILOSTAT) is a global reference for international labor statistics, providing a comprehensive database and resources for producing labor statistics. Labor productivity is measured by output per worker. Data are in constant 2015 prices, expressed in U.S. dollars.
Notes
- Antràs (2020) in his background paper for the 2020 World Development Report explains that countries participating in global value chain are subject to the international fragmentation of production that constitutes the use of foreign value added embodied in intermediate inputs.
- Alfaro et al. (2004, 2010) and Durham (2004) also show that a country’s capacity to take advantage of FDI externalities depends on the development of the financial markets.
- Data sources and descriptions for empirical analysis are provided in the Appendix A.
- The two-step GMM estimator weighs the moment conditions by a consistent estimate of their covariance matrix, which makes the two-step estimator asymptotically more efficient than the one-step estimator.
- Erroneous inferences would arise due to correlation with unobserved heterogeneity. Using panel data with instrumental variables could control for possibly correlated, time-invariant heterogeneity without observing it (Arellano, 2003).
- The coefficients and t-statistics on the interaction term are around 0.00027 and 2.65 for labor productivity and 0.0013 and 2.30 for the economic freedom index in the regressions that do not include FDI/GDP as a separate regressor.
- This corresponds to the findings of Azman-Saini et al. (2010) who show that FDI by itself has no direct effect on economic growth. The effect of FDI is contingent on the level of economic freedom in the host countries.
- The interaction between FDI and LP can be written as a linear model as y = wo +w1(FDI)+w2(LP) +w3(FDI)(LP), where the interaction term (FDI)(LP) can be absorbed into the coefficient for FDI, making it depend on LP such that y = wo +v1(FDI)(LP) +w2(LP). v1(LP) = w1 +w3(LP) is a function that depends on LP. So, when adding an interaction term, the coefficient of FDI can vary depending on the coefficient of LP. This operation only touches the coefficients, not the variables themselves, so it doesn’t imply a collinearity between FDI and LP. This analogy is also applied to the interaction of FDI and EF.
References
- Alam, A., M. U. Arshad, and W. Rajput. 2013. Relationship of labor productivity, foreign direct investment and economic growth: evidence from OECD countries. Journal of Business and Management Sciences 1(6): 133–138.
- Alfaro, L., A. Chanda, S. Kalemli-Ozcan, S. Sayek. 2004. FDI and economic growth: the role of local financial markets. Journal of International Economics 64: 89–112. [CrossRef]
- Alfaro, L., A. Chanda, S. Kalemli-Ozcan, S. Sayek. 2010. Does foreign direct investment promote growth? Exploring the role of financial markets on linkages. Journal of Development Economics 91(2): 242-256. [CrossRef]
- Amann, E., and S. Virmani. 2014. Foreign direct investment and reverse technology spillovers: the effect on total factor productivity. Economic Studies 2014(1): 129-53. [CrossRef]
- Antràs, P. 2020. Conceptual aspects of global value chains, World Bank Economic Review 34(3): 551-74. [CrossRef]
- Arellano, M. 2003, Unobserved Heterogeneity. In: Panel Data Econometrics, Chapter 2, pp. 7-31. Oxford University Press.
- Arellano, M., S. Bond. 1991. Some tests of specification for panel data: Monte Carlo evidence and an application to employment equations. The Review of Economic Studies 58(2): 277. [CrossRef]
- Arellano, M., and O. Bover. 1995. Another look at the instrumental variable estimation of error-components models. Journal of Econometrics 68(1): 29–51. [CrossRef]
- Azman-Saini, W. N. W., A. Z. Baharumshah, and S. H. Law. 2010. Foreign direct investment, economic freedom and economic growth: International evidence. Economic Modelling 27(5): 1079–1089. [CrossRef]
- Balasubramanyam, V. N., D. Sapsford, and M. Salisu. 1999. Foreign direct investment as an engine of growth.pdf. The Journal of International Trade and Economic Development 8(1): 27–40. [CrossRef]
- Baum, C. F., M. E. Schaffer, and S. Stillman. 2003. Instrumental variables and GMM: Estimation and testing. The Stata Journal 3(1): 1-31. [CrossRef]
- Bengoa, M., and B. Sanchez-Robles. 2003. Foreign direct investment, economic freedom and growth: new evidence from Latin America. European Journal of Political Economy 19(3): 529–545. [CrossRef]
- Blomstrom, M., and A. Kokko. 1998. Multinational corporations and spillovers. Journal of Economic Surveys 12(3): 247–277. [CrossRef]
- Blomström, M., A. Kokko, and J. -L. Mucchielli. 2003. The economics of foreign direct investment incentives. In: H. Herrmann & R. Lipsey (Eds.), Foreign Direct Investment in the Real and Financial Sector of Industrial Countries. Springer, Berlin, Heidelberg.
- Blundell, R., and S. Bond. 1998. Initial conditions and moment restrictions in dynamic panel data models. Journal of Econometrics 87(1): 115-43. [CrossRef]
- Caselli, F., G. Esquivel, and F. Lefort. 1996. Reopening the convergence debate: a new look at cross-country growth empirics. Journal of Economic Growth 1(3): 363-389. [CrossRef]
- Charles, J. 1995. R and D-based models of economic growth. The Journal of Political Economy 103(4): 759–784. [CrossRef]
- Choi, I., Unit root tests for panel data. Journal of International Money and Finance 20: 249-272. [CrossRef]
- Chowdhury, A., and G. Mavrotas. 2006. FDI and growth: what causes what? World Economy 29(1): 9-19. [CrossRef]
- Demena, B. A., and P. A. G. van Bergeijk. 2017. A meta-analysis of FDI and productivity spillovers in developing countries. Journal of Economic Surveys 31(2): 546–71. [CrossRef]
- Dollar, D. 2017. Global value chains provide new opportunities to developing countries. The Brookings Institution. https://www.brookings.edu/blog/order-from-chaos/2017/07/19/global-value-chains-provide-new-opportunities-to-developing-countries/.
- Durham, J., 2004. Absorptive capacity and the effects of foreign direct investment and equity foreign portfolio investment on economic growth. European Economic Review 48, 285–306. [CrossRef]
- Fraser Institute, Economic Freedom of the World – Data by country. https://www.fraserinstitute.org/studies/economic-freedom-of-the-world-2019-annual-report.
- Fukase, E. 2010. Revisiting linkages between openness, education and economic growth: system GMM approach. Journal of Economic Integration 25(1): 194–223. [CrossRef]
- Gorg, H., and E. Strobl, E. 2001. Multinational companies and productivity spillovers: a meta-analysis. The Economic Journal 111(475), F723–F739. [CrossRef]
- Gorodnichenko, Y., J. Svejnar, and K. Terrell. 2014. When does FDI have positive spillovers? Evidence from 17 transition market economies. Journal of Comparative Economics, 42(4): 954–969. [CrossRef]
- Hall, R. E., and C. I. Jones. 1999. Why do some countries produce so much more output per worker than others? The Quarterly Journal of Economics 114(1): 83–116. [CrossRef]
- Hansen, L. P. 1982. Large sample properties of generalized method of moments estimators. Econometrica 50(4): 1029. [CrossRef]
- Hijzen, A., P. S. Martins, T. Schank, and R. Upward. 2013. Foreign-owned firms around the world: a comparative analysis of wages and employment at the micro-level, European Economic Review 60: 170-188. [CrossRef]
- Im, K. S., Pesaran, M. H., and Shin, Y., 2003. Testing for unit roots in heterogeneous panels. Journal of Econometrics 115: 53-74. [CrossRef]
- Iamsiraroj, S., and M. A. Ulubaşoğlu. 2015. Foreign direct investment and economic growth: a real relationship or wishful thinking? Economic Modelling 51: 200–13. [CrossRef]
- International Labour Organization, ILOSTAT. ILO modelled estimates. https://www.ilo.org/ilostat/faces/oracle/webcenter/portalapp/pagehierarchy/Page3.jspx?_adf.ctrl-state=b3lnqhy9j_79&_afrLoop=260166047103338#!
- Investment Policy and Promotion. 2019. Investment Climate Brief. The World Bank. https://www.worldbank.org/en/topic/investment-climate/brief/investment-policy-and-promotion.
- Iršová, Z., and T. Havránek. 2013. Determinants of horizontal spillovers from FDI: evidence from a large meta-analysis. World Development 42: 1–15. [CrossRef]
- Korkmaz, S., and O. Korkmaz. 2017. The Relationship between labor productivity and economic growth in OECD Countries. International Journal of Economics and Finance 9(5): 71-6. [CrossRef]
- Kristjánsdóttir, H. 2010. Foreign direct investment: the knowledge-capital model and a small country case. Scottish Journal of Political Economy 57(5): 591–614. [CrossRef]
- Levin, A., Lin, C.F. and Chu, C., 2002. Unit root tests in panel data: asymptotic and finite-sample properties. Journal of Econometrics 108: 1-24. [CrossRef]
- Lipsey, R. and F. SjÖholm 2004. Foreign direct investment, education and wages in Indonesian manufacturing, Journal of Development Economics 73(1): 415-22. [CrossRef]
- Liu, Z. 2008. Foreign direct investment and technology spillovers: theory and evidence. Journal of Development Economics 85(1–2): 176–93. [CrossRef]
- Maddala, G. S. and Wu, S., 1999. A comparative study of unit root tests with panel data and a new simple test. Oxford Bulletin of Economics and Statistics 61: 631-652. [CrossRef]
- Meyer, K. E., and E. Sinani. 2009. When and where does foreign direct investment generate positive spillovers? A meta-analysis. Journal of International Business Studies, 40(7): 1075–94. [CrossRef]
- Moreira, R. R. 2019. Inflation and real exchange rate and macroeconomic gaps: causality for 50 emerging and developing countries. Economics Bulletin, 39(1): 142-28.
- Naanwaab, C., and M. Diarrassouba. 2016. Economic freedom, human capital, and foreign direct investment. The Journal of Developing Areas 50(1): 407–424.
- Nickell, S. 1981. Biases in dynamic models with fixed effects. Econometrica 49(6):1417–1426. [CrossRef]
- Roodman, D. 2009. A note on the theme of too many instruments. Oxford Bulletin of Economics and Statistics 71(1): 135-158. [CrossRef]
- Sambharya, R. B., and A. A. Rasheed. 2015. Does economic freedom in host countries lead to increased foreign direct investment? Competitiveness Review 25(1): 2–24. [CrossRef]
- Serpa, J. C., and H. Krishnan. 2018. The Impact of supply chains on firm-level productivity news, Management Science 64(2): 511-532.
- The World Bank, Investment Climate Brief. 2021. Investment Policy and Promotion, https://www.worldbank.org/en/topic/investment-climate/brief/investment-policy-and-promotion.
- The World Bank, World Development Indicators. GDP, Gap-filled total method. http://data.worldbank.org/indicator/NY.GDP.MKTP.KD.
- United Nations Conference on Trade and Development, UNCTAD. Foreign direct investment. https://unctadstat.unctad.org/wds/ReportFolders/reportFolders.aspx More information at https://unctadstat.unctad.org/wds/TableViewer/summary.aspx?ReportId=96740.
- Vu, T. B., B. Gangnes, and I. Noy. 2008. Is foreign direct investment good for growth? Evidence from sectoral analysis of China and Vietnam. Journal of the Asia Pacific Economy 13(4): 542–562. [CrossRef]
- Windmeijer, F., 2005. A finite sample correction for the variance of linear efficient two-step GMM estimators. Journal of Econometrics 126, 25–51. [CrossRef]
- Wooster, R. B., and D. S. Diebel. 2010. Productivity spillovers from foreign direct investment in developing countries: a meta-regression analysis. Review of Development Economics 14(3): 640-55. [CrossRef]
Figure 1.
a). b).
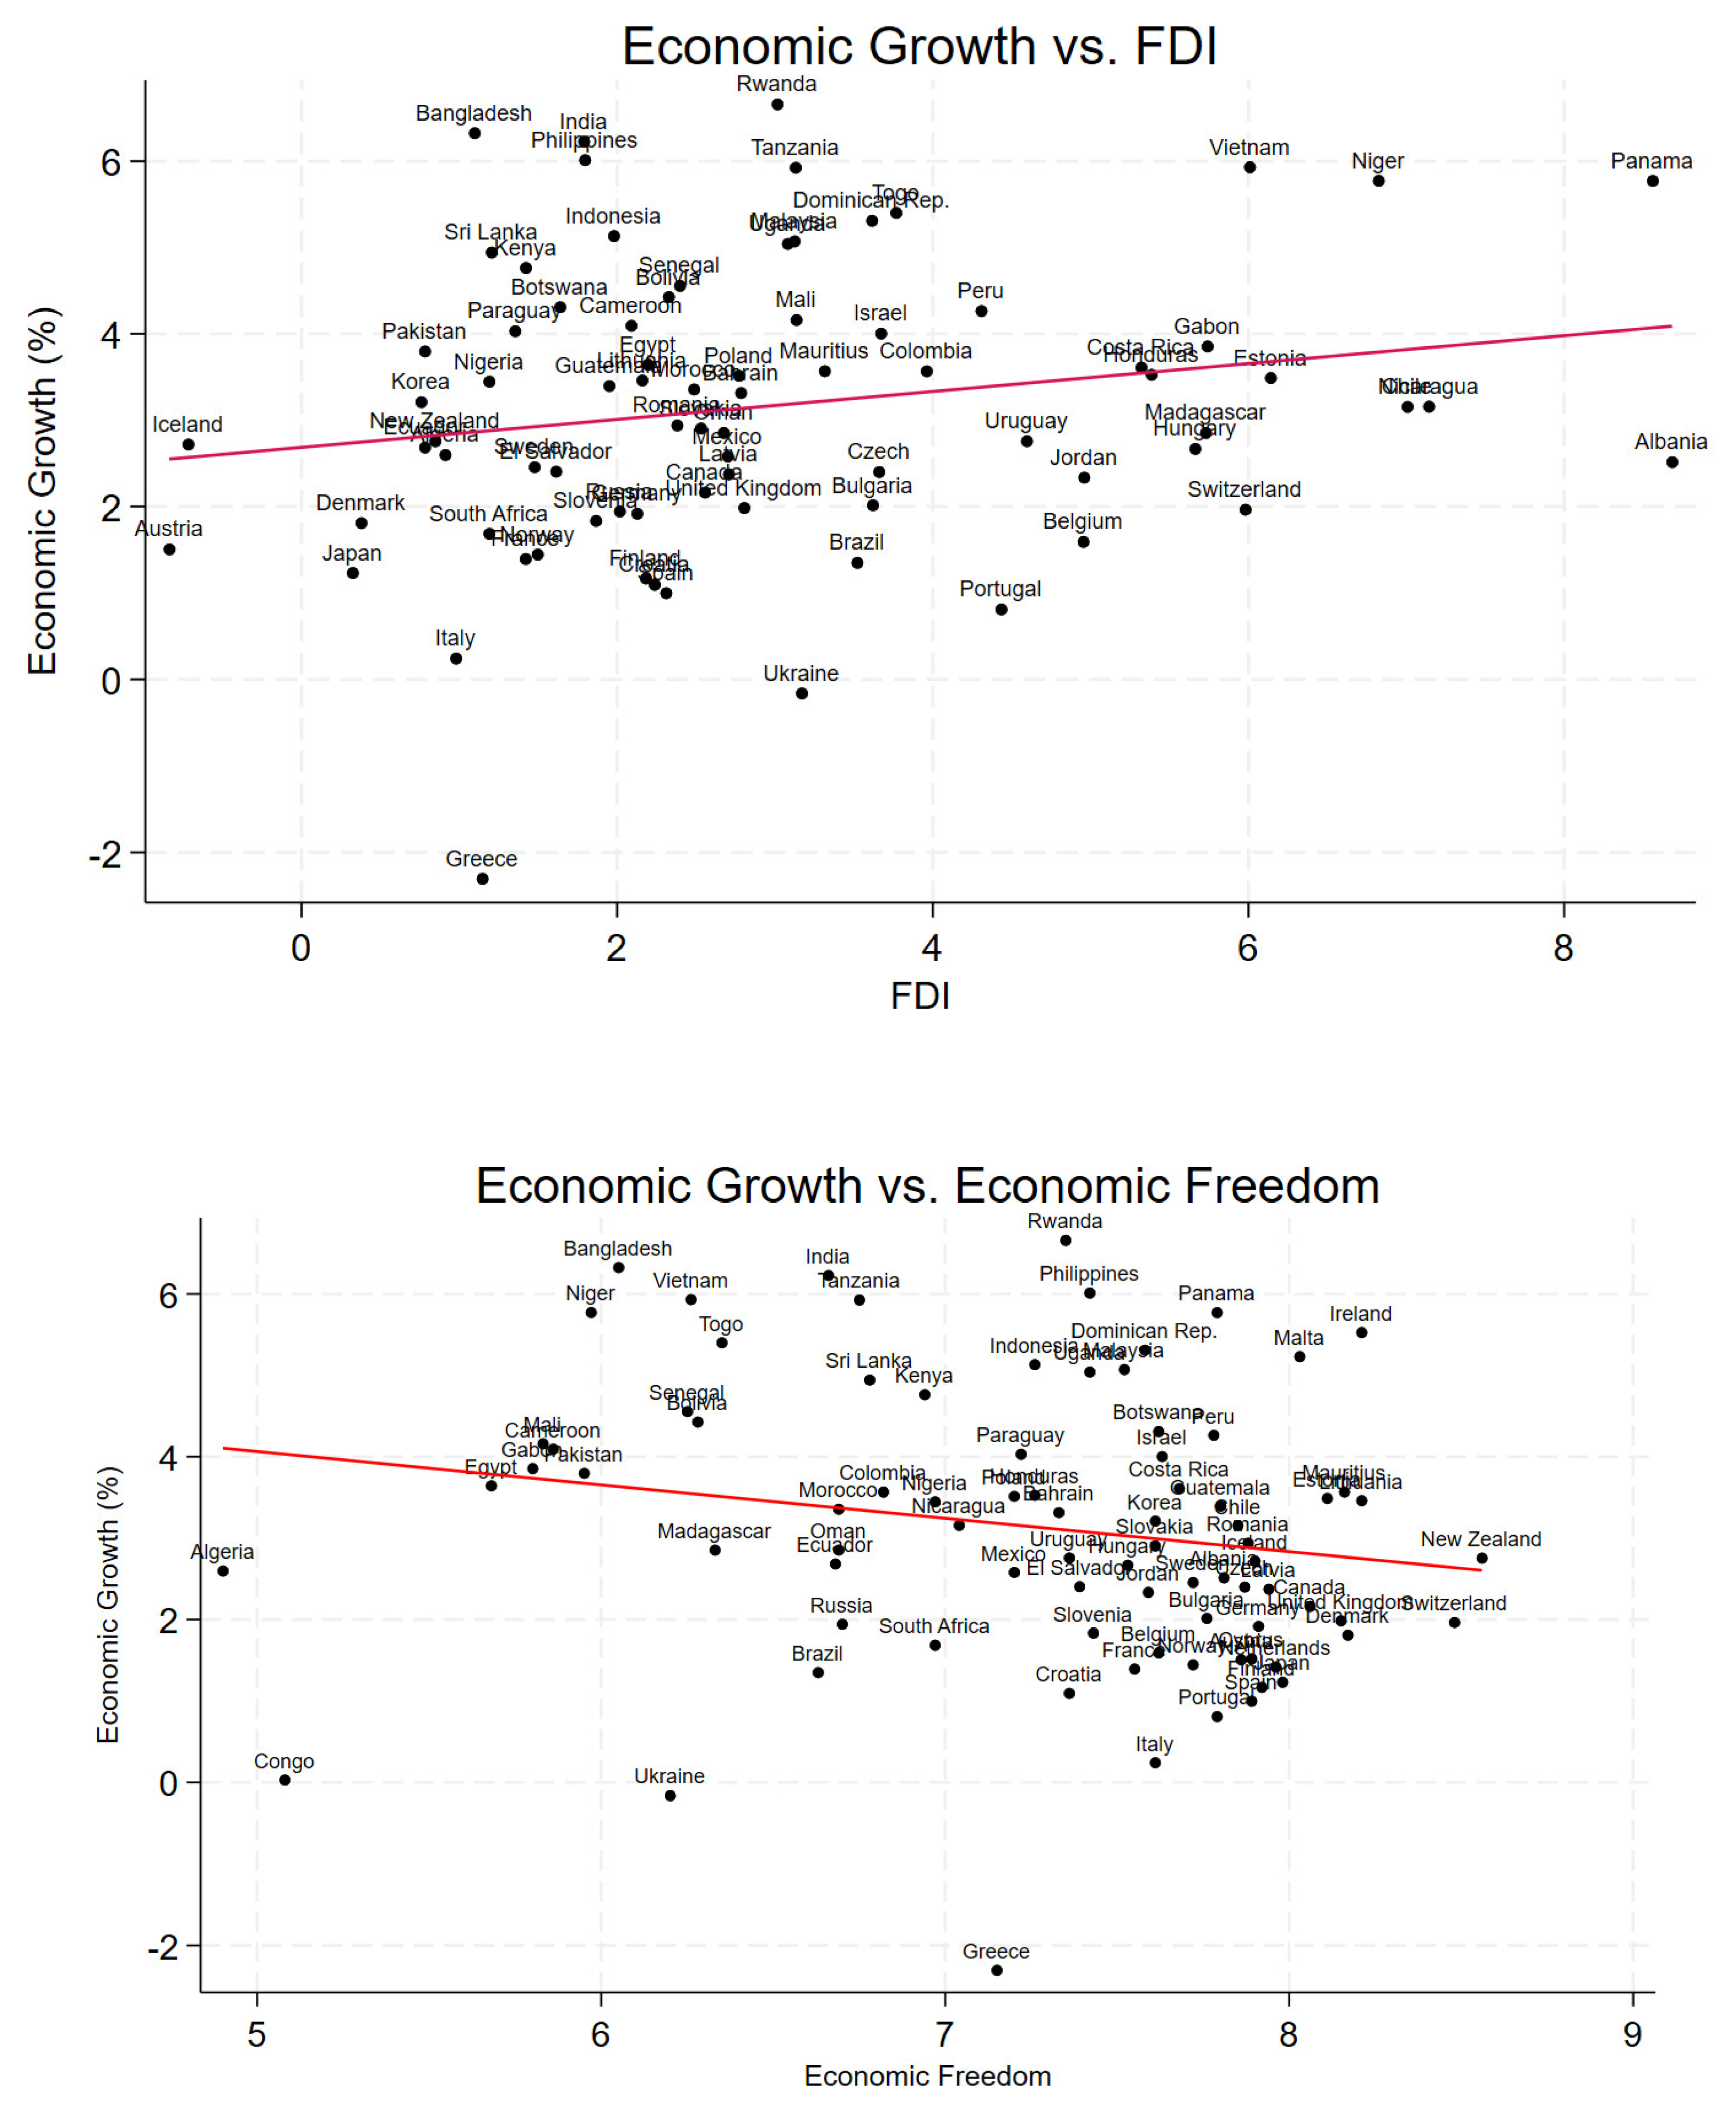
Figure 2.
a). b).
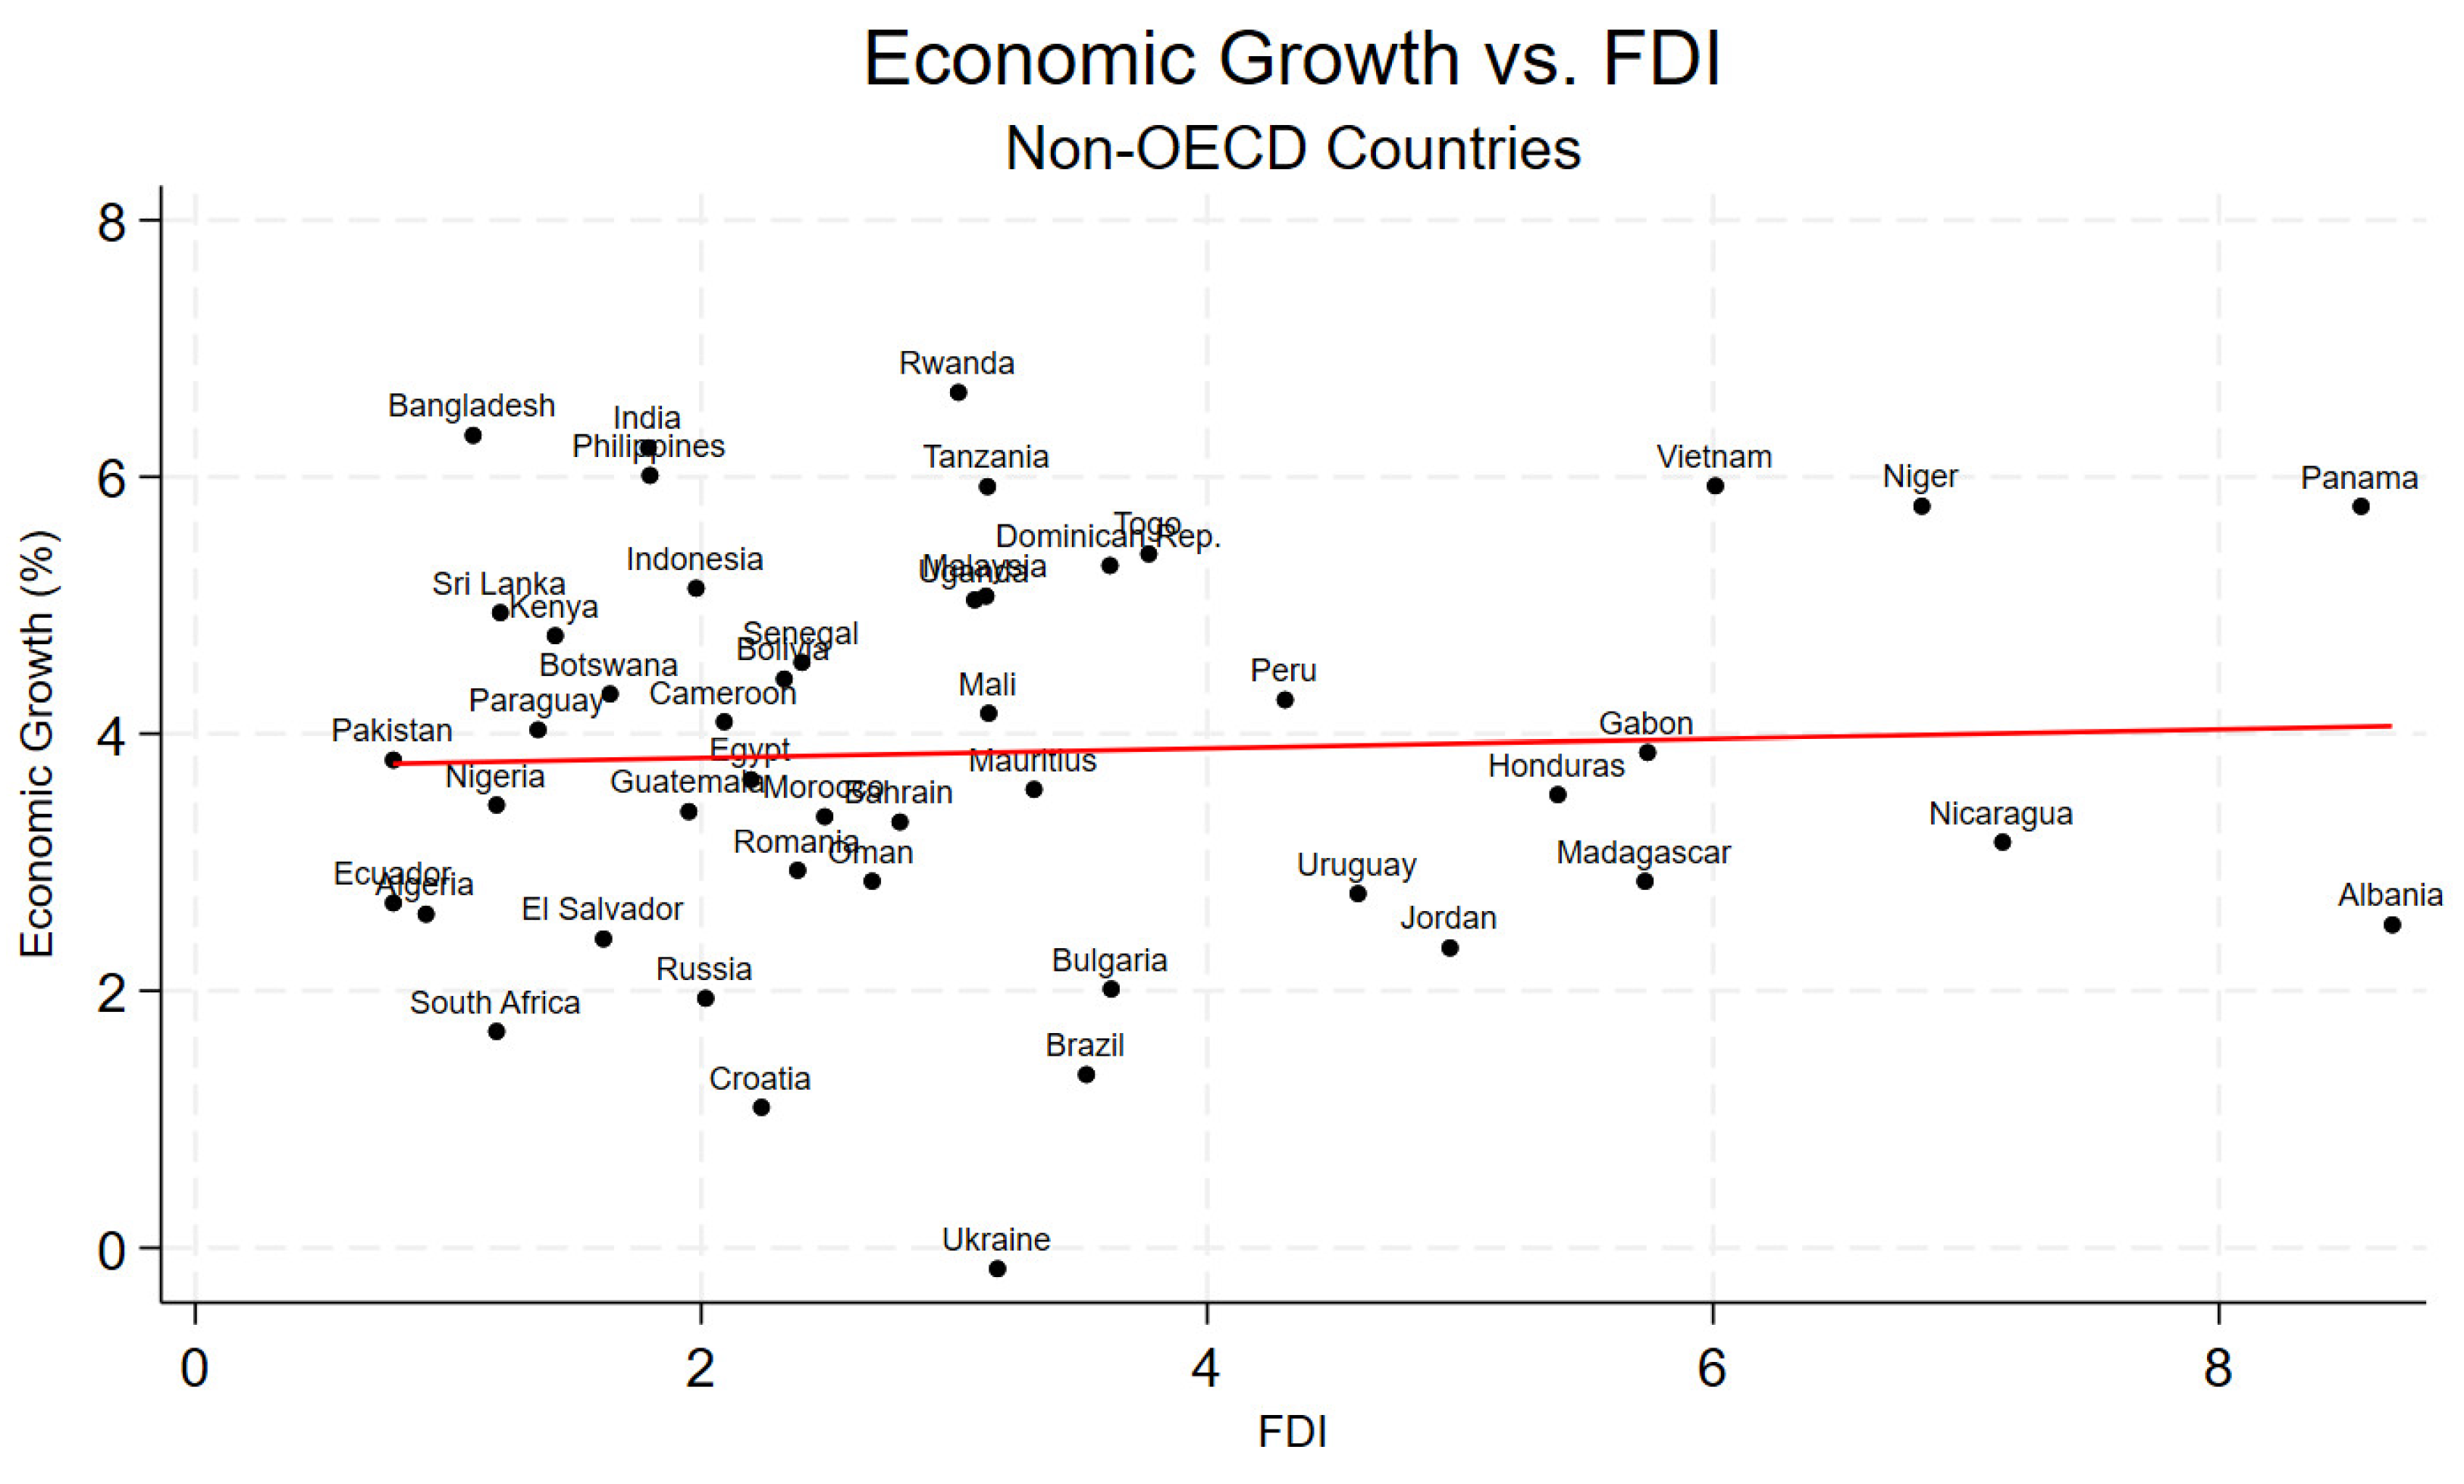
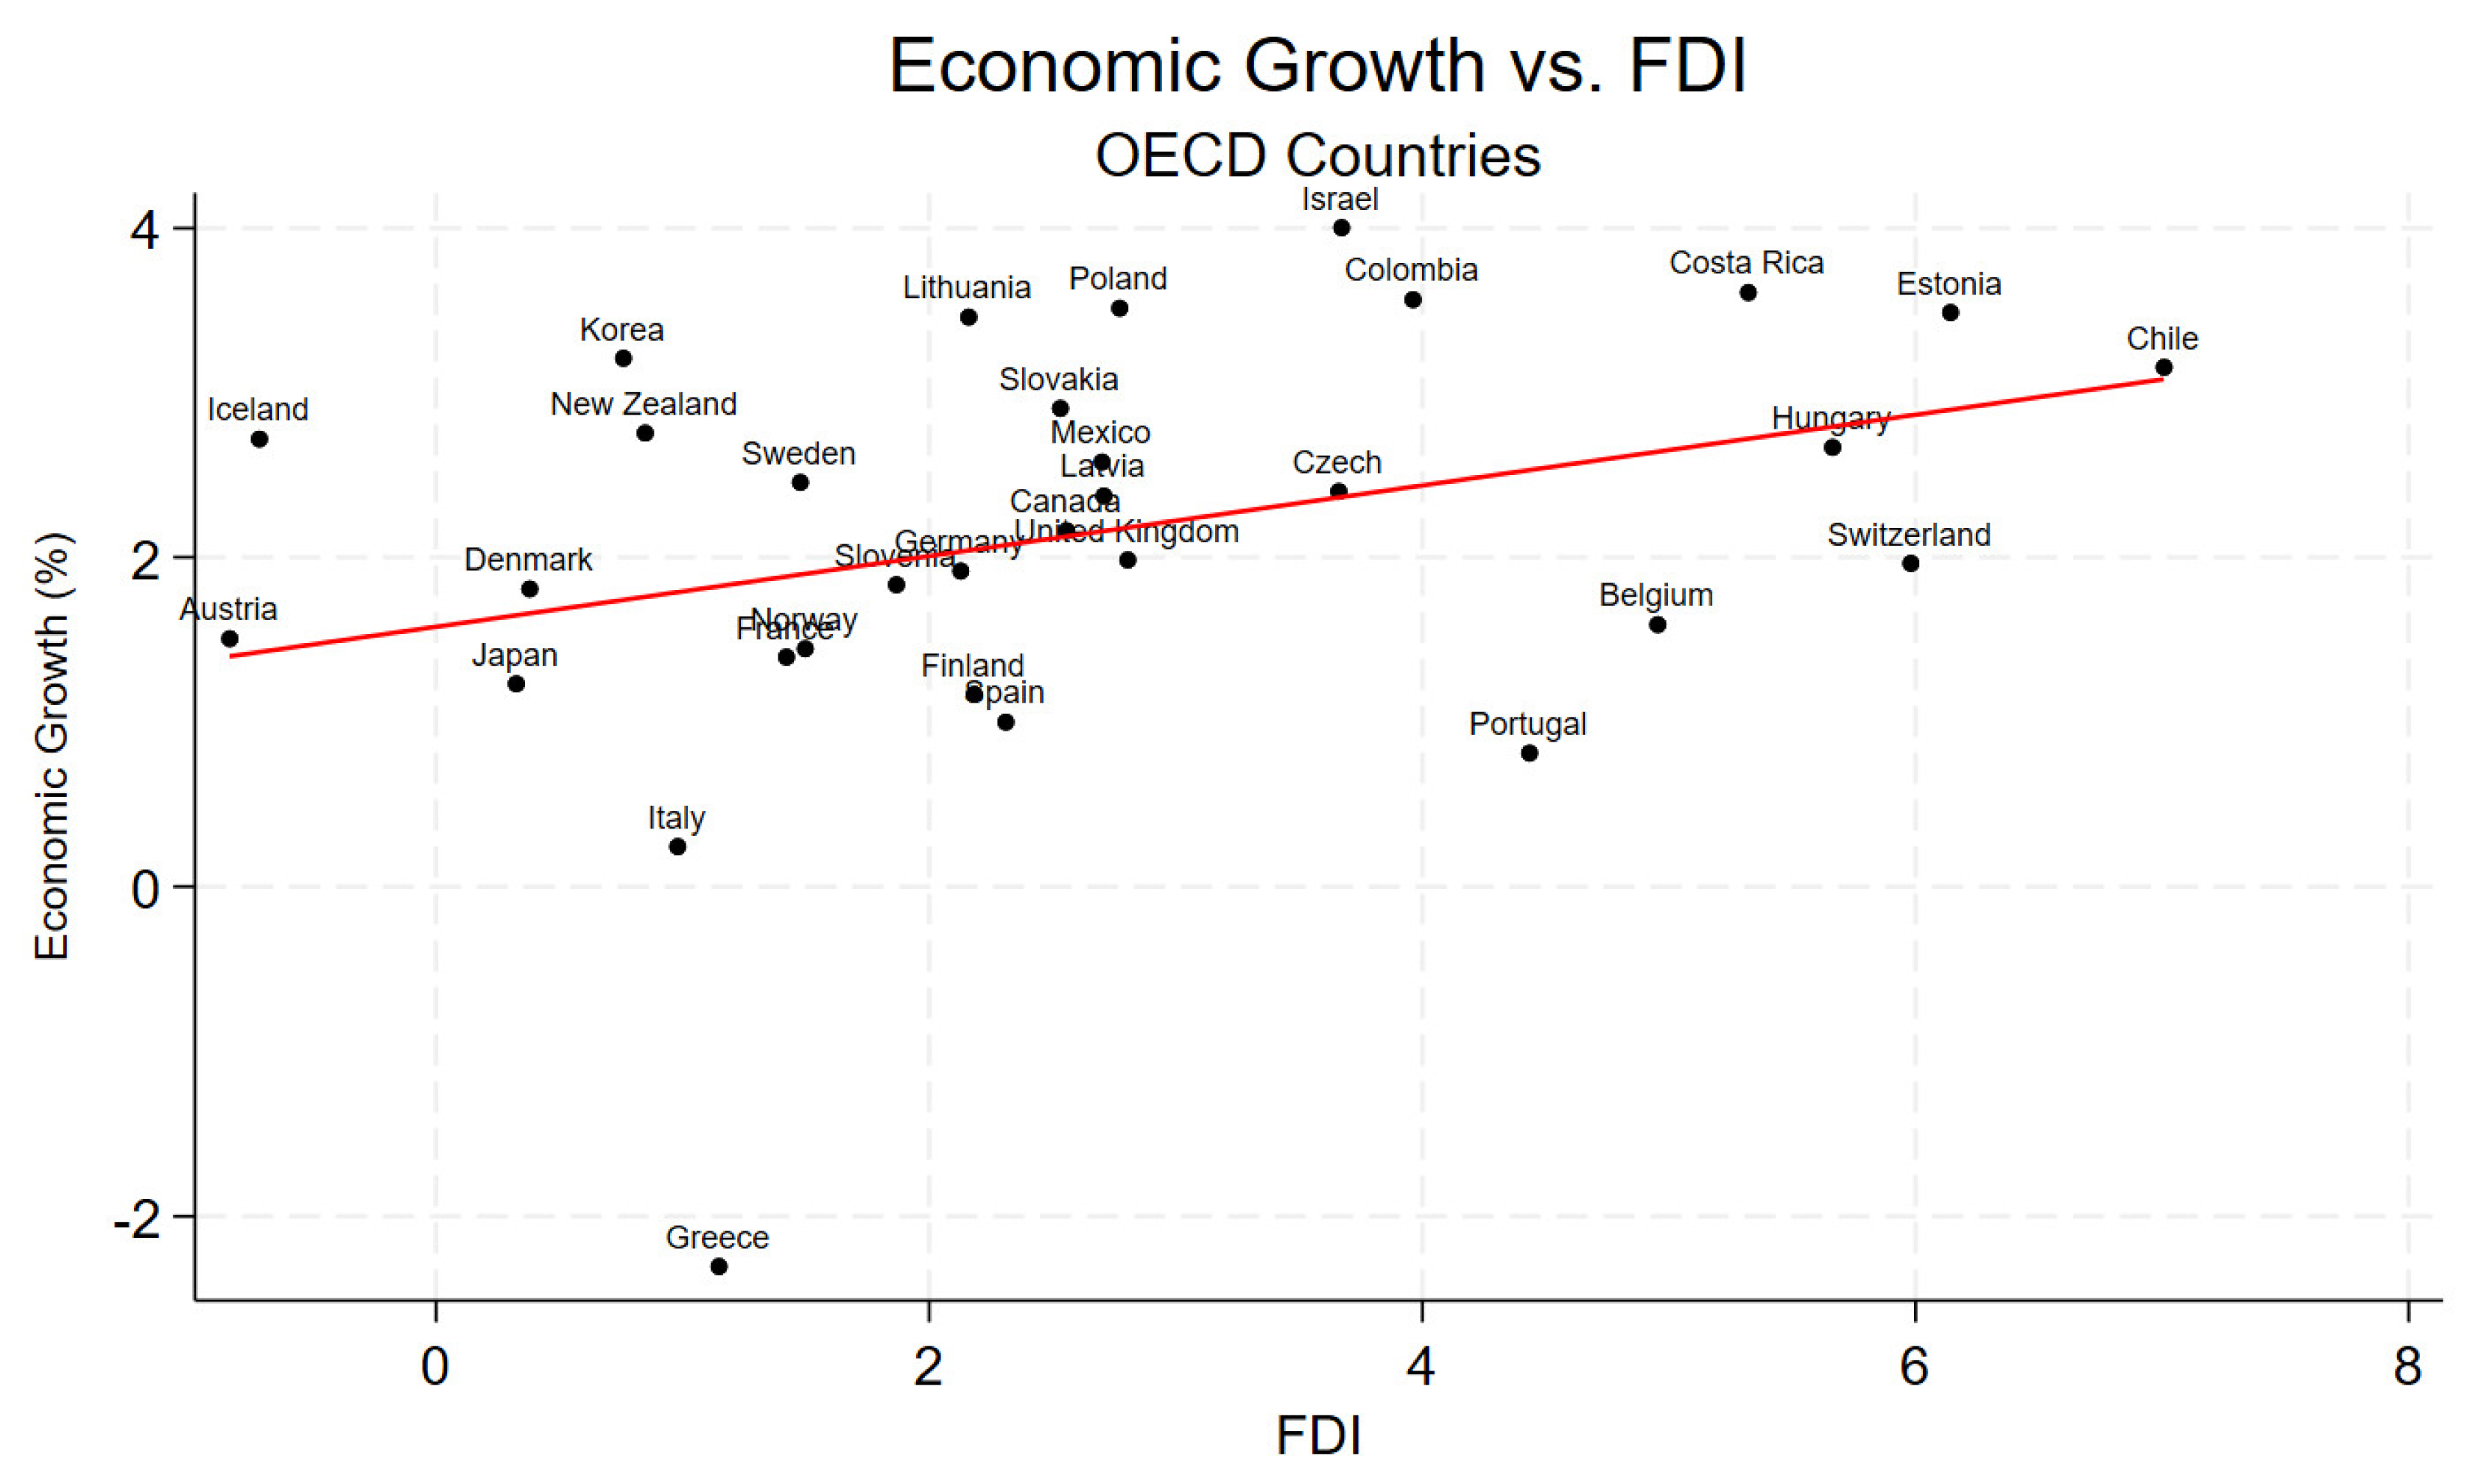
Figure 3.
a). b).
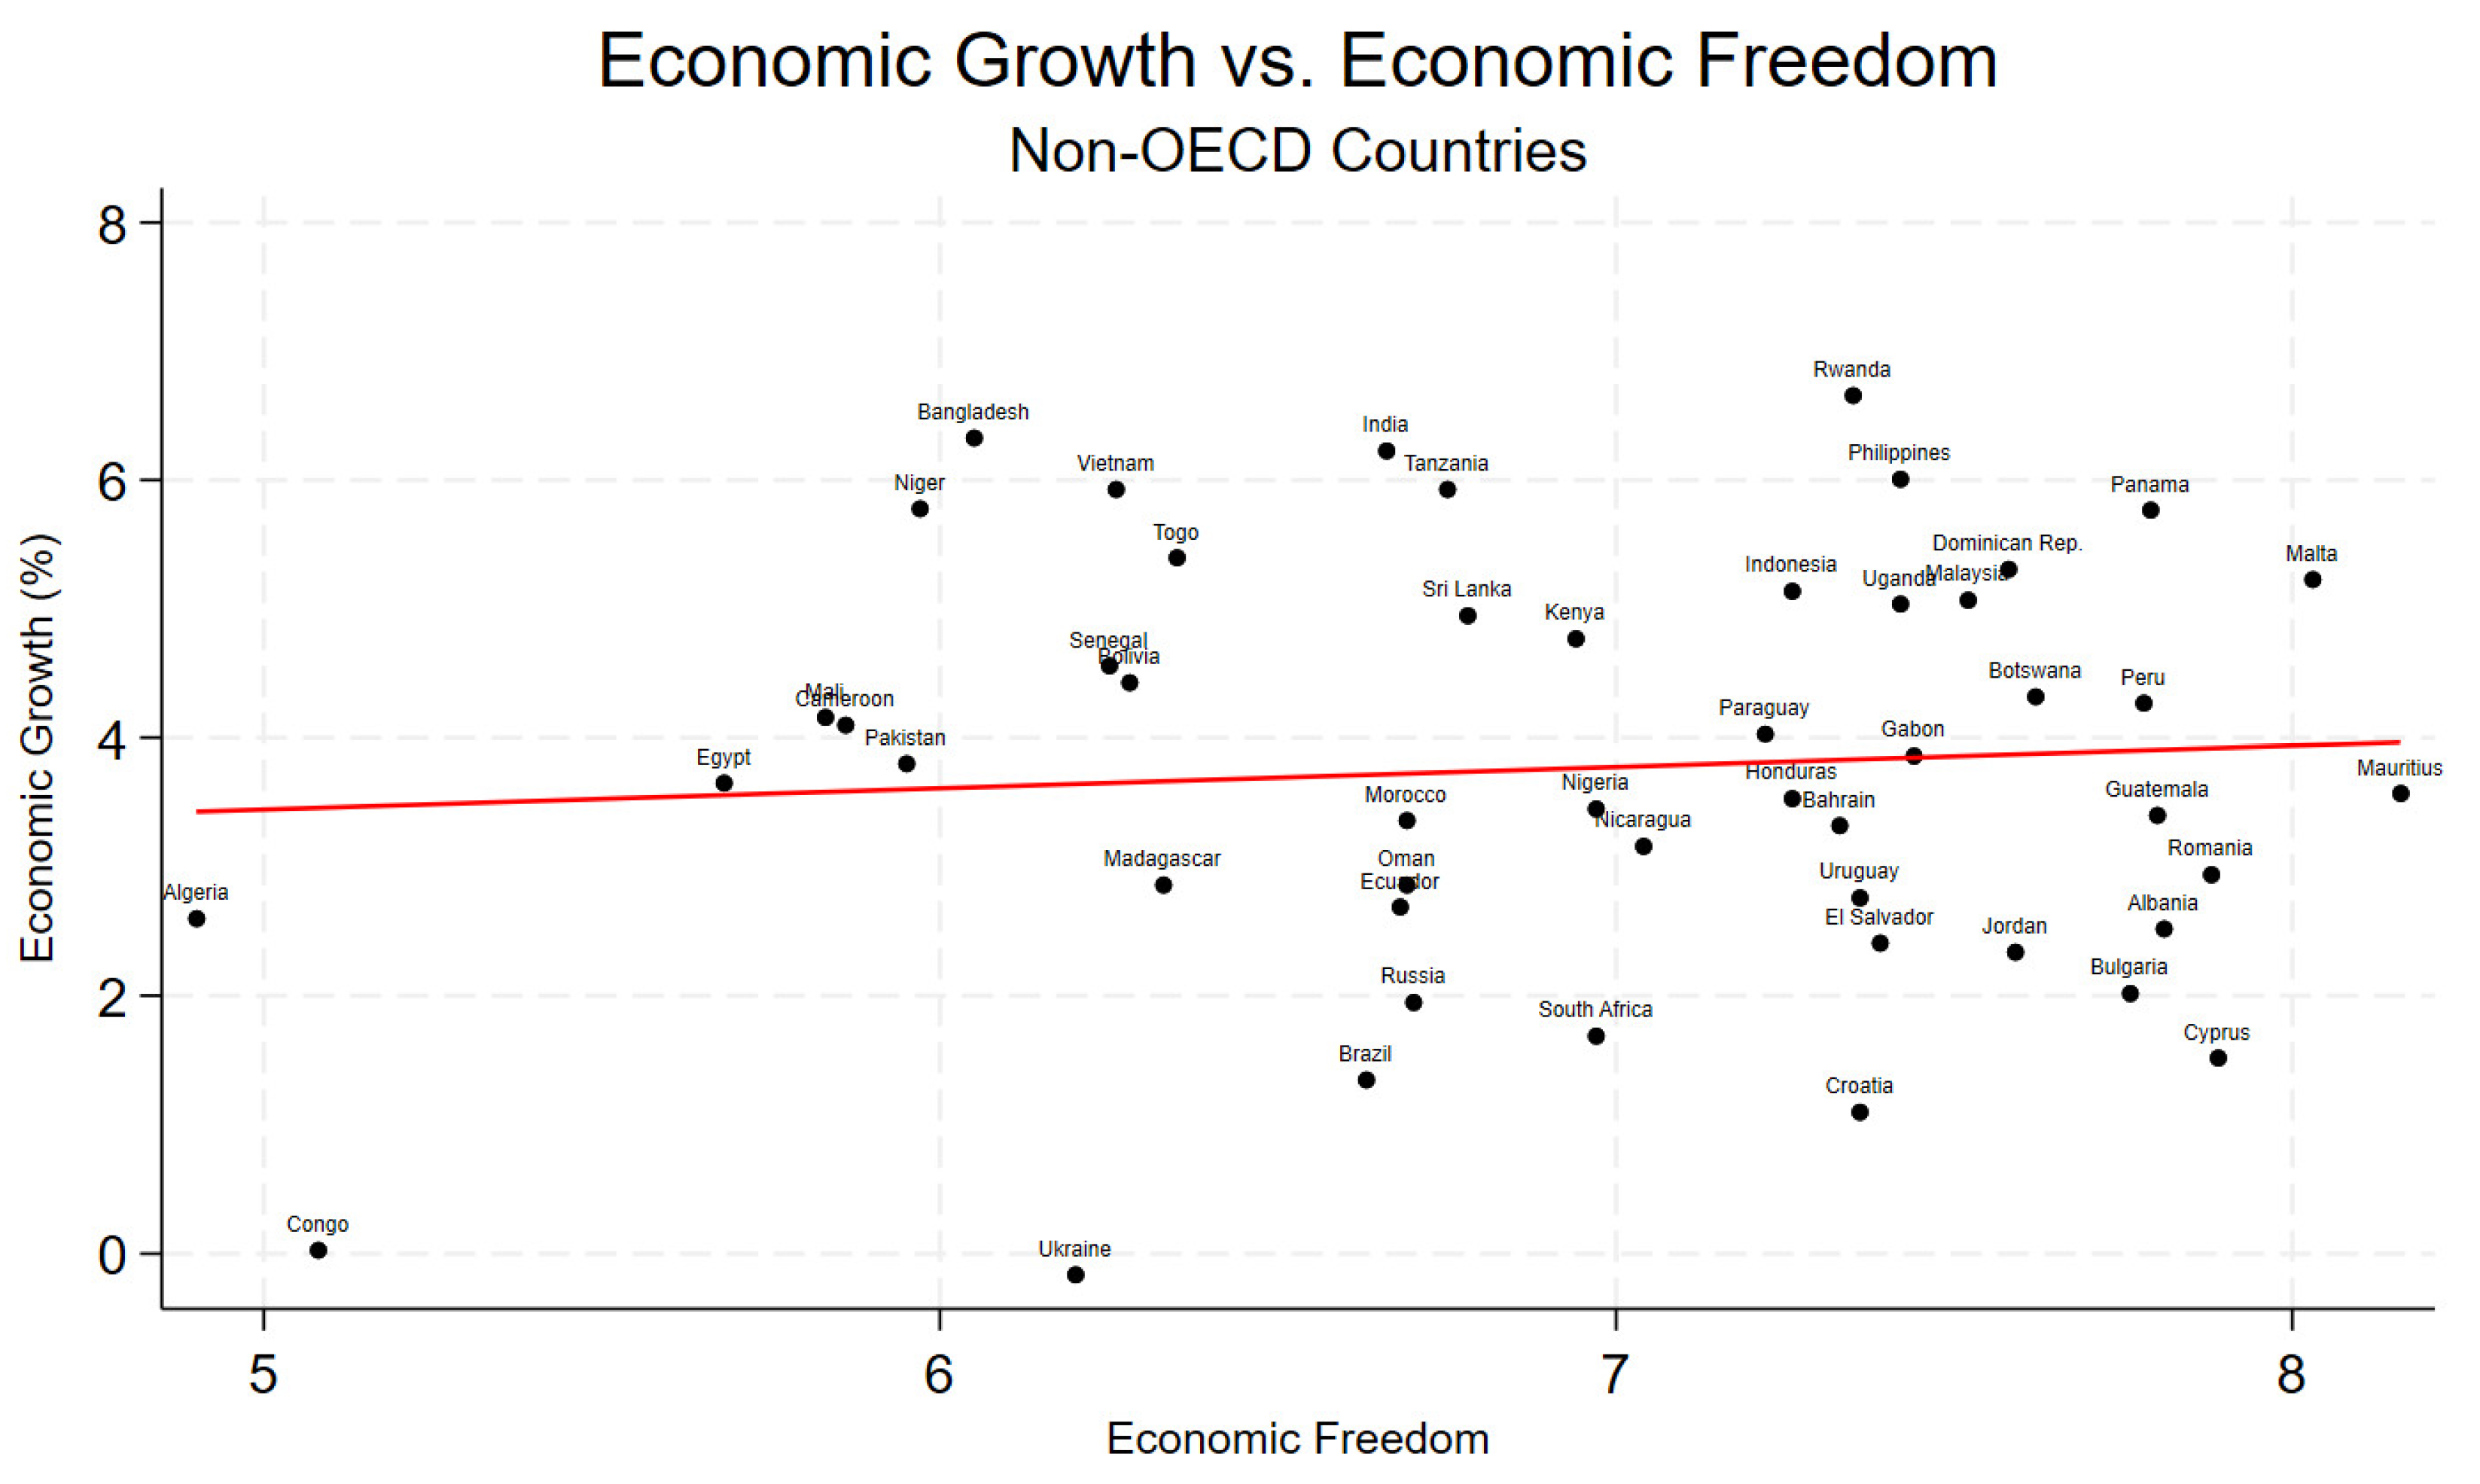
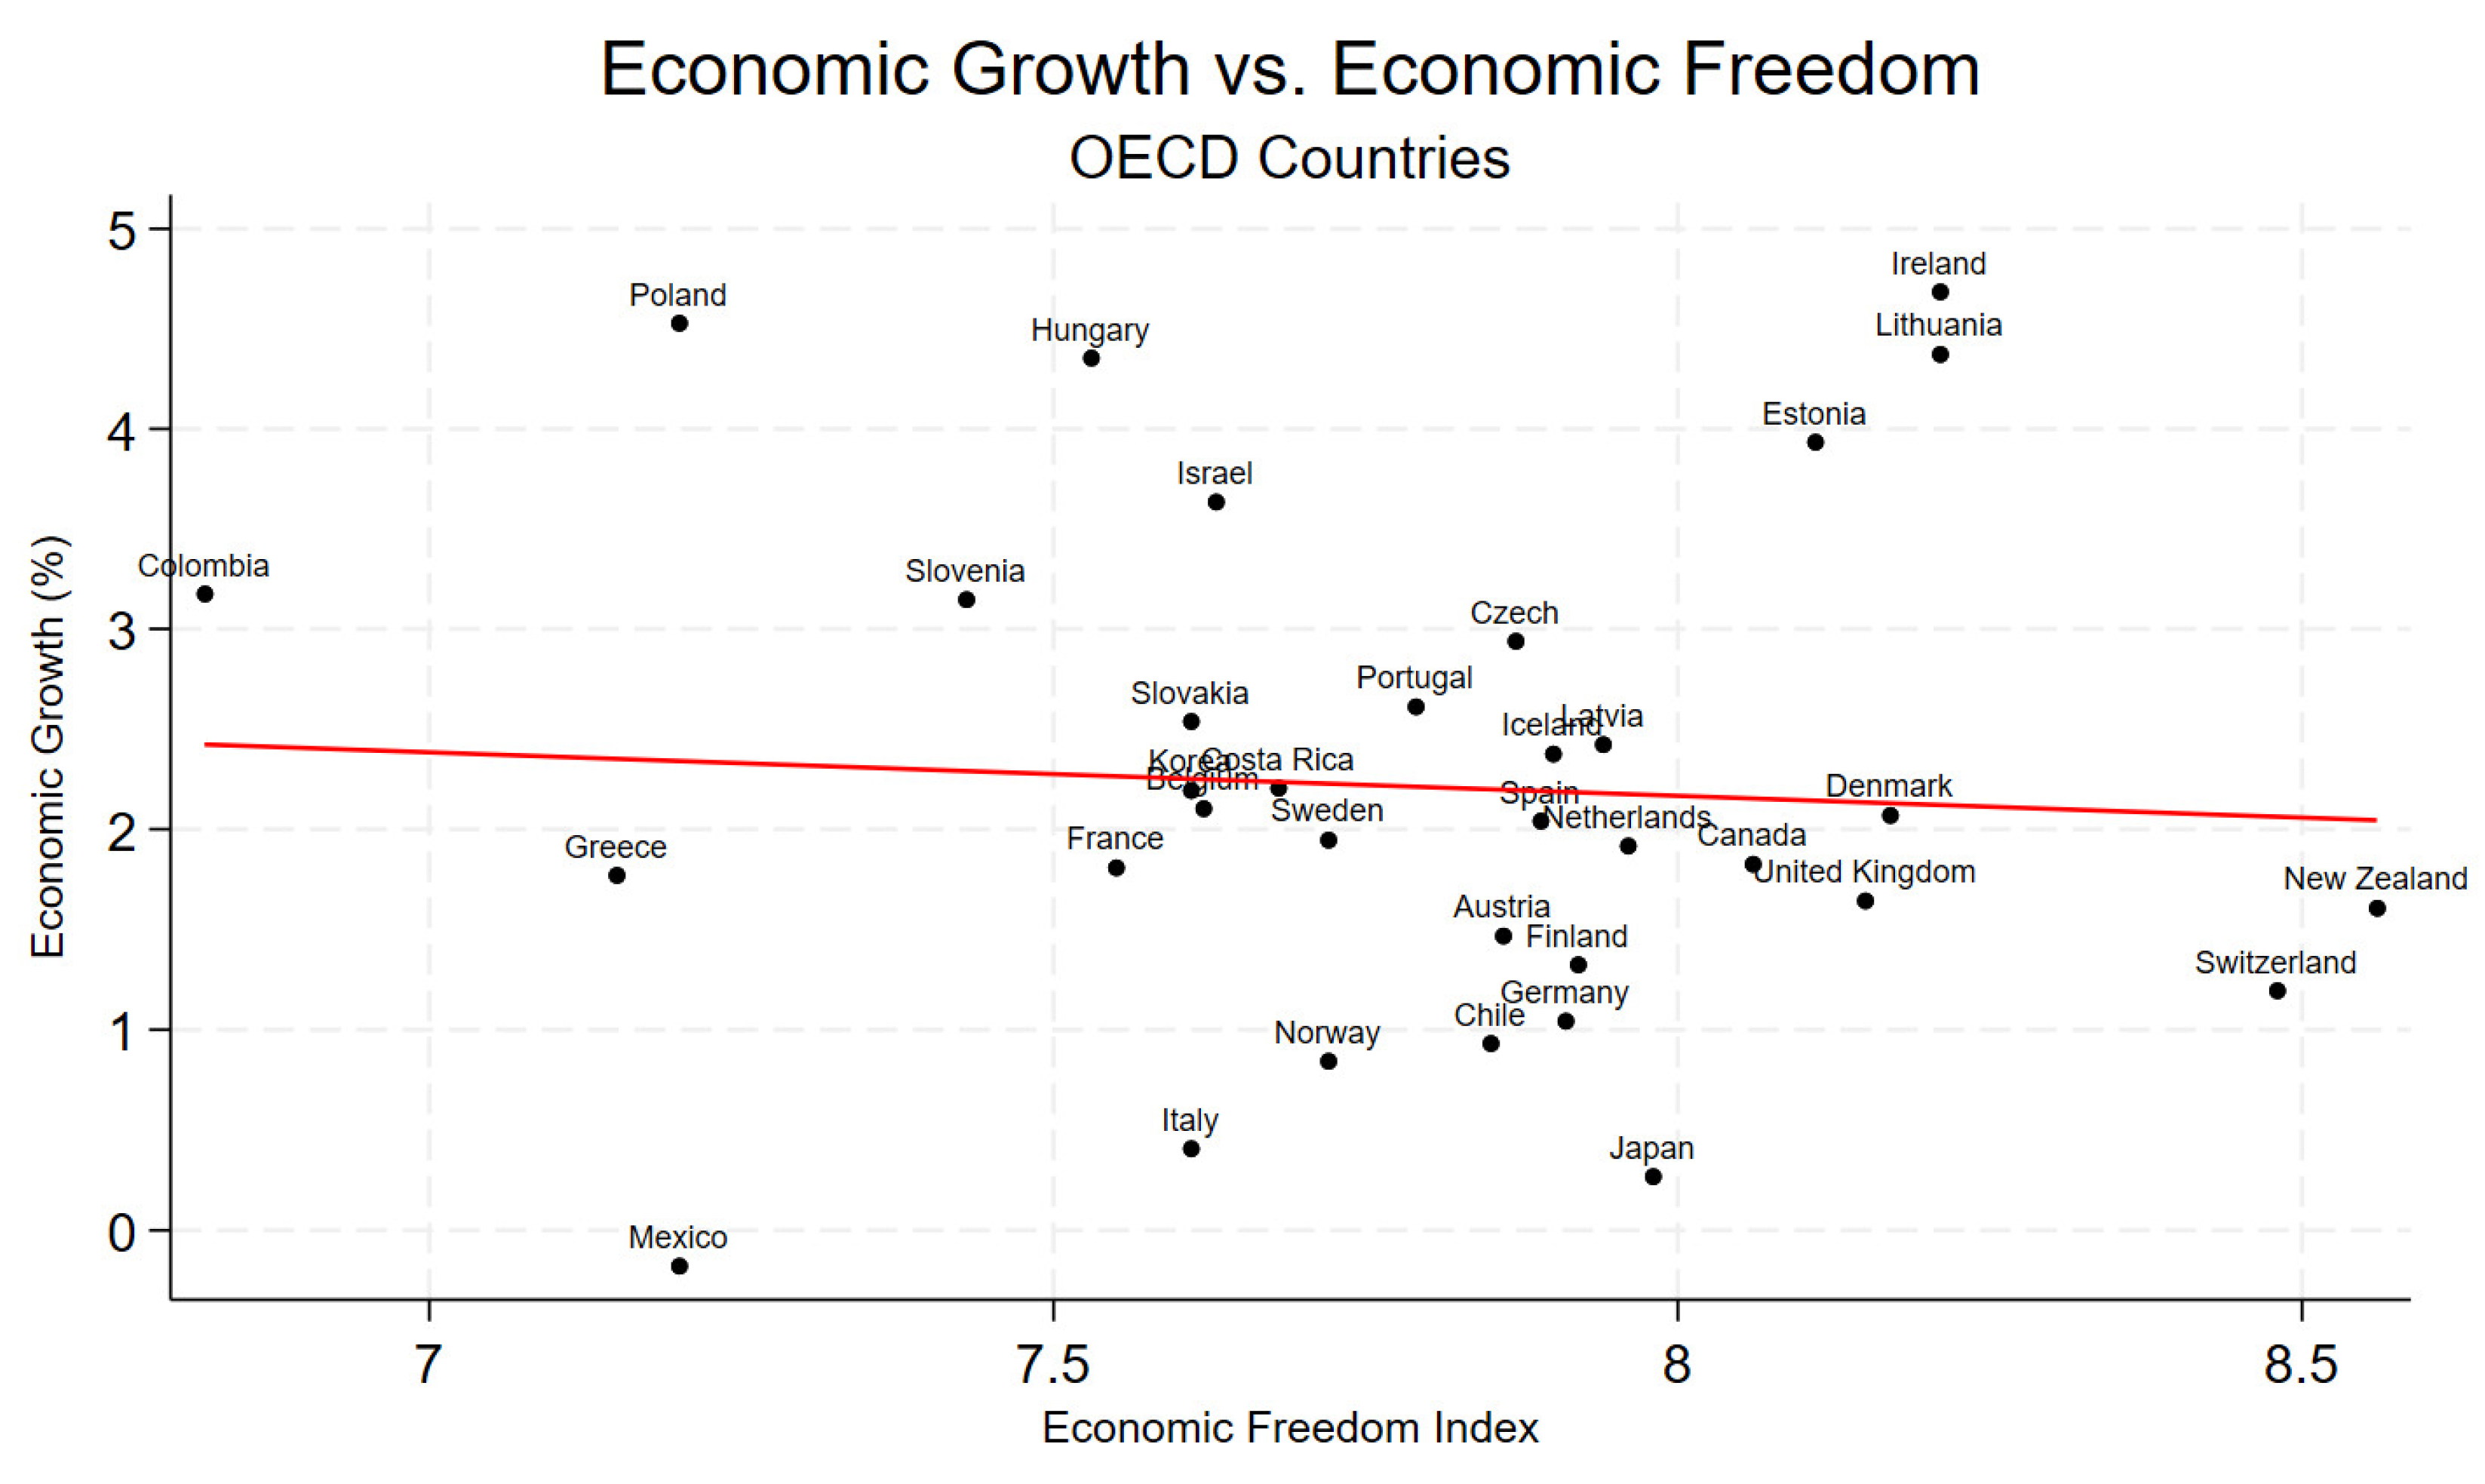
Table 3.
Preliminary Regression Results.
| Pooled OLS | Fixed Effect | Difference GMM | System GMM | |
|---|---|---|---|---|
| Lagged GDP (log) | 0.9992*** | 0.7452*** | 0.7614*** | 0.9966*** |
| (0.0010) | (0.0367) | (0.1448) | (0.0066) | |
| FDI as % of GDP | 0.0009** | 0.0014*** | 0.0012 | 0.0026** |
| (0.0004) | (0.0005) | (0.0008) | (0.0010) | |
| Economic Freedom (log) | 0.0676*** | 0.0443 | 0.0872 | 0.2238*** |
| (0.0255) | (0.0587) | (0.0748) | (0.0551) | |
| Capital Cumulation as % of GDP | 0.0010*** | 0.0015*** | 0.0014* | 0.0021** |
| (0.0003) | (0.0005) | (0.0008) | (0.0010) | |
| Population Growth | 0.0033*** | -0.0015 | 0.0007 | -0.0051 |
| (0.0012) | (0.0025) | (0.0005) | (0.0037) | |
| Labor Force Participation Rate (log) | -0.0018 | 0.1916*** | 0.1472 | -0.0797 |
| (0.0131) | (0.0724) | (0.2533) | (0.0562) | |
| Labor Productivity (log) | -0.0086*** | 0.2622*** | 0.1763 | -0.0308*** |
| (0.0018) | (0.0606) | (0.2529) | (0.0071) | |
| AR(1) test (p-value) | 0.041 | 0.007 | ||
| AR(2) test (p-value) | 0.146 | 0.182 | ||
| Hansen Test (p-value) | 0.132 | 0.177 | ||
| Number of Observations | 840 | 840 | 756 | 840 |
| Number of Countries | 84 | 84 | 84 | 84 |
| Number of Instruments | 67 | 74 | ||
| Notes: The dependent variable is the log of GDP. Robust standard errors are in parentheses. Time dummies are included in all the regressions (not reported). *, **, and *** indicate that the coefficients are significant at the 10, 5, and 1 percent levels. Column 3 reports the results of the two-step Arellano-bond (1991) difference GMM. Column 4 shows the results of the two-step Blundell and Bond (1998) system-GMM estimator with Windmeijer finite-sample correction. For both models, the instruments are the economic freedom index, population growth, and labor productivity. To avoid the problem of instrument proliferation and consequently overfitting of the endogenous explanatory variables, we collapse the number of instruments by dropping deeper lags as instruments (Roodman, 2009) | ||||
Table 4.
Regression Results with the Interaction Terms.
| (1) | (2) | |
|---|---|---|
| Lagged GDP (log) | 0.9976*** | 0.9974*** |
| (0.0046) | (0.0062) | |
| FDI as % of GDP | -0.0157* | -0.0158* |
| (0.0081) | (0.0086) | |
| Economic Freedom (log) | 0.1447* | 0.1403 |
| (0.0752) | (0.0869) | |
| Capital Cumulation as % of GDP | 0.0024*** | 0.0015* |
| (0.0009) | (0.0008) | |
| Population Growth | -0.0010 | 0.0016 |
| (0.0031) | (0.0040) | |
| Labor Force Participation Rate (log) | -0.0254 | -0.0391 |
| (0.0349) | (0.0418) | |
| Labor Productivity (log) | -0.0278*** | 0.0231*** |
| (0.0058) | (0.0074) | |
| FDI x LP | 0.0017** | |
| (0.0007) | ||
| FDI x EF | 0.089** | |
| (0.0043) | ||
| AR(1) Test (p-value) | 0.010 | 0.036 |
| AR(2) Test (p-value) | 0.103 | 0.148 |
| Hansen Test (p-value) | 0.153 | 0.099 |
| Number of Observations | 840 | 840 |
| Number of Countries | 84 | 84 |
| Number of Instruments | 53 | 66 |
| Notes: The dependent variable is the log of GDP. Robust standard errors are in parentheses. Time dummies are included in all the regressions (not reported). *, **, and *** indicate that the coefficients are significant at respective 10, 5, and 1 percent levels. Both columns report two-step Blundell and Bond (1998) system-GMM estimator with Windmeijer finite-sample correction. Labor force participation rate and population growth are regarded as exogenous; the other variables are treated as endogenous in the estimation and are instrumented with their lagged values. The number of instruments is collapsed by dropping deeper lags as instruments to avoid the problem of instrument proliferation and overfitting of the endogenous explanatory variables (Roodman, 2009) | ||
Disclaimer/Publisher’s Note: The statements, opinions and data contained in all publications are solely those of the individual author(s) and contributor(s) and not of MDPI and/or the editor(s). MDPI and/or the editor(s) disclaim responsibility for any injury to people or property resulting from any ideas, methods, instructions or products referred to in the content. |
© 2024 by the authors. Licensee MDPI, Basel, Switzerland. This article is an open access article distributed under the terms and conditions of the Creative Commons Attribution (CC BY) license (http://creativecommons.org/licenses/by/4.0/).
Copyright: This open access article is published under a Creative Commons CC BY 4.0 license, which permit the free download, distribution, and reuse, provided that the author and preprint are cited in any reuse.


