Submitted:
01 October 2024
Posted:
02 October 2024
You are already at the latest version
Abstract
Recent advances in technology have propelled Artificial Intelligence (AI) into a crucial role in everyday life, enhancing human performance through sophisticated models and algorithms. However, the focus on predictive accuracy has often resulted in opaque, black box models that lack transparency in decision-making. To address this issue, significant efforts have been made to develop explainable AI (XAI) systems that make outcomes comprehensible to users. Various approaches, including new concepts, models, and user interfaces, aim to improve explainability, build user trust, enhance satisfaction, and increase task performance. Evaluation research has emerged to define and measure the quality of these explanations, differentiating between formal evaluation methods and empirical approaches that utilize techniques from psychology and human-computer interaction. Despite the importance of empirical studies, evaluations remain underutilized, with literature reviews indicating a lack of rigorous evaluations from the user perspective. This review aims to guide researchers and practitioners in conducting effective empirical user-centered evaluations by analyzing several studies, categorizing their objectives, scope, and evaluation metrics, and offering an orientation map for research design and metric measurement.
Keywords:
AI transparency
; Explainable artificial intelligence (XAI)
; XAI evaluation procedure
; User-centered evaluation
1. Introduction
With the recent advances in technology, Artificial Intelligence (AI) has become a dynamic and thriving field of research. AI systems are now being used in many different settings beyond research labs, greatly impacting our daily lives. These systems can amplify, augment, and enhance human performance [1,2,3] by enhancing predictive performance through complex models and algorithms. However, a primary focus on prediction accuracy has left AI systems with black-box models, which provide non-transparent decision-making. To overcome these obstacles, considerable efforts have been made in recent years to implement explainable systems with an aim to make AI systems and their outcomes understandable to humans [4,5]. Various concepts, models, and user interfaces have been explored to improve explainability, predictability, and accountability, build user trust, enhance user satisfaction, increase task performance, and support decision-making [5,6,7,8].
The emerging field of evaluation research addresses the issue of what constitutes a good explanation and how its quality can be measured [3,9,10]. Two evaluation approaches can be distinguished: the formal evaluation approach [3], which uses formal methods, mathematical metrics, and computational simulations [11,12], and the empirical evaluation approach, which has gained popularity in recent years due to its focus on user impact. While formal evaluation demonstrates technical accuracy, it leaves open the question of whether the desired effects are achieved in practice. In contrast, the empirical approach adopts research methods, scales, and probing concepts from psychology and human-computer interaction [8,13,14,15]. Empirical studies evaluating explanations in AI are labor-intensive and require careful planning to ensure that they are rigorous and valid [16]. For example, in their literature review, Adadi et al. [17] noted that only 5% of papers conducted an empirical evaluation. Similarly, the literature review by Anjomshoae et al. [18] found that 32% of papers did no evaluation, 59% conducted only an informal user study, and only 9% performed thorough evaluations with well-defined metrics. In the most recent literature review, Nauta et al. [19] highlighted that 33% of the research was evaluated with anecdotal evidence, 58% applied quantitative evaluation, 22% evaluated human subjects in a user study, and 23% evaluated with domain experts, i.e., application-grounded evaluation.
The immaturity of the subject area is also reflected in the lack of literature reviews on empirical evaluation studies. While various surveys, such as [5,8,10,14,17,18,20], provide a sound overview of formal evaluations, empirical methodologies and procedures are only marginally discussed. Without a clear, systematic understanding of the different goals, methods, and procedures used in evaluating explanation systems, it is difficult to establish best practices, standards, and benchmarks.
The goal of this exploratory literature review is to inform and sensitize researchers and practitioners on how to conduct empirical evaluations effectively and rigorously. To achieve this, we analyzed the most relevant papers on XAI evaluation studies from prominent academic databases. Through this review, we aim to identify common patterns and recognize the essential elements that need to be considered when planning and conducting empirical evaluations of explanation systems. In our analysis, we categorized the objectives, scope, and evaluation metrics used in the studies. We also categorized the procedures and evaluation methods that were applied. This categorization provides an orientation map and guidance, e.g., showing which evaluation metrics align with specific objectives and which research designs are appropriate for measuring those metrics rigorously.
In this context, our work aims to address the following research questions:
- What are the common practices in terms of patterns and essential elements in empirical evaluations of AI explanations?
- What pitfalls, but also best practices, standards, and benchmarks should be established for empirical evaluations of AI explanations?
The remainder of this article is arranged as follows: In Section 2, we first give a brief overview of relevant concepts of XAI evaluation. After that, we present the findings of our literature survey. Section 3 describes three evaluation objectives we identified in the literature. Section 4 details the target domains and target groups addressed in the evaluation studies we analyzed. Section 5 presents the core of the article. It summarizes the various measurement constructs and how they were operationalized in the evaluation studies. Finally, we present the procedures used in user-centric XAI evaluation in Section 6. Section 7 discusses the literature survey regarding pitfalls and best practices for doing evaluation studies rigorously. A conclusion is given in Section 8.
2. Explainable Artificial Intelligence (XAI): Evaluation Theory
An evaluation presents a systematic process of measuring a well-defined quality of the AI system's explanation and assessing if and how well it meets the set objectives [10,14,21]. In the literature, three distinct evaluation approaches have emerged for the evaluation of explainable AI systems [15,22,23]:
- Functionality-grounded evaluations require no humans. Instead, objective evaluations are carried out using algorithmic metrics and formal definitions of interpretability to evaluate the quality of explanations.
- Application-grounded evaluations measure the quality of explanations by conducting experiments with end-users within an actual application.
- Human-grounded evaluation, which involves human subjects with less experience and measures general constructs with respect to explanations, such as understandability, trust, and usability on a simple task.
The first approach is theoretical in nature, focusing on conceptual frameworks and abstract principles. In contrast, the subsequent two approaches are empirical, involving study design, implementation, and interpretation of the study results. It is essential to adhere to rigorous standards of empirical research, ensuring the reliability, validity, and generalizability of the findings.
In this regard, measurement theory underscores that rigorous evaluation measures should consider three elements [24,25,26]:
- Evaluation Objective and Scope. Evaluation studies can have different scopes as well as different objectives, such as understanding a general concept or improving a specific application. Hence, the first step in planning an evaluation study should be defining the objective and scope, including a specification of the intended application domain and target group. Such a specification is also essential for assessing instrument validity, referring to the process of ensuring that an evaluation method will measure the constructs accurately, reliably, and consistently. The scope of validity indicates where the instrument has been validated and calibrated and where it will be measured effectively.
- Measurement Constructs and Metrics. Furthermore, it is important to specify what the measurement constructs of the study are and how they should be evaluated. In principle, measurement constructs could be any object, phenomenon, or property of interest that we seek to quantify. In user studies, they are typically theoretical constructs such as user satisfaction, user trust, or system intelligibility. Some constructs, such as task performance, can be directly measured. However, most constructs need to be operationalized through a set of measurable items. Operationalization includes selecting validated metrics and defining the measurement method. The method should describe the process of assigning a quantitative or qualitative value to a particular entity in a systematic way.
- Implementation and Procedure. Finally, the implementation of the study must be planned. This includes decisions about the study participants (e.g., members of the target group or proxy users) and recruitment methods (such as using a convenience sample, an online panel, or a sample representative of the target group/application domain). Additionally, one must consider whether a working system or a prototype should be evaluated and under which conditions (e.g. laboratory conditions or real-world settings). Furthermore, the data collection method should be specified. Generally, this can be categorized into observation, interviews, and surveys. Each method has its strengths, and the choice of method should align with the research objectives, scope, and nature of the constructs being measured.
In our literature review, we investigate how these elements of rigorous evaluation studies have been implemented to identify best practices, common challenges, and innovative approaches in the field. Analyzing the papers from this stance, we could identify various patterns and categories (see Table 1). For instance, regarding research objectives, we saw methodology-driven, concept-driven, and application-driven studies as common research genres. Regarding the evaluation scope, we saw that the studies address various application domains (such as healthcare, law/justice, finance, etc.), where both highly critical real-world and less critical, illustrative scenarios had been addressed. We also could identify different target group types, such as end users/affected persons, regulators/managers, and developers/engineers. Regarding the measurement, we uncovered three main areas, namely understandability, usability, and integrity. Assessing implementation and procedures, our analysis reveals that using proxy users recruited by an online panel was a common pattern. Lastly, we looked at the data collection methods employed, such as observations, interviews, and surveys, and how they aligned with the study objectives and constructs being measured.
We present our findings in detail in the following sections. This not only enhances our understanding of current methodologies but also contributes to guiding future research efforts for more effective and accurate evaluations in similar domains.
3. Evaluation Objectives
Evaluation studies are primarily defined by their objectives, which serve as guiding principles directing the focus, methodology, and scope of the research.
Regarding the evaluation objectives, our review uncovers three types of research. First, studies about evaluation methodologies focus on methodological issues and developing metrics to measure explainability effectively. Second, concept-driven research focuses on novel concepts, models, and interfaces to improve the systems’ explainability. Third, domain-driven research focuses on practical applications and specific domains to bridge the gap between theory and practice, showcasing how explainability functions in various domains.
Figure 1 highlights that the majority of the studies in our sample are concept-driven evaluations (69%), followed by methodological evaluations (24%) and domain-driven evaluations (7%).
3.1. Studies About Evaluation Methodologies
The first category focuses on methodological questions related to evaluating explainable systems. Studies in this category [14,15,36,37,38,42,46,47,48,51,63,65,66,68,74,76,78,79] are dedicated to developing effective, relevant, and reliable methods and approaches to understand, measure, and assess the explainability of such systems regarding well-specified goals.
In the following, we outline the various methodological oriented literature reflections in more detail. Hoffmann et al. [33]. They outline how procedures from scale development research and test theory can be used to specify evaluation metrics rigorously. They further investigate the evaluation methods for determining the effectiveness of explainable AI systems (XAI) in helping users understand, trust, and work with AI systems. Another good example is Holzinger et al. [42], which introduced the System Causality Scale (SCS) to measure the overall quality of explanations provided by explainable AI systems and illustrate the application of the SCS in the medical domain. Schmidt and Biessmann [51] propose a quantitative measure to assess the overall interpretability of methods explaining machine learning decision-making. They further propose a measure to assess the effect on trust as a desired outcome of explanations. Kim et al. [63] argue for standardized metrics and evaluation tasks to enable benchmarking across different explanation approaches. For this reason, they suggest two tasks (referred to as the confirmation task and the distinction task) to assess the utility of visual explanations in AI-assisted decision-making scenarios. Mohseni et al. [15] suggest a human attention benchmark for evaluating model saliency explanations in image and text domains. Naveed et al. [55] pinpoint that evaluations must be not only rigorous but also relevant concerning the particular use context where explanations are requested. For this reason, domain-agnostic measures should be supplemented with domain-specific metrics, which should be grounded in empirical qualitative pre-studies.
Various studies in this category are also based on literature reviews to understand and identify underlying concepts and methods to evaluate the XAI systems. For example, Lopes et al. [80] conducted a literature survey on human and computer-centered methods to evaluate systems and proposed a new taxonomy for XAI evaluation methods. Similarly, Rong et al. [29] explored user studies in XAI applications and proposed guidelines for designing user studies in XAI. Kong et al.
[81] conducted a literature survey to summarize the human-centered demand framework and XAI evaluation measures for validating the effect of XAI. The authors then presented a taxonomy of XAI methods for matching diverse human demands with appropriate XAI methods or tools in specific applications. Jin [78] conducted a critical examination of plausibility as a common XAI criterion and emphasized the need for explainability-specific evaluation objectives in XAI. Schoonderwoerd et al. [30] examined a case study on a human-centered design approach for AI-generated explanations in clinical decision support systems and developed design patterns for explanations. Weitz et al. [76] investigated end-user’s preferences for explanation styles and content for stress monitoring in mobile health apps and created user personas to guide human-centered XAI design.
Overall, the methodological-driven research explores various evaluation approaches to understand how well an explainable system made the behavior of an AI system interpretable and accountable. A central question of this research is how to quantify and objectively measure explainability. This often involves creating metrics and evaluation techniques that allow the assessment of explanation quality and facilitate comparisons between different explanation models. Researchers in this category also address the challenge of balancing explainability and performance since complex models may achieve better performance but can be less interpretable.
3.2. Concept-Driven Evaluation Studies
Most studies [15,27,28,29,30,32,33,34,35,36,37,38,39,40,41,42,44,45,49,50,53,54,55,56,58,59,60,66,67,68,69,70,71,76,77,82,83,84] in our sample are driven by the research on explanation models and their representation. The objective is to comprehend what constitutes a high-quality explanation that increases human cognition and decision-making.
The research in this category aims to investigate a common understanding of the explanation quality of existing XAI frameworks such as LIME or SHAP [63]. Often novel explanation concepts and approaches are evaluated, including example-based explanations (normative and comparative explanations) [48], consequence-oriented and contrastive explanations [82], question-answering pipelines [34,63], data-centric explanations [34], or argumentative explanations [60]. Also, design principles, such as the implementation of the right to explanation [41], or novel interface concepts, such as interactive explanations [49,85] have been evaluated in this kind of research.
To improve generalizability, most studies in this category carry out domain-independent evaluations using fictional and illustrative scenarios. The goal is to obtain insights into how various explanation models and features impact the overall functionality and effectiveness of explanation systems. To reduce confounding effects, these studies typically prefer experimental designs conducted under controlled conditions that abstract away from specific real-world contexts. Regarding the tension between rigor and relevance [86], the evaluation studies in this category often are methodologically sound yet lack ecological validity as often fictional and simplified tasks were used that were disconnected from real-world applications and did not involve real users.
3.3. Domain-Driven Evaluation Studies
The third category, domain-driven, focuses on applying explainability in specific domains or application areas. Studies in this category [32,49,56,61,62] address how to deploy explainable systems in real-world scenarios and practical applications, such as news recommendation systems [45], Facebook’s News Feed algorithm [53], deceptive review detection [29], diagnostic decision support systems for both laymen [47] and experts [79], explainable learning platforms [54], recommendation of scientific publications [59], and even applications concerning autonomous vehicles [69], music, and product recommendation systems [56].
In contrast to concept-oriented research, domain-oriented studies address the specific application context and emphasize the relevance of the evaluated factors within the particular application domain. By considering the intricacies and specifics of the application context, domain-based research aims to provide insights that are not only theoretically valuable but also practically applicable and useful in real-world scenarios. For this purpose, domain-independent explanation concepts such as "what-if" explanations or feature attribution are adapted for the respective use case, or new concepts are designed and implemented for the specific application [56]. Frequently, different explanatory approaches are also combined within a single application. They also tend to be more holistic than concept-driven studies. In domain-driven studies, users typically should not evaluate isolated explanation concepts; they are using applications where explanatory elements are embedded.
There are also a few ethnographically oriented studies, which focus less on what explainable systems do to users, and more on what users do with explainable systems. For example, Kaur et al. [28] investigate the usage and comprehension of interpretability tools (such as the Interpret ML implementation of GAMs and the SHAP Python package) by data scientists, identifying potential issues and misconceptions. Another instance is the study conducted by Alizadeh et al. [27], which examines the experiences of Instagram users affected by the platform's algorithmic block and their need for explanations regarding the decision-making process. Such studies are often less rigorous but possess the highest ecological validity as they do not assess the use of explainable systems under pre-defined tasks under artificial lab conditions.
4. Evaluation Scope
The evaluation scope is defined as the range within which an evaluation approach and metric has been developed, tested, and calibrated. In our literature review, the evaluation scope of the studies in our sample can be mainly defined by the target domain, the target group, and the test scenarios used in the evaluation. Figure 2 summarizes the identified evaluation scope of the studies in our sample.
4.1. Target Domain
The target domain is often categorized by sector-specific boundaries [87]. In the following, we summarize the various sectors addressed in our sample.
4.1.1. Healthcare
Various studies in our sample [42,47,58,65,76,88] have been conducted in the healthcare domain. This domain is characterized by life-critical decisions that can immediately impact human lives, necessitating the consideration of ethical, legal, and regulatory aspects. Therefore, both doctors and patients must be able to trust AI systems and understand the decisions they make.
Regarding this, Holzinger et al. [42] evaluated medical explanations to enhance clarity and trust for healthcare professionals. Schoonderwoerd et al. [65] evaluate the structuring and presentation of explanations within clinical decision support systems. Tsai et al. [58] evaluate to what extent explanations are making the AI diagnostic process more transparent for clinicians and patients. Weitz et al. [76] evaluate what kinds of explanations are preferred by healthcare providers and patients in clinical decision support systems. Van der Waa et al. [47] evaluate how explanations help diabetic patients better understand and manage their condition. Cabitza et al. [88] evaluate the explainable AI in the health domain by examining the usefulness and effectiveness of activation maps in aiding radiologists in detecting vertebral fractures.
4.1.2. Judiciary
Several studies [34,50,67,75,89,90] address legal decision-making processes related to granting bail to defendants, calculating reconviction risk, predicting recidivism and re-offending, or assessing the likelihood of violating pretrial release conditions. Since legal decisions involve acts of the state, it is crucial that these decisions are made on a legal basis, are fair and unbiased, and that the decision-making process is transparent and accountable. For this reason, explanations are pivotal for the societal acceptance of the use of AI systems in this field.
Regarding this, Dodge et al. [90] examine how explanations affect fairness judgments in AI models, while Harrison et al. [75] assess the impact of explanations on the perceived fairness of AI decisions. Anik and Bunt [34] focus on the transparency of machine learning systems by explaining the training data used. Alufaisan et al. [67] evaluate the impact of explainable AI in enhancing legal decision-making, while Liu et al. [50] evaluate the role of explanations in addressing the out-of-distribution problem in AI.
4.1.3. Finance Sector
The finance sector is another domain in our sample that has been extensively researched [14,48,55,67,70,72,91]. A characteristic of this domain is that everyone must make financial decisions in their daily lives, yet making investments is quite complex, and one wrong decision could have a significant impact on the financial well-being of a person [55]. As the average financial literacy of ordinary users might be pretty low, AI systems can significantly contribute in this context. However, they must be trustworthy, and the explanations must be understandable to laypersons with low financial expertise.
Regarding this, Chromik et al. [14] investigate how non-technical users interpret additive local explanations in loan application scenarios, while Schoeffer et al. [81] evaluate the role of explanations for automated decision systems (ADS) for loan approvals. Poursabzi et al. [48] evaluate the impact of explanations in a tool predicting apartment selling prices using existing property data. Other studies assessing the effect of explanations in predicting annual income based on socio-demographic factors [70] or utilizing the CENSUS dataset [67]. More recently, Naveed et al. [55] have investigated explanations for robo-advisors from a user perspective by identifying and understanding the user’s specific needs for explainability in the context of the financial domain.
4.1.4. E-Commerce
E-commerce was also a prominent sector in our sample, especially in relation to product recommendation systems
, [83,92,93]. Personalized product recommendation systems are ubiquitous nowadays, helping consumers find the right offers in a vast array of products. A wrong purchase may not have the same far-reaching consequences as those in financial investment, but it is still important for consumers to understand how product recommendation systems work and how trustworthy they are. Research in this domain shows that providing explanations can enhance the success of recommender systems in various ways. For instance, explanations can reveal the reasoning behind a recommendation [94], increase system acceptance by outlining the strengths and limitations of recommendations [95], help users make informed decisions [96], and facilitate advanced communication between the service provider and the user [97].
Regarding this, Naveed has evaluated various aspects of personal recommender systems. Naveed et al. [60] evaluated the perceived quality and satisfaction of argumentative explanations for product recommendations targeting intuitive thinkers. They also evaluated the transparency and the impact on richer interaction possibilities of explanations for digital camera recommendations. Naveed et al. [83,92,93] implemented an interactive feature-based explanation system and evaluated its impact on the overall system perception. Other studies have focused on different consumer domains to evaluate explanations. Bucina et al. [40] focus on evaluating explainable AI systems using food and nutrition-related tasks, where participants predict the fat content of meals based on AI-generated explanations.
4.1.7. Media Sector
Explainable recommender systems have also been studied with regard to media contexts, including news, movies, music, books, gaming, and art [29,30,31,39,53,56,71,73,98,99,100,101]. These systems have much in common with product recommendation systems, yet there is a significant difference. Mass and social media influence public opinion, inform societal norms, and play a crucial role in shaping individuals’ knowledge, attitudes, and values, and how individuals perceive and engage with political and social topics. Because of this, recommender systems are at risk of contributing to the formation of filter bubbles and the spread of disinformation and toxic content.
In this context, Rader et al. [53] and Liao et al. [45] delve into the explanation of news feed algorithms. Papenmeier et al. [44] examine tools designed for social media administrators to detect offensive language in Tweets. Carton et al. [60] analyze explanations concerning AI-supported detection of toxic social media posts. With regard to disinformation, Lai et al. [29] investigated deceptive practices in reviews, while Schmidt and Biessmann [51] and Bansal et al. [62] focused on explanations to support the sentiment classification of movie reviews. Millecamp et al. [39,56] evaluated explainable music recommendations regarding their impact on perceived usefulness, satisfaction, and engagement of end-users. In contrast, Kulesza et al. [31] evaluate the usefulness of explanations for “debugging” AI-generated playlist. Regarding film recommender systems, Ngo et al. [70] investigate the mental models of end users, while Kunkel et al. [73] evaluate different explanation styles regarding trust and satisfaction.
Empirical studies in this domain also show that users expressed concerns about the amount of information presented, as excessive details can lead to cognitive overload [102,103]. Moreover, research in gaming and art recommender areas has shown that users prefer prompt hints (explanations) with communicative and user-friendly interfaces [104,105].
4.1.8. Transportation Sector
The transportation sector is characterized by transportation systems that are quite complex, technical, and safety-critical, where the behavior of AI must be explained so that it is understandable to laypeople.
This sector was not very prominent in our sample [27,69]. One of the view studies was Colley et al. [69], which focused on using explanations in the context of highly automated vehicles. They used semantic segmentation visualization to assess the impact on user trust, situation awareness, and cognitive load by displaying the vehicle’s detection capabilities to the user. Alizadeh et al. [27] investigate people’s AI folk concepts to evaluate how individuals interact with AI technologies in mobility-related contexts.
4.1.5. Science and Education
Various studies in our sample addressed the science and educational sector [34,36,41,54,59,62,68], where explanations are studied in the context of learning and research, as well as knowledge assessment. A distinctive feature of this domain is that users are particularly interested in understanding issues and are often eager to learn something new. Therefore, explanations contribute not only to pragmatic goals but also align with the educational interests of the target audience.
Regarding this, Ooge et al. [54] evaluate the role of explanations concerning math exercise recommendations. Also, explanations are evaluated in entertainment settings such as decision-making games [68], or learning games [36]. Explanations are also evaluated to improve scientific literature recommender systems [59].
A more serious issue arises when AI systems are used to assess students' intelligence and abilities. Since such evaluations can have significant consequences for educational careers, these decisions must be correct, fair, and accountable. For this reason, several studies evaluate how explanations can influence the decision-making process in student admission [41] and student application recommendation [34], as well as using explanations for answering the Law School Admission Test (LSAT) [62].
4.1.6. AI Engineering
AI Engineering was also a prominent domain in our sample, where several evaluation studies have been conducted [15,28,37,38,46,52,61,74,77]. The characteristic of AI engineering is that the developed models are often complex and operate as "black boxes", which makes it difficult for developers to understand AI model behavior, identify errors in models and datasets quickly, and debug and optimize the models. For this reason, explainability elements have become essential tools for developers to debug and understand AI models. Unlike other domains, this field is distinguished by developers' high technical expertise, allowing them to comprehend intricate, technically detailed explanations.
In this regard, Kaur et al. [28], investigated how data scientists understand and utilize interpretability tools in their daily tasks. Dieber et al. [38] examined which representations benefit data scientists in making tabular models more interpretable. Jeyakumar et al. [74] investigated the AI engineer’s preferences for deep neural network explanation methods.
Numerous studies in our sample have evaluated how explanations contribute to data labeling task, such as providing explanations within annotation tools [15] or supporting the classification of handwritten digit images [61], artistic drawings [37], or images [77] and pictures [46] of objects and people. Additionally, [52] evaluated various visual explanation methods concerning their effectiveness in confirmation and distinction tasks within classification processes.
4.1.7. Domain-Agnostic
The survey of Islam et al. [87] shows that many XAI research is domain-agnostic, meaning they are not specifically designed and evaluated for a particular real-world application. This also holds for the evaluation studies in our sample. For this reason, domain-agnostic studies constitute a distinct category where the authors either do not specify a target domain or focus on domain-independent features [32,49,63,106]. Most domain-agnostic studies are either concept-driven or methodololgy-driven. For instance, Hoffman et al. [106] do not focus on any specific domain but reflect on evaluation methodologies in general. Various studies focus on universal evaluation concepts. For instance, Sukkerd [32] evaluates consequence-oriented, contrastive explanations. Kim et al. [63] investigate visual explanations for interpreting charts. Narayanan et al. [49] deliberately used alien scenarios in their evaluation study to abstract from a concrete domain.
This overview demonstrates that explanations are used across a wide range of domains, each with very different levels of severity: The potential harm in the domain of product recommender systems is relatively minimal, while using AI for legal decision-making can significantly affect individual liberty. Additionally, requirements are quite different: Explanations for movie recommendations, for instance, can be reviewed at leisure, whereas in the transport sector, explanations need to be understood in real-time. The target audience can vary greatly not only between domains but also within the same domain. For instance, in the medical field, the level of domain knowledge significantly affects whether the explanations are intended for doctors or patients. The last issue underscores the importance of explicitly defining the target audience in evaluation studies.
4.2. Target Group
A target group is defined as the intended people who will be affected by an AI system or make use of the explanation provided. The target group presents a key issue for the scope of explanation systems because the significance and relevance of explanations are highly dependent on their intended audience [107,108,109].
4.2.1. Expertise
The target group is characterized, among other factors, by their level of expertise. Mohseni et al. [108], for instance, distinguish three levels of expertise: high, medium, and low. High expertise is attributed to individuals with advanced knowledge of AI theory and the technical aspects of machine learning algorithms. Medium expertise describes those who may lack theoretical knowledge but possess an understanding of machine learning concepts sufficient for data exploration and visual analytics. Low expertise refers to individuals with minimal or no knowledge in both theoretical and practical aspects of machine learning [107,108,109].
In our sample, the level of expertise is rarely explicitly considered in the evaluation studies. An exception is the study by Ngo et al. [30], Anik et al. [34], or Schoeffer et al. [72], which distinctly differentiates between users with high and low levels of technical knowledge and AI literacy. More commonly, the target group is characterized based on their role.
4.2.2. Role
Target groups can also be defined by stakeholders' roles within the AI system's lifecycle. Meske et al. [107], for instance, distinguish roles within the lifecycle of designing, operating, and using AI systems.
AI engineers and data scientists play the most prominent role in the design phase. They must understand the data, models, and algorithms affecting the system's performance. Explanation systems are essential here to improve algorithm performance and facilitate debugging, testing, and model verification [107].
In the using phase, we can distinguish between the end-users of the system and the people affected by the systems’ decision-making. Regarding their expertise, we can further differentiate between professional and lay users. In both cases, explanations can contribute to the users’ satisfaction, trust building, task performance, and system understanding [27,107,110].
A typical scenario is that end-users of AI systems are professionals such as doctors, judges, or financial advisors, while the individuals indirectly affected by these decisions are laypersons, such as patients, defendants, or bank clients. These affected individuals have a right to explanations to validate decisions, assess their fairness, and provide grounds for objection [27,107,110]. Furthermore, the EU’s AI Act stipulates that these explanations should be conveyed in a language comprehensible to the average person, not solely to technical experts 1.
Administrators, managers, and regulators are typical stakeholders in the operation of AI systems. These stakeholders play a crucial role in ensuring the system functions correctly and adheres to corporate policies, regulations, and legal requirements. Explanations should help these stakeholders monitor, operate, and audit these systems [107]. The general public constitutes another significant stakeholder group, particularly in the context of socially relevant systems such as mass media, the legal process, and the democratic process. This is especially true regarding social values and ethical principles, such as fairness, impartiality, and public welfare [111].
Even though specifying the target group is essential for a rigorous evaluation, in our sample, the roles or stakeholders targeted by the system were often not explicitly defined. In such cases, we tried to infer the expertise and roles of the target group from the study context.
4.2.3. Lay Persons
Lay persons are individuals who do not have specialized knowledge or professional expertise in a particular field or subject. In our sample, the target group of lay persons spans a wide range of areas, from mass-market domains such as movie or song recommendations [30,31,39,56,73], news recommendation systems [45,53], product recommendations [51,60,92,93], finance applications [55], and driver assist systems [69], to more specific groups of patients [47,58], students or researchers [54,59] and individuals affected by service bans [27].
Also, the study by Dominguez et al. [37], which focuses on artwork recommendation, the one by Cai et al. [46], which focuses on a drawing scenario, and the one by Buçinca et al. [40], which focuses on a nutrition scenario, all appear to consider the lay user, too. In other cases, identifying the target audience from the context is more challenging, as the evaluation scenarios are primarily illustrative in nature.
4.2.4. Professionals
Professionals are individuals who possess specialized knowledge or expertise in a particular field or subject, often gained through formal education, training, and experience. In our sample, professionals are typically targeted with regard to the healthcare sector (such as doctors, nurses, paramedics, and emergency services providers) [42,79,88] or the engineering section, including data professionals, data scientists, AI engineers, data annotators, or data categorization specialists [28,38,61,74]. Here, a notable study is the one by Kaur et al. [28], which explicitly addresses data scientists as the target group. In most cases, the target group is only implicitly defined by the context of the studies, such as Dieber et al. [38] focusing on XAI frameworks like LIME, Jeyakumar et al. [74] on the comprehensibility of deep neural networks, Sukkerd [32] on AI-based navigation planning, Ford & Keane [61] on labeling handwritten digits, and Kim et al. [52] on classification tasks.
In many cases, it is not clear from the context whether the target group of a study is laypersons or professionals. For instance, a series of studies have investigated the effects of explanations about data classification, such as sentiment analysis of online reviews [51,62], online reviews [50], toxic posts, and hate speech [44,71]. From the context of these studies, however, it is unclear whether they are addressing professional content mediators/data analysts or lay users affected by online reviews and social media posts.
The same ambiguity is also present in studies concerning the use of Explainable Artificial Intelligence (XAI) in automated decision-making [29,41,67,75,89,90]. Since the target group is not explicitly defined, it's uncertain whether the explanations are intended for individuals affected by these decisions, professionals such as judges, psychiatrists, or jurors who are making them, or other stakeholders such as the general public. This uncertainty also holds for studies in our sample, which focused on application areas such as processing loan applications [14], making real estate transactions [48], making income predictions [70], interpreting graphs or charts [63], or making university admissions decisions [41]. In these cases, too, it remains unclear from the context whether the explanations are aimed at the decision-makers or at the individuals who are affected by these decisions.
This ambiguity is particularly prevalent in concept-driven studies, where a specific usage scenario is either absent, only briefly described, or very generally defined [5,15,33,34,36,49,52,66,68,77]. In such cases, it is not possible for us to define the target group more precisely. As a result, the ecological validity of the effects measured in these studies remains uncertain.
4.3. Test Scenarios
- The evaluation scope also relies on the test scenarios used for the evaluation, their relevancy, and their ecological validity. Concerning this, our sample includes two types of test scenarios: those with significant real-world impact and those that serve an illustrative purpose using toy scenarios [8].
4.3.1. Real-World Scenarios with Highly Critical Impact
The category of real-world scenarios addresses test scenarios, which adress real-world cases where AI decisions significantly affect individuals or carry a high risk of substantial impact on the lives of individuals, groups, or society. These are domains where the stakes of AI decisions are high, necessitating rigorous and reliable explanation systems.
Many of the domain-driven studies, such as [27,28,29,30,41,45,47,53,54,59,69,73], , fall into this category. These studies typically place a high emphasis on the ecological validity of their research. Various studies investigate the actual explanation needs of affected people and/or the usage of explanatory systems in practice [27,28,30,55,79]. There is also a strong emphasis on creating evaluation scenarios that reflect the real-world setting of the domain as closely as possible [29,47,54,59,69,75].
, there are also various concept-oriented studies. These studies are less focused on specific application domains but rather on generic explanatory concepts and their impact on users. The use of real-world scenarios in these studies, however, helps to demonstrate the research's relevance and evaluate the concepts by using scenarios that are meaningful for the participants. The same applies to methodological studies [42,48,58], where the focus is on how explainability can be evaluated and what appropriate measurements and procedures are. In these cases, real-world scenarios are also used to illustrate general considerations or to validate the developed measurement methods through specific application cases.
Real-world scenarios frequently focus on the healthcare [42,47,58,88], and judicial sector [34,50,67,75,89,90] where mistakes in decisions can have a significant impact on individuals' lives. To a lesser extent, this also applies to the financial sector [14,48,55,67,70,72,91], where the denial of a loan or a poor investment in houses, stocks, or other financial products can have significant repercussions. Other real-world scenarios address the denial of access to educational institutions, such as universities [41], as well as essential digital services, which can have a significant impact on an individual's life. Other real-world scenarios address news recommendation algorithms, which can harm the spread of fake news and the formation of filter bubbles [53].
4.3.2. Illustrative Scenarios with Less Critical Impact
This category encompasses domains or evaluation scenarios where AI decisions have minor impacts or researchers envision simple scenarios to illustrate an approach and the explanations produced [8].
A common method in this category is to isolate the explanation mechanism from specific contexts to better understand its fundamental properties and impacts. For example, Kim et al. [52], Fügener et al. [77], and Mohseni et al. [15] utilized generic image classification scenarios to evaluate various explanation methods. Ford & Keane [61] used the labeling of handwritten digits in a decontextualized evaluation scenario. Similarly, Jeyakumar et al. [74] presented various explanation methods for text, images, audio, and sensor data in a non-contextualized manner to determine user preferences for these methods. Kim et al. [63] explore the role of explanations in a decontextualized setting where participants were asked to interpret and respond to questions about charts and tables. There are also cases where no specific domains are addressed, or evaluation scenarios are not well specified. Hoffmann et al. [33] focus on theoretical criteria for evaluation studies, not on empirical research.
An additional approach is to use toy examples and fictitious scenarios. To prevent confounding effects and avoid triggering everyday habits, biases, and established preferences, these scenarios are intentionally designed to be distinct from familiar environments and real-world applications. Buçinca et al. [40], for instance, employ proxy, artificial tasks such as predicting the AI's decision-making regarding the percentage of fat content in a plate. Narayanan et al. [49] define an alien food preference and an alien medicine treatment scenario for their evaluation study. Sukkerd [32] and Paleja et al. [66] designed fictive robot scenarios for their evaluation study. Schaffer et al. [68] use a scenario based on the Diner's Dilemma, where several diners eat out at a restaurant and agree to split the bill equally over an unspecified number of days.
All these studies allow for the examination of explanation methods in a controlled, non-realistic task. Using fictitious application scenarios in evaluations aids in engaging participants and facilitating their understanding of the context. Yet, detaching the evaluation from real-world scenarios comes with a trade-off that reduces the ecological validity of the results.
Another approach is to adapt familiar contexts to enhance the participants' understanding and engagement with the abstract concepts being evaluated. Guo et al. [36] is an example of this approach, evaluating explanation concepts with the help of the well-known Tic-Tac-Toe game. In a similar vein, Dominguez et al. [37] used an art recommendation scenario, and Cai et al. [46] used the widely known QuickDraw platform for this purpose. Bansal et al. [62] and Schmidt and Biessmann [51] utilized a sentiment labeling task for online movie reviews as a familiar context to many internet users to evaluate explanation systems. Anik et al. [34] evaluate their data-centric explanatory approach using four decontextualized but familiar scenarios: predictive bail decisions, facial expression recognition, automatic approval decisions, and automatic speech recognition. Similarly, Alufaisan et al. [67] use a repeat offender scenario for their evaluation, Carton et al. [71] use the toxicity of social media posts, while Chromik et al. [14] use the default risk assessment scenario for credit applications. Naveed [51,60] uses a common, but fictional online shopping scenario to evaluate explanations for finding appropriate digital cameras.
Overall, the approach of using fictional and toy examples minimizes the complexity inherent in real-world settings and reduces potential confounding variables, thereby facilitating a clearer understanding of the general effects of explanatory systems. However, it leaves unanswered questions about how these systems are utilized in everyday life and what domain- and context-specific effects might occur. This gap highlights the need to complement domain-independent, illustrative evaluation studies with domain-specific real-world research. This research should evaluate the adoption and impact of these systems in everyday life contexts to fully understand the complexities of how people make use of explanations for their specific problems at hand.
5. Evaluation Measures
Evaluation approaches in XAI studies can be broadly divided into two groups: human-grounded evaluation, which involves human subjects and measures constructs such as user satisfaction, trust, and mental models, etc. In contrast, functionality-grounded evaluation measures require no human-subjects; instead, it uses a formal definition of interpretability as a proxy to evaluate the explanation quality [15,16,19].
In XAI evaluation studies, measurement constructs are well-defined theoretical concepts or variables that researchers aim to quantify and measure to assess the effectiveness of XAI systems [25,26]. Epistemologically, the measurement constructs are defined by both the subject matter and the theoretic concepts about it, as well as by the intended evaluation goals
Various taxonomies for human-grounded XAI evaluation measures have been established and researched [80,81,108,112]. According to these taxonomies, evaluation measures are mainly divided into four categories i.e., Trust, Usability, Understandability, and Human-AI task performance. Each category corresponds to the evaluation of specific XAI constructs from the human perspective derived from existing literature from several research areas [15,106,113]. However, based on our selected literature sample, we categorized the XAI constructs into the following categories as shown in Table 2.
In the following sub-sections, we focus on these qualitative and quantitative measures:
5.1. Understandability
Understandability refers to the quality of explanations being understandable, clear, intelligible, and easy to comprehend. It is also usually defined by the user’s mental model of the system and its underlying functionality [80,114]. In the context of XAI, the rationale behind evaluating understandability is to examine whether explanations facilitated the user’s understanding of the system-related aspects [115].
Understandability is a complex theoretical construct encompassing multiple dimensions and is influenced by various factors. Consequently, it can be evaluated from different perspectives and operationalized differently. In our literature review, we identified three approaches that are not mutually exclusive: evaluating the user’s perceived understanding, evaluating the user's mental model, and evaluating the user’s model output prediction.
5.1.1 Mental Model
The goal of XAI is not to provide text or visualization on a computer screen but to form a mental model of why and how an AI system reaches its conclusions. Cognitive psychology defines a mental model as a representation of how a person understands certain events, processes, or systems [214] or as a representation of the user's mental state in a particular context. In this regard, the design of explanation’s structure, types, and representation should contribute to user understanding and create more precise mental models [116].
In our literature review, Hoffmann et al. [33] mainly dealt with mental models on a theoretical and methodological level. Following them, a mental model reflects how a person interprets and understands an AI system's functioning, processes, and decision-making [33]. The authors emphasize that clear and accurate mental models help users comprehend why the system makes certain decisions [33]. Conversely, inadequate or flawed mental models can lead to misunderstandings and incorrect decisions [33].
In addition to these theoretical considerations, Hoffman et al. [33] discuss the methodological challenges in empirically eliciting and analyzing mental models. They underscore that "there is a consensus that mental models can be inferred from empirical evidence" [33] and concerning this, they outline various methods to capture and analyze users' mental models systematically, such as think-aloud protocols, structured interviews, retrospective task reflection, concept mapping, prediction tasks, and glitch detection tasks. These methods aim to uncover the users' mental models qualitatively by reconstructing them from people's expressions and descriptions of their understanding of the system verbally in interviews or visually through concept mapping. In addition, methods like prediction tasks or glitch detection tasks can be used to quantitatively assess how well the users' mental models align with the AI system's actual functioning and identify where misunderstandings or misconceptions may exist. In terms of performance, the mental models must not be perfectly accurate or entirely correct; it is enough if they are sufficiently robust to inform user behavior and be effective in practice.
Only a few works in our sample explicitly refer to mental models and how people interpret the system qualitatively [14,27,30,31,34]. For instance, Chromik et al. [14] mention that understandability be evaluated by assessing participants’ mental models of the system. Mohseni et al. [15] asked the participants to review the visualization used to make its system classification decision understandable. Similarly, Kaur et al. [28] asked the participants to describe the shown explanations to understand their mental models better. The most elaborate ones were the studies of Alizadeh et al. [27] and Ngo et al. [30]. In Alizadeh et al.’s [27] study, folk concepts and mental models are understood as individuals' representations about AI—how they believe AI systems function, what they expect from AI, and how they perceive its role in their daily lives. The study emphasizes that these mental models are shaped by people's experiences, assumptions, and interactions with AI technologies, which are also influenced by their social interactions and the broader cultural context [27]. The authors stress that these models are inherently "messy" and typically inaccurate, but they guide how users interpret AI's behavior, make decisions, and form expectations about AI’s capabilities and limitations [27]. The authors adopt a qualitative approach using thematic analysis to uncover the folk concept from semi-structured, in-depth interviews talking with people about their experiences, thoughts, and beliefs regarding AI systems [27]. In their study, Ngo et al. [30] refer to mental models as the internal cognitive structures that users develop from a music recommendation system. The authors employ quantitative and qualitative methods to comprehensively understand the structure and soundness of the users’ mental models. To analyze the mental models, they use think-aloud protocols, verbal explanations, and drawings where users express their understanding of the system's operation. To analyze mental reasoning processes in the context of an AI-supported online review classification task, Lai et al. [29] also use a qualitative method by asking participants to verbalize their reasoning using the following syntax: “I think the review is [predicted label] because [reason].”
Overall, our review reveals that, by their very nature, mental models are highly contextualized and specific to the system and domain in question. This makes generalizing and comparing mental models challenging. For this reason, Ngo et al. [30] and Kulesza et al. [69], for instance, used additional measures, such as objective measures of the accuracy of the mental model, to describe the system behavior. In addition, quantitative subjective measures based on self-reports, such as perceived confidence or perceived understandability, could also be utilized.
5.1.2 Perceived Understandability
In the context of XAI, users’ perceived understandability refers to the user’s understanding of the system’s underlying functionality in the presence of explanations [80]. In our sample, various studies [34,36,37,38,39,40,41,44,45,46] evaluate the perceived understandability to evaluate the understandability of explanations. These approaches operationalize and measure perceived understandability in different ways.
Cheng et al. [41] utilize the definition proposed by Weld and Bansal [117] , which suggests that a human user "understands" an algorithm when they can identify the attributes driving the algorithm's actions and can anticipate how modifications in the situation might result in different algorithmic predictions. They measure this understanding by asking them to rate the agreement with the statement, “I understand the algorithm.” About explainable recommender systems, Millecamp et al. [39] and Dominguez et al. [37] use questions that directly assess whether users understand why certain recommendations (e.g., songs or art images) were made. Users indicate on a Likert scale to what extent they can comprehend the explanation. Similarly, Bucina et al. [40] also use a self-report measure asking participants to respond to the statement, “I understand how the AI made this recommendation.”
Evaluating the generic XAI-Framework, LIME, Dieber et al. [38] investigate the interpretability of explanations through both, interviews and rating scales. They measure how well users can interpret the results of a prediction model by asking open questions, such as “What do you see?” or “Did you know, why the model made this prediction?” In addition, they asked the participants to rate on a 10-point item scale how well they could interpret the explanations provided. Cai et al. [46] measure perceived understanding by a single item, asking participants to self-assess by rating the statement “I understand what the system is thinking.” Gao et al. [36] adopted measurement scales from Knijnenburg [118] to assess the participants’ perception of the understandability of the system. Papenmeier et al. [44] and Anik et al. [34] use Likert-scale questions to measure perceived understanding, and Kim et al. [52] let participants self-rate their level of understanding of the explanation method.
In their methodological reflection, Hoffman et al. [33] also reflect on perceived understandability as a key factor in evaluation studies. They outline a questionnaire with an item where participants self-assess their understanding by responding: “From the explanation, I understand how the [software, algorithm, tool] works.” Similarly, the questionnaire proposed by Holzinger et al. [42] includes several items related to perceived understandability. For instance, the questionnaire includes items on general understandability, such as "I understood the explanations within the context of my work."
Overall, our review reveals significant overlap in the theoretical understanding of the construct. Perceived understandability is a subjective measure that can be evaluated by assessing how well users comprehend explanations and how these explanations improve their overall understanding of the system's functionality. Most studies rely on self-report measures, where participants respond to one or more Likert-scale questions to assess their understanding. However, there is no standardized questionnaire specifically for perceived understandability, particularly regarding input-output causality. This lack of standardization complicates cross-study comparisons and highlights the importance of carefully examining how the construct is operationalized in each study when interpreting results.
5.1.3 Goodness/Soundness of the Understanding
In addition to directly analyzing users' mental models and perceived understanding, users' ability to predict a system's decisions and behavior offers an indirect yet equally insightful measurement method. As Hoffman aptly states, "A measure of performance is simultaneously a measure of the goodness of user mental models.” Similarly, Cheng et al. [75] argue that “a human user understands the algorithm if the human can see what attributes cause the algorithm’s action and can predict how changes in the situation can lead to alternative algorithm predictions.” Also, Schmidt et al. [51] stress that intuitive understanding is expressed by the decision-making performance of the users: “Faster and more accurate decisions indicate intuitive understanding.” In addition, Chromik et al. [14] mention that goodness of the understanding can be assessed “through prediction tests and generative exercises” [14].
These quotes highlight that a user's ability to know and predict system behavior serves as an indicator of how well their mental model is functioning—and, by extension, how well the system's explanations have been understood. These predictive abilities provide an objective metric for evaluating the comprehensibility of explanations, transcending subjective perception, and reflecting both actual understanding and trust in the system. Regarding this, an explanation is considered understandable if the user is able to predict or describe the model’s behavior and output in a particular situation or using particular data [80]. Hence, the level of accuracy of the user’s prediction could serve as a metric to evaluate the level of understandability.
Several studies within our sample [35,40,41,47,48,49] utilized such evaluation measures in various ways. For instance, in the study of Van der Waa et al. [47], participants completed multiple trials, where after each trial, they were asked to predict the system and their thoughts on which input factor was responsible for this. In a similar way, Cheng et al. [41] evaluate if the participants can anticipate how changes in the situation might result in different system behavior and can identify the attributes that influence the algorithm's actions. Poursabzi et al. [48] focused on laypeople's ability to simulate a model’s predictions. In a qualitative manner, Liu et al. [50] used a concurrent think-aloud process to analyze the input-output understandability, where participants verbalized the factors they considered behind a prediction.
Similar measures were also used to assess the soundness of mental models. For instance, Ngo et al. [30] use multiple-choice comprehension questions to assess whether users understand the system's behavior correctly. In addition, participants rated their overall confidence in understanding the system on a 7-point Likert scale. Similarly, Sukkerd [32] measures assess the soundness of the mental model in his user study by evaluating both whether participants correctly determine the system behavior and their confidence in their assessment. Also, Kulesza et al. [69] assess the soundness of users’ mental models by asking participants multiple-choice questions about system behavior and having them rate their overall confidence in understanding the system on a 7-point scale.
Concerning the understandability goodness, Schmidt et al. [51] measures the time and error rate users made in an AI-supported classification task. Narayanan et al. [49] measured the understandability by determining whether participants correctly identified if the output was consistent with both the input and the provided explanation. Also, Bucina et al. [40] measured how well users could predict the AI's decisions based on the explanations given. Lastly, Deters [35] use the number of correct responses to indicate that the user understands the explanations provided. Poursabzi et al. [48] also evaluates the laypeople’s abilities to detect when a model has made a mistake. In some cases, the soundness of the understanding can also be used to measure the effectiveness of explanations concerning task performance.
In summary, we identified three methodologies in our sample for evaluating understandability:
- Qualitative methods involve uncovering users' mental models through introspection, such as interviews, think-aloud protocols, or drawings made by the users.
- Subjective-quantitative methods assess perceived understandability through self-report measures.
- Objective-quantitative methods evaluate how accurately users can predict and explain system behavior based on their mental models.
These three approaches are not mutually exclusive but rather complement each other, providing a comprehensive understanding of how well something is understood.
5.1.4 Perceived Explanation Qualities
In everyday language, the quality of an explanation refers to how effectively it communicates and makes the intended information understandable. In research, it is typically defined by the formal attributes of the explanation's form, content, and structure, or by the formal properties of the method used to generate it. In the case of functionality-grounded evaluations [10,119], for instance, explanation methods are analyzed with regard to their fidelity (how accurately the method approximates the underlying AI model), stability (whether the method generates similar explanations for similar inputs), consistency (whether multiple explanations for the same input are similar), and sparsity (the degree to which the number of features or elements in the generated explanation is minimized to reduce complexity).
Regarding human-centered evaluation, the quality of an explanation is assessed based on the perception of the target audience. This approach considers how well the explanation resonates with users, considering their cognitive abilities, practical needs, goals, and the context in which they use the explanation. Additionally, explanation qualities, such as complexity, completeness, consistency, and input-output relationships, are not formally assessed but are evaluated based on how they are perceived by the users. In our sample, we found studies that have evaluated both the overall explanation quality and specific explanation qualities from the user’s perspective.
When examining overall explanation quality, the focus is on how users perceive the quality of the explanations provided or the system as a whole. Evaluating an explanation-driven interactive machine learning (XIML) system, Guo et al., for instance, investigated the perceived explanation quality by focusing on the system as a whole, asking participants' perceptions of the feedback provided by the XIML system. Similarly, in the context of recommender systems, Liao et al. [45] as well as Tsai et al. [58] evaluate perceived explanation quality by the perceived quality of the provided recommendations asking participants to rate the statement “[The system] can provide more relevant recommendations tailored to my preferences or personal interests” [45] and “The app provides good medical recommendations for me" [58] respectively. In contrast, Naveed et al. [55,56,57] in their user studies on explainable recommender systems distinguish between recommendation quality on the one hand and explanation quality on the other hand. Also, Mohseni et al. [15] focus on explanation quality in their study on an image classification task by directly asking participants to rate how well the AI explained the classification of the image. Guesmi et al. [59] include the item “How good do you think this explanation is?” in their questionnaire and interpret this item as an indicator for satisfaction.
Several studies in our sample also evaluate specific explanation qualities to delve more comprehensively into the nuances of how concepts or features are explained. By focusing on specific qualities of explanations, researchers aim to uncover how different types of explanatory information contribute to the user's comprehension. In their survey, Schoonderwoerd et al. [28], for instance, include the questions “This explanation-component is understandable” and “From the explanation-component, I understand how the system works” to get a more detailed insight into how users understand the explanation interfaces.
Why-understanding presents an important explanation quality, which refers to the goal of explaining the reasoning and rationale behind decision-making and the context and conditions of the decision-making. Rader et al. [53] define why-explanations as “providing justifications for a system and its outcomes and explaining the motivations behind the system, but not disclosing how the system works” [53]. Correspondently, they evaluate the why-understanding by asking the participants “what they know about the goals and reasons behind what the [system] does” [53]. Regarding the perceived transparency of the reasoning and rationale behind the decision-making process, Tsai et al. [58] use two self-report items: “I understand why the [system’s] recommendations were made to me” and “The app explains why the [system’s] recommendations were made to me.” In a similar manner, Deters [35] used the item “Do you know why the model made this prediction?” in his study.
Input-output causality presents a similar quality, which refers to the goal of making AI decision-making understandable. This involves clarifying what specific input, such as data features or variables, leads to particular outputs or decisions made by the AI model. To evaluate the perceived quality of explaining causality, the questionnaire outlined by Holzinger et al. [42] includes items such as "I found the explanations helped me to understand causality." Additionally, the questionnaire includes items to assess if explanations are self-explanatory and understandable without external assistance.
Information sufficiency presents a further quality examined in several studies ([33,54,72,92]. It refers to whether explanations offer enough detail or evidence to effectively address users' questions or tasks. To assess this quality, Hoffman et al. [33] propose the items: “The explanation of the [software, algorithm, tool] sufficiently detailed” and “The explanation of how the [software, algorithm, tool] works is sufficiently complete.” In Schoeffer et al.’s [72] study, information sufficiency is measured using the item: “If you feel you did not receive enough information to judge whether the decision-making procedures are fair or unfair, what information is missing?” Similarly, the item “I find that [system] provides enough explanation as to why an exercise has been recommended” in the study of Ooge et al. [54] evaluates the information sufficiency concerning explainable recommender systems. Naveed et al. [92] thoroughly discuss measuring this construct. They argue that information sufficiency be evaluated by asking participants to rate whether the explanations provided by the AI system contained enough relevant and necessary information to support their decision-making process, for instance, by the Likert-scaled items originally adapted from a user-centric evaluation framework for recommender systems [92,120]“The explanation provided all the information I needed to understand the recommendation” and “The details given in the explanation were sufficient for me to make an informed decision” .
Explanation correctness was also a quality addressed in some evaluation studies. It refers to the quality where explanations accurately reflect the true nature of the system's decisions or recommendations, ensuring they are not based on errors or misclassifications. Rader et al. [53], for instance, incorporate questions about correctness to assess how well participants believe the system's outputs match their expectations and whether these outputs are free from errors. Similarly, Ford et al. [61] operationalize perceived correctness by 5-point Likert-scale ratings, asking participants if they believe the system is correct.
Regarding domain-specific qualities, Naveed et al. [56] evaluate several domain-specific categories regarding financial support systems, asking the participants to rate how well the system explains the financial recommendations, gives evidence that the system aligns with user’s understanding, values, and preferences, and explain the domain-specific topics necessary to understand the system’s actions.
5.2 Usability
Explanations should not only be understandable but also usable. This means that explanations must be designed to be not only clear and comprehensible in content but also practically applicable and useful for the user.
In Human-Computer Interaction (HCI), usability refers to effectiveness, efficiency, and user satisfaction, as defined by the ISO 9241-11 standard. Usability has been extensively studied across various domains and can be measured by factors such as satisfaction, helpfulness, ease of use, workload, and performance. In the context of explainable systems, usability should enhance users’ work performance by providing relevant, easy-to-use, and high-quality explanations. In the following, we outline how these issues were considered and operationalized in the various evaluation studies in our sample.
5.2.1 Satisfaction
Satisfaction is a multifaceted theoretical construct in psychology that encompasses both affective and cognitive components. The affective component refers to the positive subjective experience of pleasure, joy, or well-being concerning a specific situation, state, or outcome [121]. The cognitive component refers to evaluating and comparing the individual’s expectations with their actual experience. When the outcome aligns with or exceeds expectations, satisfaction is achieved. Satisfaction also serves as a motivational factor [122] , where satisfaction can motivate certain actions, such as adopting a technology, while dissatisfaction tends to inhibit such action.
In Usability Engineering, satisfaction is defined as the freedom from discomfort and positive emotional and attitudinal responses toward a product, system or service (ISO 9241-11). Regarding explainable AI, satisfaction refers to the degree to which users find explanations provided by AI systems comprehensible, convincing, and useful in enhancing their understanding of the system’s decisions or predictions [106].
In our sample, various studies evaluate user satisfaction in the context of explainable systems [31,33,35,36,37,38,39,49,56,57,58,59,60,61]. Most of these studies treated "user satisfaction" as an established concept, so the concept was not discussed on a theoretical level but primarily focused on its operationalization or its application.
On a theoretical level, Chromik et al. [14] define satisfaction as the increase the ease of use or enjoyment, which can be measured by participants’ self-reported satisfaction. Hoffman et al. [33] and Dieber et al. [38] have explored the construct of "satisfaction" in the context of XAI in more detail. Dieber et al. [38] stress that satisfaction resulting from the use of a system, product, or service, where three key elements are important (1) positive attitudes, which relate to the general cognitive evaluation of approval or disapproval; (2) positive emotions, expressed through reactions such as joy, happiness, or contentment; and (3) perceived comfort, which refers to how easy and intuitive the system is to use. Dieber et al. [38] emphasize that the affective component of satisfaction can be assessed through self-reports that gauge how well users feel about their interaction with the system.
While Dieber et al. [38] definition refers to (exploratory) systems, Hoffman et al. [33] focus on the isolated explanation. They understand satisfaction as a cognitive process of doing a “contextualized, a posteriori judgment of explanations” [33]. Following Hoffman et al. [33], this judgment relates to understandability, where the positive experience emerges when users have achieved an understanding of how the system made a particular decision. From this perspective, they define explanation satisfaction as "the degree to which users feel that they understand the AI system or process being explained to them” [33]. In other words, Hoffman et al. define satisfaction can be subsumed under the broader construct of understandability. This is also evident in their questionnaire design, where satisfaction is measured in relation to the understandability of the explanation, asking participants: “The explanation of how the [software, algorithm, tool] works is satisfying.”
In our sample, satisfaction has been evaluated in various contexts, such as recommender systems, data classification tasks, or fictitious explanation tasks. Guesmi et al. [59] focus on the explanation directly, evaluating satisfaction through the item "How good do you think this explanation is?". Most studies have a broader focus, evaluating if the user is satisfied with system as a whole. For instance, Dominguez et al. [37] and Millecamp et al. [39] operationalize satisfaction using the single item “Overall, I am satisfied with the recommender system”. Naveed et al. [56,57,60] adopt the operationalization of Pu et al. [120] using the item “Overall, I am satisfied with the recommender.” Similarly, Kulesza et al. [31] operationalized the construct with the item “How satisfied are you with the computer's playlists?”
Some studies also use multiple questions to measure satisfaction. Dieber et al. [38], for example, use three questions to get a more detailed understanding of user satisfaction in their study: (I1) “Do we have a positive or negative attitude towards the tool?”, (I2) “What emotions arise from using it?”, and (I3) “How satisfying is the final result?”. These questions, however, do not form a psychometric scale in the traditional sense, as the questions have different levels of measurement (e.g., I2 is an open-ended question). Instead, it aims to gain a more holistic understanding of the issue. In contrast, Tsai et al. [77] utilize a multi-dimensional scale in the traditional sense. They understand satisfaction as a result of comfort and enjoyment and measure the construct using three items: (I1) “Overall, I am satisfied with the app”, (I2) “I will use this app again”, and (I3) "I would like to share this app with my friends or colleagues.” Here, I1 measures satisfaction directly, while I2 and I3 measure the construct indirectly, based on the motivational effects of satisfaction, such as the intention to reuse and recommend the tool. However, a psychometric validation of this scale has not been conducted.
Another scale was proposed by Deters [35]. The author conceptualizes satisfaction as a multi-dimensional construct encompassing subjective usefulness, subjective enjoyment, and perceived quality of the system. Concerning this, the author outlines a 12-item questionnaire that covers the affective level (e.g. by items such as “Overall, I am satisfied with the system," "Overall, the system was enjoyable," and "I would enjoy using the system when explanations like that are given.", the pragmatic level of making of the explanations (e.g., by items such as (I4) “Overall, the system was easy to use”, (I5) “The explanations were intuitive to use"), the aesthetic level of representation (e.g., "The explanation is aesthetically pleasing", “Content layout and order of elements in explanations are satisfying.”), as well as further items addressing positive exploratory features (e.g. by items such as “The explanation convinces you that the system is fair while doing [action]”). While this literature-based questionnaire is quite comprehensive, it has not been psychometrically validated or empirically tested. For this reason, it is unclear whether all items measure the same theoretical construct.
Another multi-dimensional scale is proposed by Guo et al. [36]. In evaluating an explanation-driven interactive machine learning (XIML) system, they measure users’ satisfaction with eight items. Due to issues with discriminant validity, three items were removed from their System Satisfaction Scale. The remaining five items ("Using the system is a pleasant experience," "Overall, I am satisfied with the system," "I like using the system," "I would recommend the system to others," "The system is useful") capture both the emotional-affective and the motivational-pragmatic aspects of system use and recommendation. As the discriminant validity of these items has been proven, it presents a promising candidate for a standardized measure for evaluating user satisfaction in the context of explanations.
Overall, our literature review reveals that user satisfaction is a frequently used metric in the sample. Our review also shows that the studies do not focus on the individual explanation but on the user experience interacting with the system, measuring the overall satisfaction by a single-item questionnaire. Although there are emerging efforts to capture the multi-dimensional construct of "satisfaction" through multiple-item questionnaires, a standardized and widely accepted scale for this purpose is still lacking.
In addition to multiple-item scales, qualitative methods such as thinking-aloud or interviews are also recommended [123]. This would allow a profound understanding of context and to what extent the satisfaction resulted from the explanation design or other contextual factors. In addition, conducting expert case studies could be an alternative approach as experts, in contrast to laypersons, possess extensive knowledge of the system’s domain, enabling them to provide more thorough and insightful evaluations [124]. Moreover, additional objective measures, such as eye movement, heart rate variability, skin conductance, and jaw electromyography showing positive emotions, have also been used in research to measure user satisfaction [125,126].
5.2.2 Utility and Suitability
Usability Engineering emphasizes the teleological nature of human behavior, where people use systems not merely for enjoyment but as tools to achieve instrumental goals (ISO 9211-11). This instrumental perspective is reflected in the theoretical constructs of pragmatic quality [127] and perceived utility [128] .Pragmatic quality is defined as the perceived ability of a system to assist users in completing tasks and achieving their so-called do-goals or action-oriented objectives [127]. Related to this, perceived utility describes the user's subjective assessment of how useful a product, system, or service is in helping them achieve their specific goals. This perception is influenced not only by the actual functions of the product but also by the user's expectations, needs, goals, individual experiences, and the context of use. Pragmatic quality [127] and perceived utility can be evaluated by different but similar constructs, such as the explanation's helpfulness, usefulness, personal relevance, and actionability.
Helpfulness as a theoretical construct refers to the degree to which explanations provided by AI systems are perceived as valuable, informative, and supportive by users in aiding their decision-making or understanding of the system’s outputs. In literature, evaluating helpfulness is often based on self-reports, where users rate to what extent explanations are tailored to specific tasks [40,42,46,48,129,130,131,132].
In our sample, various studies [35,40,42,52,62] evaluated the helpfulness or usefulness of AI systems' explanations. For instance, Ford et al. [61] used a 5-point Likert scale to measure the perceived helpfulness of explanations for both correct system classifications and misclassifications. Similarly, Bucina et al. [40] evaluated helpfulness by asking participants to rate the statement, “This AI helped me assess the percent fat content”, on a 5-point Likert scale. They used this rating as an indicator of the usefulness of the explanations provided. Concerning causality, Holzinger et al. [42] measured helpfulness in the questionnaire by the item “I found the explanations helped me to understand causality”.
Anik et al. [34] evaluated perceived utility by asking participants to rate the usefulness of the explanation element on 5-point Likert scale items. Similarly, Bansal et al. [62] evaluated the perceived usefulness quantitatively in a post-task survey, where participants indicated whether they found the model's assistance helpful. Kulesza et al. [31] evaluated utility by the cost-benefit ratio, including the item “Do you feel the effort you put into adjusting the computer was worth the result?” in their post-task survey.
In contrast, Kim et al. [52] used a free-form questionnaire in their user study about pipeline-generated visual explanations, where participants were asked to write about their views on usefulness. Studying how data scientists use XAI tools, Kaur et al. [28] also asked the participants whether the explanations were useful and, if so, how they would use them in their typical work. Lai et al. [29] asked the participants of the user study to report their subjective perception of tutorial usefulness as reported in the exit surveys.
Another indicator of usefulness is actionability, which means the ability of users to apply the explanations within their specific context. Hoffmann et al. [33] suggest measuring actionability through the item “The explanation is actionable, that is, it helps me know how to use the [software, algorithm, tool]”. This concept emphasizes that a useful explanation should provide information that guides users to reach the goal. Closely related to this is the concept of "easy-to-use," which also assesses how well the explanation facilitates the process of making use of explanations. This means this construct evaluates not just the possibility of understanding and applying explanations within the particular context but also the effort and workload required by the user in doing so.
In most studies from our sample, the authors take for granted the user's goals and for what purposes explanations are needed, such as a fairly general understanding of causal relationships in AI systems [42] or, quite specifically, analyzing the meal’s fat content [59]. However, in real-world settings, the user's goal is vague and not always clearly defined. In such cases, the first step in a user study is to explore which explanations are relevant and suitable for the particular context and the target user. In our sample, we identified two studies that focus on this issue. Dodge et al. [64], for example, investigated how users explain system behavior and what types of questions participants (StarCraft II players) ask when trying to understand the decisions of an allegedly AI-controlled player. The goal was not to measure the soundness of mental models but rather to analyze what types of explanations will be relevant to make AI behavior understandable. To uncover explanation needs and visual explanation style preferences, Kim et al. [63] conducted a formative, qualitative study where the participants wrote natural language questions about and provided answers and explanations for their answers. They analyzed the results to determine what explanations the users requested and how they can be visually represented.
Using a mixed-method approach, Naveed et al. [55] also investigate what kind of explanations will be helpful in a particular context. In their study about financial support systems, they showed that users want explanations to understand input-output causality (e.g., which inputs are used to determine the recommended portfolio), the outcome (e.g., why option A is recommended instead of option B), the procedural (e.g., which decision steps were taken by the system), as well as the context (e.g., which portfolios are recommended to other users). To understand the user’s explanation needs with regard to online symptom checker apps for laypeople, Schoonderwoerd et al. [28] conducted semi-structured interviews and analyzed them with the help of thematic analysis. In addition, they used a questionnaire asking participants to rate the perceived importance of information elements in different use scenarios.
Concerning the heterogeneity of users, domains, and contexts, Deters [35] also argues that explanations should be performed appropriately by considering the specific circumstances. For this reason, she defines criteria as suitability, which is formed by the following sub-criteria: Suitable for the User where the system should be adapted to the particular target groups; Suitable for the Goal where the system should be adapted to the particular task to be performed; Suitable for the Context, where the system should be adapted to the environmental conditions of the use context. In evaluation studies, this criterion should be addressed by the perceived suitability, for instance, by asking participants in a survey: “In what use case would you use the explanations?”.
Once the hypothesis about what will be relevant is established, the next step would be to validate this through user studies. This can be done, for example, by including the construct of personal relevance in the study design. In our sample, Jin et al. [78] evaluated the explanation need by asking the participating physicians in the user study whether they would use the explanations in their work for cancer diagnosis. Schoonderwoerd et al. [65] included in their post-task survey the item “This explanation-component is important”. Similarly, Ooge et al. [54] include in their questionnaire the item: “I find it important to receive explanations for recommendations”. Dominguez et al. [37] evaluate the personal relevancy of explanations in the case of the art recommender system by asking the participants to rate the statement, “The art images recommended matched my interests”.
In summary, our review shows that usefulness and actionability are important in evaluation studies, which can be measured quantitatively by self-reporting in surveys. In the case of real-world studies or new areas of application and/or target groups, our overview suggests conducting a qualitative, exploratory study first. In this way, it is possible to determine which explanations are suitable and relevant for the respective context.
5.2.3 Task Performance and Cognitive Workload
Satisfaction is not the only goal in usability engineering; improving task performance is equally important. According to ISO 9241-11, task performance is defined by two main components: effectiveness and efficiency. Similarly, Lim and Dey [136] define performance in the context of XAI as the degree of success with which the human-AI system effectively and successfully conducts the task for which the technology is designed. With regard to human-AI collaboration, performance can refer to different aspects. It can relate to the technical system, such as being measured by the model's accuracy in making correct decisions or predictions. Additionally, it can also refer to the user's performance in utilizing the system's output. However, the performance of the system often cannot be separated from the performance of the user, and vice versa. In such cases, task performance refers to the joint effectiveness of both the AI and the user working together.
Effectiveness refers to the accuracy and completeness with which users perform tasks and achieve their goals when interacting with a system. The specific operationalization of this construct depends on the nature and structure of the task or goal. Most commonly, effectiveness is measured by the success rate in completing tasks or sub-tasks, often quantified by the number of successfully accomplished trials within a specific time period [133]. For example, in game-based applications like chess, task effectiveness can be assessed using metrics such as winning percentage and percentile ranking of player moves [134]. In the context of decision-support systems, effectiveness can be measured by how much the decision-making process is improved [135]. Analogous effectiveness in recommender systems can be measured by the percentage of cases in which the user finds a suitable item. In cases where the goal is to explain the system behavior, effectiveness can be measured by the percentage of accurate user predictions of the system’s output, typically evaluated through metrics like the number of hits, errors, and false alarms [62,133].3
In our sample, various studies evaluate effectiveness in the context of explainability. Theoretically, Chromik et al. [14] define the effectiveness of explanations as helping users make good decisions. On an empirical level, various studies explore how well different explanation methods help users to reach their goals in different contexts. Van der Waa et al. [47], Tsai et al. [58], Deters [35], Alufaisan et al. [67], Zhang et al. [70], Carton et al. [71] address effectiveness in the context of decision- and prediction-support systems, but they use different operationalization approaches. Van Der Waa [47] employs an objective measure, evaluating effectiveness by counting the number of times a correct decision is made. Similarly, Alufaisan et al. [67], Zhang et al. [70], Carton et al. [71], and Kim et al. [63], measured the effect of explanations on the user’s accuracy of AI-assisted prediction/classification tasks. In contrast, Tsai et al. [58], Deters [35], and Schoonderwoerd et al. [65] focus on softer more subjective aspects of effectiveness, such as whether users make good decisions [58], better decisions [35] or improved decision-making [65]. To assess these factors, they use subjective measures based on self-reports, asking participants to rate statements like “The app helps me make better medical choices” [58], “The explanation provided contains sufficient information to make an informed decision” [35], and “This explanation-component improves my decision-making process“ [65]. Millecamp et al. [39] use a similar approach to measure effectiveness in the case of explainable music recommender systems, using the item “The recommender helped me find good songs for my playlist” to operationalize the construct. Evaluating different kinds of explanations supporting humans in classification tasks, Schmidt et al. [51] as well as Lai et al. [29] quantify effectiveness by the percentage of instances correctly labeled by participants. Jin et al. [78] also address a classification task in which physicians diagnose cancer with the help of AI. They operationalized effectiveness as participants’ task performance accuracy. This was measured under different conditions (with and without providing explanations) by asking participants: “What is your final judgment on the tumor grade?”
In his work, Sukkerd [32] evaluates the effectiveness of explanations by focusing on understandability. Since the primary design goal was to improve users' understanding, he uses measures of understandability as a proxy for effectiveness, studying how well the explanation approach enables the users to understand the AI decisions and to assess whether those decisions are appropriate. In a similar approach, Cheng et al. [41] assess the effectiveness of different explanation concepts by comparing how well participants understand the algorithm and how much they trust it, with each group receiving access to a specific explanation interface, along with a control group.
Dieber et al. [38] conceptualize effectiveness as a multi-dimensional construct to evaluate the XAI framework LIME from a user’s perspective. According to Dieber et al. [38], effectiveness is associated with the complete and accurate completion of tasks, how well users achieve their goals using the system, and the effective mitigation of potential negative consequences if the task is not completed correctly.
Efficiency refers to the resources required to achieve specific goals or complete a specific task [66]. It is usually measured by the time a user needs to successfully complete a task, measured by a timer/stopwatch or a log of the time stamps when the user starts and finishes the task [114]. This is also reflected in our sample where efficiency was typically measured by response time [49,61], reaction time [67], annotation time [51], second-per-task-completion [70], interaction time [31], time spent using the tool [41], or faster decision-making, [14]. An objective measure was also used by Schaffer et al. [68], evaluating the explanation interface concept using a fictive multi-round game. They assess efficiency by the number of moves participants need to solve the task. Similarly, Kulesza et al. [31] also counted the number of interactions with the system. In contrast, Guesmi et al. [59] used a subjective measure in the context of explainable recommender systems. They evaluate efficiency by asking participants to rate the statement: “This explanation helps me determine more quickly how well the recommendations match my interests.”
Mental or cognitive workload is another important theoretical construct for measuring efficiency in terms of the mental effort required to perform the task and the mental resources, such as attention, memory, and cognitive abilities, demanded to reach the goal [136]. A high cognitive workload is linked to stress, increased mental activity, and information-processing behavior. This is reflected in physiological activities, such as changes in heart rate, brainwave activity, skin conductance, pupil size, and saccadic movements. Hence, measuring these changes by EEG, GSR, or eye-tracking systems is often used as an objective operationalization of the theoretical construct [137,138]. Another approach to measure users’ cognitive load is to capture the log-reading time in memorizing explanations [136]. Another approach is to use subjective measures for operationalization by collecting self-reported data, where individuals assess their own perceived cognitive workload [125]. The NASA Task Load Index (NASA-TLX) is a widely used subjective rating scale to measure the user’s perceived workload during interaction task performance or in post-task surveys [139]. The NASA-TLX operationalizes workload across six dimensions by asking participants to evaluate their experience in terms of mental, physical, and temporal demands, performance, effort, and frustration.
In our sample, the NASA-TLX was the most used method to evaluate cognitive workload. For instance, Kaur et al. [28], Kulesza et al. [31], and Paleja et al. [66] used this questionnaire to measure task workload. In some cases, other subjective measures were employed in the user studies, such as asking questions about usage effort [83] or evaluating mental demand by asking participants, "How mentally demanding was it to understand how this AI makes decisions?" [40]. In contrast, we found only one study in our sample that evaluated cognitive workload using objective measures.
This is likely because these measurements are more challenging to implement in user studies than self-report-based measures. To measure the mental workload, Cai et al. [46] logged the time spent on the explanation interface.
In summary, our review shows a strong consensus on the theoretical construct of performance, often defined in terms of effectiveness, efficiency, and mental workload. However, the operationalization of this construct varies significantly depending on the specific design goals and the nature of the task. Evaluating this construct effectively requires a well-defined understanding of the context and a precise specification of the task, ensuring that the measurement of task performance is both relevant and rigorous.
5.2.4 User Control and Scrutability
Controllability is a critical aspect of usability. It refers to the degree to which users can directly manage and influence the behavior of a system or application to meet their needs and preferences (ISO 9241-110). Various studies have explored user control in different contexts. For instance, Ngo et al. [30] and Rader et al. [53] explore this issue qualitatively by studying how users perceive controllability in commercial social media platforms like Facebook and recommender systems like Netflix. Concerning this, they investigate how explanations might enhance perceived controllability. Guo et al. [36] assessed perceived controllability quantitatively by surveying participants about their sense of control over the system.
In our sample, user control concerns scrutability. This is motivated by the fact that AI systems do not always deliver correct outcomes and are not always aligned with user preferences [35]. In this context, scrutability is linked to user control, as it not only allows users to inspect the system's models but also enables them to influence future behavior by providing feedback when the system is incorrect [59].
Chromik et al. [14] define scrutability as the ability of users to inform the system when it has made an error. Deter highlights that explanations contribute to scrutability by enhancing the user's understanding of when the system is wrong and by providing a mechanism to report such errors. Operationalizing this construct, Guesmi et al. [59] included the survey item: “The system allows me to give feedback on how well my preferences have been understood”. Deters [35] address the multi-dimensionality by operationalizing the construct with three items: “The system would make it difficult for me to correct the reasoning behind the recommendation”, “The response allows me to understand if the system made an error in interpreting my request”, and “I felt in control of telling the system what I want”.
5.3. Integrity Measures
In the studies in our sample, trust, transparency, and perceived fairness were common evaluation measures. We grouped them under the label "integrity," as these measures address this concept in various ways. Firstly, system integrity is essential for establishing and maintaining the trustworthiness of a system. Integrity ensures that the system consistently behaves in a reliable and predictable manner, adhering to its intended purpose and ethical standards. Secondly, system transparency is integral to maintaining integrity, as it enables users and stakeholders to observe and understand the system’s processes and decisions. Thirdly, fairness is also a key component of integrity, ensuring that the system’s operations are free from bias and that decisions are made equitably and ethically. Assessing these dimensions of integrity—trust, transparency, and fairness—provides a comprehensive understanding of a system’s reliability and ethical performance.
5.3.1 Trust
Trust is a well-established concept in social science. Due to its long history and multidisciplinary nature, trust has been defined in various ways. Still, generally, trust can be defined as “the willingness of a party to be vulnerable to the actions of another party based on the expectation that the other will perform a particular action important to the trustor, irrespective of the ability to monitor or control that other party” [140] . Concerning interactive systems, trust also refers to “the extent to which a user is confident in and willing to act on the recommendations, actions, and decisions of an artificially intelligent decision aid” [141].
It has also become an important topic in AI research, as trusting systems is essential, particularly in critical decision-making processes, when users do not fully understand how the system arrives at its conclusions or only have limited control over its behavior. This central importance is also reflected in our sample, where many studies investigate how explanations impact trust and confidence [14,28,32,33,34,35,36,41,44,45,46,47,48,50,51,54,57,58,59,60,61,62,63,65,66,67,68,69,70,71,72,73,77,78].
Analyzing the studies in our sample in detail reveals that the theoretical understanding of the concept is shaped by various disciplines such as psychology, service science, and technology studies. From the psychological perspective, trust presents a multidimensional construct encompassing both cognitive and affective components [141]. The cognitive aspect of trust refers to the user’s intellectual assessment of the AI system's characteristics, such as accuracy, transparency, and reliability. On the other hand, the affective component deals with emotional responses such as feelings of safety, confidence, and comfort when interacting with the system. Institution-based trust theories complement this understanding by emphasizing trust, which is a prerequisite for a certain level of confidence in the service provider’s integrity, benevolence, and competence [142]. Competence refers to the system’s ability to fulfill its promises (e.g., delivering a product on time). Integrity is demonstrated by the system’s consistent and reliable actions, and benevolence indicates that the system prioritizes the user’s interests above its own, showing genuine concern for the user’s well-being. The third perspective came from technology studies, where the conceptualization also addresses specific issues in the human-machine context, such as users perceiving a system as trustworthy when it is reliable, secure, transparent, and understandable and when the system behaves in a predictable and consistent manner [143]. In addition, there is a behavioral view in the literature on trust that emphasizes that trust is not only an internal state of mind but also becomes evident through the user’s behavior—specifically when users actively engage with a system, utilize its functionalities, or follow its decision-making and recommendations [144].
In our literature survey, we observed various perspectives on trust manifesting in different ways to measure trust. Concerning the psychological dimension, various operationalizations in our sample emphasize the affective side of trust. Chromik et al. [14], for instance, stress that trust aims to increase the user’s confidence. Similarly, Alufaisan et al. [67] Sukkerd [32], Bansal et al. [62], and Cheng et al. [41] define trust as the confident expectation that one’s vulnerability will not be exploited. To measure trust, Liao et al. [45] adopt the trust scale developed by Madsen and Gregor [141], which also covers the affective dimension of trust, including items like “I find [system] likable” and “My interaction with [system] is enjoyable.” In the same vein, Paleja et al. [66] apply perceived likability and positive affective traits as indicators of trust in human-machine interactions.
The behavioral perspective on trust is particularly evident in the work of Zhang et al. [70], who argue that subjective self-reported trust may not be a reliable indicator of trusting behaviors. Instead, they measure trust by objectively assessing how often users rely on and agree with the system's decision-making. Likewise, Carton et al. [71], Schmidt et al. [51], and Liu et al. [50] measure trust behaviorally by examining how often users agree with the system's decisions. Van der Waa et al. [47] and Liu et al. [50] further stress that a trust metric must capture cases of over-trust and under-trust using objective measures. This involves evaluating the number of instances where humans agree with decisions wrongly made by the system (over-trust) and, conversely, where humans disagree with decisions correctly made by the system (under-trust).
Schaffer et al. [68] and Hoffman et al. [33] also link trust to user actions, but using subjective measures in their operationalization. Hoffman et al. [33], for instance, stress that, at a minimum, a trust scale should include both a perceptual and a behavioral component, operationalized by the items “Do you trust the machine's outputs?” (trust) and “Would you follow the machine's advice?” (reliance) [33].
In our sample, some studies adopt trust scales, which have their origins in service science, where trust is crucial for establishing and maintaining long-term relationships between service providers and clients. For instance, Cai et al. [46] adopted the organizational trust scale from Roger et al. [140], while Guesmi et al. [59] and Ooge et al. [54] adopt the trust scale from Wang and Benbasat [145]. Both scales are based on self-reports and are multi-dimensional, addressing integrity, benevolence, and competence in service provision. The studies in our sample adopt these dimensions in relation to the particular context, including items to measure the perceived competence (e.g., “the system seems capable” [46], “the system has the expertise to understand my needs and preferences” [59], “[the system] has the expertise (knowledge) to estimate my [needs]” [46]), the perceived benevolence (e.g. “the system seems benevolent" [46], “the system keeps my interests in mind” [59], “[the system] prioritizes that I improve [myself]” [54]), and the perceived integrity (“the system is honest“ [59], “[the system] makes integrous recommendations]” [46]).
The technology-oriented operationalizations in our sample address additional technical attributes that are relevant for building trust. Adopting established technology-trust scales [141], Fügener et al. [77] and Colley et al. [69], for instance, include self-reporting statements, which address the attributes of consistency and predictability. In their questionnaires, Fügener et al. [58] use a positive-polarity item, “The system responds the same way under the same conditions at different times”, while Colley et al. [69] include a corresponding but negative-polarity item: “The system behaves in an underhanded manner” to measure trust. In her operationalization, Deters [35] also emphasizes the role of consistency in evaluating trustability, asserting that explanations should be coherent and stable to avoid confusing users and undermining their trust. From this stance, her trustability questionnaire includes the item “The explanation seems consistent” [35]. Fügener et al. [77] also consider the perceived understandability as essential indicators of trust, operationalized by items such as “Although I may not know exactly how the system works, I know how to use it to make decisions about the problem” [77]. Similarly, Van der Waa et al. [47] stress that understanding can be a proxy to measure trust. In this regard, they instead measure trust directly, but they decide to measure constructs like understanding and persuasion instead.
In various cases, the studies in our sample did not explicitly refer to a specific trust theory but rather relied on a common sense understanding of the concept. Most often, the self-reporting approach was used, where participants were asked general questions about their perceived trust in the system and its outcomes. For example, Guo et al. [36] simply assessed trust by asking participants to express their level of trust in the studied explanation systems. Dominguez et al. [37] measured trust in the system's outcome with the single item: “I trusted the recommendations made”. Similarly, Millecamp et al. [39] evaluated perceived trust with the statement: “I trust the system to suggest good songs”.
Overall, our survey shows that trust is an essential construct in the empirical evaluation of explanations. Our survey also shows varying interpretations and operationalizations across different studies, utilizing objective measures that observe user behavior and subjective measures that rely on self-reports. The advantage of objective measures is that they allow researchers to uncover when explanations lead to over-trust and under-trust. In contrast, the advantage of subjective measures lies in capturing the nuanced perceptions of trust. Our survey further shows that psychological, institution-based, and technology-oriented trust theories shape the various operationalizations in our sample. These various perspectives are not mutually exclusive but rather complement each other. In conclusion, researchers should combine different perspectives and measures in their evaluation studies to comprehensively understand how explanations affect trust in a particular context.
5.3.2 Transparency
Transparency is a well-discussed topic in research that addresses the challenges posed by AI systems that function as black boxes. By making AI systems' decision-making processes more visible, transparency allows stakeholders to evaluate whether these processes align with ethical standards and societal values. Moreover, transparency should ensure accountability, predictability, trustworthiness, and user acceptance. Wahlström et al. [146], define the concept by stating that “transparency in AI refers to the degree to which the AI system reveals the details required for a person to accurately anticipate the behavior of the system”.
Transparency is also an essential topic in XAI, where explainability is seen as the key to achieving transparency by providing clear, comprehensible explanations of how AI systems work and how they reach their conclusions. In our sample, several studies also addressed transparency as an explicit evaluation measure [14,30,35,53,54,58,59,63]. Upon closer analysis, it becomes evident that transparency is typically conceptualized and operationalized by the constructs of understandability and controllability.
Regarding conceptualizing the construct, Chromik et al. [14], for instance, mention that transparency aims to “explain how the system works” [14]. Similarly, Deters [35] defines transparency in terms of users' interest in “understanding what questions are asked, why, and how they affect the outcome” [35]. In the context of newsfeed algorithms, Rader et al. [53] consider transparency as a quality of explanations that helps users “become more aware of how the system works” and enables them to assess whether the system is biased and if they can control what they see. Concerning recommender systems, Ngo et al. [30] also emphasize that “transparency and control are not independent of each other” [30].
Also in the operationalization of the construct, the close link to understandability is evident. For instance, the transparency questionnaire suggested by Deters [35] includes items such as “I understood why an event happened” and “The response helps me understand what the [result] is based on”. Similarly, Guesmi et al. [59] questionnaire includes the item “it helps me to understand what the recommendations are based on", while Tsai et al. [58] use the item “the system explains how the system works", and Ooge et al. [54] use the item "I find that [the system] gives enough explanation as to why an exercise has been recommended" for this purpose. These examples demonstrate that transparency can be measured through self-reported assessments of the system's understandability.
5.3.3 Fairness
Another topic in AI and Explainable AI (XAI) research is Fairness. This topic has emerged from the growing application of AI systems in critical societal domains such as healthcare, finance, and criminal justice. As these systems increasingly influence decisions that affect individuals' lives, ensuring fairness in AI is paramount to preventing discrimination and bias. Because of this, it becomes important that AI systems in critical domains make unbiased decisions that are perceived as fair by the various stakeholders. Studying perceived fairness has a long history in psychology and organizational science, where it is conceptualized as a multi-dimensional construct, including issues like distributive fairness, procedural fairness, and interactional fairness. In our sample, mainly the studies of Grgic et al. [89], Harrison et al. [75], and Schoeffer et al. [72] have evaluated perceived fairness in the context of explainability.
The study of Grgic et al. [89] and Harrison et al. [75] focus on distributive (or group) fairness and procedural fairness. Grgic et al. [89] define distributive fairness as the fairness of AI decision-making outcomes (or ends). Similarly, Harrison et al. [75] interpret group fairness as the model’s comparative treatment of different groups, such as gender, race, or age. Both defined procedural fairness complementarily as the fairness of the process (or means) by which individuals are judged and how AI systems generate outcomes. The study of Schoeffer et al. [72] addresses informational fairness concerns in automated decision-making. They define informational fairness as individuals feeling given adequate information and explanations about the decision-making process and its outcomes. Because of the different research interests, the studies operationalize fairness differently.
Harrison et al. [75] conducted an experimental study comparing two ML models for predicting bail denial. These models implement various fairness-related properties. They use a mixed-method approach where participants should rate the fairness, bias, and utility of each model on a five-point Likert scale. In addition, the survey includes free-respond questions asking to give reasons for the ratings. These responses were thematically coded.
Grgic et al. [89] also studied ML models for predicting bail denial, focusing on how human perceptions of process fairness might conflict with the prediction accuracy of these systems. In the first step, they evaluated participants' judgments of algorithmic process fairness by asking three yes/no questions: “Do you believe it is fair or unfair to use this information?” [89], “Do you believe it is fair or unfair to use this information if it increases the accuracy of the prediction?” [89], and “Do you believe it is fair or unfair to use this information if it makes one group of people (e.g., African American people) more likely to be falsely predicted?” [89]. In the second step, they assessed how the prediction accuracy of ML models would change if the participants' fairness judgments were considered.
Schoeffer et al. evaluated how explanations affect people's perception of informational fairness by using a scenario of an automated decision-making process for approving loan eligibility. The experimental design covers the following conditions: (i) baseline with no explanation, (ii) what factors are considered in making the decision, (iii) the relative importance of these factors, and (iii) additional counterfactual scenarios. For each condition, participants rate t informational fairness and trustworthiness by Likert-scaled items. The study also collects qualitative feedback through open-ended questions to gain deeper insights into what information they believe is necessary to judge the fairness of the decision-making and their views on the appropriateness of the explanations provided.
In their study of data-centric explanation concepts to promote transparency in, e.g., algorithmic predictive bail decisions, facial expression recognition, or admission decisions, Anik et al. [34] also included algorithmic fairness as one of their evaluation metrics. They measure fairness using a combination of quantitative and qualitative methods. After interacting with the data-centric explanations, participants were asked to rate their perceptions of system fairness using Likert-scale questions. Additionally, semi-structured interviews were conducted to gather in-depth insights into how and why participants perceived the systems' fairness based on the provided explanations.
Overall, the studies in our sample demonstrate that fairness is a multi-dimensional construct encompassing distributive, procedural, informational, and system fairness. Furthermore, our review indicates that using a mixed-method approach is common, combining quantitative ratings with qualitative insights to capture more nuanced reasoning about what explanation elements are helpful and why.
5.4 Miscellaneous
In addition to the more commonly used evaluation metrics, several studies in our sample employed additional measures to assess diverse aspects of AI system performance. These supplementary metrics help evaluate specific concerns and design goals related to XAI. In the following, we summarize the most important of these measures.
5.4.1. Diversity, novelty, and curiosity
Diversity, novelty, and curiosity were themes that some of the studies in our sample [30,37,56,78,133,147] addressed. One of the reasons for evaluating this topic is the risk that AI systems may reinforce filter bubbles and echo chambers, thereby limiting users' exposure to diverse perspectives and presenting them with familiar content. In discussing newsfeeds, Rader et al. [147] note that algorithmic curation in social media can contribute to a lack of information diversity, where users are shielded from alternative viewpoints. Similarly, Ngo et al. [30] mention that some participants perceive a risk that personalization might reduce diversity in their movie consumption. In user studies, diversity and novelty are often measured by self-reports. For example, Millecamp [56] addresses novelty in the context of music recommender systems, incorporating items in his questionnaire such as, “The recommender system helped me discover new songs”. In a similar fashion, Dominguez [37] operationalizes diversity in his study on art recommender systems with the item: “The art images recommended were diverse”. However, the provision of novel content aligns with the user's curiosity and willingness to seek out the new.
Curiosity plays a pivotal role in engaging with different viewpoints and unfamiliar content, and motivating users to explore AI systems. Hoffmann et al. [133], for instance, emphasize that curiosity plays a central role in motivating users to interact with explainable AI (XAI), as it is the main factor behind the desire for explanations. Hence, explanation design should incorporate novelty, surprise, or incongruity elements to stimulate curiosity. In this context, Hoffmann et al. [133] also outline a questionnaire to measure users' curiosity about AI systems, with items such as “I want to know what the AI just did” and “I want to know what the AI would have done if something had been different. I was surprised by the AI’s actions and want to understand what I missed”.
5.4.2. Persuasiveness, Plausibility, and Intention to Use
This section presents another theme explored in various studies [14,35,44,47,67,70,78]. Chromik et al. [14] define persuasiveness as the ability to convince the user to take a specific action. Similarly, Van der Waa describes the persuasive power of an explanation as its capacity to convince the user to follow the provided advice. The authors further emphasize that this definition of persuasive power is independent of the explanation's correctness. For this reason, persuasiveness must be distinguished from transparency and understandability, as the persuasive power of an explanation may lead to over-trust. In such cases, users may believe the system is correct, even when it is not, without fully understanding how it works [47] . This highlights the dual nature of persuasiveness in explainable AI (XAI): it is both a goal and a potential risk. On the one hand, if an explanation lacks persuasive power—meaning it does not influence user behavior—it suggests the explanation is irrelevant and provides no added value. On the other hand, as Papenmeier et al. [44] warn, users should not be misled by persuasive yet inaccurate explanations.
In our sample, persuasiveness was evaluated using both objective and subjective measures. Van der Waa [47], for instance, measured the construct by using behavioral metrics, assessing how often participants followed the advice given by the AI, regardless of its correctness. Similarly, Zang et al.[70] measured the switch percentage across different conditions of model information. Fügener et al. [77] also measured it objectively, evaluating whether users followed the AI system's recommendations.
Beyond behavioral changes, some studies interpret persuasiveness in terms of changes in belief or attitude. For instance, Deters [35] outlines that "if the user changes their mind after receiving an explanation, it is persuasive." From this stance, some studies in our sample employed subjective measures based on self-report surveys. In these cases, persuasiveness was most often evaluated based on how convincing users found the explanation. For example, Guesmi et al. [59] measured persuasiveness by the items, “this explanation is convincing”. Similarly, Deters' questionnaire included items like “the explanation is convincing” and “the recommendation or result is convincing”. Jin et al. [78] adopted a similar operationalization, assessing “how convincing AI explanations are to humans”. However, in their case, they used this measure to evaluate the plausibility of XAI explanations.
5.4.3 Intention to Use or Purchase
Intention to use or purchase [28,35,54,56,73,83] is also a theme addressed by some studies in our sample. Deters [35], for instance, understood purchase intention as a subconstruct of persuasiveness, arguing that convincing explanations will increase user acceptance and, in turn, enhance purchase intentions. Therefore, her persuasiveness questionnaire includes this subconstruct, asking participants to rate statements such as, “I would purchase the product I just chose if given the opportunity” and “I will use the system again if I need a tool like that”. In contrast, Kunkel et al. [73] consider it a subconstruct of trusting intentions, where trust in a recommender system is reflected by the user's intention to make a purchase, evaluating their willingness to buy something based Kunkel on the AI's recommendation. A slightly different approach is found in Kaur et al.'s study. Like Kunkel et al. [73] and Kaur et al.[28] view the intention to use a system as an indication of genuine trust. During the interviews, they asked participants to rate how much they believed the system was ready for use. However, this question primarily served as a method to encourage participants to reflect on the system seriously. By asking participants to explain their rating, the authors aimed to analyze how the users understood the system.
In other studies, [45,56,83], the intention to use is considered an independent theoretical construct. The construct refers to an individual's subjective likelihood or willingness to use a specific technology or system in the future. It typically serves as a proximal antecedent to actual system usage based on their beliefs and perceptions about the technology. In Liao's study [45], the construct is operationalized by asking participants if they would allow the system access to their currently used social media accounts. Also, Millecamp et al.[56] and Ooge et al. [54] operationalize the construct in terms of future usage, including statements like “I will use this recommender system again” (Millecamp et al. [56]) and “If I want to solve math exercises again, I will choose the system” (Ooge et al.[54]) in their post-task surveys.
5.4.4. Explanation Preferences
Explanation preferences have also been a focus in several evaluation studies, aiming to understand which explanation styles or types users prefer [65,74,75,76,92]. In most studies, various explanation styles or types were compared to determine user preferences. A common approach involved presenting users with one or more outputs, where different explanation concepts were available. Participants then evaluated these explanations and were asked to express their preferences. With regard to the experimental design, two approaches are common: In a between-subject design, different groups of participants are exposed to different explanation styles. In contrast, in the case of a within-subject design, all participants are exposed to multiple explanation styles simultaneously or in a (random) order.
Regarding preference assessment, two methods are commonly used: ranking-based and rating-based. Ranking-based methods require participants to rank the different explanation concepts, forcing them to prioritize their preferences by directly comparing explanations against one another. This method has higher ecological validity, as in real-life situations, users often must choose between options. However, ranking-based methods require a within-subject experiment, where ordering effects must also be considered. On the other hand, rating-based methods involve asking participants to rate each explanation independently on a Likert scale. This allows users to express their preference level, offering more nuanced insights. It also enables the use of between-subject experiments. In our sample, Naveed et al. [92] employed a rating-based approach and additionally asked open-ended questions about which system participants preferred and why.
In contrast, Jeyakumar et al. [74] used a ranking-based approach, where participants were asked to select which of the two available methods offered a better explanation for the provided model prediction. Similarly, Harrison et al. [75]asked participants whether they would choose an AI model or a human. Still, they used a 5-point Likert scale ranging from “definitely prefer the model” to “definitely prefer the human”.
Various studies also used evaluation measures specific to the respective context, such as debugging support, situational awareness, and learning or education. These measures aim to better understand how good explanations address particular needs and goals in a given context.
5.4.5. Debugging Support
This refers to the development context, where developers must understand complex AI systems, identify bugs, and improve models. In this regard, explanations should help users or engineers identify defects, localize system issues, and simplify bug detection and resolution [14,35]. Although debugging is a critical task, [35] points out that currently, only vague evaluation metrics exist, such as counting the number of user actions required to identify and fix a problem. In her work, she argues that such measures should be supplemented with self-reports, where a questionnaire covers aspects like “The explanations facilitate identifying errors” or "The explanations facilitate localizing and solving issues". Kulesza et al. [31] also adopt the term for the non-professional sector. They understand debugging as the process by which end users adjust an intelligent agent's behavior to better align with their personal preferences. In their study, they examine this issue by evaluating how effectively participants can modify the system's behavior. This is measured through users' satisfaction, cost/benefit perception, interaction time, and other relevant metrics.
5.4.6. Situational Awareness
Situational awareness is mentioned in some studies, mainly with regard to AI-supported decision-making in dynamic, collaborative environments [68]. The concept refers to the understanding of elements in the environment, including their meaning and the ability to predict their future status [148]. However, intelligent systems could threaten situational awareness, as automation may lead users to check out and become over trusting [68]. To evaluate the role of explanations within such a context, Schaffer et al. [68] and Paleja et al. [66], for instance, conducted experiments where participants worked with an AI-system to solve collaborative tasks. In their experimental design, one group used a system with explanations, while the control group used it without explanations. In both groups, situational awareness was measured. In Schaffer et al.’s [68] study, situational awareness was assessed by measuring how accurately participants could predict the behavior of their co-players in a game. Similarly, Paleja et al. [66] used the Situation Awareness Global Assessment Technique (SAGAT) [148] where participants were prompted at random points during a task with a series of fact-based questions to assess their knowledge of the current situation.
5.4.7. Learning and Education
This construct refers to the goal that explanations enable users to generalize and learn [14,58]. This is implicitly addressed by Hoffmann et al. [133]when they say that explanations should seek the universal human need to educate oneself and learn new things. This can also be an essential goal of XAI applications in a specific context. One example is Tsai's study on an AI-supported online symptom checker. In their study, explanations should not only help people better understand the system but also improve their knowledge of the symptoms and the disease. To measure the learning effects after using the system, they administered a questionnaire with two items: “The app helps me to better communicate COVID-19 related information with others” and “The app helps me to learn COVID-19 related information”.
6. Evaluation Procedure
Evaluation procedures in XAI typically utilize a mix of both qualitative and quantitative methods, including user studies, surveys, and metrics, to assess the effectiveness of explanations. The idea is to implement controlled experiments by recruiting a representative sample of end users, domain experts, or proxy users to participate in the evaluation, ensuring varied perspectives and experiences. Figure 3 shows the elements of the evaluation procedure.
6.1 Sampling and Participants
The study design and participant recruitment present a key issue for the quality, validity, and transferability of empirical studies. Ideally, the study design reflects a real-world setting, and the sample will be a representative cross-section of the target population. If this representativeness is lacking, there's a risk that the findings may not be generalizable, conclusions may be incorrect, and recommendations may be misguiding. Ensuring a representative sample is, therefore, fundamental to the reliability and applicability of a study's results.
In this context, the distinction between proxy-user and real-user studies has become prevalent in the literature [149].
Real-User: These participants belong directly to the target group being studied and reflect their needs, motivations, experiences, competencies, and practices of the target group.
Proxy-User: These are substitute participants who are not directly part of the target group. They do not fully embody the authentic needs, competencies, motivations, and behaviors of the intended users but act as their representatives.
6.1.1. Real-User Studies
In our sample, only some studies were conducted with participants of the addressed target group [27,28,29,36,44,46,53,63,66,69,72,74,88,106]. Most of these studies were domain-driven research conducted in the consumer sector, the academic/technical field, and the healthcare sector.
The prevalence of real-user studies in the consumer domain is attributed to the ease of recruiting participants from widely used, mass-market systems. For example, in studies focusing on streaming and social media recommendation algorithms, Kunkel et al. [73] recruited users of Amazon Prime, Ngo et al. [30] engaged Netflix users, and Rader et al. [53] involved Facebook users. Alizadeh et al. [27] focused on Instagram users impacted by a service ban. Similarly, in studies of driver assistance systems and drawing software, respectively, the target groups of Colley et al. [69] and Cai et al.
[46] belonged to mass markets. In summary, the high proportion of studies with real users in this domain can be explained by the widespread adoption of these systems, which facilitates the recruitment of real users. A special case arises when the target group is the general public, such as in studies concerning the perception of fair decision-making [33]. In this context, recruiting "real users" is straightforward since everyone belongs to the target population.
In the academic/technical domain, the reason for the prominence of real-user studies results from the close proximity between researchers and participants. Although the evaluated systems do not represent a mass market, the target group is part of the researchers' social environment. For instance, Ooge et al. [54] evaluated e-learning platforms, Guesmi et al. [59] focused on a science literature recommender, and Kaur et al. [28] examined data scientists work practices, where the convenience sampling method presents an easy-to-implement recruiting method. This practice is largely due to the proximity of the domain to the researchers' own field, facilitating easier access to target groups like students, researchers, and technicians. These studies highlight a significant representation of real user studies, but the ease of recruitment is a key factor influencing this trend.
The situation in the healthcare domain is distinct. In contrast to the previous cases, gaining access to the target group in this domain is not straightforward. Challenges are common in reaching the desired participants, which include medical professionals such as doctors, nurses, paramedics, and emergency service providers. Examples of this include Holzinger et al. [42] and Cabitza et al. [88], who involved a medical doctor from a hospital. In contrast to studies using proxy users, these real-user studies often have fewer participants. They prioritize addressing the specific needs, skills, and preferences of the target group, unlike large-scale evaluations that rely on proxy users.
6.1.2. Proxy-User Studies
Most of the studies in our sample recruited proxy users [5,8,14,28,31,32,35,37,38,40,41,47,48,49,50,55,58,59,62,67,68,75,77,89,90]. This especially holds for mehodology-driven [30,31,40] as well as for concept-driven research [5,28,31,32,34,37,49,51,52,62,67,68,73,75,77,89,90,97].
For instance, proxy users were recruited in studies that compare the effectiveness of various explanation methods, evaluate novel explanation concepts, or evaluate the general role of explanations within the decision-making process, enhancing human-AI collaboration and improving human performance with AI assistance [32,34,41,49,59,62,67,75,89,97].
Moreover, proxy user studies are prevalent when general effects on the understanding, mental models, perception, preferences, attitudes, and behavior of users are evaluated. Regarding domain-driven studies, some researchers adopted a proxy-user approach for pragmatic research reasons when they assume that this does not cause any significant bias [50,53,54]. The goal of utilizing such an approach was to simplify the recruiting process, better control environmental conditions, and increase the number of participants for statistical reasons. In some cases, [48,69,75], neither the addressed target group nor the applied sampling method was described in detail, which is why we have not classified these studies.
A common proxy-user recurring method was the use of paid online panels and crowd workers. In our sample, 23 studies utilized Amazon Mechanical Turk (MTurk), while 4 studies used Prolific for this reason. A few proxy-user studies and other sampling methods are typically based on convenience and snowball sampling techniques. These studies recruited their participants through word-of-mouth, personal contacts, or asking people from the local community [34,70,73], using internal university mailing lists [14], posters around university campuses [34], or recruiting participants via social media [73].
Compared to real-user studies, proxy user studies tend to involve a larger number of participants. This is particularly evident in studies using paid crowd worker samples, where the average number of participants across the 23 studies in our sample was 764 (SD = 1147). The high SD value reflects considerable variation in sample sizes across the studies. In contrast, convenience sampling studies had a smaller average number of participants (mean = 56, SD = 44).4
6.2 Evaluation Methods
- Measurement methods can be classified by various criteria such as qualitative/quantitative or objective/subjective measures [14]. In HCI, a widespread categorization distinct between interviews, observations, questionnaires, and mixed methods [13]. In the following we briefly summarize how these methods have been adopted in XAI evaluation research.
6.2.1. Interviews
Interviews are a common evaluation method in HCI used to gather information by asking people about their knowledge, experiences, opinions, or attitudes [13,150]. Interviews are qualitative by nature, offering a high degree of flexibility ranging from very structured to open-ended [150]. In user research, semi-structured interviews are the most prominent type [13,151]. They are used, for instance, to study people’s mental models and perception of the AI system and the explanation provided [27,106]. Interviews are also used for formative evaluation of prototypically designed explanation systems or the contextual inquiry of the application domain, where these systems should be used [28,79]. In evaluation research, interviews are used in mixed methodologies to develop quantitative metrics based on qualitative data or, conversely, to enrich, contextualize, and better interpret quantitative results [55,79,152].
In our sample, interviews as a methodology used by some studies [27,28,30,31,55,59]. In these studies, interviews are usually conducted with a small group of participants. As Table 1 shows, a striking feature is that almost all real-user evaluations are interview studies or open-ended surveys. For instance, Alizadeh et al. [27] interviewed people affected by an action ban, and Kaur et al. [28] interviewed data scientists using XAI tools such as SHAP. By its very nature, the interview studies are qualitative, focusing on the evaluation of perceived properties of the explanatory systems rather than quantifying their impact on user behavior. For instance, Kaur et al. [28] use interviews to understand the meaning of XAI tools for the data scientist. Alizadeh et al. [27] use this methodology to understand the perception of affected persons regarding explanations given by service providers, Naveed et al. [55] interview potential Robo-Advisor users about what kind of explanations they like to get from such a system.
6.2.2. Observations
Observations are a vital methodological approach allowing researchers to systematically watch and record behaviors and events in various settings [13,151]. They can be used in qualitative settings such as thinking-aloud sessions. Yet, observations are primarily employed to measure quantifiable aspects such as task completion times and interaction metrics.
In our sample, for instance, Millecamp et al. [39] recorded interaction logs of study participants’ interaction with interface components that were captured using mouse clicks together with their timestamps to measure task performance objectively. In a similar way, Cai et al.[46], logged time spent on each explanation page to determine how different explanations require varying amounts of time for mental processing. Narayanan et al. [49] recorded the response time metric, measured as the number of seconds from when the task was displayed until the participant hit the submit button on the interface.
Observation studies, although less prone to biases than self-reports [153], can be time-consuming and cannot directly assess subjective experiences, such as thoughts or attitudes [154]. Nonetheless, innovative methodologies are emerging that leverage external observations to infer internal states, such as stress and emotional responses, further enriching the understanding of user experiences in Human-computer interaction [10,155]. This dual approach enhances the robustness of findings and deepens insights into how users engage with AI system and their explanations.
6.2.3. Questionnaires
Questionnaires are used to obtain quantitative values about people’s knowledge, experiences, opinions, or attitudes in a comparable way. They present the most used data collection method in positivistic research [156]. This also holds for our sample, where most studies have used a questionnaire evaluation method (see Table 1).
The evaluation theory pinpoints that questionnaires as measurement instruments should be equally anchored in formal theories, such as classical test theory (CTT) and item response theory (IRT) [26], as well as in the respective substance or object theories, such as explanation theories [5,101] or adopting theories from other disciplines [157]. The entities given by substance theories must be operationalized, making them measurable, where psychometric research has provided several methods to ensure that these results in measures are valid, reliable, and objective [26,106]. While using questionnaires has become a common practice in XAI evaluation, chapter 5 shows that about a rigor questionnaire design, the XAI research is less mature compared to other disciplines, including the explication of theoretical constructs used in questionnaires, how they are operationalized, and psychometrically validated. Instead, in our sample the use of ad hoc questionnaires remains a widespread practice.
As Table 1 shows, all three evaluation methodologies (interviews, observation, and questionnaires) are utilized as a single method or in combination as a mixed-method approach to gather the needed data for the evaluation.
6.2.4. Mixed-Methods Approach
The mixed-methods evaluation approach is gaining traction in recent XAI research due to its ability to provide a comprehensive understanding of both quantitative and qualitative aspects of user interaction with AI systems. This is also evident by our sample literature as shown in Table 1, where many of the XAI studies have implied mixed-method approach. For instance, Naveed et al. [55] have used a mixed-method approach that supplements the qualitative focus group discussions with a quantitative online survey. Millecamp et al. [39] have used both qualitative and quantitative metrics in their study which included likert-scale questionnaire items, open-ended questions, and interaction log outputs.
The idea behind this approach is to combine numerical data analysis, often derived from user performance metrics or surveys, with qualitative insights gathered from interviews or open-ended discussions, enabling researchers to capture the complexities and underlying aspects of user experiences and perceptions [158]. For example, quantitative assessments can evaluate how well XAI systems’ explanations enhance user decision-making, while qualitative insights offer a deeper understanding of user satisfaction and the clarity of AI outputs [159]. By combining these approaches, researchers can tackle the diverse challenges associated with XAI more effectively, resulting in designs that prioritize user needs and foster greater transparency in AI systems [160]. This holistic perspective is essential for advancing the field, as it facilitates the identification of not only the technical performance of XAI systems but also the subjective experiences of the users interacting with them.
7. Discussion: Pitfalls and Guidelines for planning and conducting XAI evaluation
This work provides a comprehensive literature review analysis of XAI evaluation studies with an aim to provide guiding principles for planning and conducting XAI evaluation studies from a user perspective.
For this purpose, we outline key elements and considerations for planning and setting up an extensive XAI evaluation. We argue that establishing clear guiding principles is essential for maintaining the focus on user needs and ensuring that the study aligns with the evaluation goals. However, overly rigid principles can hinder the flexibility needed to adapt to user feedback and evolving user requirements [16]. Figure 4 presents key elements as part of the XAI design guiding principles, which we describe below.
A first step in XAI evaluation study is to define clear objectives of the evaluation study i.e., specify what should be measured, by distinguishing between concept evaluation (theoretical assessment), domain evaluation (practical implementation or improving a specific application), and methodological evaluation (focusing on evaluation metrics and frameworks). Concept-driven evaluations involve theoretical aspects and introduce innovative models and interfaces to enhance explainability, aiming to bridge gap between theoretical frameworks and practical implementations. Such evaluations often employ novel concepts like example-based explanations and interactive explanations to enhance the user understanding and satisfaction of the AI system. Whereas domain-driven evaluation applies these methods to specific fields and areas such as, healthcare, finance, e-commerce etc., demonstrating how tailored and personalized explanations can enhance trust, transparency, and decision-making in practical and real-world scenarios.
Our survey reveals that concept-driven research frequently encounters difficulties with relevancy and ecological validity, especially when trying to ensure that theoretical concepts are applicable to real-world scenarios. In contrast, domain-driven research faces challenges with maintaining rigor and achieving generalizability of results. To obtain deeper insights into specific contexts, domain-driven research often relies on less rigorous qualitative, exploratory methods, typically conducted in practical settings where full control is impossible. Balancing trade-offs between rigor and relevance is a critical challenge for both research approaches.
Guidelines: The guideline is to carefully consider the tension between rigor and relevance from the very beginning when planning an evaluation study, as it influences both the evaluation scope, and the methods used.
|
Furthermore, XAI evaluation studies can have different scope which includes defining the domain, target group, and evaluation context/test scenario. HCI as well as AI stress the importance of understanding the specific needs and context of the target user group and application to ensure that the explanations are contextually relevant and user specific. This ensures that the explanations provided are contextually relevant and tailored to the users’ needs and requirements [1]. Understanding the specific requirements and characteristics of different user groups is essential for defining the domain and target group.
|
Pitfalls: A common pitfall in many evaluation studies is not to define the target domain, group, and context explicitly. This lack of explication negatively affects both the planning of the study and the broader scientific community.: During the planning phase, this complicates the formulation of test scenarios, recruitment strategies, and predictions regarding the impact of pragmatic research decisions (e.g., using proxy users instead of real users, or evaluating a click-dummy instead of a fully functional system, using toy examples instead of real-world scenarios, etc.). During the publication phase, the missing explication impede to assess the study's scope of validity and its reproducibility. Without clearly articulating the limitations imposed by early decisions—such as the choice of participants, test conditions, or simplified test scenarios—the results may be seen as less robust or generalizable. Guidelines: The systematic planning of an evaluation study should include a clear and explicit definition of the application domain, target group, and use context of the explanation system. This definition should be as precise as possible. However, an overly narrow scope may restrict the generalizability of the research findings, while a broader scope could reduce the focus of the study, informing the systematic implantation, and the relevancy of the findings [161]. Striking the right balance is essential to ensure both meaningful insights and the potential applicability of the results across different contexts. |
Additionally, methodological evaluations focus on creating and employing reliable and valid metrics to assess the explainability of AI systems. The heterogeneity of application domains' use contexts and explanation demands rules out a one-size-fits-all evaluation approach that can be applied to all cases [10]. Moreover, explanations can have multiple effects and are often designed to achieve multiple effects, such as enhancing understandability, improving task performance, increasing user satisfaction, and building trust. Therefore, it is essential to specify what the measurement objects and metrics of the study are and how they need to be evaluated. This includes any object, phenomenon, concept, or property of interest that the study aims to quantify for evaluating the effectiveness of XAI.
|
Pitfalls: A common pitfall in many evaluation studies to use of ad hoc questionnaires instead of standardized. This lack of explication has negative impact for study planning as well as the scientific community: During the planning phase, creating ad-hoc questionnaires adds to the cost, particularly when theoretical constructs are rigorously operationalized including pre-testing the questionnaires and validating it psychometrically. During the publication phase, using non-standardized questionnaires complicate reproducibility, comparability, and the assessment of the validity of the study. Guidelines: Regarding the definition of measurement constructs:
|
Finally, defining a study procedure is vital for implementing and conducting the evaluation. This involves determining the genuine reflection that the study captures a representative sample user population) and data gathering methodologies (ensuring that the collected data are reliable and valid) [162]. A detailed and well-defined procedure helps replicate the evaluation to verify the results. However, overly rigid procedures can limit the ability to adapt to new insights and user feedback. According to Hoffman et al. [33], balancing structure with flexibility is key to practical XAI evaluation.
Guidelines: Essentially, there are three types of methods:
|
The sampling method is another essential factor to consider. In addition to convenience and snowball sampling, the use of crowd workers has become a popular approach due to its time and cost efficiency. However, using paid online panels often implicitly involves the decision to conduct the study with proxy users, a choice that should be made carefully. While proxy-user studies offer certain advantages, relying on a proxy-user sample can have significant implications for the external validity of the study. Although proxy users are often employed as a practical solution when accessing the actual target group is difficult, their use may limit the generalizability of the findings. Since proxy users are substitutes for the intended participants, their involvement may lead to skewed or unrepresentative results.
This misalignment can be especially pronounced in studies involving complex systems like explainable AI, where nuanced user interactions and perceptions are critical. Conversely, incorporating real users into a study enhances its external validity. This authentic engagement of real users affected by AI systems in real-world settings ensures that the findings genuinely reflect the target audience's experiences with the system, thus offering more reliable and actionable insights. Still, proxy users are often a necessity in certain research contexts. For example, when evaluating mock-ups or nascent systems for which there is no existing user base, proxy users offer the only feasible means of testing and feedback. Similarly, in studies focused not on specific applications but on general concepts, proxy users can provide valuable, albeit generalized, insight [61,79]. Also, in cases where the target group comprises a limited number of domain experts who are unavailable for the study, proxy users with comparable domain knowledge and expertise can offer a viable alternative. However, it's essential to acknowledge that while they can simulate the role of the target group, their perspectives might not fully align with those of the actual users. Furthermore, logistical factors such as cost, time, and organizational complexity often necessitate the use of proxy users.
|
Pitfalls: Real and proxy user sampling each come with their own set of advantages and disadvantages. A real-user approach is particularly challenging in niche domains beyond the mass market, especially where AI systems address sensitive topics or affect marginalized or hard-to-reach populations. Key sectors in this regard include healthcare, justice, and finance, where real-user studies typically have smaller sample sizes due to the specific conditions of the domain and the unique characteristics of the target group. Conversely, the availability of crowd workers and online panel platforms simplifies the recruitment process for proxy-user studies, enabling larger sample sizes. While recruiting proxy users can be beneficial for achieving a substantial sample size and sometimes essential for gathering valuable insights, researchers must be mindful of the limitations and potential biases this approach introduces. It is crucial to carefully assess how accurately proxy users represent the target audience and to interpret the findings considering these constraints. Relying on proxy users, rather than real users from the target group, can be viewed as a compromise often driven by practical considerations. However, the decision using proxy-users are often made by pragmatically reasons only without considering the implications for the study design and the applicability of research findings to real-world scenarios. Guidelines: The sampling method has serious impact on the study results. Sometimes, a small sample with real users could let to more valid result than large sample studies with proxy-users. Therefore, the decision sampling method should be done intentionally, balancing the statistically required sample size, contextual relevance, and ecological validity, along with the practicalities of conducting the study in a time- and cost-efficient manner. In addition, researchers should articulate the rationale behind the sampling decision, as well as the implications for the study design and the limitations of the findings. |
The final step presents the analysis of gathered data, where also guidelines exists, such as thematic analysis for qualitative data or statistical evaluation for quantitative data. However, these are beyond the scope of this paper, as we have focused on the methodological aspects of planning and conducting empirical evaluation studies.
8. ConclusionS
This work emphasized the need for a systematic and human-centered approach to XAI evaluation. It highlights that while advancements have been made in developing AI model that generate explanations, the empirical evaluation of these systems remains fragmented. The paper suggests that a standardized framework is essential for assessing not only the technical fidelity of AI explanations but also their practical usefulness, particularly user understandability, usability, and integrity.
The literature analysis shows that XAI evaluations must integrate multiple perspectives ― to fully capture the complexity of AI-user interactions. The paper also points out the lack of rigor in many current studies, especially regarding the operationalization of constructs. Without standardized metrics and robust methodologies, comparisons across studies remain difficult, and the generalizability of findings is limited.
Our analysis calls for a more rigorous, structured, and standardized approach to XAI evaluation that address both domain-specific and generalizable user needs. It advocated for interdisciplinary collaboration, drawing on human-computer interaction, psychology, and AI to create more reliable and effective evaluation methods that contribute to the broader adoption and trust of AI systems in real-world applications.
| 1 | |
| 2 | Plausability measures how convincing AI explanation is to humans. Typically measured in terms of quantitative metrics such as feature localization or feature correlation. |
| 3 | As outline in previous section, this approach also used as a metric to measure understandability indirectly. |
| 4 |
References
- A. Abdul, J. Vermeulen, D. Wang, B. Y. Lim, and M. Kankanhalli, “Trends and Trajectories for Explainable, Accountable and Intelligible Systems: An HCI Research Agenda,” in Proceedings of the 2018 CHI Conference on Human Factors in Computing Systems, in CHI ’18. New York, NY, USA: Association for Computing Machinery, 2018, pp. 1–18. [CrossRef]
- B. Shneiderman, “Human-Centered Artificial Intelligence: Reliable, Safe & Trustworthy,” Int J Hum Comput Interact, vol. 36, no. 6, pp. 495–504, 2020. [CrossRef]
- F. Doshi-Velez and B. Kim, “Towards A Rigorous Science of Interpretable Machine Learning,” arXiv: Machine Learning, 2017, [Online]. Available: https://api.semanticscholar.org/CorpusID:11319376.
- T. Herrmann and S. Pfeiffer, “Keeping the organization in the loop: a socio-technical extension of human-centered artificial intelligence,” AI Soc, vol. 38, no. 4, pp. 1523–1542, 2023. [CrossRef]
- G. Vilone and L. Longo, “Notions of explainability and evaluation approaches for explainable artificial intelligence,” Information Fusion, vol. 76, pp. 89–106, 2021. [CrossRef]
- A. Barredo Arrieta et al., “Explainable Artificial Intelligence (XAI): Concepts, taxonomies, opportunities and challenges toward responsible AI,” Information Fusion, vol. 58, pp. 82–115, 2020. [CrossRef]
- D. Gunning and D. Aha, “DARPA’s Explainable Artificial Intelligence (XAI) Program,” AI Mag, vol. 40, no. 2, pp. 44–58, Jun. 2019. [CrossRef]
- I. Nunes and D. Jannach, “A systematic review and taxonomy of explanations in decision support and recommender systems,” User Model User-adapt Interact, vol. 27, no. 3, pp. 393–444, 2017. [CrossRef]
- L. H. Gilpin, D. Bau, B. Z. Yuan, A. Bajwa, M. Specter, and L. Kagal, “Explaining Explanations: An Overview of Interpretability of Machine Learning,” in 2018 IEEE 5th International Conference on Data Science and Advanced Analytics (DSAA), 2018, pp. 80–89. [CrossRef]
- J. Zhou, A. H. Gandomi, F. Chen, and A. Holzinger, “Evaluating the Quality of Machine Learning Explanations: A Survey on Methods and Metrics,” Electronics (Basel), vol. 10, no. 5, 2021. [CrossRef]
- A. Nguyen and M. R. Martínez, “MonoNet: Towards Interpretable Models by Learning Monotonic Features,” May 2019, [Online]. Available: http://arxiv.org/abs/1909.13611.
- A. Rosenfeld, “Better Metrics for Evaluating Explainable Artificial Intelligence,” in Adaptive Agents and Multi-Agent Systems, 2021. [Online]. Available: https://api.semanticscholar.org/CorpusID:233453690.
- H. Sharp, J. Preece, and Y. Rogers, Interaction design: Beyond human-computer interaction . jon wiley & sons. Inc, 2002.
- M. Chromik and M. Schuessler, “A Taxonomy for Human Subject Evaluation of Black-Box Explanations in XAI,” in ExSS-ATEC@IUI, 2020. [Online]. Available: https://api.semanticscholar.org/CorpusID:214730454.
- S. Mohseni, J. E. Block, and E. Ragan, “Quantitative Evaluation of Machine Learning Explanations: A Human-Grounded Benchmark,” in 26th International Conference on Intelligent User Interfaces, in IUI ’21. New York, NY, USA: Association for Computing Machinery, 2021, pp. 22–31. [CrossRef]
- F. Doshi-Velez and B. Kim, “Towards a rigorous science of interpretable machine learning,” arXiv preprint arXiv:1702.08608, 2017.
- A. Adadi and M. Berrada, “Peeking Inside the Black-Box: A Survey on Explainable Artificial Intelligence (XAI),” IEEE Access, vol. 6, pp. 52138–52160, 2018. [CrossRef]
- S. Anjomshoae, A. Najjar, D. Calvaresi, and K. Främling, “Explainable Agents and Robots : Results from a Systematic Literature Review,” in AAMAS ’19: Proceedings of the 18th International Conference on Autonomous Agents and MultiAgent Systems : , in Proceedings. International Foundation for Autonomous Agents and MultiAgent Systems, 2019, pp. 1078–1088. [Online]. Available: http://www.ifaamas.org/Proceedings/aamas2019/pdfs/p1078.pdf.
- M. Nauta et al., “From Anecdotal Evidence to Quantitative Evaluation Methods: A Systematic Review on Evaluating Explainable AI,” ACM Comput. Surv., vol. 55, no. 13s, Jul. 2023. [CrossRef]
- A. Barredo Arrieta et al., “Explainable Explainable Artificial Intelligence (XAI): Concepts, taxonomies, opportunities and challenges toward responsible AI,” Information Fusion, vol. 58, pp. 82–115, May 2020. [CrossRef]
- T. Miller, “Explanation in artificial intelligence: Insights from the social sciences,” Artif Intell, vol. 267, pp. 1–38, 2019. [CrossRef]
- F. Doshi-Velez and B. Kim, “Towards A Rigorous Science of Interpretable Machine Learning,” in arXiv preprint arXiv:1702.08608, 2017.
- M. ’Nauta et al., “From Anecdotal Evidence to Quantitative Evaluation Methods: A Systematic Review on Evaluating Explainable AI,” ACM Comput Surv, vol. 55, no. 13, pp. 1–42, 2023.
- mark S. Litwin, How to measure survey reliability and validity, vol. 7. Sage, 1995.
- DeVellis, F. Robert, and T. T. Carolyn, Scale development: Theory and applications. Sage, 2003.
- T. Raykov and G. A. Marcoulides, Introduction to Psychometric Theory, 1st ed. Routledge, 2010.
- F. Alizadeh, G. Stevens, and M. Esau, “An Empirical Study of Folk Concepts and People’s Expectations of Current and Future Artificial Intelligence,” i-com, vol. 20, no. 1, pp. 3–17, 2021. [CrossRef]
- H. Kaur, H. Nori, S. Jenkins, R. Caruana, H. Wallach, and J. Wortman Vaughan, “Interpreting Interpretability: Understanding Data Scientists’ Use of Interpretability Tools for Machine Learning,” in Proceedings of the 2020 CHI Conference on Human Factors in Computing Systems, in CHI ’20. New York, NY, USA: Association for Computing Machinery, 2020, pp. 1–14. [CrossRef]
- V. Lai, H. Liu, and C. Tan, “‘Why is “Chicago” deceptive?’ Towards Building Model-Driven Tutorials for Humans,” in Proceedings of the 2020 CHI Conference on Human Factors in Computing Systems, in CHI ’20. New York, NY, USA: Association for Computing Machinery, 2020, pp. 1–13. [CrossRef]
- T. Ngo, J. Kunkel, and J. Ziegler, “Exploring Mental Models for Transparent and Controllable Recommender Systems: A Qualitative Study,” in Proceedings of the 28th ACM Conference on User Modeling, Adaptation and Personalization, in UMAP ’20. New York, NY, USA: Association for Computing Machinery, 2020, pp. 183–191. [CrossRef]
- T. Kulesza, S. Stumpf, M. Burnett, S. Yang, I. Kwan, and W.-K. Wong, “Too much, too little, or just right? Ways explanations impact end users’ mental models,” in 2013 IEEE Symposium on Visual Languages and Human Centric Computing, 2013, pp. 3–10. [CrossRef]
- R. Sukkerd, “Improving Transparency and Intelligibility of Multi-Objective Probabilistic Planning,” May 2022. [CrossRef]
- R. R. Hoffman, S. T. Mueller, G. Klein, and J. Litman, “Metrics for Explainable AI: Challenges and Prospects,” 2019.
- A. I. Anik and A. Bunt, “Data-Centric Explanations: Explaining Training Data of Machine Learning Systems to Promote Transparency,” in Proceedings of the 2021 CHI Conference on Human Factors in Computing Systems, in CHI ’21. New York, NY, USA: Association for Computing Machinery, 2021. [CrossRef]
- D. Hannah, “Criteria and Metrics for the Explainability of Software.,” Gottfried Wilhelm Leibniz Universität Hannover, 2022.
- L. Guo, E. M. Daly, O. Alkan, M. Mattetti, O. Cornec, and B. Knijnenburg, “Building Trust in Interactive Machine Learning via User Contributed Interpretable Rules,” in Proceedings of the 27th International Conference on Intelligent User Interfaces, in IUI ’22. New York, NY, USA: Association for Computing Machinery, 2022, pp. 537–548. [CrossRef]
- V. Dominguez, P. Messina, I. Donoso-Guzmán, and D. Parra, “The effect of explanations and algorithmic accuracy on visual recommender systems of artistic images,” in Proceedings of the 24th International Conference on Intelligent User Interfaces, in IUI ’19. New York, NY, USA: Association for Computing Machinery, 2019, pp. 408–416. [CrossRef]
- J. Dieber and S. Kirrane, “A novel model usability evaluation framework (MUsE) for explainable artificial intelligence,” Information Fusion, vol. 81, pp. 143–153, 2022. [CrossRef]
- M. Millecamp, N. N. Htun, C. Conati, and K. Verbert, “To explain or not to explain: the effects of personal characteristics when explaining music recommendations,” in Proceedings of the 24th International Conference on Intelligent User Interfaces, in IUI ’19. New York, NY, USA: Association for Computing Machinery, 2019, pp. 397–407. [CrossRef]
- Z. Buçinca, P. Lin, K. Z. Gajos, and E. L. Glassman, “Proxy tasks and subjective measures can be misleading in evaluating explainable AI systems,” in Proceedings of the 25th International Conference on Intelligent User Interfaces, in IUI ’20. New York, NY, USA: Association for Computing Machinery, 2020, pp. 454–464. [CrossRef]
- H.-F. Cheng et al., “Explaining Decision-Making Algorithms through UI: Strategies to Help Non-Expert Stakeholders,” in Proceedings of the 2019 CHI Conference on Human Factors in Computing Systems, in CHI ’19. New York, NY, USA: Association for Computing Machinery, 2019, pp. 1–12. [CrossRef]
- A. Holzinger, A. Carrington, and H. Müller, “Measuring the Quality of Explanations: The System Causability Scale (SCS),” KI - Künstliche Intelligenz, vol. 34, no. 2, pp. 193–198, 2020. [CrossRef]
- J. Weina and G. Hamarneh, “The XAI alignment problem: Rethinking how should we evaluate human-centered AI explainability techniques,” in arXiv preprint, 2023.
- A. Papenmeier, G. Englebienn, and C. Seifert, “How model accuracy and explanation fidelity influence user trust,” 2019.
- M. Liao and S. S. Sundar, “How Should AI Systems Talk to Users when Collecting their Personal Information? Effects of Role Framing and Self-Referencing on Human-AI Interaction,” in Proceedings of the 2021 CHI Conference on Human Factors in Computing Systems, in CHI ’21. New York, NY, USA: Association for Computing Machinery, 2021. [CrossRef]
- C. J. Cai, J. Jongejan, and J. Holbrook, “The effects of example-based explanations in a machine learning interface,” in Proceedings of the 24th International Conference on Intelligent User Interfaces, in IUI ’19. New York, NY, USA: Association for Computing Machinery, 2019, pp. 258–262. [CrossRef]
- J. van der Waa, E. Nieuwburg, A. Cremers, and M. Neerincx, “Evaluating XAI: A comparison of rule-based and example-based explanations,” Artif Intell, vol. 291, p. 103404, 2021. [CrossRef]
- F. Poursabzi-Sangdeh, D. G. Goldstein, J. M. Hofman, J. W. Wortman Vaughan, and H. Wallach, “Manipulating and Measuring Model Interpretability,” in Proceedings of the 2021 CHI Conference on Human Factors in Computing Systems, in CHI ’21. New York, NY, USA: Association for Computing Machinery, 2021. [CrossRef]
- M. Narayanan, E. Chen, J. He, B. Kim, S. Gershman, and F. Doshi-Velez, “How do humans understand explanations from machine learning systems? an evaluation of the human-interpretability of explanation,” 2018.
- H. Liu, V. Lai, and C. Tan, “Understanding the Effect of Out-of-distribution Examples and Interactive Explanations on Human-AI Decision Making,” Proc. ACM Hum.-Comput. Interact., vol. 5, no. CSCW2, Oct. 2021. [CrossRef]
- P. Schmidt and F. Biessmann, “Quantifying Interpretability and Trust in Machine Learning Systems,” arXiv preprint arXiv:1901.08558, 2019.
- N. and R. V. V. and F. R. and R. O. Kim Sunnie S. Y. and Meister, “HIVE: Evaluating the Human Interpretability of Visual Explanations,” in Computer Vision – ECCV 2022, G. and C. M. and F. G. M. and H. T. Avidan Shai and Brostow, Ed., Cham: Springer Nature Switzerland, 2022, pp. 280–298.
- E. Rader, K. Cotter, and J. Cho, “Explanations as Mechanisms for Supporting Algorithmic Transparency,” in Proceedings of the 2018 CHI Conference on Human Factors in Computing Systems, in CHI ’18. New York, NY, USA: Association for Computing Machinery, 2018, pp. 1–13. [CrossRef]
- J. Ooge, S. Kato, and K. Verbert, “Explaining Recommendations in E-Learning: Effects on Adolescents’ Trust,” in Proceedings of the 27th International Conference on Intelligent User Interfaces, in IUI ’22. New York, NY, USA: Association for Computing Machinery, 2022, pp. 93–105. [CrossRef]
- S. Naveed, D. R. Kern, and G. Stevens, “Explainable Robo-Advisors: Empirical Investigations to Specify and Evaluate a User-Centric Taxonomy of Explanations in the Financial Domain,” in IntRS@RecSys, 2022, pp. 85–103.
- M. Millecamp, S. Naveed, K. Verbert, and J. Ziegler, “To Explain or not to Explain: the Effects of Personal Characteristics when Explaining Feature-based Recommendations in Different Domains,” in IntRS@RecSys, 2019. [Online]. Available: https://api.semanticscholar.org/CorpusID:203415984.
- S. Naveed, B. Loepp, and J. Ziegler, “On the Use of Feature-based Collaborative Explanations: An Empirical Comparison of Explanation Styles,” in Adjunct Publication of the 28th ACM Conference on User Modeling, Adaptation and Personalization, in UMAP ’20 Adjunct. New York, NY, USA: Association for Computing Machinery, 2020, pp. 226–232. [CrossRef]
- C.-H. Tsai, Y. You, X. Gui, Y. Kou, and J. M. Carroll, “Exploring and Promoting Diagnostic Transparency and Explainability in Online Symptom Checkers,” in Proceedings of the 2021 CHI Conference on Human Factors in Computing Systems, in CHI ’21. New York, NY, USA: Association for Computing Machinery, 2021. [CrossRef]
- M. Guesmi et al., “Explaining User Models with Different Levels of Detail for Transparent Recommendation: A User Study,” in Adjunct Proceedings of the 30th ACM Conference on User Modeling, Adaptation and Personalization, in UMAP ’22 Adjunct. New York, NY, USA: Association for Computing Machinery, 2022, pp. 175–183. [CrossRef]
- S. Naveed, T. Donkers, and J. Ziegler, “Argumentation-Based Explanations in Recommender Systems: Conceptual Framework and Empirical Results,” in Adjunct Publication of the 26th Conference on User Modeling, Adaptation and Personalization, in UMAP ’18. New York, NY, USA: Association for Computing Machinery, 2018, pp. 293–298. [CrossRef]
- M. T. Ford Courtney and Keane, “Explaining Classifications to Non-experts: An XAI User Study of Post-Hoc Explanations for a Classifier When People Lack Expertise,” in Pattern Recognition, Computer Vision, and Image Processing. ICPR 2022 International Workshops and Challenges, B. Rousseau Jean-Jacques and Kapralos, Ed., Cham: Springer Nature Switzerland, 2023, pp. 246–260.
- G. Bansal et al., “Does the Whole Exceed its Parts? The Effect of AI Explanations on Complementary Team Performance,” in Proceedings of the 2021 CHI Conference on Human Factors in Computing Systems, in CHI ’21. New York, NY, USA: Association for Computing Machinery, 2021. [CrossRef]
- D. H. Kim, E. Hoque, and M. Agrawala, “Answering Questions about Charts and Generating Visual Explanations,” in Proceedings of the 2020 CHI Conference on Human Factors in Computing Systems, in CHI ’20. New York, NY, USA: Association for Computing Machinery, 2020, pp. 1–13. [CrossRef]
- J. Dodge, S. Penney, A. Anderson, and M. M. Burnett, “What Should Be in an XAI Explanation? What IFT Reveals,” in Joint Proceedings of the ACM IUI 2018 Workshops co-located with the 23rd ACM Conference on Intelligent User Interfaces (ACM IUI 2018), Tokyo, Japan, March 11, 2018, A. Said and T. Komatsu, Eds., in CEUR Workshop Proceedings, vol. 2068. CEUR-WS.org, 2018. [Online]. Available: https://ceur-ws.org/Vol-2068/exss9.pdf.
- T. A. J. Schoonderwoerd, W. Jorritsma, M. A. Neerincx, and K. van den Bosch, “Human-centered XAI: Developing design patterns for explanations of clinical decision support systems,” Int J Hum Comput Stud, vol. 154, p. 102684, 2021. [CrossRef]
- R. Paleja, M. Ghuy, N. Ranawaka Arachchige, R. Jensen, and M. Gombolay, “The Utility of Explainable AI in Ad Hoc Human-Machine Teaming,” in Advances in Neural Information Processing Systems, M. Ranzato, A. Beygelzimer, Y. Dauphin, P. S. Liang, and J. W. Vaughan, Eds., Curran Associates, Inc., 2021, pp. 610–623. [Online]. Available: https://proceedings.neurips.cc/paper_files/paper/2021/file/05d74c48b5b30514d8e9bd60320fc8f6-Paper.pdf.
- Y. Alufaisan, L. R. Marusich, J. Z. Bakdash, Y. Zhou, and M. Kantarcioglu, “Does Explainable Artificial Intelligence Improve Human Decision-Making?,” Proceedings of the AAAI Conference on Artificial Intelligence, vol. 35, no. 8, pp. 6618–6626, May 2021. [CrossRef]
- J. Schaffer, J. O’Donovan, J. Michaelis, A. Raglin, and T. Höllerer, “I can do better than your AI: expertise and explanations,” in Proceedings of the 24th International Conference on Intelligent User Interfaces, in IUI ’19. New York, NY, USA: Association for Computing Machinery, 2019, pp. 240–251. [CrossRef]
- M. Colley, B. Eder, J. O. Rixen, and E. Rukzio, “Effects of Semantic Segmentation Visualization on Trust, Situation Awareness, and Cognitive Load in Highly Automated Vehicles,” in Proceedings of the 2021 CHI Conference on Human Factors in Computing Systems, in CHI ’21. New York, NY, USA: Association for Computing Machinery, 2021. [CrossRef]
- Y. Zhang, Q. V. Liao, and R. K. E. Bellamy, “Effect of confidence and explanation on accuracy and trust calibration in AI-assisted decision making,” in Proceedings of the 2020 Conference on Fairness, Accountability, and Transparency, in FAT* ’20. New York, NY, USA: Association for Computing Machinery, 2020, pp. 295–305. [CrossRef]
- S. Carton, Q. Mei, and P. Resnick, “Feature-Based Explanations Don’t Help People Detect Misclassifications of Online Toxicity,” Proceedings of the International AAAI Conference on Web and Social Media, vol. 14, no. 1, pp. 95–106, May 2020. [CrossRef]
- J. Schoeffer, N. Kuehl, and Y. Machowski, “‘There Is Not Enough Information’: On the Effects of Explanations on Perceptions of Informational Fairness and Trustworthiness in Automated Decision-Making,” in Proceedings of the 2022 ACM Conference on Fairness, Accountability, and Transparency, in FAccT ’22. New York, NY, USA: Association for Computing Machinery, 2022, pp. 1616–1628. [CrossRef]
- J. Kunkel, T. Donkers, L. Michael, C.-M. Barbu, and J. Ziegler, “Let Me Explain: Impact of Personal and Impersonal Explanations on Trust in Recommender Systems,” in Proceedings of the 2019 CHI Conference on Human Factors in Computing Systems, in CHI ’19. New York, NY, USA: Association for Computing Machinery, 2019, pp. 1–12. [CrossRef]
- J. V. Jeyakumar, J. Noor, Y.-H. Cheng, L. Garcia, and M. Srivastava, “How Can I Explain This to You? An Empirical Study of Deep Neural Network Explanation Methods,” in Advances in Neural Information Processing Systems, H. Larochelle, M. Ranzato, R. Hadsell, M. F. Balcan, and H. Lin, Eds., Curran Associates, Inc., 2020, pp. 4211–4222. [Online]. Available: https://proceedings.neurips.cc/paper_files/paper/2020/file/2c29d89cc56cdb191c60db2f0bae796b-Paper.pdf.
- G. Harrison, J. Hanson, C. Jacinto, J. Ramirez, and B. Ur, “An Empirical Study on the Perceived Fairness of Realistic, Imperfect Machine Learning Models,” in Proceedings of the 2020 Conference on Fairness, Accountability, and Transparency, in FAT* ’20. New York, NY, USA: Association for Computing Machinery, 2020, pp. 392–402. [CrossRef]
- K. Weitz, Z. Alexander, and A. Elisabeth, “What do end-users really want? investigation of human-centered xai for mobile health apps,” in arXiv preprint, 2022.
- A. Fügener, J. Grahl, A. Gupta, and W. Ketter, “Will Humans-in-The-Loop Become Borgs? Merits and Pitfalls of Working with AI,” Management Information Systems Quarterly (MISQ), vol. 45, 2021.
- W. Jin, M. Fatehi, R. Guo, and G. Hamarneh, “Evaluating the clinical utility of artificial intelligence assistance and its explanation on the glioma grading task,” Artif Intell Med, vol. 148, p. 102751, 2024. [CrossRef]
- C. Panigutti et al., “The role of explainable AI in the context of the AI Act,” in Proceedings of the 2023 ACM Conference on Fairness, Accountability, and Transparency, in FAccT ’23. New York, NY, USA: Association for Computing Machinery, 2023, pp. 1139–1150. [CrossRef]
- P. Lopes, E. Silva, C. Braga, T. Oliveira, and L. Rosado, “XAI Systems Evaluation: A Review of Human and Computer-Centred Methods,” Applied Sciences, vol. 12, no. 19, 2022. [CrossRef]
- X. Kong, S. Liu, and L. Zhu, “Toward Human-centered XAI in Practice: A survey,” Machine Intelligence Research, 2024. [CrossRef]
- T. Kulesza, S. Stumpf, M. Burnett, and I. Kwan, “Tell Me More? The Effects of Mental Model Soundness on Personalizing an Intelligent Agent,” in Proceedings of the SIGCHI Conference on Human Factors in Computing Systems, in CHI ’12. New York, NY, USA: Association for Computing Machinery, 2012, pp. 1–10. [CrossRef]
- S. Naveed, B. Loepp, and J. Ziegler, “On the Use of Feature-based Collaborative Explanations: An Empirical Comparison of Explanation Styles,” in Adjunct Publication of the 28th ACM Conference on User Modeling, Adaptation and Personalization, in UMAP ’20 Adjunct. New York, NY, USA: Association for Computing Machinery, 2020, pp. 226–232. [CrossRef]
- G. Bansal, B. Nushi, E. Kamar, W. S. Lasecki, D. S. Weld, and E. Horvitz, “Beyond Accuracy: The Role of Mental Models in Human-AI Team Performance,” Proc AAAI Conf Hum Comput Crowdsourc, vol. 7, no. 1, pp. 2–11, Oct. 2019. [CrossRef]
- L. Guo, E. M. Daly, O. Alkan, M. Mattetti, O. Cornec, and B. Knijnenburg, “Building Trust in Interactive Machine Learning via User Contributed Interpretable Rules,” in 27th International Conference on Intelligent User Interfaces, in IUI ’22. New York, NY, USA: Association for Computing Machinery, 2022, pp. 537–548. [CrossRef]
- T. H. Davenport and M. L. Markus, “Rigor vs. Relevance Revisited: Response to Benbasat and Zmud,” MIS Quarterly, vol. 23, no. 1, pp. 19–23, 1999. [CrossRef]
- M. R. Islam, M. U. Ahmed, S. Barua, and S. Begum, “A Systematic Review of Explainable Artificial Intelligence in Terms of Different Application Domains and Tasks,” Applied Sciences, vol. 12, no. 3, 2022. [CrossRef]
- A. and F. L. and G. E. and L. M. G. A. Cabitza Federico and Campagner, “Color Shadows (Part I): Exploratory Usability Evaluation of Activation Maps in Radiological Machine Learning,” in Machine Learning and Knowledge Extraction, P. and T. A. M. and W. E. Holzinger Andreas and Kieseberg, Ed., Cham: Springer International Publishing, 2022, pp. 31–50.
- N. Grgic-Hlaca, M. B. Zafar, K. P. Gummadi, and A. Weller, “Beyond Distributive Fairness in Algorithmic Decision Making: Feature Selection for Procedurally Fair Learning,” in AAAI Conference on Artificial Intelligence, 2018. [Online]. Available: https://api.semanticscholar.org/CorpusID:19196469.
- J. Dodge, Q. V. Liao, Y. Zhang, R. K. E. Bellamy, and C. Dugan, “Explaining Models: An Empirical Study of How Explanations Impact Fairness Judgment,” in Proceedings of the 24th International Conference on Intelligent User Interfaces, in IUI ’19. New York, NY, USA: Association for Computing Machinery, 2019, pp. 275–285. [CrossRef]
- D.-R. Kern et al., “Peeking Inside the Schufa Blackbox: Explaining the German Housing Scoring System,” ArXiv, 2023.
- S. Naveed and J. Ziegler, “Featuristic: An interactive hybrid system for generating explainable recommendations - beyond system accuracy,” in IntRS@RecSys, 2020. [Online]. Available: https://api.semanticscholar.org/CorpusID:225063158.
- S. Naveed and J. Ziegler, “Feature-Driven Interactive Recommendations and Explanations with Collaborative Filtering Approach,” in ComplexRec@ RecSys, 2019, p. 1015.
- J. L. Herlocker, J. A. Konstan, and J. Riedl, “Explaining Collaborative Filtering Recommendations,” in Proceedings of the 2000 ACM Conference on Computer Supported Cooperative Work, in CSCW ’00. New York, NY, USA: Association for Computing Machinery, 2000, pp. 241–250. [CrossRef]
- N. Tintarev and J. Masthoff, “Explaining Recommendations: Design and Evaluation,” in Recommender Systems Handbook, 2015. [Online]. Available: https://api.semanticscholar.org/CorpusID:8407569.
- J. Tintarev Nava and Masthoff, “Designing and Evaluating Explanations for Recommender Systems,” in Recommender Systems Handbook, L. and S. B. and K. P. B. Ricci Francesco and Rokach, Ed., Boston, MA: Springer US, 2011, pp. 479–510. [CrossRef]
- I. Nunes and D. Jannach, “A systematic review and taxonomy of explanations in decision support and recommender systems,” May 2020.
- P. Kouki, J. Schaffer, J. Pujara, J. O’Donovan, and L. Getoor, “Personalized explanations for hybrid recommender systems,” in Proceedings of the 24th International Conference on Intelligent User Interfaces, in IUI ’19. New York, NY, USA: Association for Computing Machinery, 2019, pp. 379–390. [CrossRef]
- N. L. Le, M.-H. Abel, and P. Gouspillou, “Combining Embedding-Based and Semantic-Based Models for Post-Hoc Explanations in Recommender Systems,” in 2023 IEEE International Conference on Systems, Man, and Cybernetics (SMC), 2023, pp. 4619–4624. [CrossRef]
- S. Raza and C. Ding, “News recommender system: a review of recent progress, challenges, and opportunities,” Artif Intell Rev, vol. 55, no. 1, pp. 749–800, 2022. [CrossRef]
- X. Wang, D. Wang, C. Xu, X. He, Y. Cao, and T.-S. Chua, “Explainable Reasoning over Knowledge Graphs for Recommendation,” Proceedings of the AAAI Conference on Artificial Intelligence, vol. 33, no. 01, pp. 5329–5336, Jul. 2019. [CrossRef]
- U. Ehsan, Q. V. Liao, M. Muller, M. O. Riedl, and J. D. Weisz, “Expanding Explainability: Towards Social Transparency in AI systems,” in Proceedings of the 2021 CHI Conference on Human Factors in Computing Systems, in CHI ’21. New York, NY, USA: Association for Computing Machinery, 2021. [CrossRef]
- A. Hudon, T. Demazure, A. J. Karran, P.-M. Léger, and S. Sénécal, “Explainable Artificial Intelligence (XAI): How the Visualization of AI Predictions Affects User Cognitive Load and Confidence,” Information Systems and Neuroscience, 2021, [Online]. Available: https://api.semanticscholar.org/CorpusID:240199397.
- H. Cramer et al., “The effects of transparency on trust in and acceptance of a content-based art recommender,” User Model User-adapt Interact, vol. 18, no. 5, pp. 455–496, 2008. [CrossRef]
- U. Ehsan, P. Tambwekar, L. Chan, B. Harrison, and M. O. Riedl, “Automated rationale generation: a technique for explainable AI and its effects on human perceptions,” Proceedings of the 24th International Conference on Intelligent User Interfaces, 2019, [Online]. Available: https://api.semanticscholar.org/CorpusID:58004583.
- H. Robert R, M. Shane T, K. Gary, and L. Jordan, “Metrics for Explainable AI: Challenges and Prospects,” arXiv preprint arXiv:1812.04608., 2018.
- J. S. Christian Meske Enrico Bunde and M. Gersch, “Explainable Artificial Intelligence: Objectives, Stakeholders, and Future Research Opportunities,” Information Systems Management, vol. 39, no. 1, pp. 53–63, 2022. [CrossRef]
- S. Mohseni, N. Zarei, and E. D. Ragan, “A Multidisciplinary Survey and Framework for Design and Evaluation of Explainable AI Systems,” ACM Trans. Interact. Intell. Syst., vol. 11, no. 3–4, Sep. 2021. [CrossRef]
- P. J. Phillips et al., “Four principles of explainable artificial intelligence,” 2021.
- B. Goodman and S. Flaxman, “European Union Regulations on Algorithmic Decision-Making and a ‘Right to Explanation,’” AI Mag, vol. 38, no. 3, pp. 50–57, Oct. 2017. [CrossRef]
- A. B. Lund, “A Stakeholder Approach to Media Governance,” in Managing Media Firms and Industries: What’s So Special About Media Management?, C. Lowe Gregory Ferrell and Brown, Ed., Cham: Springer International Publishing, 2016, pp. 103–120. [CrossRef]
- Y. Rong et al., “Towards Human-centered Explainable AI: User Studies for Model Explanations,” May 2022.
- D. Gunning and D. Aha, “DARPA’s Explainable Artificial Intelligence (XAI) Program,” AI Mag, vol. 40, no. 2, pp. 44–58, Jun. 2019. [CrossRef]
- Y. Rong et al., “Towards Human-Centered Explainable AI: A Survey of User Studies for Model Explanations,” IEEE Trans Pattern Anal Mach Intell, pp. 1–20, 2023. [CrossRef]
- A. Páez, “The Pragmatic Turn in Explainable Artificial Intelligence (XAI),” Minds Mach (Dordr), vol. 29, no. 3, pp. 441–459, 2019. [CrossRef]
- B. Y. Lim and A. K. Dey, “Assessing demand for intelligibility in context-aware applications,” in Proceedings of the 11th International Conference on Ubiquitous Computing, in UbiComp ’09. New York, NY, USA: Association for Computing Machinery, 2009, pp. 195–204. [CrossRef]
- D. S. Weld and G. Bansal, “The challenge of crafting intelligible intelligence,” Commun. ACM, vol. 62, no. 6, pp. 70–79, May 2019. [CrossRef]
- B. P. Knijnenburg, M. C. Willemsen, and A. Kobsa, “A pragmatic procedure to support the user-centric evaluation of recommender systems,” in Proceedings of the Fifth ACM Conference on Recommender Systems, in RecSys ’11. New York, NY, USA: Association for Computing Machinery, 2011, pp. 321–324. [CrossRef]
- J. Dai, S. Upadhyay, U. Aivodji, S. H. Bach, and H. Lakkaraju, “Fairness via Explanation Quality: Evaluating Disparities in the Quality of Post hoc Explanations,” in Proceedings of the 2022 AAAI/ACM Conference on AI, Ethics, and Society, in AIES ’22. New York, NY, USA: Association for Computing Machinery, 2022, pp. 203–214. [CrossRef]
- P. Pu, L. Chen, and R. Hu, “A user-centric evaluation framework for recommender systems,” in Proceedings of the Fifth ACM Conference on Recommender Systems, in RecSys ’11. New York, NY, USA: Association for Computing Machinery, 2011, pp. 157–164. [CrossRef]
- L. Martínez Caro and J. A. Martínez García, “Cognitive–affective model of consumer satisfaction. An exploratory study within the framework of a sporting event,” J Bus Res, vol. 60, no. 2, pp. 108–114, 2007. [CrossRef]
- D. G.Myers and C. N. Dewall, Psychology, 11th ed. Worth Publishers, 2021.
- F. Gedikli, D. Jannach, and M. Ge, “How should I explain? A comparison of different explanation types for recommender systems,” Int J Hum Comput Stud, vol. 72, no. 4, pp. 367–382, 2014. [CrossRef]
- M. Kahng, P. Y. Andrews, A. Kalro, and D. H. Chau, “ActiVis: Visual Exploration of Industry-Scale Deep Neural Network Models,” IEEE Trans Vis Comput Graph, vol. 24, no. 1, pp. 88–97, 2018. [CrossRef]
- R. Buettner, “Cognitive Workload of Humans Using Artificial Intelligence Systems: Towards Objective Measurement Applying Eye-Tracking Technology,” in KI 2013: Advances in Artificial Intelligence, M. Timm Ingo J. and Thimm, Ed., Berlin, Heidelberg: Springer Berlin Heidelberg, 2013, pp. 37–48.
- Y. Wu, Y. Liu, Y. R. Tsai, and S. Yau, “Investigating the role of eye movements and physiological signals in search satisfaction prediction using geometric analysis,” Journal of the Association for Information Science & Technology, vol. 70, no. 9, pp. 981–999, 2019, [Online]. Available: https://EconPapers.repec.org/RePEc:bla:jinfst:v:70:y:2019:i:9:p:981-999.
- M. Hassenzahl, R.Kekez, and m. Burmester, “The Importance of a software’s pragmatic quality depends on usage modes,” in roceedings of the 6th international conference on Work With Display Units WWDU 2002, ERGONOMIC Institut für Arbeits- und Sozialforschung, 2002, pp. 275–276.
- A. Nemeth and A. Bekmukhambetova, “Achieving Usability: Looking for Connections between User-Centred Design Practices and Resultant Usability Metrics in Agile Software Development,” Periodica Polytechnica Social and Management Sciences, vol. 31, no. 2, pp. 135–143, 2023. [CrossRef]
- W. Zhang and B. Y. Lim, “Towards Relatable Explainable AI with the Perceptual Process,” in Proceedings of the 2022 CHI Conference on Human Factors in Computing Systems, in CHI ’22. New York, NY, USA: Association for Computing Machinery, 2022. [CrossRef]
- M. Nourani, S. Kabir, S. Mohseni, and E. D. Ragan, “The Effects of Meaningful and Meaningless Explanations on Trust and Perceived System Accuracy in Intelligent Systems,” Proc AAAI Conf Hum Comput Crowdsourc, vol. 7, no. 1, pp. 97–105, Oct. 2019. [CrossRef]
- A. Abdul, C. von der Weth, M. Kankanhalli, and B. Y. Lim, “COGAM: Measuring and Moderating Cognitive Load in Machine Learning Model Explanations,” in Proceedings of the 2020 CHI Conference on Human Factors in Computing Systems, in CHI ’20. New York, NY, USA: Association for Computing Machinery, 2020, pp. 1–14. [CrossRef]
- B. Y. Lim, A. K. Dey, and D. Avrahami, “Why and why not explanations improve the intelligibility of context-aware intelligent systems,” in Proceedings of the SIGCHI Conference on Human Factors in Computing Systems, in CHI ’09. New York, NY, USA: Association for Computing Machinery, 2009, pp. 2119–2128. [CrossRef]
- R. R. Hoffman, S. T. Mueller, G. Klein, and J. Litman, “Measures for explainable AI: Explanation goodness, user satisfaction, mental models, curiosity, trust, and human-AI performance,” Front Comput Sci, vol. 5, 2023. [CrossRef]
- D. Das and S. Chernova, “Leveraging rationales to improve human task performance,” in Proceedings of the 25th International Conference on Intelligent User Interfaces, in IUI ’20. New York, NY, USA: Association for Computing Machinery, 2020, pp. 510–518. [CrossRef]
- F. de Andreis, “A Theoretical Approach to the Effective Decision-Making Process,” Open Journal of Applied Sciences, vol. 10, no. 6, pp. 287–304, Jun. 2020.
- R. Parasuraman, T. B. Sheridan, and C. D. Wickens, “Situation Awareness, Mental Workload, and Trust in Automation: Viable, Empirically Supported Cognitive Engineering Constructs,” J Cogn Eng Decis Mak, vol. 2, no. 2, pp. 140–160, 2008. [CrossRef]
- M. Pomplun and S. Sunkara, “Pupil Dilation as an Indicator of Cognitive Workload in Human-Computer Interaction,” 2003. [Online]. Available: https://api.semanticscholar.org/CorpusID:1052200.
- J. Cegarra and A. Chevalier, “The use of Tholos software for combining measures of mental workload: Toward theoretical and methodological improvements,” Behav Res Methods, vol. 40, no. 4, pp. 988–1000, 2008. [CrossRef]
- S. G. Hart and L. E. Staveland, “Development of NASA-TLX (Task Load Index): Results of Empirical and Theoretical Research,” in Human Mental Workload, vol. 52, P. A. Hancock and N. Meshkati, Eds., in Advances in Psychology, vol. 52. , North-Holland, 1988, pp. 139–183. [CrossRef]
- R. C. Mayer, J. H. Davis, and F. D. Schoorman, “An Integrative Model of Organizational Trust,” The Academy of Management Review, vol. 20, no. 3, pp. 709–734, 1995. [CrossRef]
- M. Madsen and S. Gregor, “Measuring Human-Computer Trust ,” in 11th australasian conference on information systems, Vol.53., 2000, pp. 6–8.
- D. Gefen, “Reflections on the dimensions of trust and trustworthiness among online consumers,” SIGMIS Database, vol. 33, no. 3, pp. 38–53, Aug. 2002. [CrossRef]
- M. Madsen and S. D. Gregor, “Measuring Human-Computer Trust,” 2000. [Online]. Available: https://api.semanticscholar.org/CorpusID:18821611.
- G. Stevens and P. Bossauer, “Who do you trust: Peers or Technology? A conjoint analysis about computational reputation mechanisms,” vol. 4, no. 1, 2020. [CrossRef]
- W. Wang and I. Benbasat, “Recommendation Agents for Electronic Commerce: Effects of Explanation Facilities on Trusting Beliefs,” Journal of Management Information Systems, vol. 23, no. 4, pp. 217–246, 2007. [CrossRef]
- M. Wahlström, B. Tammentie, T.-T. Salonen, and A. Karvonen, “AI and the transformation of industrial work: Hybrid intelligence vs double-black box effect,” Appl Ergon, vol. 118, p. 104271, 2024. [CrossRef]
- E. Rader and R. Gray, “Understanding User Beliefs About Algorithmic Curation in the Facebook News Feed,” in Proceedings of the 33rd Annual ACM Conference on Human Factors in Computing Systems, in CHI ’15. New York, NY, USA: Association for Computing Machinery, 2015, pp. 173–182. [CrossRef]
- M. R. Endsley, “Situation awareness global assessment technique (SAGAT),” in Proceedings of the IEEE 1988 National Aerospace and Electronics Conference, 1988, pp. 789–795 vol.3. [CrossRef]
- Z. Buçinca, P. Lin, K. Z. Gajos, and E. L. Glassman, “Proxy tasks and subjective measures can be misleading in evaluating explainable AI systems,” in Proceedings of the 25th International Conference on Intelligent User Interfaces, in IUI ’20. New York, NY, USA: Association for Computing Machinery, 2020, pp. 454–464. [CrossRef]
- F. Uwe, Doing Interview Research : The Essential How To Guide. Sage Publications, 2021.
- A. Blandford, D. Furniss, and S. Makri, “Qualitative HCI Research: Going Behind the Scenes,” in Synthesis Lectures on Human-Centered Informatics, 2016. [Online]. Available: https://api.semanticscholar.org/CorpusID:38190394.
- U. Kelle, “„Mixed Methods" in der Evaluationsforschung - mit den Möglichkeiten und Beschränkungen quantitativer und qualitativer Methoden arbeiten,” Zeitschrift für Evaluation, vol. 17, no. 1, pp. 25–52, 208, Apr. 2018, [Online]. Available: https://www.proquest.com/scholarly-journals/mixed-methods-der-evaluationsforschung-mit-den/docview/2037015610/se-2?accountid=14644.
- M. S. Gorber Sarah Connor and Tremblay, “Self-Report and Direct Measures of Health: Bias and Implications,” in The Objective Monitoring of Physical Activity: Contributions of Accelerometry to Epidemiology, Exercise Science and Rehabilitation, C. Shephard Roy J. and Tudor-Locke, Ed., Cham: Springer International Publishing, 2016, pp. 369–376. [CrossRef]
- S. M. Sikes Landon M. and Dunn, “Subjective Experiences,” in Encyclopedia of Personality and Individual Differences, T. K. Zeigler-Hill Virgil and Shackelford, Ed., Cham: Springer International Publishing, 2020, pp. 5273–5275. [CrossRef]
- W. Mellouk and W. Handouzi, “Facial emotion recognition using deep learning: review and insights,” Procedia Comput Sci, vol. 175, pp. 689–694, 2020. [CrossRef]
- T. R. Hinkin, “A review of scale development practices in the study of organizations,” J Manage, vol. 21, no. 5, pp. 967–988, 1995. [CrossRef]
- “Organizational_Trust”.
- C. John W and C. V.L.Plano, “Revisiting mixed methods research designs twenty years later,” in handbookofmixedmethodsresearchdesigns, 2023, pp. 21–36.
- T. Miller, “Explanation in artificial intelligence: Insights from the social sciences,” May 2019, Elsevier B.V. [CrossRef]
- R. Binns, “Fairness in Machine Learning: Lessons from Political Philosophy,” in Proceedings of the 1st Conference on Fairness, Accountability and Transparency, S. A. Friedler and C. Wilson, Eds., in Proceedings of Machine Learning Research, vol. 81. PMLR, Sep. 2018, pp. 149–159. [Online]. Available: https://proceedings.mlr.press/v81/binns18a.html.
- M. Eiband, D. Buschek, A. Kremer, and H. Hussmann, “The Impact of Placebic Explanations on Trust in Intelligent Systems,” in Extended Abstracts of the 2019 CHI Conference on Human Factors in Computing Systems, in CHI EA ’19. New York, NY, USA: Association for Computing Machinery, 2019, pp. 1–6. [CrossRef]
- R. Binns, M. Van Kleek, M. Veale, U. Lyngs, J. Zhao, and N. Shadbolt, “‘It’s Reducing a Human Being to a Percentage’: Perceptions of Justice in Algorithmic Decisions,” in Proceedings of the 2018 CHI Conference on Human Factors in Computing Systems, in CHI ’18. New York, NY, USA: Association for Computing Machinery, 2018, pp. 1–14. [CrossRef]
Figure 1.
Distribution of selected papers across different evaluation objectives
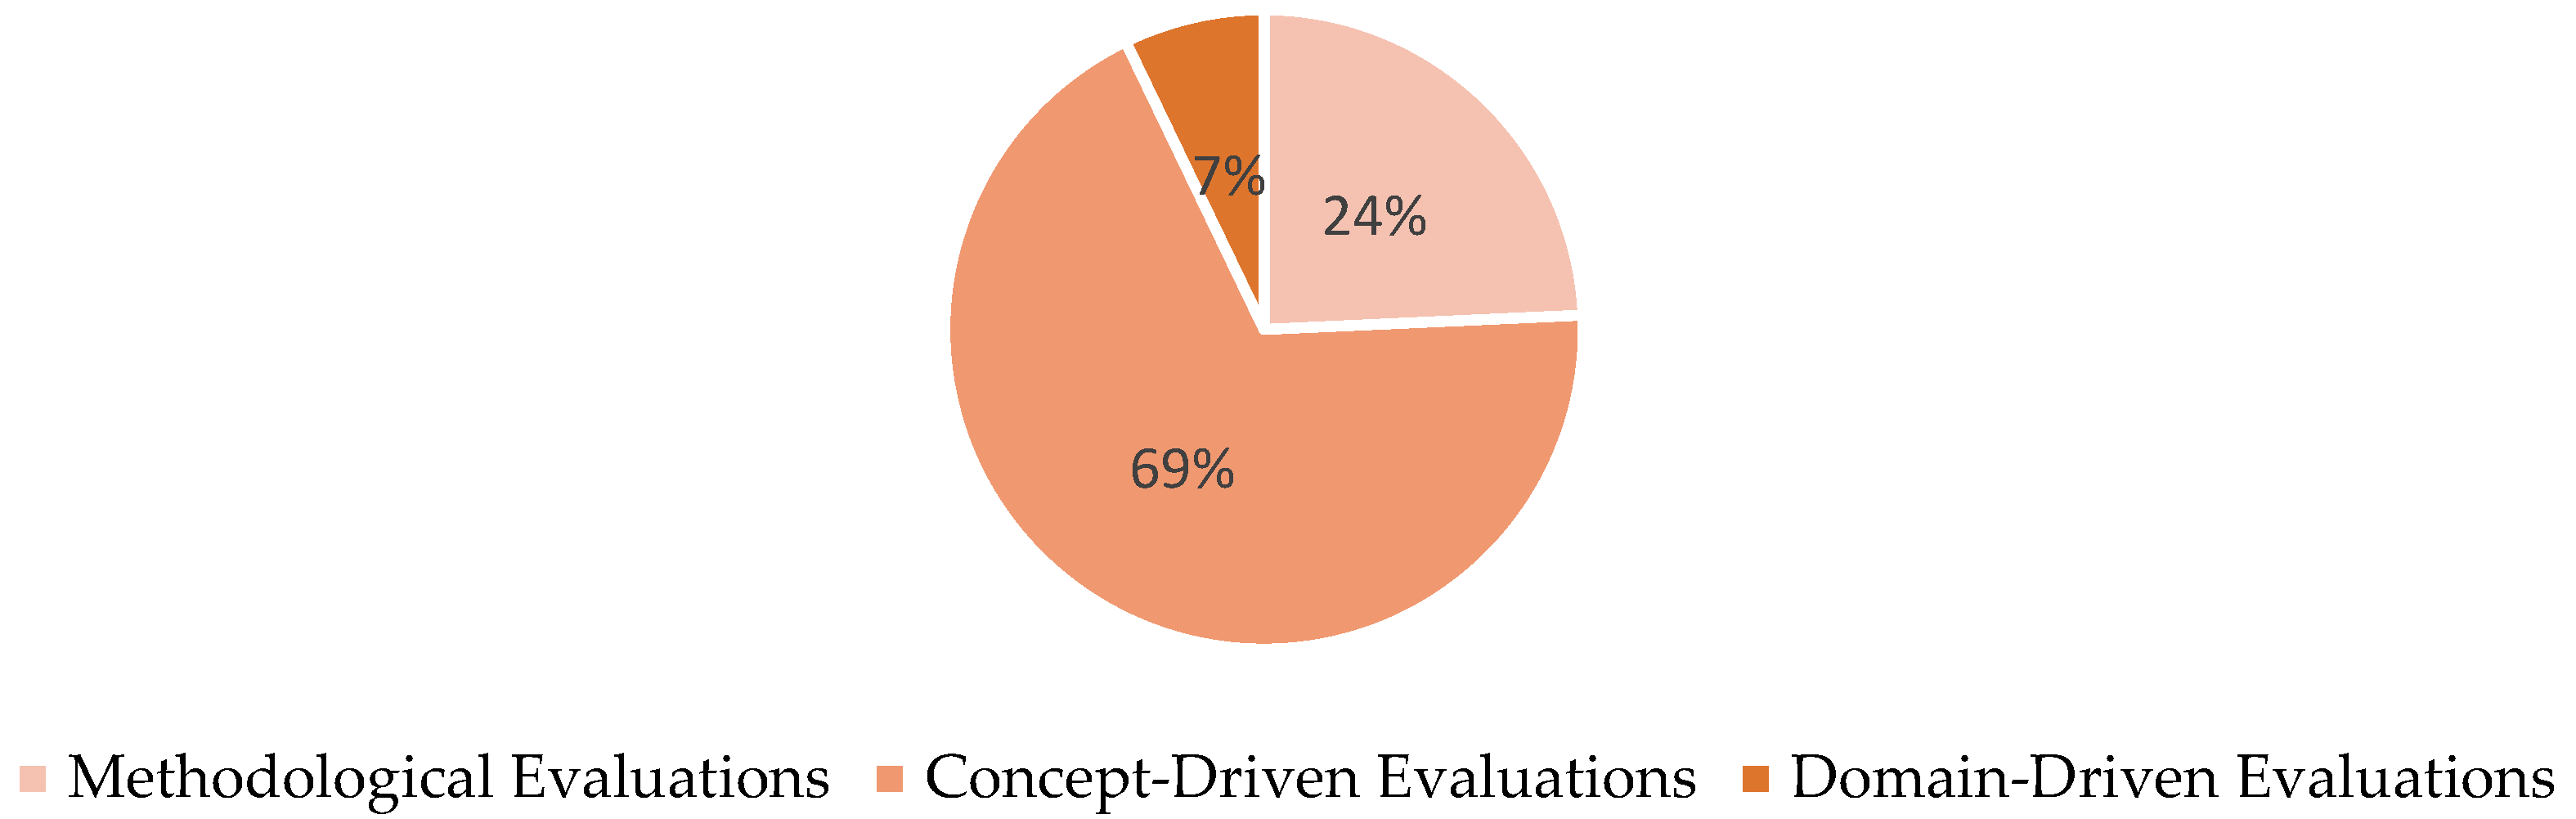
Figure 2.
Evaluation scope of the studies in our sample
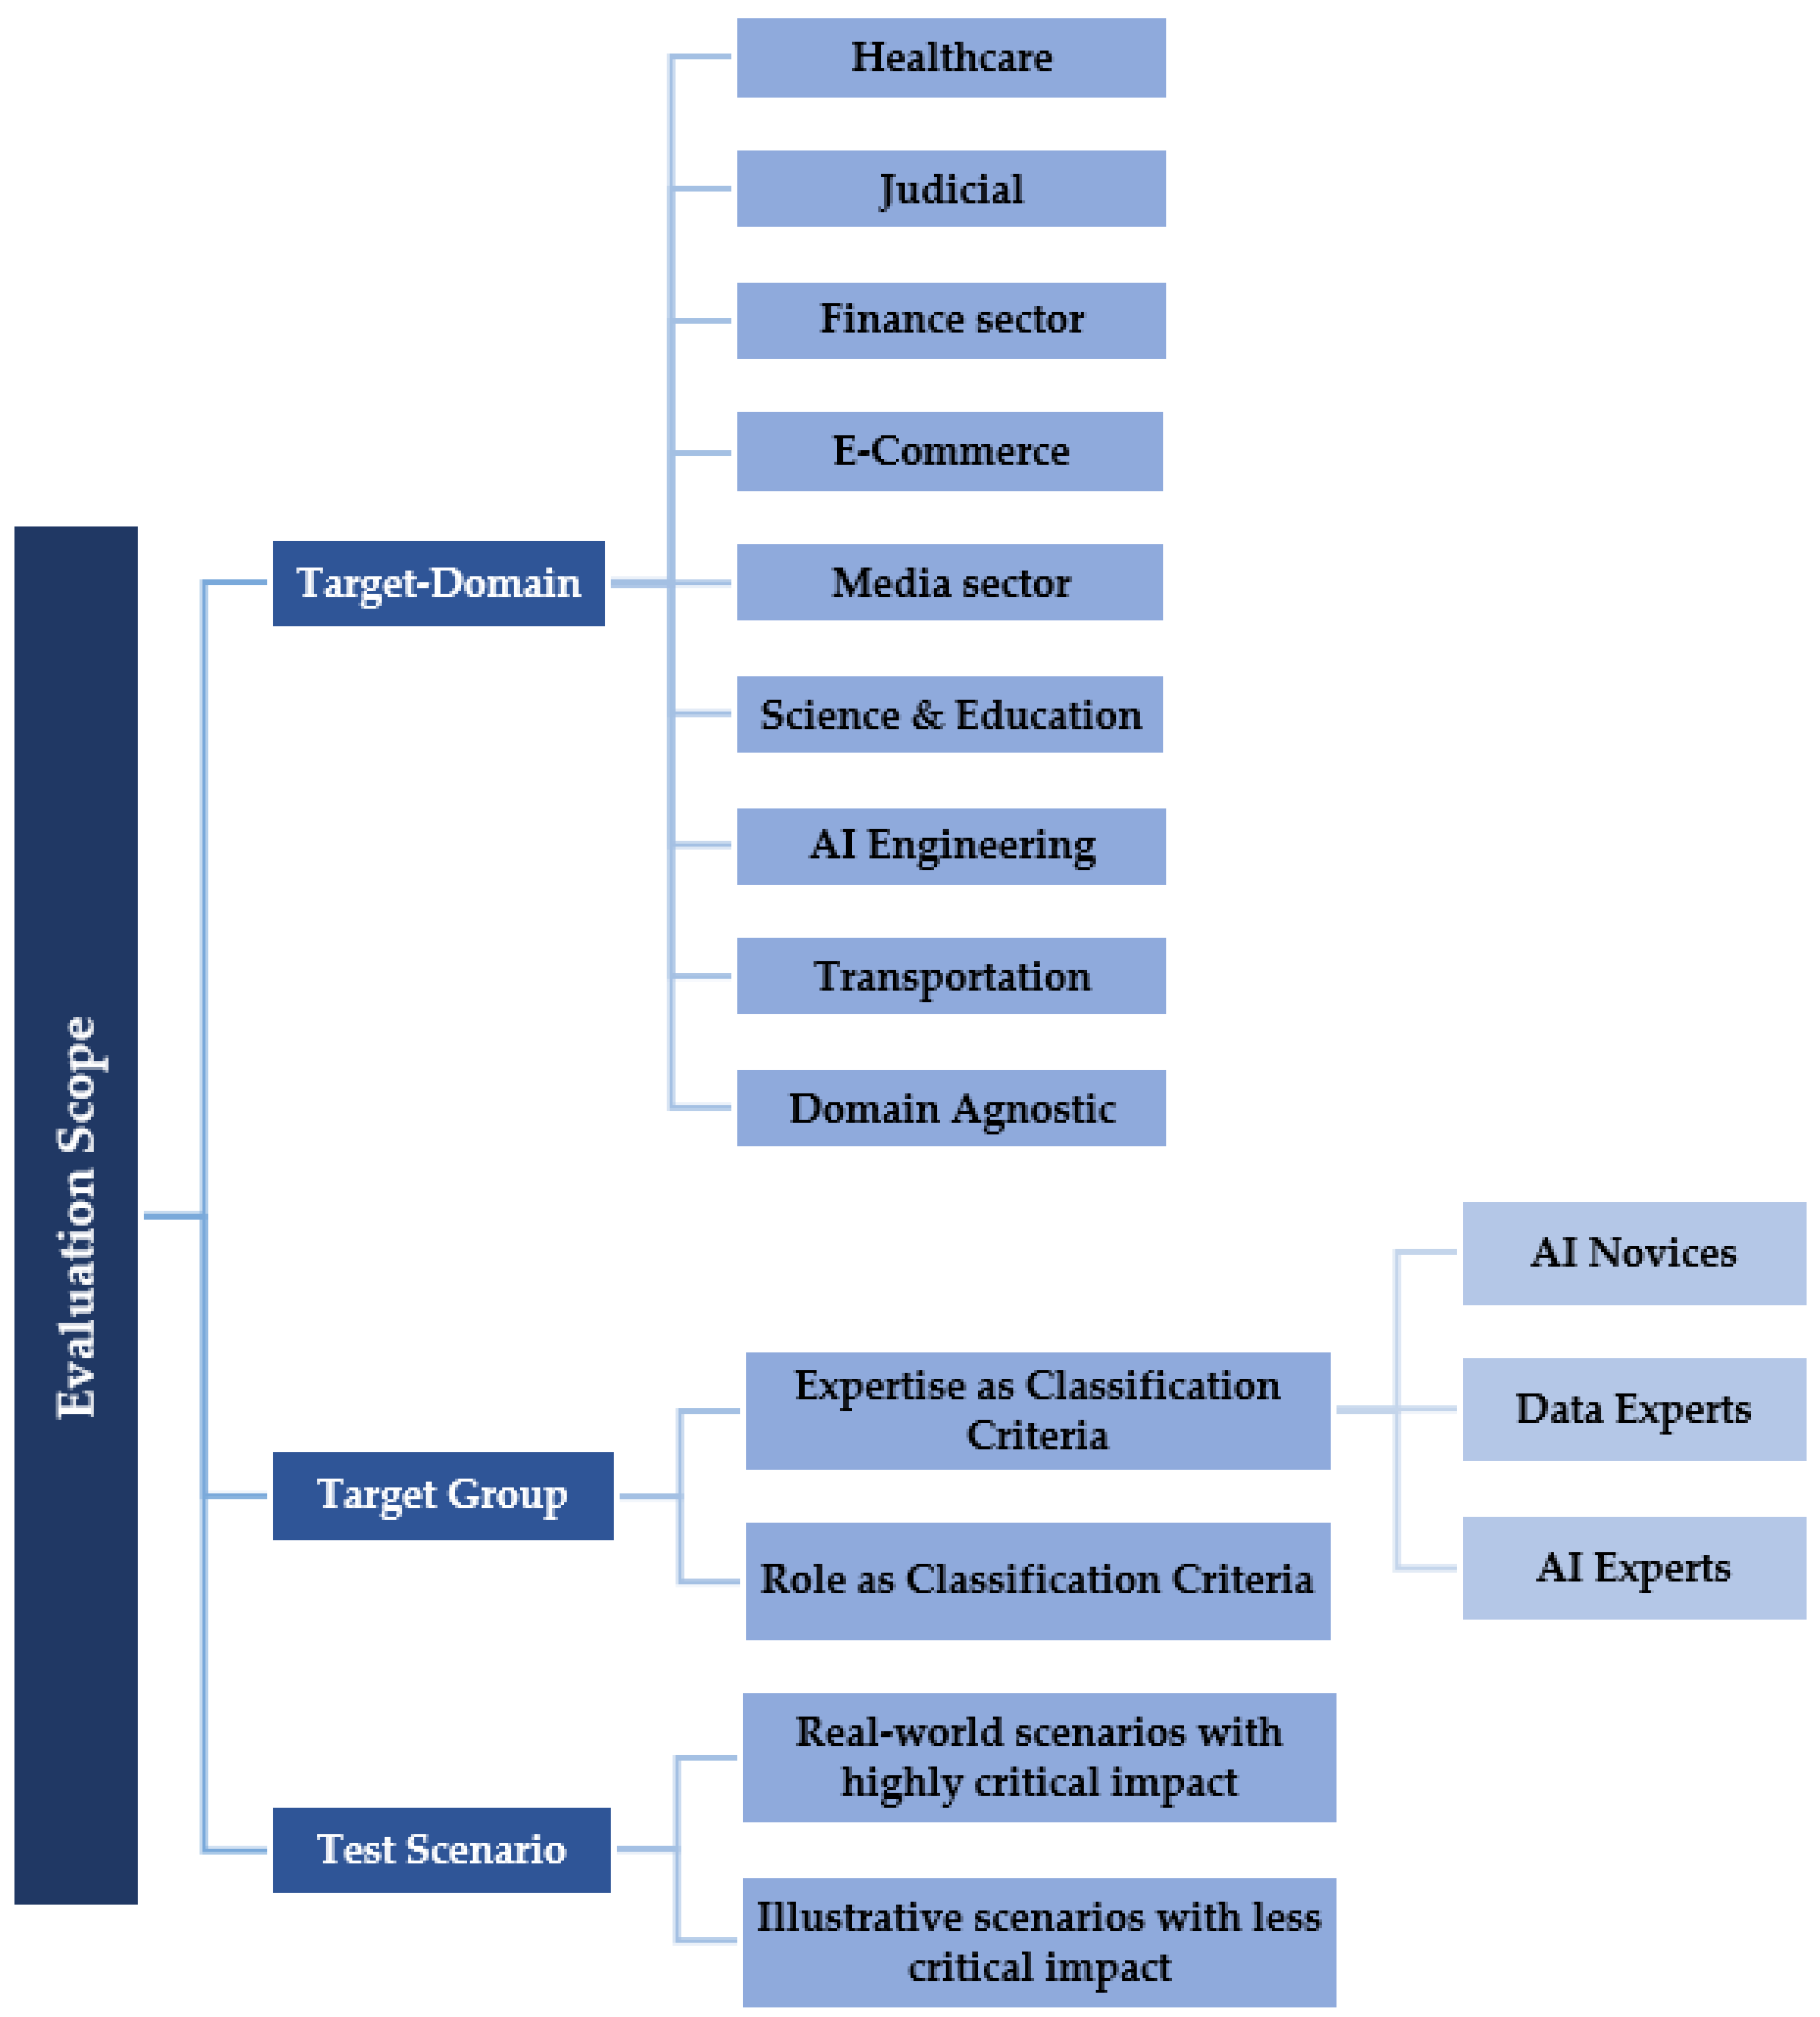
Figure 3.
XAI Evaluation Procedure
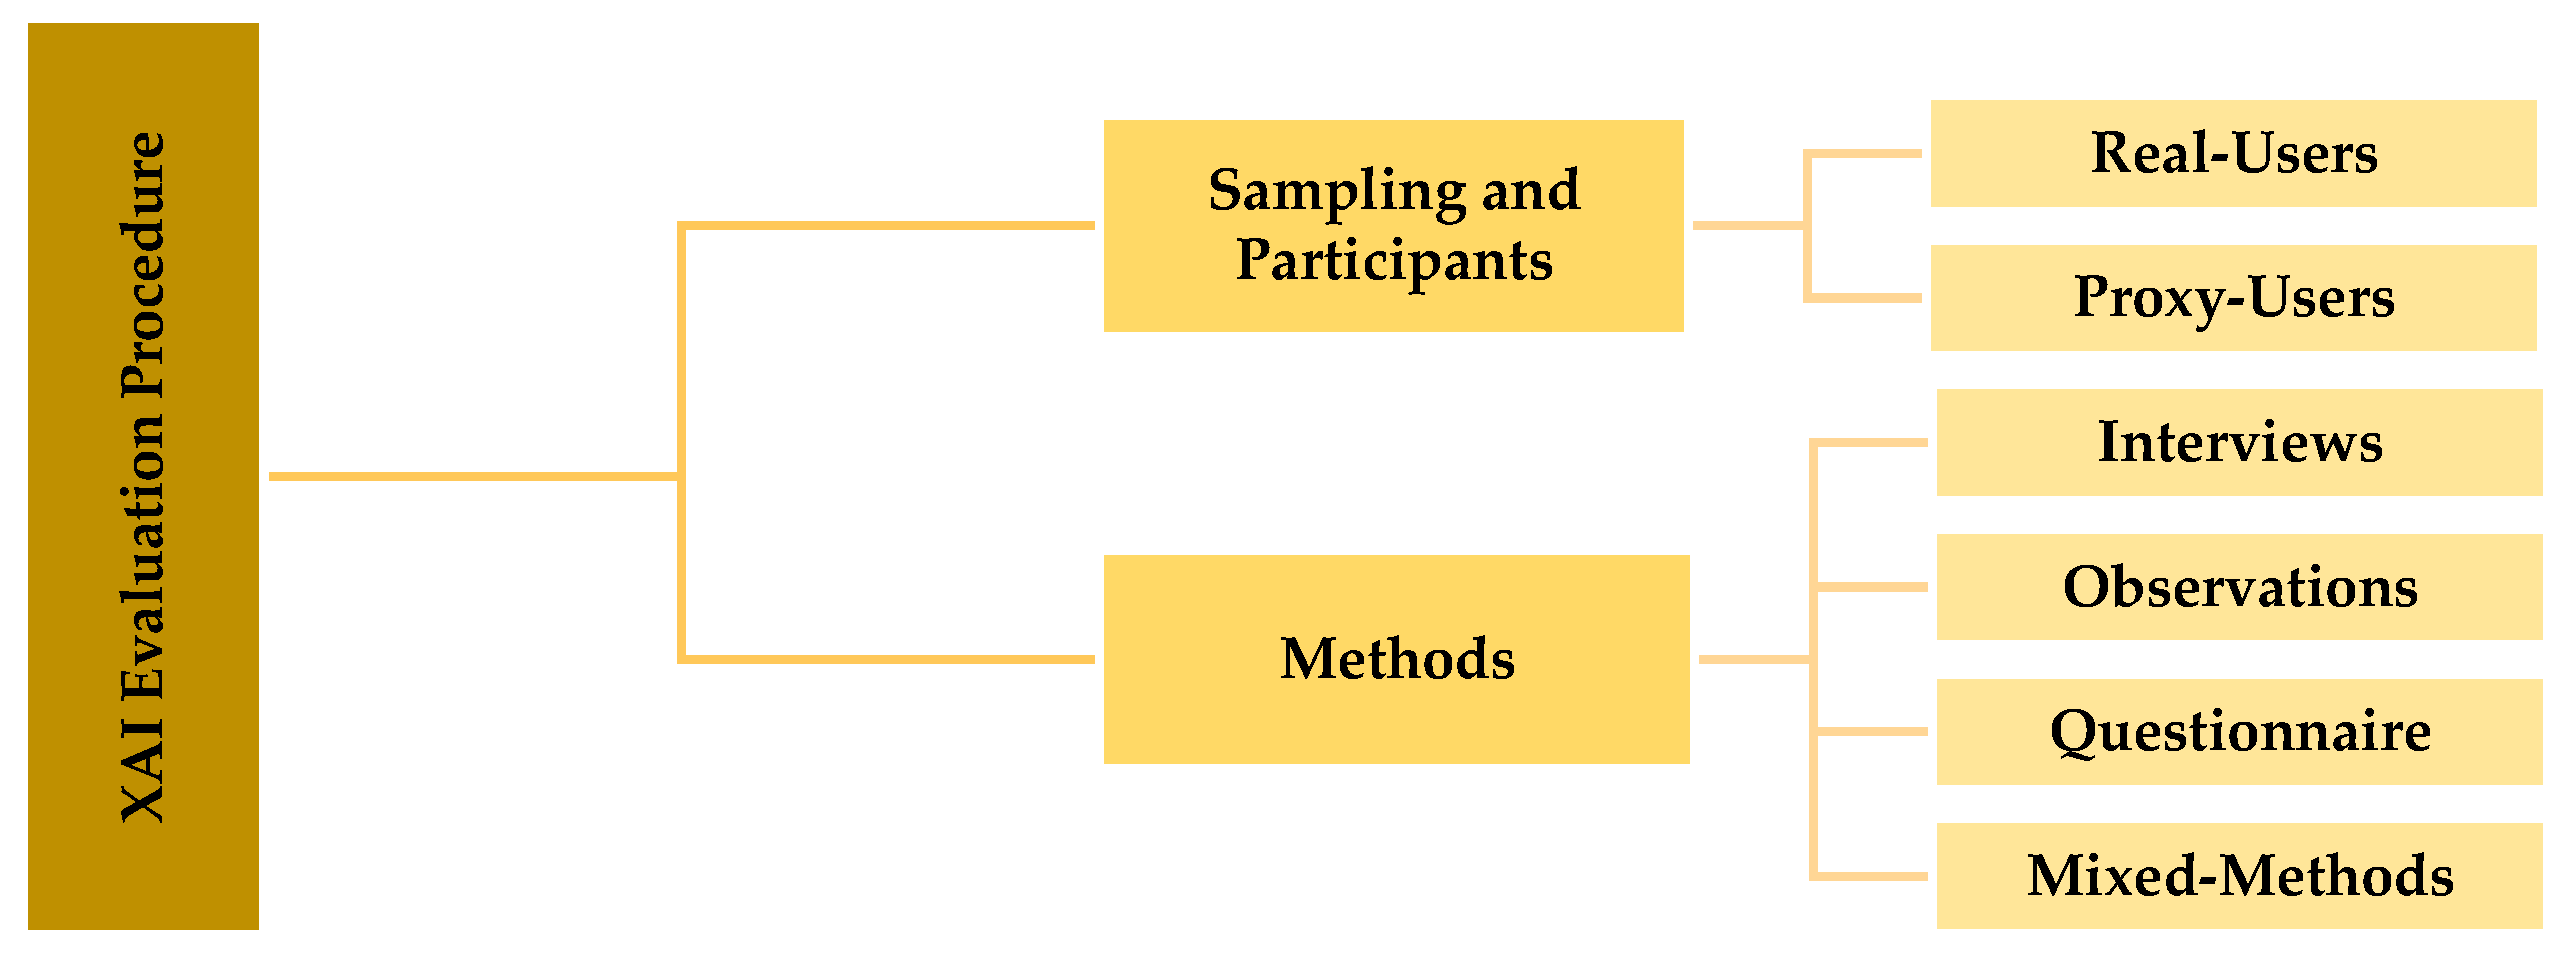
Figure 4.
The step-by-step approach of planning and conducting an XAI evaluation study.
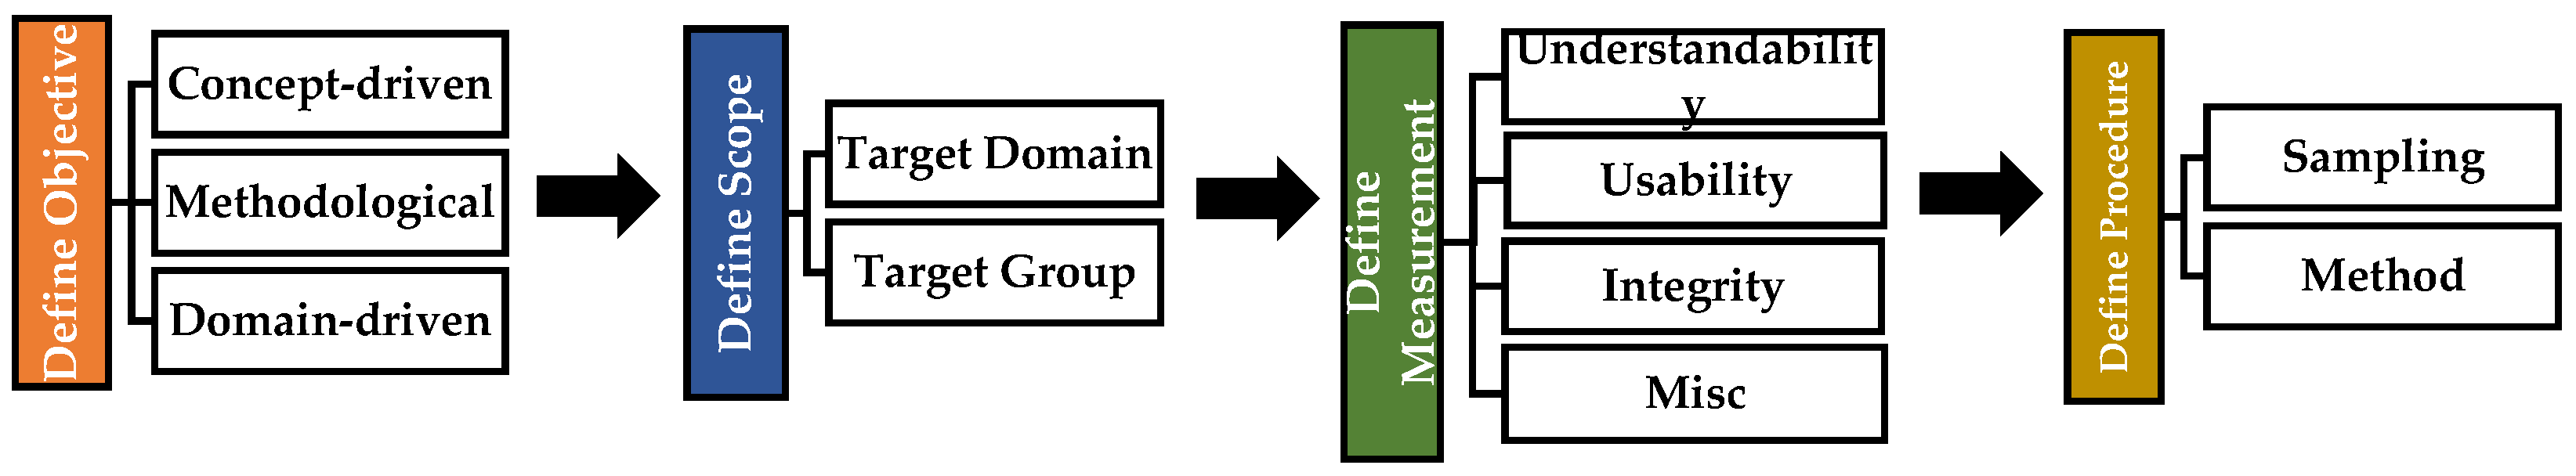

Table 1.
A summary of explanatory analysis of XAI evaluation studies w.r.t. existing literature
| Literature Source | Objective | Scope | Procedure | |||||||||||||
| Domain | Target Group | Sampling and Participants | Method | |||||||||||||
| Methodology-driven Evaluation | Concept-driven Evaluation | Domain-driven Evaluation | Domain-Specific | Domain Agnostic / Not Stated | Agnostic / Not stated | Developers/ Engineers | Managers/ Regulators | End Users | Not Stated | Proxy Users | Real Users | Interviews/ Think Aloud | Observations | Questionnaires | Mixed-Method | |
| Chromik et al. [14] | O | O | O | NA | NA | |||||||||||
| Alizadeh et al. [27] | O | O | O | O | O | O | ||||||||||
| Mohseni et al. [15] | O | O | O | O | O | O | ||||||||||
| Kaur et al. [28] | O | O | O | O | O | O | ||||||||||
| Lai et al. [29] | O | O | O | O | O | |||||||||||
| Ngo et al. [30] | O | O | O | O | O | |||||||||||
| Kulesza et al. [31] | O | O | O | O | O | |||||||||||
| Sukkerd [32] | O | O | O | O | O | O | ||||||||||
| Hoffman et al. [33] | O | O | O | O | O | |||||||||||
| Anik et al. [34] | O | O | O | O | O | O | ||||||||||
| Deters [35] | O | O | O | O | O | |||||||||||
| Guo et al. [36] | O | O | O | O | O | O | ||||||||||
| Dominguez et al. [37] | O | O | O | O | O | O | O | |||||||||
| Dieber et al. [38] | O | O | O | O | O | O | ||||||||||
| Millecamp et al. [39] | O | O | O | O | O | O | ||||||||||
| Bucina et al. [40] | O | O | O | O | O | O | ||||||||||
| Cheng et al. [41] | O | O | O | O | O | O | ||||||||||
| Holzinger et al. [42] | O | O | O | O | O | O | ||||||||||
| Jin [43] | O | O | O | O | O | |||||||||||
| Papenmeier et al. [44] | O | O | O | O | O | O | ||||||||||
| Liao et al. [45] | O | O | O | O | O | |||||||||||
| Cai et al. [46] | O | O | O | O | O | O | O | |||||||||
| Van der waa et al. [47] | O | O | O | O | O | O | ||||||||||
| Poursabzi et al. [48] | O | O | O | O | O | O | ||||||||||
| Narayanan et al. [49] | O | O | O | O | O | O | O | |||||||||
| Liu et al. [50] | O | O | O | O | O | O | ||||||||||
| Schmidt et al. [51] | O | O | O | O | O | |||||||||||
| Kim et al. [52] | O | O | O | O | O | O | O | |||||||||
| Rader et al. [53] | O | O | O | O | O | |||||||||||
| Ooge et al. [54] | O | O | O | O | O | O | ||||||||||
| Naveed et al. [55] | O | O | O | O | O | O | ||||||||||
| Naveed et al. [56] | O | O | O | O | O | O | ||||||||||
| Naveed et al. [57] | O | O | O | O | O | |||||||||||
| Tsai et al. [58] | O | O | O | O | ||||||||||||
| Guesmi et al. [59] | O | O | O | O | O | |||||||||||
| Naveed et al. [60] | O | O | O | O | O | |||||||||||
| Ford et al. [61] | O | O | O | O | O | |||||||||||
| Bansal et al. [62] | O | O | O | O | O | O | ||||||||||
| Kim et al. [63] | O | O | O | O | O | O | ||||||||||
| Dodge et al. [64] | O | O | O | O | O | O | ||||||||||
| Schoonderwoerd et al. [65] | O | O | O | O | O | O | O | O | ||||||||
| Paleja et al. [66] | O | O | O | O | O | O | O | |||||||||
| Alufaisan et al. [67] | O | O | O | O | O | |||||||||||
| Schaffer et al. [68] | O | O | O | O | O | O | O | |||||||||
| Colley et al. [69] | O | O | O | O | O | |||||||||||
| Zhang et al. [70] | O | O | O | O | O | |||||||||||
| Carton et al. [71] | O | O | O | O | O | |||||||||||
| Schoeffer et al. [72] | O | O | O | O | O | |||||||||||
| Kunkel et al. [73] | O | O | O | O | O | |||||||||||
| Jeyakumar et al. [74] | O | O | O | O | O | |||||||||||
| Harrison et al. [75] | O | O | O | O | O | |||||||||||
| Weitz et al. [76] | O | O | O | O | O | O | ||||||||||
| Fügener et al. [77] | O | O | O | O | O | |||||||||||
Table 2.
A summary of human-centered XAI evaluation measures
| Literature Source | Understandability | Usability | Integrity | Misc | |||||||||
|---|---|---|---|---|---|---|---|---|---|---|---|---|---|
| Mental Models | Perceived Understandability | Understanding Goodness / Soundness | Perceived Explanation Qualities | Satisfaction | Utility / Suitability | Performance / Workload | Controllability / Scrutability | Trust / Confidence | Perceived Fairness | Transparency | Other | ||
| Chromik et al. [14] | O | O | O | O | O | O | Persuasiveness, Education, Debugging | ||||||
| Alizadeh et al. [27] | O | ||||||||||||
| Mohseni et al. [15] | O | O | |||||||||||
| Kaur et al. [28] | O | O | O | O | Intention to use/purchase | ||||||||
| Lai et al. [29] | O | O | O | ||||||||||
| Ngo et al. [30] | O | O | O | O | Diversity | ||||||||
| Kulesza et al. [31] |
O | O | O | O | O | Debugging | |||||||
| Sukkerd [32] | O | O | O | O | |||||||||
| Hoffman et al. [33] |
O | O | O | O | O | O | O | O | Curiosity | ||||
| Anik et al. [34] |
O | O | O | O | O | O | |||||||
| Deters [35] | O | O | O | O | O | O | Persuasiveness, Debugging, Situ. Awareness, Learn/Edu. | ||||||
| Guo et al. [36] | O | O | O | O | O | ||||||||
| Dominguez et al. [37] |
O | O | O | O | Diversity | ||||||||
| Dieber et al. [38] | O | O | O | ||||||||||
| Millecamp et al. [39] | O | O | O | O | Novelty, Intention to use/purchase | ||||||||
|
et al. [40] |
O | O | O | O | O | ||||||||
| Cheng et al. [41] |
O | O | O | O | |||||||||
| Holzinger et al. [42] |
O | O | |||||||||||
| Jin [43] | O | O | O | O | Plausability2 | ||||||||
| Papenmeier et al. [44] |
O | O | Persuasiveness | ||||||||||
| Liao et al. [45] | O | O | O | Intention to use/purchase | |||||||||
| Cai et al. [46] | O | O | O | ||||||||||
| Van der Waa et al. [47] |
O | O | O | O | Persuasiveness | ||||||||
| Poursabzi et al. [48] |
O | O | |||||||||||
| Narayanan et al. [49] |
O | O | O | ||||||||||
| Liu et al. [50] | O | O | O | ||||||||||
| Schmidt et al. [51] | O | O | O | ||||||||||
| Kim et al. [52] | O | O | |||||||||||
| Rader et al. [53] | O | O | O | Diversity, Situation Awareness | |||||||||
| Ooge et al. [54] | O | O | O | O | Intention to use/purchase | ||||||||
| Naveed et al. [55] | O | O | |||||||||||
| Naveed et al. [56] | O | O | |||||||||||
| Naveed et al. [57] | O | O | O | O | O | ||||||||
| Tsai et al. [58] | O | O | O | O | O | O | Situation Awareness, Learning/Education | ||||||
| Guesmi et al. [59] | O | O | O | O | O | O | Persuasiveness | ||||||
| Naveed et al. [60] | O | O | O | O | Diversity, Use Intentions | ||||||||
| Ford et al. [61] | O | O | O | O | O | ||||||||
| Bansal et al. [62] |
O | O | O | ||||||||||
| Kim et al. [63] | O | O | O | ||||||||||
| Dodge et al. [64] |
O | ||||||||||||
| Schoonderwoerd et al. [65] | O | O | O | O | Preferences | ||||||||
| Paleja et al. [66] |
O | O | Situation Awareness | ||||||||||
| Alufaisan et al. [67] |
O | O | O | ||||||||||
| Schaffer et al. [68] |
O | O | Situation Awareness | ||||||||||
| Colley et al. [69] | O | O | Situation Awareness | ||||||||||
| Zhang et al. [70] | O | O | Persuasiveness | ||||||||||
| Carton et al. [71] | O | O | |||||||||||
| Schoeffer et al. [72] | O | O | O | ||||||||||
| Kunkel et al. [73] |
O | Intention to use/purchase | |||||||||||
| Jeyakumar et al. [74] |
Preferences | ||||||||||||
| Harrison et al. [75] |
O | Preferences | |||||||||||
| Weitz et al. [76] | Preferences | ||||||||||||
| Fügener et al. [77] |
O | O | Persuasiveness | ||||||||||
Disclaimer/Publisher’s Note: The statements, opinions and data contained in all publications are solely those of the individual author(s) and contributor(s) and not of MDPI and/or the editor(s). MDPI and/or the editor(s) disclaim responsibility for any injury to people or property resulting from any ideas, methods, instructions or products referred to in the content. |
© 2024 by the authors. Licensee MDPI, Basel, Switzerland. This article is an open access article distributed under the terms and conditions of the Creative Commons Attribution (CC BY) license (http://creativecommons.org/licenses/by/4.0/).
Copyright: This open access article is published under a Creative Commons CC BY 4.0 license, which permit the free download, distribution, and reuse, provided that the author and preprint are cited in any reuse.


