
Submitted:
29 September 2024
Posted:
01 October 2024
You are already at the latest version
Abstract
Remote sensing (RS) and Geographic Information Systems (GIS) provide significant opportunities for monitoring and managing natural resources across various temporal, spectral, and spatial resolutions. There is a critical need for natural resource managers to understand the expanding capabilities of image sources, analysis techniques, and in-situ validation methods. This article reviews a range of image analysis tools applicable to natural resource management, including agriculture, water, forests, soil, and natural hazards, and compares their functionalities. Our study highlights that Google Earth Engine (GEE) is favored for wide-area analysis due to its extensive coverage and free access. Global Mapper excels in 3D and light detection and ranging (LIDAR) data, environment for visualizing images (ENVI) specializes in multi- and hyperspectral image processing, ERDAS IMAGINE is optimal for radar data, and eCognition is used for object-based image analysis. The article emphasizes the importance of in-situ validation data, which provides essential ground truth information to calibrate and validate RS models, thereby enhancing accuracy. Understanding these tools and integrating them with in-situ validation techniques enables natural resource managers to improve their monitoring and decision-making processes, facilitating effective collaboration with RS researchers.
Keywords:
remote sensing
; artificial intelligence
; neural network
; machine learning
; in‐situ validation
1. Introduction
The field of Smart Technology is a rapidly evolving amalgamation of hot topic technologies, including big data, cloud computing, remote sensing (RS), machine learning (ML), artificial intelligence (AI), the Internet of Things, and low-cost sensors, all of which are currently being used in some capacity to enhance agricultural and forest management across the world [1,2]. However, the pace of advancement has often created disparities between the application of these technologies and the accessibility of the data products by end users, especially the broader public outside the scientific community[3]. While increased access to on-farm, in-forest, and in-city data products has the potential to revolutionize agriculture and forestry, understanding the current state of RS, image processing tools, the role of AI, and the value of in-situ validation data will be critical to successful application of Smart Technology [4].
At the core of contemporary natural resource management is Geographic Information Systems (GIS), a powerful tool that facilitates the integration and spatial analysis of various data sets. GIS is a computer-based system designed to handle georeferenced data, including graphic and attribute data, as well as input from Global Positioning System (GPS), plotters, network connections, CD-ROM drives, printers, and other software. This system proves invaluable for information analysis, automated mapping, and data integration, offering user-friendly access to extensive data. GIS enables natural resource managers to interactively analyze large datasets and present results in formats that are directly relevant and useful for decision-making processes.
The layering capabilities of GIS allows for multiple types of data to occupy the same geographic space. Integrated layers, such as remotely sensed imagery and georeferenced data sets, can then be analyzed to identify spatial relationships. A key objective of GIS is to assist decision making processes for the management of natural resources. In the past decade, RS has rapidly developed alongside GIS, offering abundant information, faster processing times, increased availability, and a wide variety of product types, making it an indispensable tool for researchers across multiple disciplines [5]. Currently, land use and land cover (LULC) information obtained through RS technology have become crucial data products in natural resource management [6]. Accurate analysis and interpretation of RS images are vital for the sustainable management of natural resources. LULC serve as key indicators of the earth's surface, reflecting changes in spatial patterns that are closely linked to global ecological evolution, climate change, and ecological sustainability [7]. Furthermore, these factors significantly impact land-ocean interactions, the ecological environment, and atmospheric conditions [8].
In the last decade, we have seen a marked increase in the symbiotic use of RS tools and emerging AI and ML technologies. AI refers to systems that mimic human intelligence by perceiving their environment, analyzing data, and making decisions or taking actions autonomously to achieve specific goals. This definition encompasses both basic algorithms and advanced techniques like ML and deep learning (DL), highlighting AI's adaptability and goal-oriented nature [9]. ML is a subset of AI that involves algorithms enabling systems to learn from data, identify patterns, and make decisions or predictions with minimal human intervention. ML focuses on improving performance over time by adapting to new information, making it crucial for tasks like data analysis, image recognition, and natural language processing [9]. Within AI, a key sub-category is ML, which focuses on the ability of systems to learn from data patterns and improve their performance over time without being explicitly programmed for each task [10]. The potential of the technology is clear; large and complex datasets can be processed rapidly and autonomously, minimizing the need for direct human intervention [11]. In the field of natural resource management, integrated approaches that combine RS with AI have proven effective in applications ranging from yield prediction in agricultural fields [12,13] to the quantification of urban forest fragmentation [14].
While the integration of RS and AI offers a promising future for natural resource managers, there remains a critical need for in-situ validation measurements to build and train image processing models [15]. Though the increase in the abundance and quality of remotely sensed data products and the methods for image processing have greatly improved research in the fields of forestry and agriculture, there are still limits with this technology. For example, recent studies have noted that satellite revisit time often presents a substantial challenge for land use classification (Lark et al., 2015; Wang et al., 2022), underlining the need for high-quality in-situ validation data. An accounting of available in-situ validation data would improve accessibility and foster further growth within the field of RS and natural resource management.
The absence of in-situ validation data poses a significant challenge in many RS applications, as algorithms and models typically need such data for accurate calibration and validation. While land cover mapping can sometimes overcome this hurdle by manually selecting in-situ validation data from high-resolution satellite imagery, distinguishing between harvested and unharvested fields, for example, can be much more challenging. For mapping harvest dates, both phenological curve analysis and interferometric coherence analysis depend on in-situ validation data. However, existing research often relies on census data, which, as previously mentioned, has notable limitations and lacks scalability. In the United States, the Department of Agriculture (USDA) conducts regular field surveys with a large team of approximately 4,000 personnel and publishes weekly Crop Progress Reports [18]. Unfortunately, this data is only available at an aggregated state level [19]. In many other countries, even state-level aggregated harvest date data is not publicly accessible. This scarcity of field-level in-situ validation data has significantly hindered the RS of harvest dates.
In-situ images can serve as valuable validation data for assessing field conditions [20]. In recent years, DL methods, particularly those utilizing various convolutional neural networks (CNNs), have been applied to classify land cover types using crowd-sourced geo-referenced field photos and images from Google Street View vehicles [21,22]. Although these studies have produced encouraging outcomes, the uncontrolled nature of image collection can result in biased sampling of in-situ validation data, particularly concerning spatial and temporal coverage. To mitigate this issue, we need a better in-situ validation data to predict the model with better accuracy.
The field of natural resource management is increasingly adopting various Smart Technology innovations; however, the rapid advancement in hardware and software have outpaced the study in the efficacy of the tools for the efficient and accurate study of image classification. To ameliorate this need, we conducted a literature review to identify the growth of image processing tools and emerging uses between 1990 to 2010 and from 2010 to 2024 based upon the peer reviewed articles published. We then highlight three case studies demonstrating the use of AI and ML to process remotely sensed images in the field of natural resource management. In addition, we conducted a systematic review of available field data and developed a user-friendly database which can be queried to identify them based on need.
The integration of advanced software platforms for geospatial analysis, RS, validation and image processing is necessary for the advancement and improvement of natural resource management. This paper 1) will highlight five platforms with unique strengths that are instrumental in processing the complex and diverse datasets emerging from modern natural resource management efforts (see Table 1), and 2) provide the reliable in-situ validation data source for better prediction and accuracy. Google Earth Engine (GEE) offers cloud-based processing capabilities, enabling large-scale environmental data analysis. Environment for visualizing images (ENVI) provides advanced tools for spectral analysis and image classification, widely used in RS. ERDAS IMAGINE supports comprehensive raster data processing and photogrammetry. Global Mapper is valued for its versatility in GIS data management mostly UAVs, light detection and ranging (LIDAR), while eCognition specializes in object-based image analysis, allowing for detailed feature extraction. These platforms were the five most employed platforms identified in the systematic review.
1.1. Google Earth Engine (GEE)
GEE, introduced in 2010, is a cloud-based platform designed to handle large-scale geospatial data processing using Google's infrastructure. It is accessible for free to those in education and research fields. GEE aims to offer a robust platform for large-scale algorithm development, support impactful research by providing unrestricted access to data and tools, and contribute to the global challenges of managing and analyzing big data effectively [23,24].
GEE has a vast catalog on the petabyte scale, including information from Landsat, Sentinel, and MODIS satellites and data on climate models, temperature, and geophysical characteristics [24,25]. The intuitive interface includes a code editor, or integrated development environment (IDE), for the JavaScript programming language [26,27]. A graphics window is built into the user interface to allow for ready interpretation of the processes conducted. Programs can also be written in Python, available through the Earth Engine library [28,29], and R [30,31]. For users with limited programming experience, GEE offers a simplistic interface known as “Explorer”. Both platforms enable the import of local data and the export of information for further processing or visualization in GIS software like QGIS (Version 3.28) and ArcGIS Pro (Version 3.1.2), among others [32,33].
In geoscience and RS, GEE has emerged as a valuable tool for handling large datasets and facilitating various applications, such as monitoring agricultural productivity[34], tracking vegetation changes [35,36], mapping mangroves [37], analyzing LULC [38,39], and assessing forest fires [40]. These applications highlight GEE's capacity to support large-scale data management and foster scientific research [41]. Conducting a bibliometric analysis can help identify research gaps and future directions within a field [42], providing an objective overview of the impact and influence of the research area and tracking the evolution of scholarly publications [43].
Rapid advancements in AI are poised to further enhance GEE's capabilities. We focus on AI: computer vision (CV), ML, and DL, a subset of ML. These technologies are crucial for harnessing big data across various domains and have driven significant progress in applications with substantial social impact, such as damage assessment and natural disaster prediction (e.g., automated flood damage assessment [23] and wildfire prediction [44,45], as well as healthcare [40,46,47]. Geospatial artificial intelligence (GeoAI) integrates techniques from spatial science (e.g., GIScience and RS), AI, data mining, and high-performance computing to derive valuable insights from geospatial big data [48]. While GeoAI builds on GIScience methods applied to RS data, it has expanded the capabilities of AI to address geospatial-specific big data challenges and issues.
Recent literature reviews have extensively covered the advancements and research applications of GEE. Key reviews include: (i) an examination of the platform’s usage, trends, and potential since its inception[24], ii) a review focusing on GEE’s applications in geographic big data [49], and iii) (iii) an analysis of the development of scientific output related to Google Earth (GE) and GEE through a scientometric approach [50]. These studies provide valuable insights by offering systematic and scientometric reviews of various GEE applications.
1.2. The Environment for Visualizing Images (ENVI)
The Environment for Visualizing Images (ENVI) tool was launched in 1994. ENVI image analysis and processing software is designed to be accessible to a broad range of users, from beginners to experts in the field. Its user-friendly interface and intuitive tools allow users to obtain actionable results without requiring extensive training in RS. ENVI offers a comprehensive range of data visualization, processing, and analysis tools, organized into distinct tasks that guide users through the image processing workflow [51]. These tools cover various functions, including data calibration, pre-processing, atmospheric correction, pan sharpening, orthorectification, and image registration. ENVI workflows enable users to detect changes and anomalies, measure and extract features, and model topographic characteristics. The software also facilitates the generation and sharing of reports, enhancing its efficiency and effectiveness for a wide range of applications [51].
ENVI accommodates a broad spectrum of data formats, including scientific formats like HDF and CDF, as well as image types such as GeoTIFF and JITC-compliant NITF. The software excels in integrating diverse data types—radar, LIDAR, synthetic aperture radar (SAR), optical, hyperspectral, multispectral, stereo, thermal, and acoustic data—to leverage the strengths of different sensors and produce comprehensive geospatial products. ENVI is compatible with imagery from contemporary satellite and airborne systems, including Sentinel, Landsat, AVIRIS Hyperspectral, Planet Dove and SkySat, NPP VIIRS, GOES, Pleiades, SPOT, WorldView, RADARSAT, TerraSAR-X, and commercial LIDAR sensors. Its advanced spectral image processing and analysis capabilities, grounded in established scientific methods, enable users to detect targets, assess vegetation health, map materials of interest, and conduct various environmental and defense-related analyses [51].
Recent studies highlight the capabilities of ENVI in handling diverse geospatial data formats to enhance image analysis. Recent studies highlight the capabilities of ENVI in handling diverse geospatial data formats to enhance image analysis like, [6] developed a prediction model for Chinese pear quality using hyperspectral imaging and artificial neural network (ANN). [52] employed hyperspectral imagery to detect subtle bruises on apples, while [53,54,55] used hyperspectral laser-induced fluorescence imaging to non-destructively assess soluble solids content and surface contamination on navel oranges. Additionally, [56,57,58] detected fecal contamination on apple cantaloupes using hyperspectral fluorescence imagery. [59] applied hyperspectral imaging to identify surface defects on tomatoes. These studies highlight ENVI's strong capabilities in hyperspectral image analysis.
ENVI supports various processes including data calibration, pre-processing, atmospheric correction, pan sharpening, orthorectification, and image registration. Its workflows are useful for detecting changes and anomalies, measuring and extracting features, modeling topographic characteristics, and more. A typical spectral workflow in ENVI includes data preparation, creating spectral libraries, target detection, mapping unique materials, and visualization.
1.3. ERDAS IMAGINE
Launched in 1978, ERDAS IMAGINE provides an extensive suite of tools for displaying, editing, and analyzing point clouds from LIDAR or stereo pair correlations [60]. Its user-friendly interface streamlines workflows, enhancing efficiency by allowing users to focus on analysis rather than data processing. The software’s robust algorithms and data processing functions operate in the background, reducing manual correlation efforts by offering quick display capabilities and supporting multiple datasets in geographically linked viewers.
ERDAS IMAGINE excels in editing and classifying hyperspectral and LIDAR datasets and features modules for 3D viewing and vector display. It uses the ERDAS IMAGINE Macro Language (EML) for programming. The software also includes a ribbon layout designed for ML and DL workflows, which supports AI-based feature extraction from imagery. This feature enables users to collect training samples, train algorithms, and extract information from new images within a unified interface [61].
ERDAS IMAGINE is designed to be user-friendly, catering to both beginners and experienced users, and enables professional-level imagery processing. The software supports a range of workflows, including data conversion, orthorectification, color balancing, mosaicking, land-cover mapping, terrain categorization, and LIDAR editing and classification. It also provides tools for map and report generation, feature capture and update, spatial modeling, and terrain analysis. For instance, it has been used for monitoring natural resources in conflict areas through object-based multiscale image analysis [62].
ERDAS IMAGINE Advantage enhances the capabilities of IMAGINE Essentials by offering more precise mapping, support for sensor models, and advanced geospatial data processing functions, such as point cloud editing, surface interpolation, radar analysis, and advanced image interpretation [61]. This version includes extended features from IMAGINE modules, facilitating more detailed mapping and advanced geospatial data processing [60,61].
The ERDAS IMAGINE Image tool performs image classification to identify terrestrial features based on spectral analysis. It employs two primary methods: supervised and unsupervised classification. In unsupervised classification, the software automatically clusters pixels based on their spectral properties without predefined categories. These clusters are then analyzed to identify terrestrial objects [63]. In supervised classification, users select representative samples or "training areas" for each category they wish to identify, guiding the classification process accordingly. Recent studies highlight the capabilities of ERDAS IMAGINE in handling diverse geospatial data formats to enhance image analysis like, [64] utilized remotely sensed and elevation data in ERDAS IMAGINE identifying and classify bare soil erosion risk areas in Hatila Valley Natural Protected Area in northeastern Turkey. Additionally, high-resolution IKONOS imagery was used in ERDAS IMAGINE 9.0 for land use classification [64].
These studies demonstrate ERDAS IMAGINE's capability as a powerful tool for radar image analysis. In terms of pre-processing, ERDAS IMAGINE offers various enhancement techniques to improve image quality, including min-max filtering, Gaussian filtering, invert filtering, histogram equalization, and contrast stretching [60]. Among these, histogram equalization has been found to produce the best results by enhancing areas with low contrast. To achieve optimal image enhancement, a hybrid approach using multiple methods is often recommended.
1.4. Global Mapper
Global Mapper, launched in 2001. Global Mapper stands out as a versatile GIS software solution that caters to both beginners and experienced professionals in the geospatial field [65]. With its intuitive interface and extensive data processing capabilities, users can seamlessly work with over 300 file formats, covering vector, raster, elevation, and point cloud data types. The software's ability to reproject data on-the-fly and support various projections ensures compatibility and accuracy across datasets. Global Mapper also integrates with numerous online data services, providing access to aerial imagery, elevation data, and satellite imagery, among others, making it a robust tool for comprehensive spatial analysis and visualization [65].
One of Global Mapper's key strengths lies in its advanced digitizing and editing tools for vector data. Users can create, edit, and manipulate vector features with precision, including specialized geometric features like range rings and grids. The software supports complex spatial operations such as Intersection, Union, and Difference, and offers robust attribute and geometry editing capabilities. Combined with its scripting and batch processing tools, Global Mapper allows for efficient automation of GIS tasks, enhancing productivity and workflow management in both small-scale projects and large-scale operations [65].
Global Mapper provides additional export options for web tile formats, creating a series of raster tiles from the loaded map data. These exports are compatible with popular online map formats like Google Maps and Bing Maps [66].The export process also generates an HTML file to display the tiles in the chosen web interface, complete with standard map navigation and layout tools. Additionally, through a partnership with Mango Map, users can upload map data directly from Global Mapper to a Mango-hosted map site, which facilitates easy sharing with end-users [66]. The Pixels-to-Points tool is particularly beneficial for Unmanned Aerial Vehicle (UAV) operators, as it converts simple drone-captured images into a 3D model of a project area. This tool provides foundational data for extensive classification, Digital Elevation Model (DEM) creation, and feature extraction capabilities[67]. The tool, currently in beta release, enables the transformation of overlapping aerial images, such as those from UAVs, into a high-density point cloud [67]. Using the principles of photogrammetry, which involve deriving measurements from photographs, the Pixels-to-Points tool analyzes the relationship between identifiable objects in consecutive images to establish the three-dimensional coordinates of points representing the surface. This tool generates a point cloud and can also create an orthorectified image, effectively stitching and adjusting images to match their three-dimensional coordinates [67]. It enhances the ground point detection process, particularly in areas with large buildings, introduces a new geographic point sorting option for faster rendering and analysis, supports reading and writing LAZ (LasZip) files with LAS 1.4 fields, provides the ability to grid a point cloud with RGB values into an image layer, and includes an improved noise point detection and classification tool [67].
Recent studies highlight the capabilities of global mapper in handling diverse geospatial data formats to enhance image analysis like, using ML to classify unique features in point cloud data: bridge infrastructure, identify utility corridor encroachment, modelling dam construction, road site planning, measuring and manipulating gold course terrain, and using spatial data in land management decisions [65]. These studies underscore the value of global mapper as a powerful tool for UAV LIDAR data analysis. It works better for the small area and for point cloud processing.
1.5. eCOGNITION
eCognition, introduced by Trimble in 2000 [68], is a cutting-edge image analysis tool that has transformed the way geospatial data is [69] processed and interpreted. Specializing in object-based image analysis (OBIA), eCognition shifts from traditional pixel-by-pixel classification to grouping pixels into meaningful objects or segments. This method enhances classification accuracy by considering spatial relationships and contextual information within the imagery. As a result, eCognition is highly effective in various applications, such as environmental monitoring, urban planning, and agriculture. By mimicking human cognitive processes, the software integrates diverse geospatial data through patented segmentation and classification techniques, allowing it to identify and analyze objects based on their color, shape, texture, size, and contextual relationships, like an experienced analyst [69].
This advanced approach enables eCognition to dynamically classify and analyze different types of geospatial data, including imagery, vectors, and point clouds. The iterative segmentation and classification process builds a powerful cognitive network, which significantly enhances the depth and value of the information extracted. Users can further customize their analysis by combining various steps—such as object creation, classification, and detection—into a Rule Set or a custom application. This flexibility allows for the transformation of raw geospatial data into actionable geo-information, making eCognition a comprehensive and automated tool for geospatial data interpretation.
Recent studies have highlighted eCognition's ability to handle diverse geospatial data formats, demonstrating its effectiveness in fields such as surveying and mapping, transportation infrastructure, utilities, oil and gas, mining, and public safety. These studies emphasize eCognition's value as a powerful tool for hyperspectral image analysis, further solidifying its role as a leading solution in the geospatial data analysis landscape [69].
2. Literature Review
The literature was conducted using major online databases and library catalogs including Google Scholar and ResearchGate. The request and beautiful soup function were used in the python version 3.11. The initial search started in January 2024 with query “Google Earth Engine Image Analysis for Natural Resources”, “ENVI Image Analysis for Natural Resources'', “ERDAS IMAGINE Image Analysis for Natural Resources”, and “Global Mapper Image Analysis for Natural Resources” which yielded a total of almost 20,000 scientific articles. Using different keywords such as “RS”, “GIS”, “ERDAS IMAGINE”, “ENVI”, “GEE”, “eCognition”, and “Global Mapper”, many articles were retrieved from Google Scholar and ResearchGate. Because of the limited application programming interface (API) key only the google scholar and research gate the two databases were accessed, and the articles were retrieved. The 0.5 second time was given to prevent getting blocked by the site. The next step involved identifying how many of these articles utilized each specific tool. To narrow down the results further, more specific search terms like "natural resources management using GEE '' were employed, which specifically filtered for studies utilizing GEE. The similar steps go for other tools. This systematic approach allowed for the identification and analysis of the number of articles published using these tools, particularly in the field of natural resources management. Under this selection criteria, we identified 12,837 total articles related to all these tools. We divided the article publication date into two-time intervals, the first from 1990-2010 and second from 2010-2024 (see Figure 1). We then made a bar chart showing the change in use for each image processing tool between the two-time intervals. The major limitation is the lack of API key to access other database like Zotero, Mendeley and Libraries. This literature review gives the general idea of how the change in use of different tools occurred with the time interval.
3. Case Studies of AI in RS Applications
3.1. Classification
Automated species identification of forest trees would save natural resource managers time and money when planning conservation actions and timber harvests. While spectral differences between tree species have repeatedly been proven in laboratory settings, the lack of high resolution spatial and spectral imagery, ML algorithms, and robust in-situ data has limited the applicability of these methods in the field. The most promising identification models currently available integrate hyperspectral imagery (i.e., images that cover a contiguous and continuous range of wavelengths) and LIDAR, which has been defined as a data fusion approach [70].
ML can be applied to this data fusion approach through CNNs. This algorithm characterizes the hyperspectral signatures and places the pixel information within a spatial context using the LIDAR dataset. A CNN classifier developed by Fricker et al 2019, was tested within the Teakettle Experimental Forest northeast of Freson, CA using GPS coordinated tree inventories collected via field surveys as the training dataset. Hyperspectral imagery, consisting of 426 bands ranging from 280 to 2510 nm, Red-Green-Blue imagery, and LIDAR was captured by manned aerial vehicles to obtain a spatial resolution of approximately 1 m. Two data fusion CNN models were then developed, the first using hyperspectral imagery, and the second using the RGB imagery. Approximately 700 trees, consisting of seven different species, were used to train, test, and validate the custom CNNs, comparing the accuracy between the models.
In this analysis, the hyperspectral CNN model proved to be substantially more accurate, outperforming the Red Green Blue (RGB) model CNN model by 23%. Species were correctly classified 87% of the time with some variation between the genera included in this study; for example, pine species were correctly classified with at least 90% precision, while the precision of fir and oak species fell below 80%. The framework presented by this study offers a repeatable method that should be improved over time, and in different regions.
3.2. Early Detection
Early detection of pests and diseases afflicting agricultural commodities is critical to maintaining economic productivity. Orchards and nurseries are of particular interest in pest and disease management due to relatively large capital investments required for planting and maintenance. One of the most serious diseases afflicting orchards in the United States is Citrus greening, or Huanglongbing (HLB), which has decreased citrus acreage and yield in Florida by 38% and 74%, respectively, between 2005 and 2018 [73]. Currently, there is no known cure for HLB, and the removal of all symptomatic trees is the most effective method to prevent the spread to healthy trees.
While mitigation practices have anecdotally shown to limit the spread of HLB in Florida nurseries, the need to rapidly test for, and then quarantine, impacted orchards remains a pressing concern. The most prevalent diagnostic methods for large scale orchards, field analysis and laboratory biochemical analysis, are both time intensive and expensive, which limits the ability of agriculturalists to identify outbreaks and restock post removal. However, advancements in RS and ML algorithms have increased the accuracy in HLB detection and decreased costs and time in detecting the disease.
Recent studies, such as [74], have utilized drones outfitted with hyperspectral cameras to detect differences in reflectance between HLB infected and healthy citrus trees. The pixel data from the images was fed through a ML algorithm which incorporated 62 vegetative indices (e.g., NDVI) as well as 15 canopy feature parameters (e.g., area features) resulting in a detection model based on multi-feature fusion. While more complex than other HLB detection models, the inclusion of the physiological characteristic of the citrus trees increased the accuracy to 99.72% for the verification dataset. Further research is required to address the prevalence of false positives.
This melding of ML algorithms and hyperspectral remotely sensed datasets has been demonstrated as a useful tool in early detection of various plant diseases. Developing similar models to address similar emerging forest threats, such as Beech Leaf Disease, may improve our ability to quarantine infected stands and plan salvage operations to prevent wildfire. In agriculture, frequent drone missions can monitor crop health and aid in the application of fertilizers and pesticides.
3.3. Decision Making
A growing component of the public policies aimed at mitigating and adapting to climate change include green infrastructure within urban spaces [75]. Urban forests can provide several ecosystem services which contribute to improved quality of life, reductions in surface water runoff, cooling effects, reductions in air pollution, and noise absorption [76,77,78]. However, tree plantings in urban areas must be made with careful planning to, i) avoid as much as possible damage to sidewalks, roofs, wirings, and drainage systems, ii) mitigate potential risk of falling branches [79], and iii) maximize ecosystem services [80]. Regardless of the level of care taken when planting the tree, it will eventually need to be removed to preemptively prevent collapse. Thus, monitoring the risk of falling is a critical component of green infrastructure management. AI can be employed through risk analysis protocols to prioritize investment from managers.
The urban trees of Itanhaém, São Paulo, Brazil pose a considerable risk due to insufficient planning and neglect. To address this problem, a protocol was developed to classify urban trees by integrating three visual assessment methods. Key variables in this model included crown area, root injuries, and target frequency, among others. Data was collected from 230 urban trees, including Terminalia catappa, Ficus benjamina, and Delonix regia, using a smartphone and the ODK Collect app for data storage and processing. Using the Decision Tree algorithm (C4.5) in the WEKA software, the study identified 14 out of 36 variables as sufficient to determine tree risk, achieving a 73% accuracy rate.
The findings underscore the potential of AI to enhance urban forestry management by identifying and prioritizing high-risk trees more efficiently. The decision tree model demonstrated a significant reduction in the number of variables needed for accurate risk classification. However, the model showed some limitations in classifying high-risk trees accurately, suggesting the need for further refinement and a larger dataset of high-risk trees. Overall, this research emphasizes the importance of incorporating AI and predictive models in urban tree management practices to improve the safety and sustainability of urban forests.
3.4. Perils of AI
While AI shows great promise in the fields of RS and natural resource management, it is necessary to highlight some of the main current issues that require continued research to ameliorate. Across the case studies examined, three main perils of AI were noted frequently by authors, i) data availability and quantity, ii) the black-box problem, and iii) high computational demand.
The ability for the AI to function most effectively relies on having an excellent source of high-quality training data. Issues with incomplete, inconsistent or low-resolution data will significantly impact function and performance.
One of the fundamental perils of AI is known as the black-box problem. As detailed in each case study examined above, AI can rapidly and effectively execute an algorithm based on a training dataset, however exactly how the model comes to the correct, or incorrect, conclusion can be almost impossible to assess. Furthermore, “hallucinations” or incorrect conclusions presented as facts, can have negative impacts on decision making based on AI. Currently there are two main approaches to addressing the black-box problem, limiting the use of AI altogether through regulatory frameworks, and developing “explainable” AI algorithms. The former approach has become common in high-stakes applications. The latter involves understanding how specific inputs drive decision-making, and as of now, remains an unsolved problem.
Complex AI algorithms such as CNNs have very high computational demands. This is a critical issue across all computing sciences and limits the application of these tools. Processing large datasets with sophisticated AI models require substantial computational resources. Access to these levels of computation can be limited to a select few research institutions and private corporations.
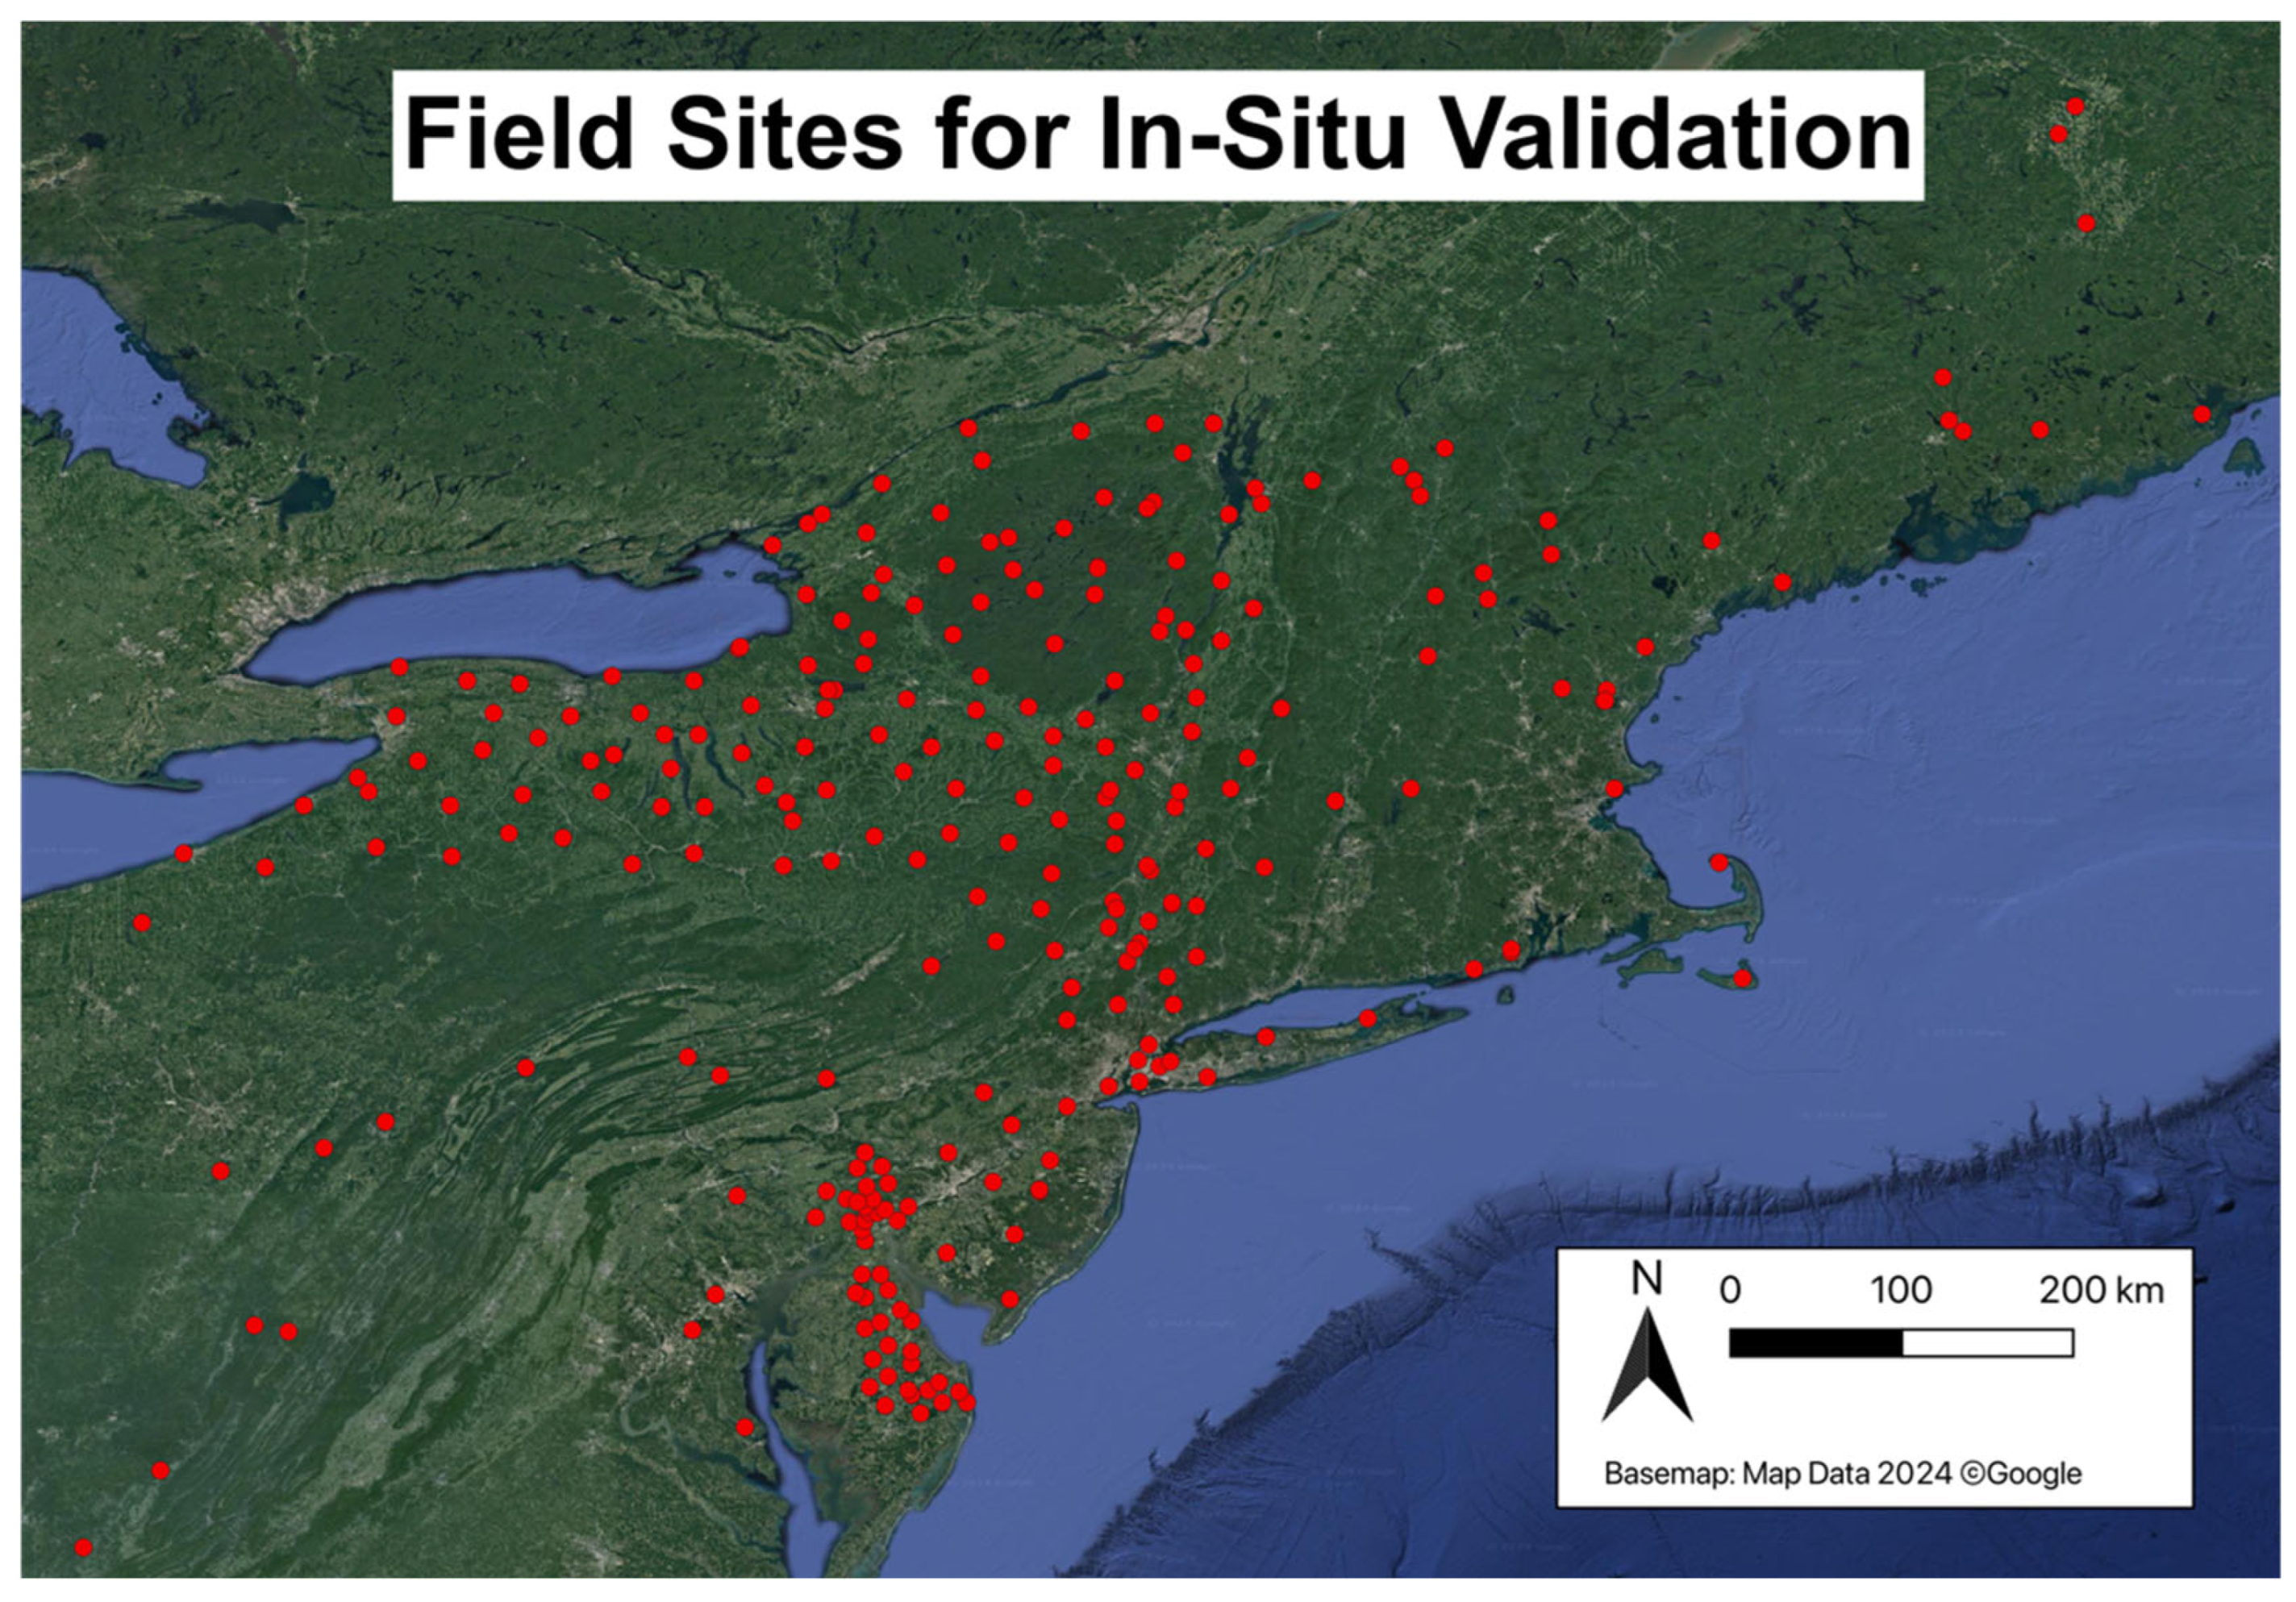
Figure 2.
Map of sites identified and included in database.
3.5. In-situ Validation Data Availability
Available in-situ validation data is collected across the USDA FS Northeast Climate Hub in a wide variety of national research networks, regional cooperatives, and statewide mesonets, as well as several independent field stations. As it stands, this data is spread out across dozens of data portals and user interfaces, complicating the process of acquiring necessary data for any research or management project. Here, we attempt to catalog the data available and develop an easy to use, data query platform to identify data products across the northeast in a single location. In this catalog, we include national research networks, statewide mesonets, and independent field stations.
National research networks, such as the Long-Term Ecological Research Network (LTER) and the United States Department of Agriculture Forest Service Experimental Forests and Ranges (EFRs), are located across the country in ecologically significant sites. The individual stations are often developed around a longstanding experiment, secured by stable funding commitments, and support numerous short-term auxiliary experiments [81]. Each station is typically equipped with a uniform sensor array to provide methodological standardization [82]. Though budgetary restrictions are always a concern, the national scale of these networks often allow for cutting edge data collection, such as high-resolution airborne RS platforms and eddy covariance towers [83]. While these networks are critical to answering pressing research questions, such as the consequences of forestry management techniques or nutrient applications [84], there is often a lack of spatial scale to meet the pressing questions of global change [85].
Statewide mesonets, such as the New York State Mesonet and the Delaware Environmental Observing System, are generally planned as spatially intensive and uniform, and collect specific datasets for applications in agriculture and weather forecasting. The composition of statewide mesonets varies substantially from state to state. For example, the NYS mesonet contains 181 observing platforms, including 126 standard sites (collecting meteorological data), and several sub-networks, focused on snow water equivalent, flux measurements, and atmospheric profiles. This mesonet was initially founded following the series of weather-related natural disasters that exposed the lack of intensive spatial data collection necessary for accurate meteorological modeling [86].
In addition to national, regional, and statewide data collection networks, there exist many independently operated field stations that collect valuable data, which may or may not be available to unaffiliated researchers or other interested parties. While the data products available at these stations may be focused on the research or outreach goals of the specific station, there remains a vast quantity of data that could be useful, if researchers and land managers are aware of their availability. To help address this issue, we’ve cataloged stations across the northeastern United States to identify potentially useful data products.
The northeastern United States was defined as the range covered by the USDA Forest Service Northeast Climate Hub (Maine, New Hampshire, Vermont, New York, Massachusetts, Connecticut, Rhode Island, New Jersey, Pennsylvania, Maryland, West Virginia, and Delaware). Field stations were identified by searching the databases of USDA, USGS, NOAA, NEON, LTER, LTAR, AmeriFlux, and GLEON, as well as the Organization of Biological Field Stations and statewide mesonets (i.e., the Delaware Environmental Observing System). Of the 276 field stations catalogued in this search, 42 were operated by either a 501(c)(3) non-profit or academic institution, independent of any broader network of field stations. The remainder were associated with a statewide mesonet or larger national network (i.e., NEON).
Each field station included in the database collected some type of biotic or abiotic data, ranging from tree inventories and mammal surveys to complete meteorological stations with soil moisture data. Of the 276 field stations surveyed, 94 stations collected only abiotic data (i.e., meteorological data), 25 collected only biotic data (i.e., tree inventories), and 157 collected some form of both abiotic and biotic data. The availability of the data at the stations surveyed varied, with 236 stations offering real time and historic data for download, 12 offering only historic data for download, five offering only real time data for download, and 23 without open access to data. Of the stations without access to data, 21 were independently operated.
To allow for end users to better access this data, we created an open access geo-package which allows for queries of station locations and accessible datasets. The geopackage format is an open-source SQLite database format with spatial integration [87]. The database, including associated metadata and tutorials for viewing and querying the database in QGIS is available at github.com/petermanos/field_validation_data. In the database, field stations are organized such that users can query based on location, type of data collected, or timeframe of data collected (real-time or historical) using structured query language (SQL). The purpose of the database is to connect users to places where the data they require is collected. This database does not provide the data collected by these field stations, rather links to the field station or network sites where data can be downloaded.
4. Discussion
GEE is significantly advancing the field by allowing researchers, scientists, and developers to efficiently extract valuable insights from extensive RS datasets, mitigating the challenges associated with traditional data analysis methods [88]. It is also freely accessible. Despite these advantages, there are limitations, such as a maximum storage capacity of 250 GB per user and restricted memory for training ML algorithms, which can constrain users' ability to fully leverage the platform. Nevertheless, GEE represents a groundbreaking approach to processing geospatial data and addressing various big data challenges in RS. The growing publication trends related to GEE suggest its increasing popularity not only among RS researchers but also among natural resource managers [88].
ERDAS IMAGINE and ENVI are leading software systems for professional image processing in RS, each with its own strengths and weaknesses. While both systems offer similar functions, they complement each other effectively. ERDAS IMAGINE is particularly strong in geometry processing tasks, such as geometric correction, clipping, and mosaicking. In contrast, ENVI excels in classification and spectral processing tasks [89]. For optimal use, ERDAS IMAGINE should be employed for geometry processing, and ENVI should be utilized for spectral analysis. Additionally, ENVI's quick mapping tool makes it more efficient than ERDAS IMAGINE. However, ERDAS IMAGINE requires manual insertion of annotations, which can be more time-consuming compared to ENVI. The ENVI works better with hyperspectral and multispectral image analysis, however ERDAS IMAGINE works better for radar, LIDAR data and 3D models [89]. Due to its unique advantages and drawbacks, the workflow for thematic mapping in ENVI differs somewhat from the general design flow chart. For instance, in image fusion, Principal Components Analysis (PCA) is used to generate three components as RGB values for SPOT image fusion. Unlike ERDAS IMAGINE, where stacking techniques are commonly used for map display, PCA in ENVI also serves a classification function. This distinction influences how mosaic-based pixel mapping, and other methodologies are employed in thematic mapping processes [89].
ENVI's display window includes a subject image window, a zoom window, and a scroll window, all of which can be resized, which can aid in the search for cognominal points. However, once selected, these cognominal points are not easily adjustable. Beginners often find it necessary to delete and reselect them to achieve an RMS error of less than 1 pixel, making the process time-consuming.
On the other hand, ERDAS IMAGINE excels in certain aspects, such as its capability to automatically update the RMS error after adding a pair of corresponding points. This feature makes it easier for users to adjust the point positions promptly based on the RMS error changes, thus enabling beginners to more accurately identify corresponding points [90]. In geometry correction, ERDAS IMAGINE often proves more efficient than ENVI due to its broader range of features and simpler interface [89]. While ENVI excels in visualization, which can be valuable for ERDAS IMAGINE users, ERDAS IMAGINE offers greater diversity in its tools. For example, in mosaic creation, ERDAS IMAGINE provides options for geographic reference-based mosaicking, direct mosaicking, and automatic edge detection using various algorithms or user-drawn lines. This flexibility offers users more choices [89]. Conversely, ENVI's mosaic capabilities are limited to pixel-based and geographic reference-based methods, lacking automatic edge detection algorithms, which can be challenging for beginners when dealing with images where edges are not clearly defined. In clipping tasks, ERDAS IMAGINE provides various tools like the Require Box and area of interest tools, whereas ENVI offers fewer options. For image fusion, ERDAS IMAGINE allows the direct merging of images with different sizes and geographic references, while ENVI requires resolution adjustment of one image to match the other before applying the fusion algorithm [91]. Global Mapper excels in 3D visualization, while eCognition is better suited for object-based image analysis. Selecting the appropriate software based on these strengths can optimize workflow and enhance results. In-situ validation data has been critical to the development of effective remotely sensed data products, and with the recent expansion of AI applications in the RS field, the importance on in-site validation will continue to grow. Our hope is that the GIS database developed in this manuscript will provide researchers, land use managers, and other interested end-users with ready access to the necessary data sets to expand the role of Smart Technology in their respective fields. Though our database is somewhat limited in geographic range and functionality, it should serve as a baseline for future growth of similar systems to provide wider access.
5. Conclusions
The increasing human population places significant pressure on natural resources, making effective management crucial. RS and GIS offer powerful tools to monitor and manage these finite resources efficiently. Geospatial information plays a vital role in identifying and analyzing factors that impact resource utilization, enabling informed decisions for sustainable management that benefits both current and future generations. Integrating image data with in-situ validation is essential for enhancing the accuracy and reliability of RS models. The establishment of a Ground Truthing Database facilitates the creation of a comprehensive network of free, accessible data that connects ground observations with advanced analytical platforms.
Our study highlights that GEE has advanced significantly due to its extensive geographic coverage, easy access to satellite imagery, multi-spectral capabilities, user-friendly interface, and no cost. ENVI is effective for smaller geographic areas and hyperspectral imagery, offering a cost-effective alternative to ERDAS IMAGINE, which is specialized in radar, LIDAR, and photogrammetric data processing. ENVI’s lower cost and ease of use make it suitable for users with minimal coding experience, whereas ERDAS IMAGINE is better suited for complex analyses requiring specialized skills. Global Mapper is increasingly used for analyzing UAV images and creating 3D models, while eCognition excels in object-based image analysis. The growing adoption of GEE in recent studies underscores its effectiveness in covering large areas, while advancements in UAV technology and 3D modeling have driven the increased use of Global Mapper. The integration of in-situ validation with these tools is crucial for improving the precision of applications, ensuring that the data used for resource management is both accurate and actionable.
Acknowledgments
Extension, Education and USDA Climate program, project award 2023-67022-39531, from the U.S. Department of Agriculture’s National Institute of Food and Agriculture. USDA Northeast Climate Hub.
References
- Lin, C.; Kai, Z.; Xin, S.; Xiaoming, Y.; Fuliang, C.; Guibin, W. The Status and Prospects of Smart Forestry. Journal of Nanjing Forestry University 2022, 46.
- Zou, W.; Jing, W.; Chen, G.; Lu, Y.; Song, H. A Survey of Big Data Analytics for Smart Forestry. IEEE Access 2019, 7, 46621–46636. [CrossRef]
- Torresan, C.; Garzón, M.B.; O’grady, M.; Robson, T.M.; Picchi, G.; Panzacchi, P.; Tomelleri, E.; Smith, M.; Marshall, J.; Wingate, L.; et al. A New Generation of Sensors and Monitoring Tools to Support Climate-Smart Forestry Practices. Canadian Journal of Forest Research 2021, 51, 1751–1765.
- Verkerk, P.J.; Costanza, R.; Hetemäki, L.; Kubiszewski, I.; Leskinen, P.; Nabuurs, G.J.; Potočnik, J.; Palahí, M. Climate-Smart Forestry: The Missing Link. For Policy Econ 2020, 115.
- Fischer, G. Seeding, Evolutionary Growth and Reseeding: Constructing, Capturing and Evolving Knowledge in Domain-Oriented Design Environments; 1998; Vol. 5;
- Huang, X. High Resolution Remote Sensing Image Classification Based on Deep Transfer Learning and Multi Feature Network. IEEE Access 2023, 11, 110075–110085. [CrossRef]
- Karimi, S.M.; Mirzaei, M.; Dehghani, A.; Galavi, H.; Huang, Y.F. Hybrids of Machine Learning Techniques and Wavelet Regression for Estimation of Daily Solar Radiation. Stochastic Environmental Research and Risk Assessment 2022, 36, 4255–4269.
- Mirzaei, M.; Yu, H.; Dehghani, A.; Galavi, H.; Shokri Kuchak, V.; Mohsenzadeh Karimi, S.; Sookhak, M. A Novel Stacked Long Short-Term Memory Approach of Deep Learning for Streamflow Simulation. Sustainability 2021, 13, 13384. [CrossRef]
- Sheikh, H.; Prins, C.; Schrijvers, E. Mission AI Research for Policy; 2023;
- Schulz, K.; Hänsch, R.; Sörgel, U. Machine Learning Methods for Remote Sensing Applications: An Overview. In Proceedings of the Remote Sensing; 2018.
- De’Ath, G.; Fabricius, K. Classification and Regression Trees: A Powerful yet Simple Technique for Ecological Data Analysis. Ecology 2002, 8, 3178–3192.
- Maimaitijiang, M.; Sagan, V.; Sidike, P.; Hartling, S.; Esposito, F.; Fritschi, F.B. Soybean Yield Prediction from UAV Using Multimodal Data Fusion and Deep Learning. Remote Sens Environ 2020, 237, 111599. [CrossRef]
- Fu, Z.; Jiang, J.; Gao, Y.; Krienke, B.; Wang, M.; Zhong, K.; Cao, Q.; Tian, Y.; Zhu, Y.; Cao, W.; et al. Wheat Growth Monitoring and Yield Estimation Based on Multi-Rotor Unmanned Aerial Vehicle. Remote Sens (Basel) 2020, 12. [CrossRef]
- Shen, W.; Mao, X.; He, J.; Dong, J.; Huang, C.; Li, M. Understanding Current and Future Fragmentation Dynamics of Urban Forest Cover in the Nanjing Laoshan Region of Jiangsu, China. Remote Sens (Basel) 2020, 12. [CrossRef]
- Jelas, I.; Zulkifley, M.A.; Abdullah, M. Automated Ground Truth Annotation for Forest and Non-Forest Classification in Satellite Remote Sensing Images. 2023 4th International Conference on Artificial Intelligence and Data Sciences (AiDAS) 2023, 331–336.
- Wang, M.; Wander, M.M.; Mueller, S.; Martin, N.; Dunn, J.B. Evaluation of Survey and Remote Sensing Data Products Used to Estimate Land Use Change in the United States: Evolving Issues and Emerging Opportunities. Environ Sci Policy 2022.
- Lark, T.J.; Salmon, J.M.; Gibbs, H.K. Cropland Expansion Outpaces Agricultural and Biofuel Policies in the United States. Environmental Research Letters 2015, 10.
- Gao, B.; Yu, L.; Ren, L.; Zhan, Z.; Luo, Y. Early Detection of Dendroctonus Valens Infestation with Machine Learning Algorithms Based on Hyperspectral Reflectance. Remote Sens (Basel) 2022, 14. [CrossRef]
- USDA National Agricultural Statistics Service: Charts and Maps [WWW Document] .
- Zhang, F.; Wegner, J.D.; Yang, B.; Liu, Y. Street-Level Imagery Analytics and Applications. ISPRS Journal of Photogrammetry and Remote Sensing 2023, 199, 195–196. [CrossRef]
- Yan, Y.; Ryu, Y. Exploring Google Street View with Deep Learning for Crop Type Mapping. ISPRS Journal of Photogrammetry and Remote Sensing 2021, 171, 278–296. [CrossRef]
- Xu, G.; Zhu, X.; Fu, D.; Dong, J.; Xiao, X. Automatic Land Cover Classification of Geo-Tagged Field Photos by Deep Learning. Environmental Modelling & Software 2017, 91, 127–134. [CrossRef]
- Gorelick, N.; Hancher, M.; Dixon, M.; Ilyushchenko, S.; Thau, D.; Moore, R. Google Earth Engine: Planetary-Scale Geospatial Analysis for Everyone. Remote Sens Environ 2017, 202, 18–27. [CrossRef]
- Kumar, L.; Mutanga, O. Google Earth Engine Applications since Inception: Usage, Trends, and Potential. Remote Sens (Basel) 2018, 10. [CrossRef]
- Padarian, J.; Minasny, B.; McBratney, A.B. Using Google’s Cloud-Based Platform for Digital Soil Mapping. Comput Geosci 2015, 83, 80–88. [CrossRef]
- Xulu, S.; Peerbhay, K.Y.; Gebreslasie, M.T.; Ismail, R. Drought Influence on Forest Plantations in Zululand, South Africa, Using MODIS Time Series and Climate Data. Forests 2018.
- Mbatha, N.; Xulu, S. Time Series Analysis of MODIS-Derived NDVI for the Hluhluwe-Imfolozi Park, South Africa: Impact of Recent Intense Drought. Climate 2018, 6. [CrossRef]
- Vos, K.; Splinter, K.D.; Harley, M.D.; Simmons, J.A.; Turner, I.L. CoastSat: A Google Earth Engine-Enabled Python Toolkit to Extract Shorelines from Publicly Available Satellite Imagery. Environmental Modelling and Software 2019, 122. [CrossRef]
- Stromann, O.; Nascetti, A.; Yousif, O.; Ban, Y. Dimensionality Reduction and Feature Selection for Object-Based Land Cover Classification Based on Sentinel-1 and Sentinel-2 Time Series Using Google Earth Engine. Remote Sens (Basel) 2020, 12. [CrossRef]
- Aybar, C.; Wu, Q.; Bautista, L.; Yali, R.; Barja, A. Rgee: An R Package for Interacting with Google Earth Engine. J Open Source Softw 2020, 5, 2272. [CrossRef]
- Crego, R.D.; Masolele, M.M.; Connette, G.; Stabach, J.A. Enhancing Animal Movement Analyses: Spatiotemporal Matching of Animal Positions with Remotely Sensed Data Using Google Earth Engine and r. Remote Sens (Basel) 2021, 13. [CrossRef]
- Li, H.; Wan, W.; Fang, Y.; Zhu, S.; Chen, X.; Liu, B.; Hong, Y. A Google Earth Engine-Enabled Software for Efficiently Generating High-Quality User-Ready Landsat Mosaic Images. Environmental Modelling and Software 2019, 112, 16–22.
- Panidi, E.; Rykin, I.; Kikin, P.; Kolesnikov, A. Cloud-Desktop Remote Sensing Data Management to Ensure Time Series Analysis, Integration of QGIS and Google Earth Engine. In Proceedings of the International Archives of the Photogrammetry, Remote Sensing and Spatial Information Sciences - ISPRS Archives; International Society for Photogrammetry and Remote Sensing, August 6 2020; Vol. 43, pp. 553–557.
- He, M.; Kimball, J.S.; Maneta, M.P.; Maxwell, B.D.; Moreno, A.; Beguería, S.; Wu, X. Regional Crop Gross Primary Productivity and Yield Estimation Using Fused Landsat-MODIS Data. Remote Sens (Basel) 2018, 10. [CrossRef]
- Tsai, Y.H.; Stow, D.; Chen, H.L.; Lewison, R.; An, L.; Shi, L. Mapping Vegetation and Land Use Types in Fanjingshan National Nature Reserve Using Google Earth Engine. Remote Sens (Basel) 2018, 10. [CrossRef]
- Parente, L.; Ferreira, L. Assessing the Spatial and Occupation Dynamics of the Brazilian Pasturelands Based on the Automated Classification of MODIS Images from 2000 to 2016. Remote Sens (Basel) 2018, 10. [CrossRef]
- Diniz, C.; Cortinhas, L.; Nerino, G.; Rodrigues, J.; Sadeck, L.; Adami, M.; Souza-Filho, P.W.M. Brazilian Mangrove Status: Three Decades of Satellite Data Analysis. Remote Sens (Basel) 2019, 11. [CrossRef]
- Souza, C.M.; Shimbo, J.Z.; Rosa, M.R.; Parente, L.L.; Alencar, A.A.; Rudorff, B.F.T.; Hasenack, H.; Matsumoto, M.; Ferreira, L.G.; Souza-Filho, P.W.M.; et al. Reconstructing Three Decades of Land Use and Land Cover Changes in Brazilian Biomes with Landsat Archive and Earth Engine. Remote Sens (Basel) 2020, 12. [CrossRef]
- Velastegui-Montoya, A.; Rivera-Torres, H.; Herrera-Matamoros, V.; Sadeck, L.; Quevedo, R.P. Application of Google Earth Engine for Land Cover Classification in Yasuni National Park, Ecuador. In Proceedings of the International Geoscience and Remote Sensing Symposium (IGARSS); Institute of Electrical and Electronics Engineers Inc., 2022; Vol. 2022-July, pp. 6376–6379.
- Parks, S.A.; Holsinger, L.M.; Voss, M.A.; Loehman, R.A.; Robinson, N.P. Mean Composite Fire Severity Metrics Computed with Google Earth Engine Offer Improved Accuracy and Expanded Mapping Potential. Remote Sens (Basel) 2018, 10.
- Mutanga, O.; Kumar, L. Google Earth Engine Applications. Remote Sens (Basel) 2019, 11.
- Wang, C.; Zhao, Q.; Ma, Y.; Ren, Y. UAV Remote Sensing Crop Classification Based on Convolutional Neural Network. Trans. Chin. . Trans. Chin. Soc. Agric. Mach 2019, 50.
- Fahimnia, B.; Sarkis, J.; Davarzani, H. Green Supply Chain Management: A Review and Bibliometric Analysis. Int J Prod Econ 2015, 162, 101–114. [CrossRef]
- Ermida, S.L.; Soares, P.; Mantas, V.; Göttsche, F.M.; Trigo, I.F. Google Earth Engine Open-Source Code for Land Surface Temperature Estimation from the Landsat Series. Remote Sens (Basel) 2020, 12. [CrossRef]
- Sharma, S.; Khanal, P. Forest Fire Prediction: A Spatial Machine Learning and Neural Network Approach. Fire 2024, 7. [CrossRef]
- Traganos, D.; Poursanidis, D.; Aggarwal, B.; Chrysoulakis, N.; Reinartz, P. Estimating Satellite-Derived Bathymetry (SDB) with the Google Earth Engine and Sentinel-2. Remote Sens (Basel) 2018, 10. [CrossRef]
- Souza, C.M.; Kirchhoff, F.T.; Oliveira, B.C.; Ribeiro, J.G.; Sales, M.H. Long-Term Annual Surface Water Change in the Brazilian Amazon Biome: Potential Links with Deforestation, Infrastructure Development and Climate Change. Water (Switzerland) 2019, 11. [CrossRef]
- Mncube, Z.; Xulu, S. Progress of Nighttime Light Applications within the Google Earth Engine Cloud Platform. Geocarto Int 2023, 38, 1–22.
- Tamiminia, H.; Salehi, B.; Mahdianpari, M.; Quackenbush, L.; Adeli, S.; Brisco, B. Google Earth Engine for Geo-Big Data Applications: A Meta-Analysis and Systematic Review. ISPRS Journal of Photogrammetry and Remote Sensing 2020, 164, 152–170. [CrossRef]
- Zhao, Q.; Yu, L.; Li, X.; Peng, D.; Zhang, Y.; Gong, P. Progress and Trends in the Application of Google Earth and Google Earth Engine. Remote Sens (Basel) 2021, 13.
- Wolfe, J.D.; Black, S.R. Hyperspectral Analytics in ENVI: Target Detection and Spectral Mapping Methods.
- Zhao, J.; Liu, J.; Chen, Q.; Vittayapadung, S. Detecting Subtle Bruises on Fruits with Hyperspectral Imaging. Nongye Jixie Xuebao/Transactions of the Chinese Society of Agricultural Machinery 2008, 39, 106–109.
- Guo, E.; Liu, M.; Zhao, J.; Chen, Q. Nondestructive Detection of Sugar Content on Navel Orange with Hyperspectral Imaging. 2008, 39, 91-93+103.
- Xue, L.; Li, J.; Liu, M. Detecting Pesticide Residue on Navel Orange Surface by Using Hyperspectral Imaging. Guangxue Xuebao/Acta Optica Sinica 2008, 28, 2277–2280. [CrossRef]
- Kim, M.S.; Lefcourt, A.M.; Chen, Y.-R. Ns-Scale Time-Resolved Laser Induced Fluorescence Imaging for Detection of Fecal Contamination on Apples. In Proceedings of the Nondestructive Sensing for Food Safety, Quality, and Natural Resources; SPIE, November 19 2004; Vol. 5587, p. 190.
- Kim, M.S.; Lefcourt, A.M.; Chen, Y.-R.; Tao, Y. Automated Detection of Fecal Contamination of Apples Based on Multispectral Fluorescence Image Fusion. J Food Eng 2005, 71, 85–91.
- Vargas, A.; Kim, M.; Tao, Y.; Lefcourt, A.; Chen, Y.-R. Safety Inspection of Cantaloupes and Strawberries Using Multispectral Fluorescence Imaging Techniques. In Proceedings of the ASAE Annual International Meeting 2004; January 2004.
- Lee, K.; Kang, S.; Kim, M.; Noh, S.-H. Hyperspectral Imaging for Detecting Defect on Apples.; January 2005.
- Xing, J.; Ngadi, M.O.; Wang, N.; Baerdemaeker, J. De Wavelength Selection for Surface Defects Detection on Tomatoes by Means of a Hyperspectral Imaging System.; 2006.
- Ali, A. Lab Introduction to ERDAS IMAGINE Software 2017.
- Hexagon Geospatial ERDAS IMAGINE Product Overview Available online: https://www.hexagongeospatial.com/products/producer-suite/erdas-imagine (accessed on 21 May 2024).
- Schoepfer, E.; Kranz, O. Monitoring Natural Resources in Conflict Using an Object-Based Multiscale Image Analysis Approach. Environmental Science, Geography 2010.
- Long, W.; Srihar, S. Land Cover Classification of SSC Image: Unsupervised and Supervised Classification Using ERDAS Imagine; 2004;
- Eroǧlu, H.; Çakir, G.; Sivrikaya, F.; Akay, A.E. Using High Resolution Images and Elevation Data in Classifying Erosion Risks of Bare Soil Areas in the Hatila Valley Natural Protected Area, Turkey. Stochastic Environmental Research and Risk Assessment 2010, 24, 699–704. [CrossRef]
- Global Mapper Global Mapper - GIS Software.
- Cunningham, P. Where Is Geospatial Technology Headed in 2024?
- Barker, A. Global Mapper LiDAR Module V.19 Now Available with Photogrammetric Point Cloud Generation. Geomatica 2017, 71, 221+.
- Blaschke, T. Object Based Image Analysis for Remote Sensing. ISPRS Journal of Photogrammetry and Remote Sensing 2010, 65, 2–16. [CrossRef]
- Staengel, M. From the Ground Up - Accuracy Assessment.
- Marrs, J.; Ni-Meister, W. Machine Learning Techniques for Tree Species Classification Using Co-Registered LiDAR and Hyperspectral Data. Remote Sens (Basel) 2019, 11. [CrossRef]
- Ocón, J.P.; Stavros, E.N.; Steinberg, S.J.; Robertson, J.; Gillespie, T.W. Remote Sensing Approaches to Identify Trees to Species-Level in the Urban Forest: A Review. Progress in Physical Geography: Earth and Environment 2024, 48, 438–453.
- Nguyen, T.D.; Kappas, M. Estimating the Aboveground Biomass of an Evergreen Broadleaf Forest in Xuan Lien Nature Reserve, Thanh Hoa, Vietnam, Using SPOT-6 Data and the Random Forest Algorithm. International Journal of Forestry Research 2020, 2020. [CrossRef]
- Graham, J.; Gottwald, T.; Setamou, M. Status of Huanglongbing (HLB) Outbreaks in Florida, California and Texas. Trop Plant Pathol 2020, 45, 265–278. [CrossRef]
- Deng, X.; Zhu, Z.; Yang, J.; Zheng, Z.; Huang, Z.; Yin, X.; Wei, S.; Lan, Y. Detection of Citrus Huanglongbing Based on Multi-Input Neural Network Model of UAV Hyperspectral Remote Sensing. Remote Sens (Basel) 2020, 12. [CrossRef]
- McPherson, E.G.; Xiao, Q.; van Doorn, N.S.; de Goede, J.; Bjorkman, J.; Hollander, A.; Boynton, R.M.; Quinn, J.F.; Thorne, J.H. The Structure, Function and Value of Urban Forests in California Communities. Urban For Urban Green 2017, 28, 43–53. [CrossRef]
- Konarska, J.; Uddling, J.; Holmer, B.; Lutz, M.; Lindberg, F.; Pleijel, H.; Thorsson, S. Transpiration of Urban Trees and Its Cooling Effect in a High Latitude City. Int J Biometeorol 2016, 60, 159—172. [CrossRef]
- Lai, P.; Jim, C.Y.; Zhang, H. Heritage Trees in Macau: Relationships Among Biomass Structure, Age, and Ecosystem Services. Arboric Urban For 2020, 46, 109–134. [CrossRef]
- Ponce-Donoso, M.; Vallejos-Barra, Ó.; Ingram, B.; Daniluk-Mosquera, G. Urban Trees and Environmental Variables: Relationships in a City of Central Chile. Arboric Urban For 2020, 46, 84–95.
- de Carvalho Maria, T.R.B.; Biondi, D.; Behling, A.; dos Reis, A.R.N.; Zamproni, K.; Ho, T.L. Application of Artificial Intelligence for Tree Risk Assessment Optimization in Itanhaém – São Paulo, Brazil. Urban For Urban Green 2023, 81, 127844. [CrossRef]
- Wang, J.; Zhou, W.; Jiao, M. Location Matters: Planting Urban Trees in the Right Places Improves Cooling. Front Ecol Environ 2022, 20, 147–151. [CrossRef]
- Knapp, A.K.; Smith, M.D.; Hobbie, S.E.; Collins, S.L.; Fahey, T.J.; Hansen, G.J.A.; Landis, D.A.; Pierre, K.J. La; Melillo, J.M.; Seastedt, T.; et al. Past, Present, and Future Roles of Long-Term Experiments in the LTER Network.; 2012.
- Keller, M.; Schimel, D.S.; Hargrove, W.W.; Hoffman, F.M. A Continental Strategy for the National Ecological Observatory Network. Front Ecol Environ 2008, 6, 282–284.
- Musinsky, J.; Goulden, T.; Wirth, G.; Leisso, N.P.; Krause, K.; Haynes, M.; Chapman, C. Spanning Scales: The Airborne Spatial and Temporal Sampling Design of the National Ecological Observatory Network. Methods Ecol Evol 2022, 13, 1866–1884.
- Foster, D.; Aber, D.; Melillo JM; Bowden, R.; Bazzaz, F. Forest Response to Disturbance and Anthropogenic Stress. Bioscience 1997, 47, 437–445.
- Smith, M.D.; Knapp, A.K.; Collins, S.L. A Framework for Assessing Ecosystem Dynamics in Response to Chronic Resource Alterations Induced by Global Change. Ecology 2009, 90 12, 3279–3289.
- Lazo, J.; Lawson, M.; Larsen, P.; Waldman, D. U.S. Economic Sensitivity to Weather Variability. Bull Am Meteorol Soc 2011, 92, 709–720. [CrossRef]
- Open Geospatial Consortium GeoPackage Encoding Standard.
- Amani, M.; Ghorbanian, A.; Ahmadi, S.A.; Kakooei, M.; Moghimi, A.; Mirmazloumi, S.M.; Moghaddam, S.H.A.; Mahdavi, S.; Ghahremanloo, M.; Parsian, S.; et al. Google Earth Engine Cloud Computing Platform for Remote Sensing Big Data Applications: A Comprehensive Review. IEEE J Sel Top Appl Earth Obs Remote Sens 2020, 13, 5326–5350. [CrossRef]
- Di, D.; Di, W. Comparisons of ERDAS and ENVI in Thematic Mapping. In Proceedings of the 2011 IEEE 3rd International Conference on Communication Software and Networks; May 2011; pp. 517–520.
- An-rong, D.; Xiao-dong, W. ERDAS IMAGINE Remote Sensing Image Processing Method,Beijing. Tsinghua university Press 2003.
- Ehlers, M. Multi-Sensor Image Fusion Techniques in Remote Sensing. ISPRS J. Photogrammetry and Remote Sensing 1991, 46.
Figure 1.
Articles published using different image analysis tools in different time intervals.
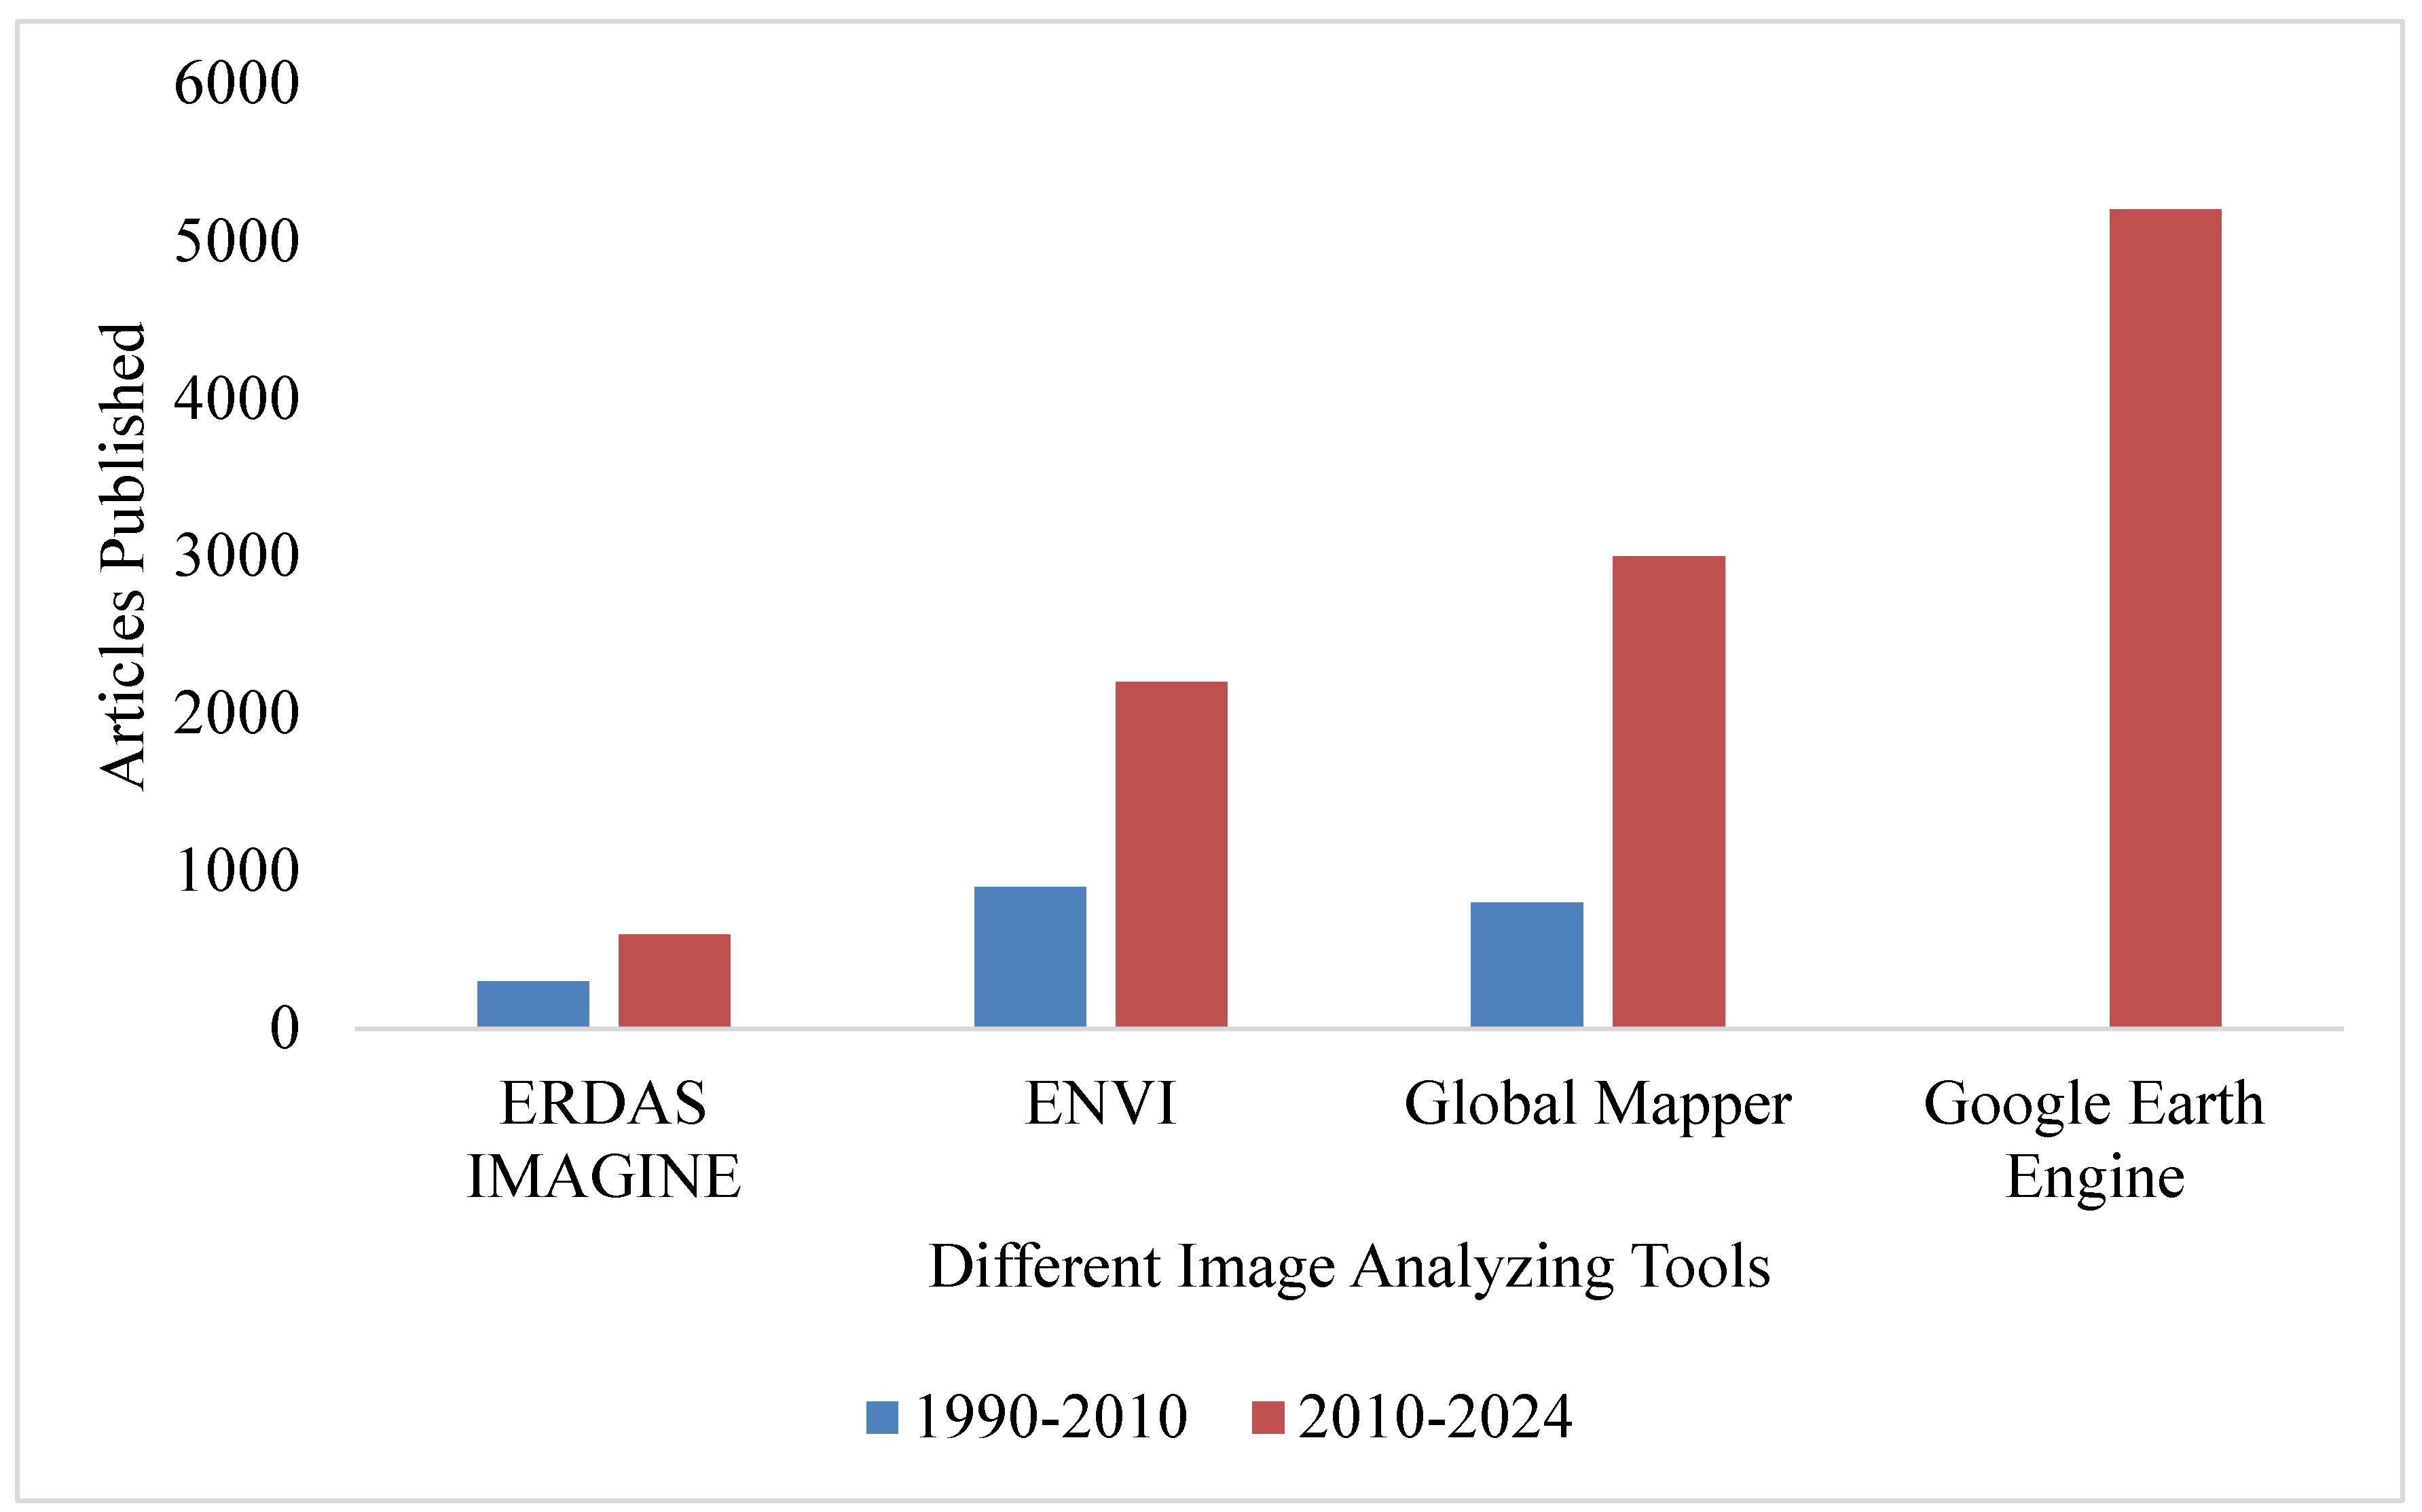

Table 1.
The overview of different tools for image analysis.
| Tool | Overview | Key Features | Applications |
|---|---|---|---|
| GEE | Cloud-based platform for planetary-scale environmental analysis | Access to petabytes of satellite imagery, powerful API, cloud computing, time-series analysis | Environmental monitoring, climate research, disaster response, land cover change detection |
| ENVI | Comprehensive image processing and analysis software for RS data | Advanced image processing tools, spectral analysis, integration with GIS, support for multispectral and hyperspectral data. | RS, environmental monitoring, defense and intelligence, urban planning |
| ERDAS IMAGINE | Geospatial data authoring system for preparing, displaying, and analyzing raster data. | Image classification, radar processing, photogrammetry, 3D modeling, terrain analysis | RS, geospatial analysis, environmental management, defense, and agriculture |
| Global Mapper | GIS application providing access to a wide range of spatial datasets with processing and visualization tools. | Support for many file formats, terrain analysis, 3D visualization, user-friendly interface | GIS data management, terrain analysis, environmental modeling, civil engineering |
| eCognition | Software platform for object-based image analysis (OBIA), enabling advance classification and feature extraction | Rule-based image segmentation and classification, multiresolution segmentation, customizable workflows | Forestry, agriculture, urban planning, environmental modeling, disaster management |
Disclaimer/Publisher’s Note: The statements, opinions and data contained in all publications are solely those of the individual author(s) and contributor(s) and not of MDPI and/or the editor(s). MDPI and/or the editor(s) disclaim responsibility for any injury to people or property resulting from any ideas, methods, instructions or products referred to in the content. |
© 2024 by the authors. Licensee MDPI, Basel, Switzerland. This article is an open access article distributed under the terms and conditions of the Creative Commons Attribution (CC BY) license (http://creativecommons.org/licenses/by/4.0/).
Copyright: This open access article is published under a Creative Commons CC BY 4.0 license, which permit the free download, distribution, and reuse, provided that the author and preprint are cited in any reuse.


